Public Sector Performance and
Efficiency:
The Status of Small Island States
Alexandra Pizzuto and Jean Paul Fabri
Prepared for the Conference:“Small States and Resilience Building”
Malta, 23-25 April 2007

‘that government is best which governs least’
Thomas Pain

Does size matter ?
0
10
20
30
40
50
60
70
0 10000 20000 30000 40000 50000
GDP per capita in USD PPP, 2004
Pu
blic
Exp
end
itu
re (
% G
DP
)

Overview
Broader reflections on role and size of government
Public sector performance and efficiency matter
Sustainability of public finances Relevant for economic
performance

Measuring performance and efficiency
Steps involved in the construction of indices:– Identifying appropriate objectives– Identifying outcomes of public sector
activities that proxy these objectives– Setting these outcomes in relation to
the costs

Core objectives of government Classical school:
basic public goods with limited scope Keynesian school:
enthusiasm for state intervention Musgravian objectives:
allocation, stabilisation, redistribution
Public choice school: criticised big government
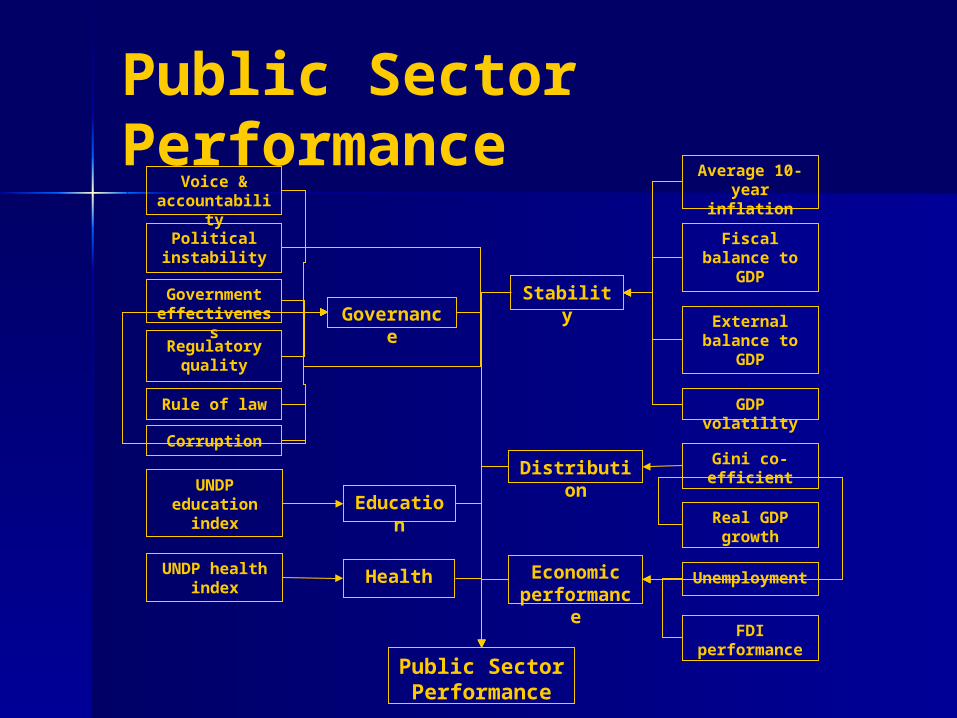
Public Sector Performance
Governance
Voice & accountability
Political instability
Government effectiveness
Regulatory quality
Rule of law
Corruption
EducationUNDP
education index
HealthUNDP health index
Stability
Average 10-year inflation
Fiscal balance to GDP
External balance to
GDP
GDP volatility
Distribution Gini co-efficient
Economic performance
Real GDP growth
FDI performance
Public Sector Performance
Unemployment

PSP: Results
Rank Country PSP Index Rank Country PSP Index1 ICELAND 1.34 27 SINGAPORE 1.162 SWEDEN 1.32 42 TRINIDAD AND TOBAGO 1.023 DENMARK 1.30 44 MAURITIUS 1.014 BELGIUM 1.30 47 BELIZE 1.005 FINLAND 1.30 52 JAMAICA 0.956 LUXEMBOURG 1.29 70 DOMINICAN REPUBLIC 0.807 NORWAY 1.29 80 NEPAL 0.658 JAPAN 1.28 81 KENYA 0.639 NETHERLANDS 1.26 82 PAPUA NEW GUINEA 0.5910 SWITZERLAND 1.26 83 SENEGAL 0.5819 BARBADOS 1.19 84 CAMEROON 0.5622 CYPRUS 1.18 85 NIGERIA 0.5623 MALTA 1.18 86 COTE D'IVOIRE 0.47

PSP: Analysis
0.00.20.40.60.81.01.2
SIDS
AFRICA
EU-27
ASIA & MIDDLEEAST
EUROPE (EXCL.EU-27)
NORTH ANDCENTRAL AMERICA
OCEANIA
SOUTH AMERICA

PSP: Analysis
0.0
0.2
0.4
0.6
0.8
1.0SIDS
AFRICA
EU-27
ASIA & MIDDLE EAST
EUROPE (EXCL. EU-27)
NORTH AND CENTRALAMERICA
OCEANIA
SOUTH AMERICA
Governance Index Education IndexHealth Index Distribution IndexEconomic Performance Index Stability Index
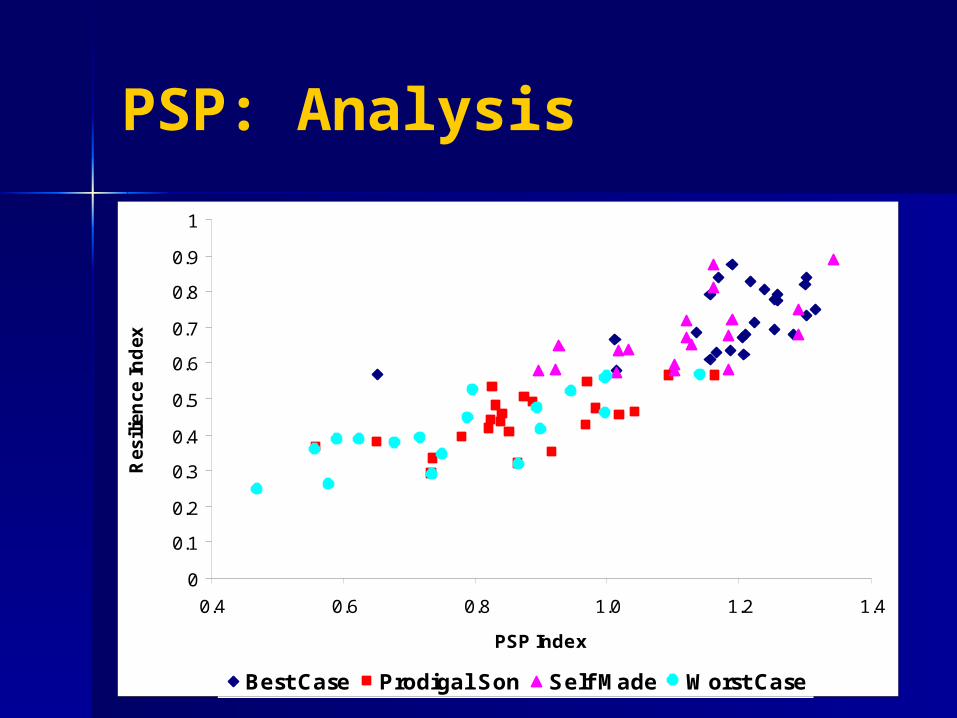
PSP: Analysis
0
0.1
0.2
0.3
0.4
0.5
0.6
0.7
0.8
0.9
1
0.4 0.6 0.8 1.0 1.2 1.4
PSP Index
Res
ilien
ce In
dex
Best Case Prodigal Son Self Made Worst Case

PSP: Analysis
0.0
0.2
0.4
0.6
0.8
1.0Governance Index
Education Index
Health Index
EconomicPerformance Index
Distribution Index
Stability Index
Best Case Prodigal Case Self Made Worst Case

‘efficiency of performance is what wins the game’
Pat Riley

Public Sector Efficiency

PSE: Results
Rank Country PSE Index Rank Country PSE Index1 SINGAPORE 4.87 35 BELIZE 0.842 CANADA 4.66 45 TRINIDAD AND TOBAGO 0.643 COSTA RICA 3.92 59 CYPRUS 0.544 HONG KONG 3.60 66 JAMAICA 0.515 EL SALVADOR 2.74 70 MALTA 0.496 UNITED STATES 2.44 79 PORTUGAL 0.447 INDIA 2.37 80 SLOVAK REPUBLIC 0.428 CHINA 1.92 81 SOUTH AFRICA 0.409 THAILAND 1.92 82 KUWAIT 0.3910 RUSSIA 1.71 83 COLOMBIA 0.3516 BARBADOS 1.21 84 IRAN 0.3218 MAURITIUS 1.19 85 PAPUA NEW GUINEA 0.24
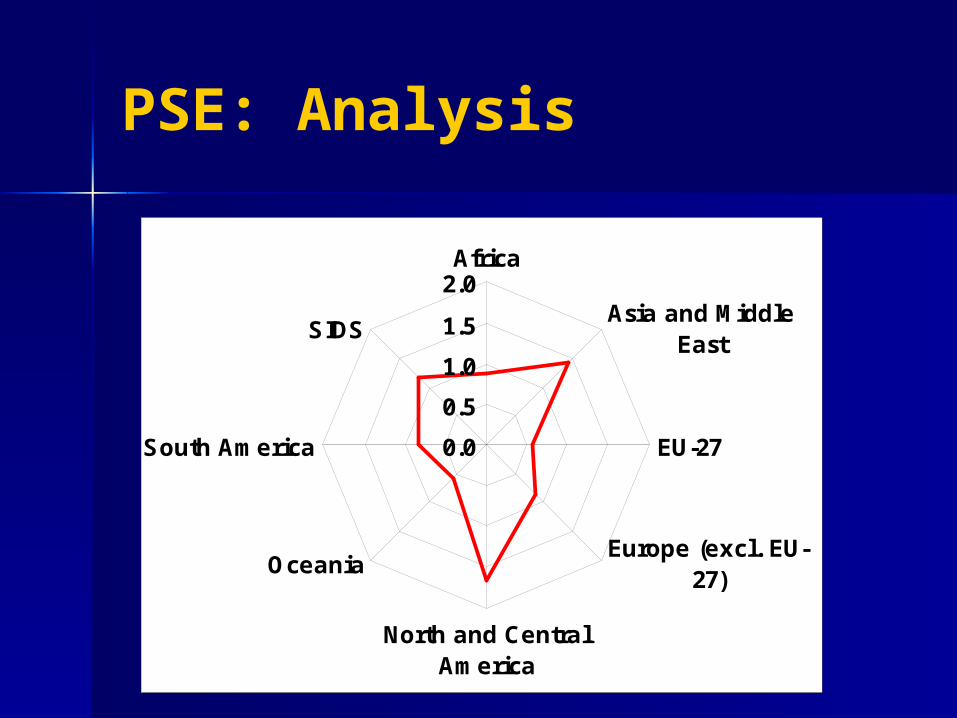
PSE: Analysis
0.0
0.5
1.0
1.5
2.0Africa
Asia and MiddleEast
EU-27
Europe (excl. EU-27)
North and CentralAmerica
Oceania
South America
SIDS

PSE: Analysis
0.0
0.2
0.4
0.6
0.8
1.0
1.2
1.4
1.6
1.8
0.7 0.8 0.9 1.0 1.1 1.2 1.3
PSP Index
PS
E I
nd
ex
Africa Asia and Middle EastEU-27 Europe (excl. EU-27)North and Central America OceaniaSouth America SIDS
Non-Achievers Over-spenders
Efficient Economies
Under-spenders
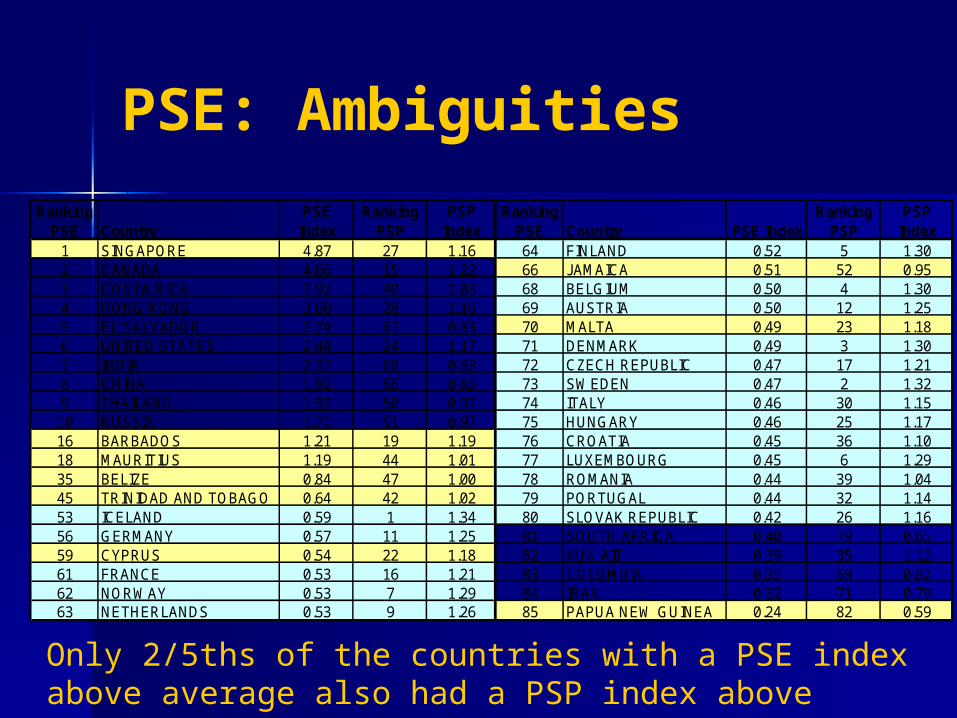
PSE: Ambiguities
1 SINGAPORE 4.87 27 1.16 64 FINLAND 0.52 5 1.302 CANADA 4.66 15 1.22 66 JAMAICA 0.51 52 0.953 COSTA RICA 3.92 40 1.03 68 BELGIUM 0.50 4 1.304 HONG KONG 3.60 28 1.16 69 AUSTRIA 0.50 12 1.255 EL SALVADOR 2.74 67 0.83 70 MALTA 0.49 23 1.186 UNITED STATES 2.44 24 1.17 71 DENMARK 0.49 3 1.307 INDIA 2.37 68 0.83 72 CZECH REPUBLIC 0.47 17 1.218 CHINA 1.92 66 0.83 73 SWEDEN 0.47 2 1.329 THAILAND 1.92 50 0.97 74 ITALY 0.46 30 1.1510 RUSSIA 1.71 51 0.97 75 HUNGARY 0.46 25 1.1716 BARBADOS 1.21 19 1.19 76 CROATIA 0.45 36 1.1018 MAURITIUS 1.19 44 1.01 77 LUXEMBOURG 0.45 6 1.2935 BELIZE 0.84 47 1.00 78 ROMANIA 0.44 39 1.0445 TRINIDAD AND TOBAGO 0.64 42 1.02 79 PORTUGAL 0.44 32 1.1453 ICELAND 0.59 1 1.34 80 SLOVAK REPUBLIC 0.42 26 1.1656 GERMANY 0.57 11 1.25 81 SOUTH AFRICA 0.40 79 0.6559 CYPRUS 0.54 22 1.18 82 KUWAIT 0.39 35 1.1261 FRANCE 0.53 16 1.21 83 COLOMBIA 0.35 69 0.8262 NORWAY 0.53 7 1.29 84 IRAN 0.32 71 0.7963 NETHERLANDS 0.53 9 1.26 85 PAPUA NEW GUINEA 0.24 82 0.59
Ranking PSE Country
PSE Index
Ranking PSP
Ranking PSP
PSP Index
PSP Index
Ranking PSE Country PSE Index
Only 2/5ths of the countries with a PSE index above average also had a PSP index above average.

PSE: Ambiguities
0.0
1.0
2.0
3.0
4.0
5.0
6.0
0 20 40 60 80
EXP % GDP
PS
E

‘efficiency is doing things right,
effectiveness is doing the right thing’
Peter Drucker
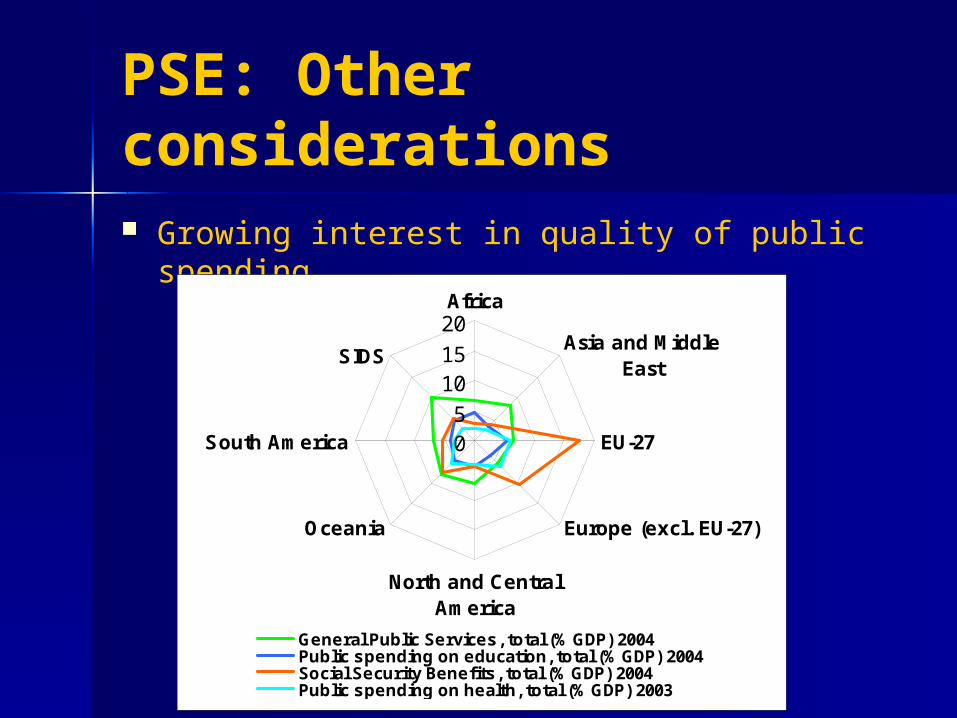
PSE: Other considerations Growing interest in quality of public spending
05
1015
20Africa
Asia and MiddleEast
EU-27
Europe (excl. EU-27)
North and CentralAmerica
Oceania
South America
SIDS
General Public Services, total (% GDP) 2004Public spending on education, total (% GDP) 2004Social Security Benefits, total (% GDP) 2004Public spending on health, total (% GDP) 2003

PSE: Other considerations Fiscal discipline
0
1
2
3
4
5
6
-15 -10 -5 0 5 10 15
DEFICIT % GDP
PS
E

Public Sector Performance Sustainability: An Alternative Index

PSPS: Results
1 NORWAY 2.81 29 CYPRUS 1.152 ICELAND 1.53 33 MALTA 1.103 SWEDEN 1.43 48 MAURITIUS 0.914 DENMARK 1.41 49 BELIZE 0.915 FINLAND 1.38 52 JAMAICA 0.896 NEW ZEALAND 1.34 78 SOUTH AFRICA 0.637 CHILE 1.32 79 PAPUA NEW GUINEA 0.608 BELGIUM 1.31 80 CAMEROON 0.589 AUSTRALIA 1.29 81 KENYA 0.5610 SWITZERLAND 1.28 82 NEPAL 0.5519 TRINIDAD AND TOBAGO 1.19 83 NIGERIA 0.5524 BARBADOS 1.17 84 SENEGAL 0.5325 SINGAPORE 1.17 85 COTE D'IVOIRE 0.46
CountryPSPS IndexRank Country
PSPS Index Rank

PSPS: Results
1 NORWAY 2.81 7 1.29 29 CYPRUS 1.15 22 1.182 ICELAND 1.53 1 1.34 33 MALTA 1.10 23 1.183 SWEDEN 1.43 2 1.32 48 MAURITIUS 0.91 44 1.014 DENMARK 1.41 3 1.30 49 BELIZE 0.91 47 1.005 FINLAND 1.38 5 1.30 52 JAMAICA 0.89 52 0.956 NEW ZEALAND 1.34 20 1.19 78 SOUTH AFRICA 0.63 79 0.657 CHILE 1.32 45 1.01 79 PAPUA NEW GUINEA 0.60 82 0.598 BELGIUM 1.31 4 1.30 80 CAMEROON 0.58 84 0.569 AUSTRALIA 1.29 13 1.24 81 KENYA 0.56 81 0.6310 SWITZERLAND 1.28 10 1.26 82 NEPAL 0.55 80 0.6519 TRINIDAD AND TOBAGO 1.19 42 1.02 83 NIGERIA 0.55 85 0.5624 BARBADOS 1.17 19 1.19 84 SENEGAL 0.53 83 0.5825 SINGAPORE 1.17 27 1.16 85 COTE D'IVOIRE 0.46 86 0.47
Rank CountryPSPS Index
PSP Ranking
PSP Ranking
PSP Index
PSP Index Rank Country
PSPS Index

PSPS: Analysis
0.0
0.5
1.0
1.5Africa
Asia and MiddleEast
EU-27
Europe (excl. EU-27)
North and CentralAmerica
Oceania
South America
SIDS

PSPS: Analysis
0.4
0.6
0.8
1.0
1.2
1.4
1.6
0.7 0.8 0.9 1.0 1.1 1.2 1.3
PSP Index
PS
PS
Africa Asia and Middle EastEU-27 Europe (excl. EU-27)North and Central America OceaniaSouth America SIDS
Unsustainable Performance
Non-Achievers
Sustainable Performance
Under-spenders

PSPS: Analysis
0.0
0.2
0.4
0.6
0.8
1.0
0.0 0.5 1.0 1.5 2.0 2.5 3.0
PSPS
Res
ilie
nce
In
dex
Best Case Prodigal Son Self Made Worst Case

‘small is beautiful’
EF Schumacher
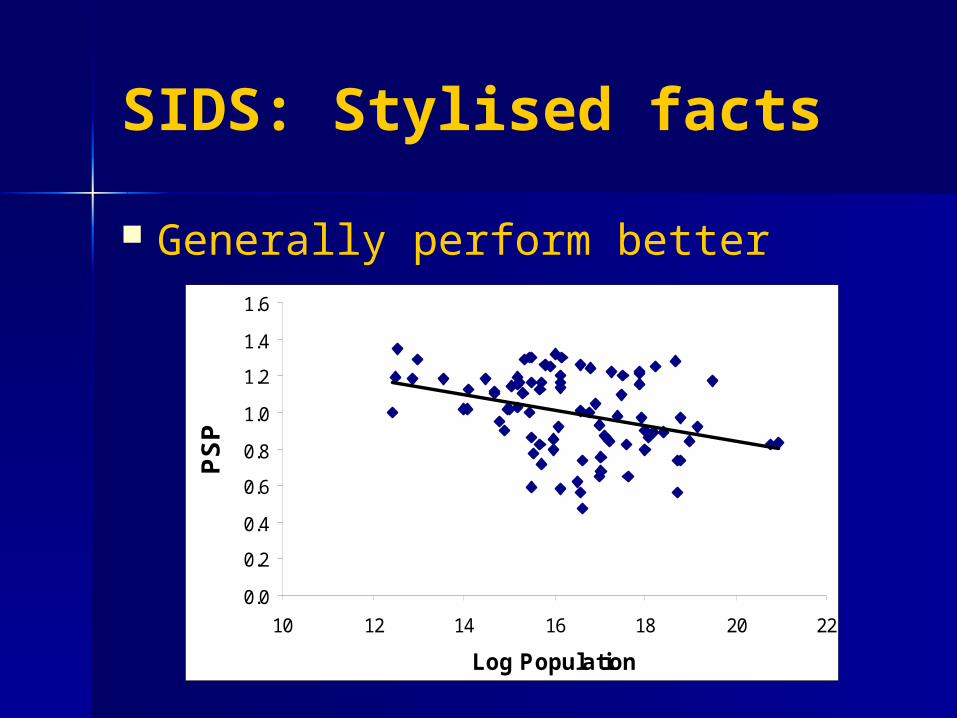
SIDS: Stylised facts
Generally perform better
0.0
0.2
0.4
0.6
0.8
1.0
1.2
1.4
1.6
10 12 14 16 18 20 22
Log Population
PS
P
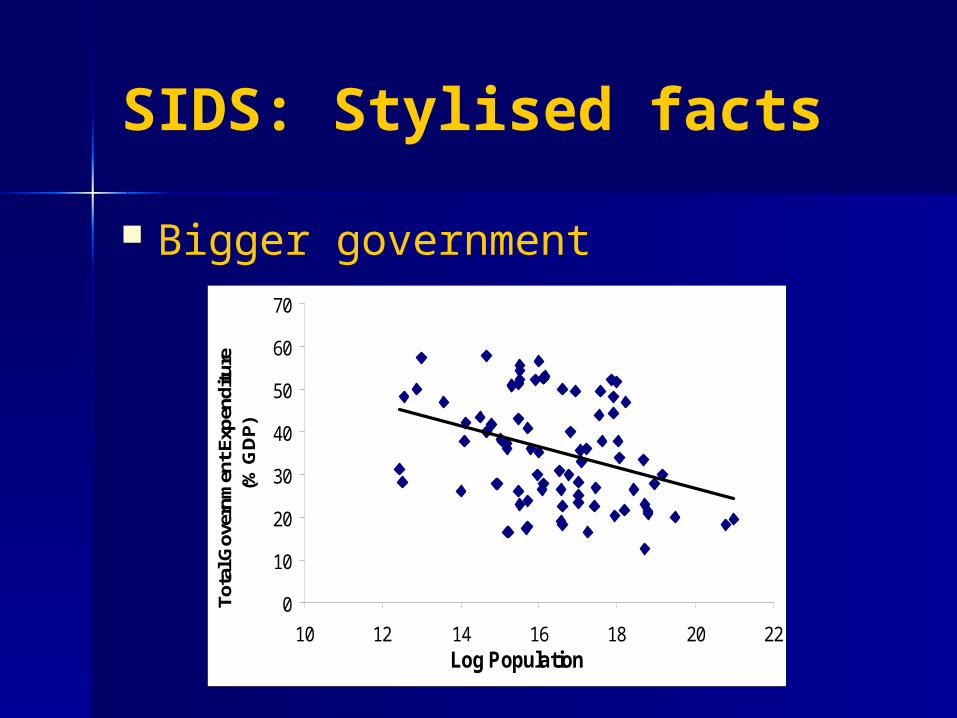
Bigger government
SIDS: Stylised facts
0
10
20
30
40
50
60
70
10 12 14 16 18 20 22Log Population
Tota
l Gov
ernm
ent E
xpen
ditu
re
(% G
DP)

SIDS: Analysis
PSP
0.00
0.25
0.50
0.75
1.00
1.25Barbados
Cyprus
Malta
Mauritius
SingaporeTrinidad and
Tobago
Belize
Papua New Guinea
Jamaica

SIDS: Analysis
PSP sub-indicators
0.0
0.2
0.4
0.6
0.8
1.0Barbados
Cyprus
Malta
Mauritius
SingaporeTrinidad and
Tobago
Belize
Papua New Guinea
Jamaica
Governance Index Education IndexHealth Index Economic Performance IndexStability Index

SIDS: Analysis
PSP vs PSE
0.0
0.5
1.0
1.5
2.0
2.5
3.0
3.5
4.0
4.5
5.0
0.5 0.7 0.9 1.1 1.3
PSP Index
PS
E I
nd
ex
BARBADOS BELIZE CYPRUSJAMAICA MALTA MAURITIUSPAPUA NEW GUINEA SINGAPORE TRINIDAD AND TOBAGO
Under-spenders Efficient Economies
Non-achievers Over-spenders

SIDS: Analysis
PSP vs. PSPS
0.5
0.6
0.7
0.8
0.9
1.0
1.1
1.2
1.3
0.5 0.7 0.9 1.1 1.3
PSP
PS
PS
BARBADOS BELIZE CYPRUS
JAMAICA MALTA MAURITIUS
PAPUA NEW GUINEA SINGAPORE TRINIDAD AND TOBAGO
Unsustainable PerformanceNon-Achievers
Under-spenders Sustainable Performance

‘kites rise highest against the wind - not with it’
W Churchill

SIDS: Policy implications Can improve well-being through
law-making, policy making and administrative capacity
Learn from other SIDS Implement public sector reforms Consolidate public finances

‘it is believed that the performance and efficiency of the institutional framework contributes strongly to an
explanation of cross country differences in economic
growth’
D North
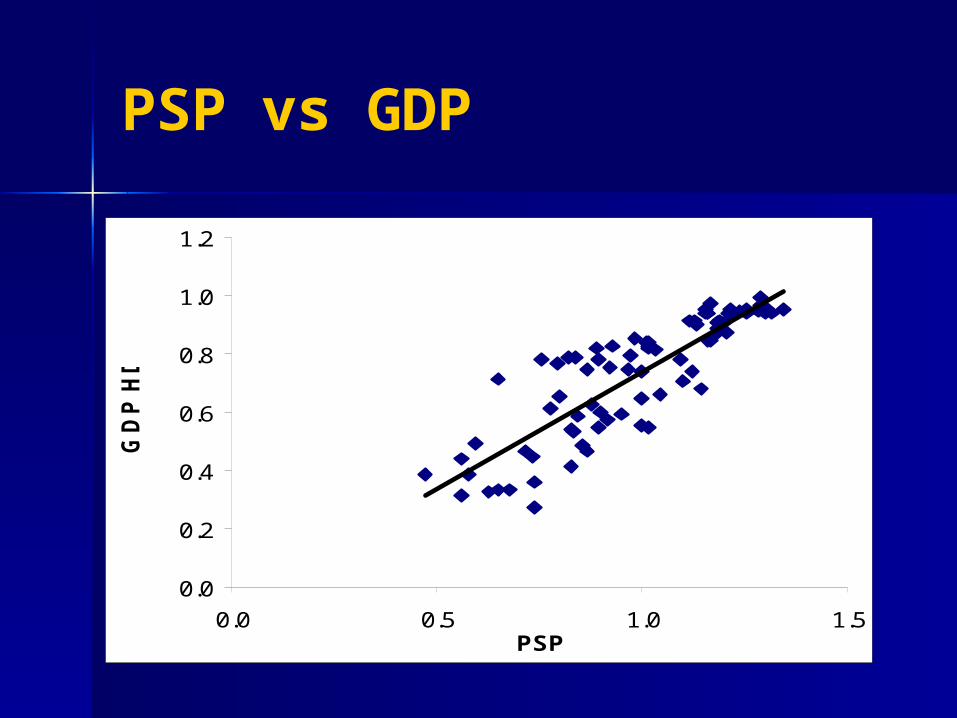
PSP vs GDP
0.0
0.2
0.4
0.6
0.8
1.0
1.2
0.0 0.5 1.0 1.5PSP
GD
P H
DI

PSE vs GDP
0.0
0.2
0.4
0.6
0.8
1.0
1.2
0.0 1.0 2.0 3.0 4.0 5.0
PSE
GD
P H
DI
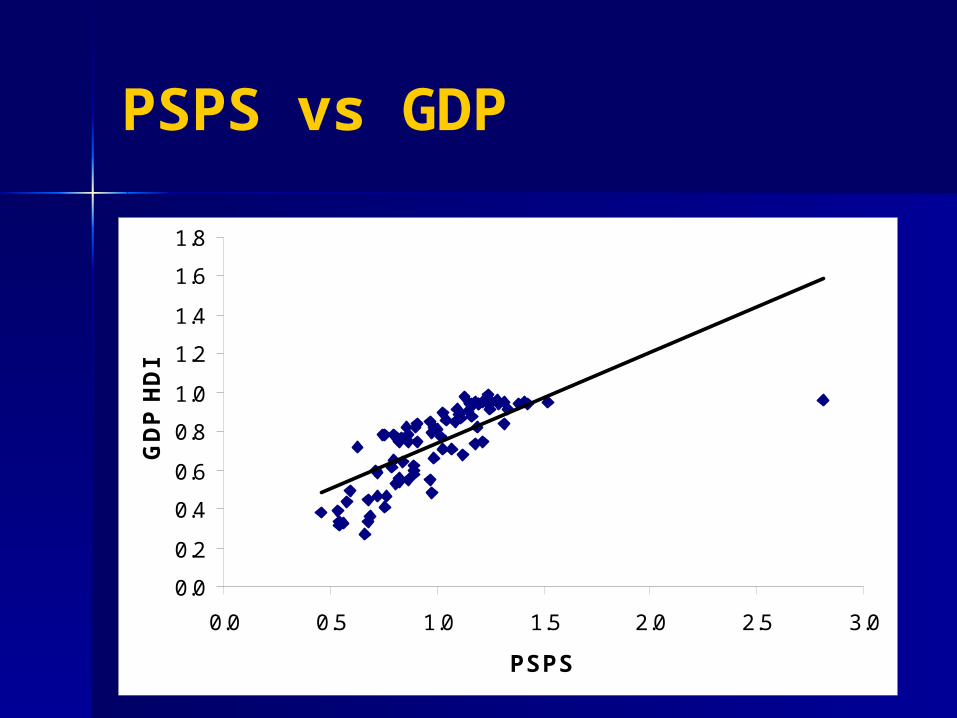
PSPS vs GDP
0.0
0.2
0.4
0.6
0.8
1.0
1.2
1.4
1.6
1.8
0.0 0.5 1.0 1.5 2.0 2.5 3.0
PSPS
GD
P H
DI

PSP vs Competitiveness
3.0
3.5
4.0
4.5
5.0
5.5
6.0
0.4 0.6 0.8 1.0 1.2 1.4
PSP Index
Co
mp
eti
tiven
esss In
dex
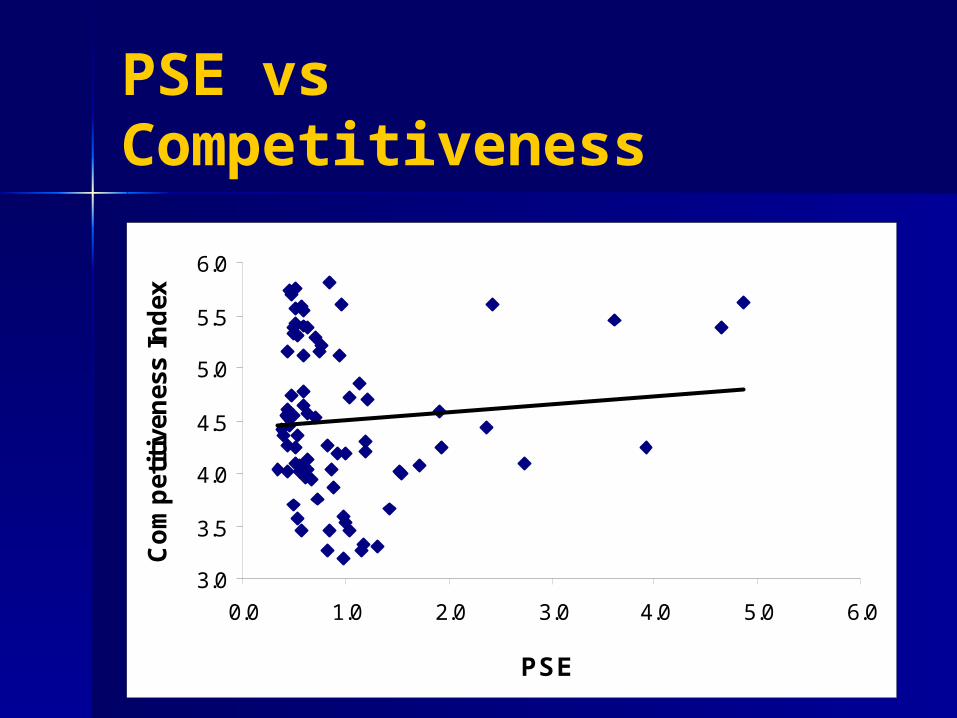
PSE vs Competitiveness
3.0
3.5
4.0
4.5
5.0
5.5
6.0
0.0 1.0 2.0 3.0 4.0 5.0 6.0
PSE
Co
mp
etit
iven
ess
Ind
ex

PSPS vs Competitiveness
3.03.54.04.55.05.56.06.57.07.58.0
0.0 0.5 1.0 1.5 2.0 2.5 3.0
PSPS
Co
mp
etit
iven
ess
Ind
ex

Limitations of study
Subjective elements– Variables chosen– Weighting procedure
Data problems– Shortage of data– Non-homogenous definitions across
countries
Concluding remarks
Important for public sector to perform well, efficiently and effectively
Public sector must invest in society in a sustainable manner
Case for public sector reform and to consolidate public finances are too compelling to ignore

‘let our advance worrying become advance thinking and
planning’
W Churchill