PUBLIC TRANSIT AND WASHOE COUNTY SENIORS
SUPPORTING INDEPENDENCE, DIGNITY, AND CHOICE
Grady Tarbutton, Director
Washoe County Senior Services
2
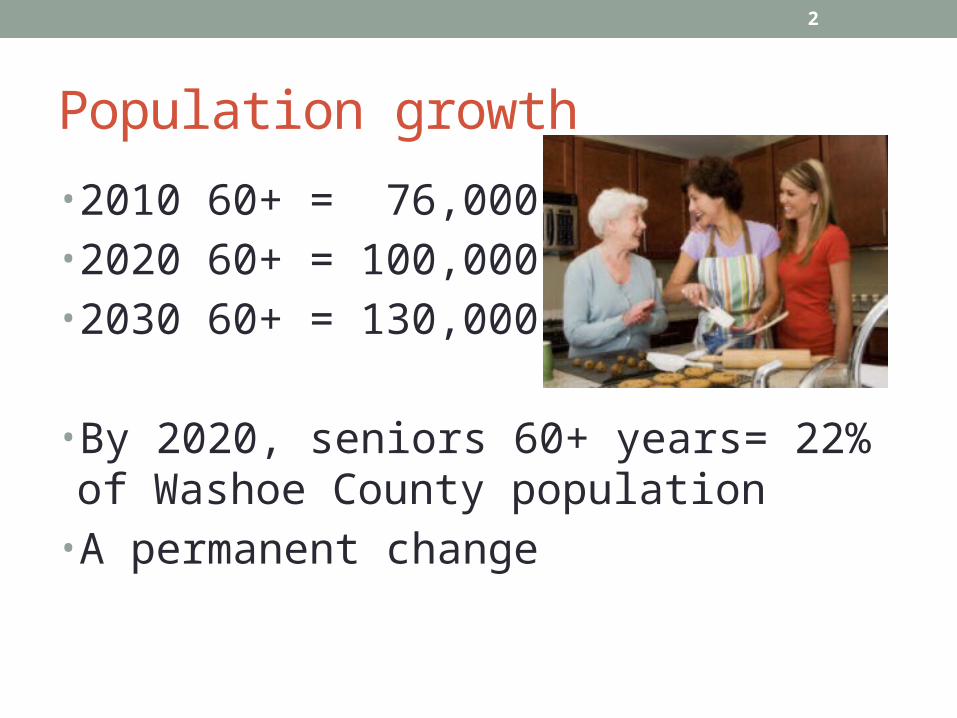
Population growth
• 2010 60+ = 76,000• 2020 60+ = 100,000• 2030 60+ = 130,000
• By 2020, seniors 60+ years= 22% of Washoe County population
• A permanent change
3
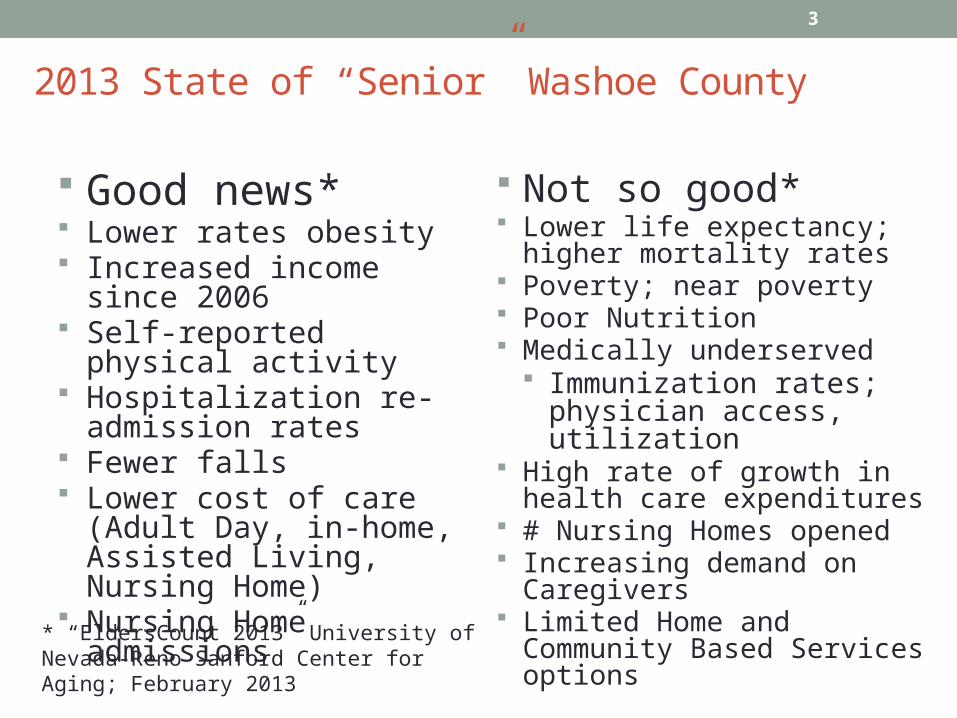
2013 State of “Senior” Washoe County
Good news* Lower rates obesity Increased income since
2006 Self-reported physical
activity Hospitalization re-
admission rates Fewer falls Lower cost of care (Adult
Day, in-home, Assisted Living, Nursing Home)
Nursing Home admissions
Not so good* Lower life expectancy; higher
mortality rates Poverty; near poverty Poor Nutrition Medically underserved
Immunization rates; physician access, utilization
High rate of growth in health care expenditures
# Nursing Homes opened Increasing demand on
Caregivers Limited Home and Community
Based Services options* “EldersCount 2013” University of Nevada-Reno Sanford Center for Aging; February 2013
4
“2014 Master Plan for Aging Services”
• Engage Community Leaders and Policy Makers• Analysis of 2006-16 Strategic Plan• Random Survey/Community Needs Assessment• Data Analysis of Survey; focus groups• Enumerate Current Service Levels and Gap in Needs• Develop Strategies to Address Gaps; Publish
5
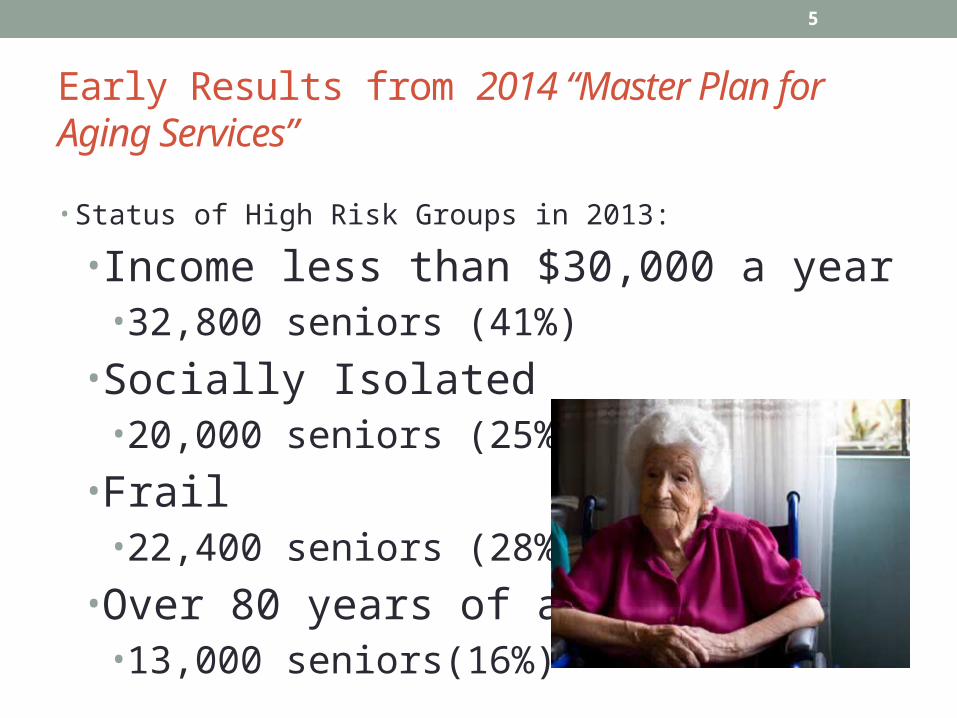
Early Results from 2014 “Master Plan for Aging Services”
• Status of High Risk Groups in 2013:
• Income less than $30,000 a year • 32,800 seniors (41%)
• Socially Isolated • 20,000 seniors (25%)
• Frail • 22,400 seniors (28%)
• Over 80 years of age • 13,000 seniors(16%)

6
Senior High Risk Groups will grow• Projections for 2020
• Income less than $30,000 a year • to 43,940 seniors
•Socially Isolated • to 26,792 seniors
•Frail • to 30,007 seniors
•Over 80 years of age • to 19,085 seniors
7
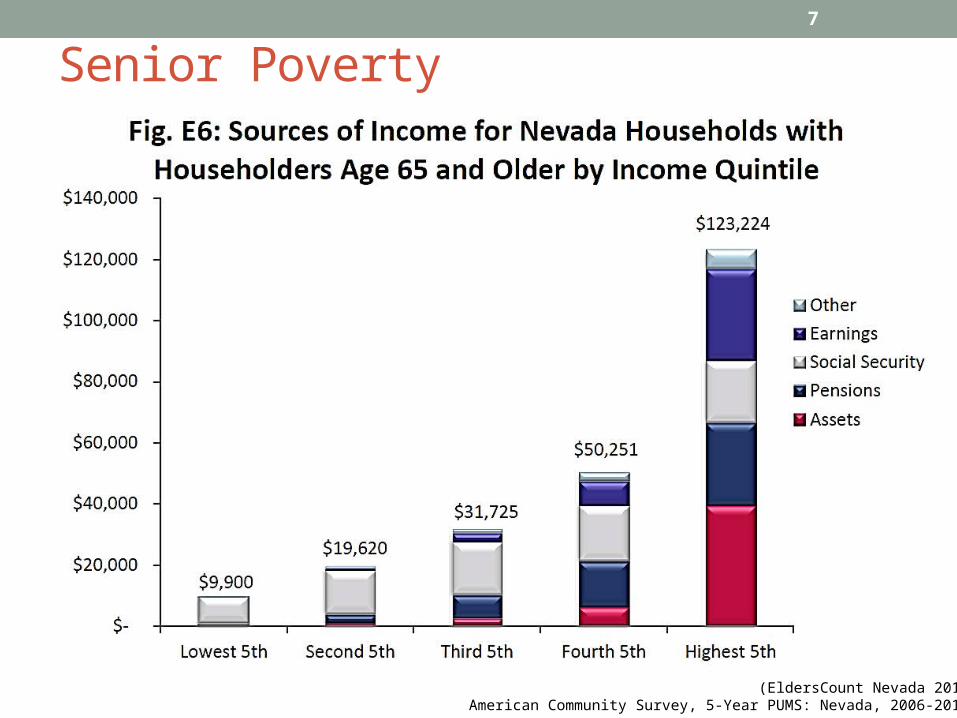
Senior Poverty
(EldersCount Nevada 2013; American Community Survey, 5-Year PUMS: Nevada, 2006-2010)
8
9
10
But, High Risk Seniors not aware of Services
• They are more likely to need them• Only 10% use them, today • And, are less likely to be aware of them than other seniors
• Conclusion: the gaps in services for High Risk seniors is high today, and is growing
11
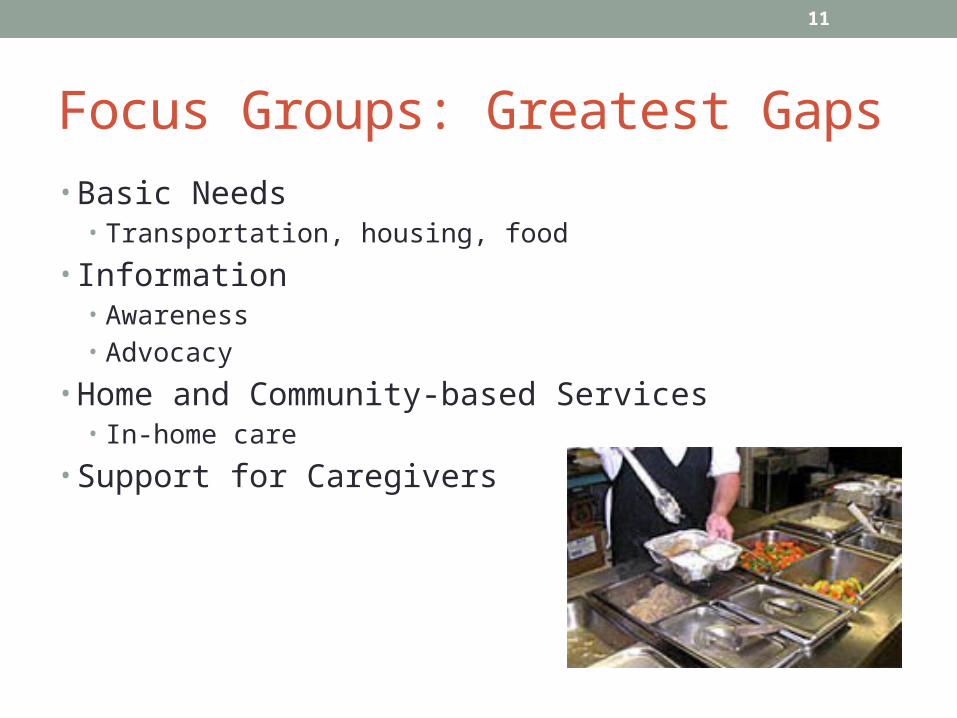
Focus Groups: Greatest Gaps• Basic Needs
• Transportation, housing, food
• Information • Awareness • Advocacy
• Home and Community-based Services• In-home care
• Support for Caregivers
12
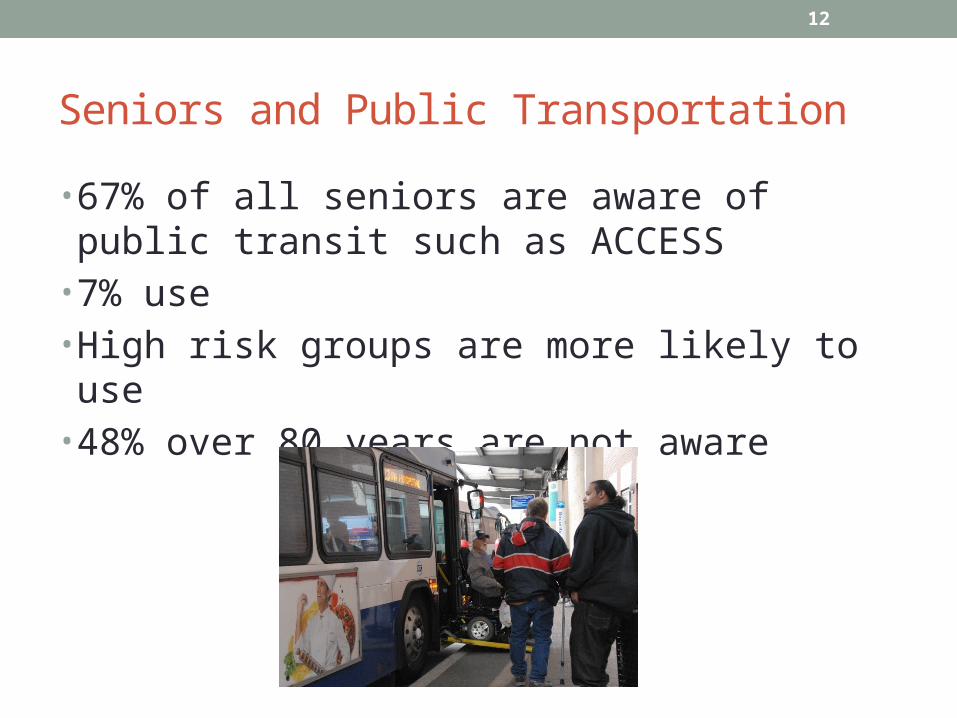
Seniors and Public Transportation
• 67% of all seniors are aware of public transit such as ACCESS
• 7% use • High risk groups are more likely to use• 48% over 80 years are not aware
13
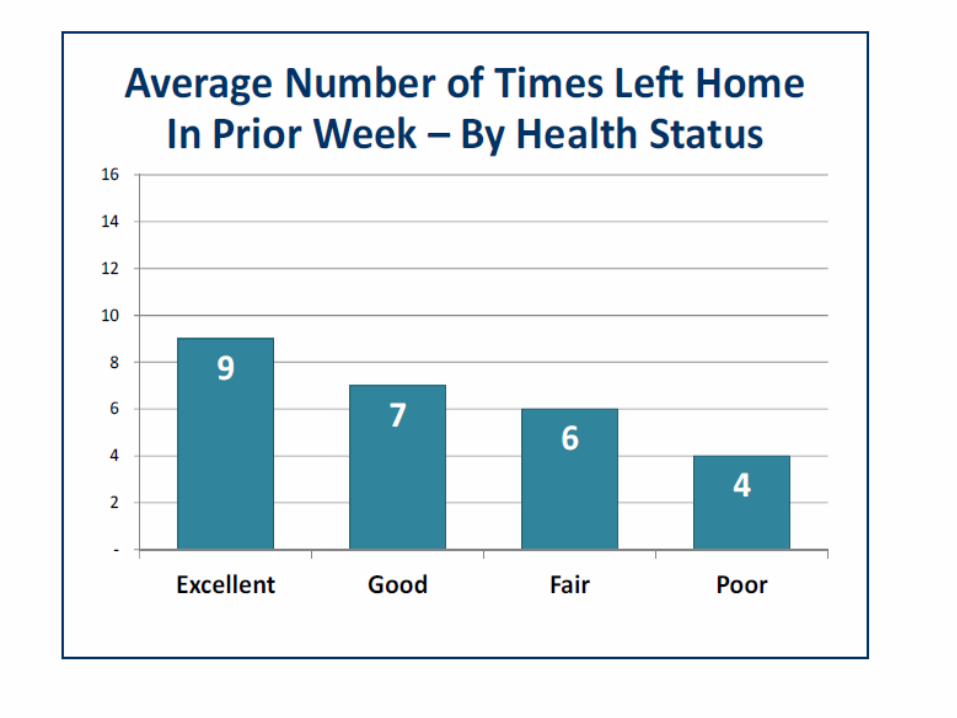
Seniors and Driving
• Only 14% over 60 no longer drive• 33% over 80 no longer drive
• 98% who were able to drive left home in the past week; 56% seven or more times
• 83% who were not able to drive left home in the past week; 20% seven or more times
14
15
“Next Steps”
• Plan together• Comprehensive, coordinated services• Anticipate an impact on every agency, every business,
every family
• Create sponsors• Create a “Lifelong” Community• Support for families
16
If we do this well . . .
• Seniors living longer, healthier, more independent lives
• Seniors prefer living at home and will have a higher quality of life
• Support for families to provide care, longer• Delay High Risk clients’ entry into Medicaid
17
CONTACT INFO
Grady Tarbutton, Director
Washoe County Senior Services
775-328-6141
Washoe County Master Plan for Aging Services website:
www.washoecounty.us/seniorsrv/MP/MasterPlan.htm


