
PVT LANDFILL LIMITED HUMAN HEALTH RISK ASSESSMENT
CONSTRUCTION DEBRIS RECYCLING
Submitted To:
PVT Landfill 87-2020 Farrington Hwy Waianae, Hawaii 96792
Submitted By:
Environmental Risk Analysis LLC 725 Hao Street
Honolulu, Hawaii 96821
July 2010
Limited HHRA Section:Table of Contents Date: July 2010 TABLE OF CONTENTS
SECTION TITLE PAGE
EXECUTIVE SUMMARY i 1.0 Introduction 1-1
1.1 Site and Sampling Area Location 1-1 1.2 General Study Approach 1-3
2.0 Estimation of Dust Generation 2-1
2.1 Dust Associated with Current Operations 2-1 2.2 Dust Associated with Future Recycling Operations 2-4
3.0 Air Dispersion Modeling of Dust to Recident Locations 3-1
3.1 Dust Emission Rate Calculations 3-1 3.2 Fugitive Dust Concentration 3-6
4.0 Estimation of Chemical Concentrations in Bulk material and At Receptor Locations 4-1
4.1 Estimation of chemical concentration in bulk material 4-1 4.2 Estimation of Chemical Concentrations at Receptor Locations 4-2
5.0 Estimation of Cancer Risks and Non-Cancer Hazards 5-1
5.1 Hazard Identification 5-2 5.2 Toxicity Assessment 5-2 5.3 Exposure Assessment 5-4
5.3.1 Identification of Receptors 5-4 5.3.2 Identification of Potential Exposure Pathways 5-4 5.3.3 Identification of Exposure Scenarios 5-5 5.3.4 Exposure Concentration Calculations 5-5
5.4 Risk Characterization 5-8 5.4.1 Noncarcinogenic Risk Characterization 5-9 5.4.2 Carcinogenic Risk Characterization 5-10
6.0 Conclusions 6-1 7.0 Uncertainty Analysis 7-1
7.1 Hazard Identification 7-1 7.2 Toxicity Assessment 7-2 7.3 Exposure Assessment 7-3
7.3.1 Estimation of Particulate Emission Factors 7-3 7.3.2 Estimation of Airborne Dust Concentrations Offsite 7-4 7.3.3 Estimation of Exposure Dose 7-5
7.4 Risk Characterization 7-6 8.0 References 8-1
Limited HHRA Section:Table of Contents Date: July 2010
LIST OF FIGURES 1 Site Location Map 1-2
LIST OF TABLES
2-1 Analytical Results from Active Air Monitoring 2-3 2-2 Total Dust Results During Mining Operations 2-5 2-3 PM10 Dust Results During Mining Operations 2-6 3-1 PM10 Respirable Dust Concentrations 3-8 4-1 Analytical Results 4-2 4-2 Dust COPC Exposure Point Concentrations from On-site Activities 4-3 5-1 Dose Response Information 5-4 5-2 Exposure Assumptions 5-8 5-3 Noncarcinogenic Risk 5-10 5-4 Carcinogenic Risk 5-11 5-5 Final Risk Results 5-11
LIST OF APPENDICES
Appendix A: Ambient Air Monitoring Photographs Appendix B: Laboratory Analytical Results Appendix C: Active Air Monitoring Results Appendix D: Statistical Analysis Appendix E: Air Dispersion Modeling Appendix F: Risk Characterization Spreadsheets Appendix G: PVT 3rd Party Waste Sort

Limited HHRA Section:Executive Summary Date: July 2010 EXECUTIVE SUMMARY
Environmental Risk Analysis (ERA) has evaluated the potential for human health impacts
associated with the recycling of construction and demolition (C&D) materials for use as
feedstock in a liquid gas manufacturing plant. The Limited Human Health Risk Assessment
was prepared to address Hawaii Department of Health (HDOH) and anticipated community
concerns regarding the safety of the proposed recycling operations, including the use of
two separate processing/shredding plants at the PVT Landfill Site. The plants are part of a
larger recycling initiative that, when implemented, will significantly reduce the volume of
material going to landfill, provide the State with an additional renewable source of fuel gas
and align PVT operations with the State’s Clean Energy Initiative and Integrated Solid
Waste Management Plan. Specifically, the assessment evaluates the following potential
impacts associated with the proposed recycling program:
Airborne dust impacts during delivery and stockpiling of feedstocks
Airborne dust impacts during mining of closed portions of the landfill for feedstocks
Airborne dust impacts during processing and shredding of feedstocks
Airborne dust impacts from on-site storage of processed material
The current assessment was performed using similar methods and procedures used in a
study performed by the HDOH which assessed human health risks from fugitive dust and
surface soils assumed to contain specific concentrations of various metals (AMEC, 2005).
In this assessment, respirable dust concentrations (PM10) were measured by Real-Time
Personal DataRAM (pDR) or equivalent. Because it is not currently available, potential
dust generation from the fine shredder (and subsequent stockpiling of fine shredded
material) was estimated using health protective dust emission rates obtained from the
USEPA (USEPA 1995b). The respirable dust fraction (PM10) from these activities was
then modeled to nearby residential neighborhoods assumed to be located at the PVT
Landfill fence line. The respirable particulate concentrations derived from each of the
recycling processes was used in conjunction with chemical analytical data of bulk material
samples to estimate chemical concentrations at resident locations in the adjacent
community. All respirable dust measured in this study was assumed to be derived from
process operations.

Limited HHRA Section:Executive Summary Date: July 2010
Potential health risks via the inhalation pathway were estimated for adults and children who
live approximately ¼ mile downwind from dust generating activities. Potential estimated
lifetime cancer risks were compared to the USEPA and HDOH regulatory level of concern
for residential areas of one excess cancer in 1,000,000 people. Estimated noncarcinogenic
risks are presented as total site Hazard Indices that sum the Hazard Quotients of each
Chemical of Potential Concern at the site. A total Hazard Index of 1 was the regulatory
level of concern. A total Hazard Index that does not exceed 1 indicates that no adverse
noncarcinogenic health effects are expected to occur. In addition, this study also evaluated
whether it is safe for PVT Landfill workers to be involved with the program. Dust
concentrations and metals concentrations in dust during recycling operations were
compared to OSHA Permissible Exposure Limits (PELs). OSHA PELS are time-weighted
concentrations of dust or chemicals that should not be exceeded over an 8 hr period.
WORKER RESULTS
To ensure worker safety, active air sampling for total metals and total dust was performed
and compared to OSHA Permissible Exposure Limits (PELs). No metals were detected in
the air samples and Total Dust was detected at a concentration of 1.7mg/m3, which is well
below the OSHA PEL of 50 mg/m3.
RESIDENT RESULTS
The residential scenario assumed fugitive dust is generated during delivery and stockpiling
of feedstock; during mining of closed portions of the landfill; during processing, crushing
and shredding of feedstock; and from wind erosion of on-site storage of processed
material. The residential scenario assumed migration of fugitive dust (24 hrs/day) to
residential areas located approximately ¼ mile away from dust generating activities. In
reality, the majority of recycling activities (e.g., processing of material) will only occur during
working hours. Carcinogenic Excess Lifetime Cancer Risk (ELCR) due to the inhalation
pathway was 3E-07 or a 3 in 10,000,000 probability that a resident will develop cancer in
his or her lifetime, over and above the background cancer rate, as a result of potential Site-
related exposures to COPCs in the air. This was well below the residential regulatory level
of concern of 1E-06 or 1 in 1,000,000. Noncarcinogenic health risks due to the inhalation

Limited HHRA Section:Executive Summary Date: July 2010 pathways were .0003 for the residential adult receptor and for the residential child receptor,
both below the regulatory level of concern (Hazard Index of 1).
The maximum annual average PM10 concentration as determined by USEPA Model
SCREEN3 was 0.41 ug/m3. This is well below the National Ambient Air Quality Standard
(NAAQS) of 50 ug/m3 for PM10 (annual average). The NAAQS standards were developed
to address chemicals considered harmful to public health and the environment. The Clean
Air Act established two types of national air quality standards. Primary standards set limits
to protect public health, including the health of "sensitive" populations such as asthmatics,
children, and the elderly. Secondary standards set limits to protect public welfare, including
protection against decreased visibility, damage to animals, crops, vegetation, and buildings.
The primary and secondary standards for PM10 are both 50 ug/m3. The respirable dust
concentrations determined in this study are therefore far less than concentrations that
cause health effects in “sensitive” populations and are also far less than concentrations that
result in nuisance concerns.
The recycling program does not pose a potentially significant threat to human health and
the environment. The chemical driver responsible for the majority of the carcinogenic risk
and non-carcinogenic hazard was arsenic measured in the bulk material “spiked” with
Chromated Copper Arsenate (CCA) treated lumber. The inhalation of fugitive dust
containing arsenic and chromium was responsible for nearly 100% of the assessment’s
carcinogenic risks. It should be noted that bulk materials knows to contain arsenic were
added to the bulk material samples collected at PVT and then evaluated by the laboratory.
Actual concentrations of arsenic are anticipated to be much lower based on waste
acceptance records provided by PVT. To provide an extra measure of safety, ERA
performed a supplemental assessment (calculations not shown) assuming that bulk
material contained up to 932 mg/kg arsenic and 47.8 mg/kg hexavalent chromium. This is
4 times the amount of arsenic and chromium present in the bulk samples containing
additional arsenic-containing material. All other exposure assumptions being identical,
cancer and noncancer risks were still below the HDOH regulatory levels of concern for
residential scenarios.

Limited HHRA Section: 1 Date: July 2010
1-1
1.0 INTRODUCTION
PVT Landfill has retained Environmental Risk Analysis LLC (ERA) to evaluate potential
human health risks associated with the recycling of construction and demolition (C&D)
materials for use as feed stock in a liquid gas manufacturing plant. The Human Health Risk
Assessment (HHRA) is a companion document to the PVT Landfill Work Plan and
Sampling Analysis Plan, Limited Human Health and Environmental Assessment of
Construction Debris Recycling (ERA, March 2010). The HHRA was prepared to address
Hawaii Department of Health (HDOH) concerns about the safety of the proposed recycling
operations, including the use of a shredding/processing plant at the PVT Landfill Site
(Figure 1). The proposed plant is part of a larger recycling initiative that when implemented
will significantly reduce the volume of material going to landfill, provide the State with an
additional renewable source of fuel gas and align PVT operations with the State’s Clean
Energy Initiative and Integrated Solid Waste Management Plan. Specifically, the HDOH is
concerned with the following potential impacts associated with the proposed recycling
program:
Airborne dust impacts during delivery and stockpiling of feedstocks
Airborne dust impacts during mining of closed portions of the landfill for feedstocks
Airborne dust impacts during processing, crushing and shredding of feedstocks
Airborne dust impacts from onsite storage of processed material
The study described herein was designed to conservatively address these concerns. ERA
has estimated health impacts to nearby residents from potential air sources originating from
the recycling program and determined if it is safe per OSHA regulations for PVT Landfill
workers to be involved with the program.
1.1 Site and Sampling Area Location
The PVT Landfill Site is located at 87-2020 Farrington Highway on the western side of the
island of O’ahu, in Nanakuli, Hawai’i (Figure 1). The PVT Landfill Site consists of an
irregularly shaped 15.44-acre parcel of land (Latitude/Longitude: 21º 23’ 50’’ N/158º 09’
00’’W). The Site is bounded by residential areas at its southern and western borders.

Limited HHRA Section: 1 Date: July 2010
1-2
Figure 1 Site Location Map
PVT Landfill

Limited HHRA Section: 1 Date: July 2010
1-3
1.2 General Study Approach
The PVT Landfill recycling program is a multi-phased, multifaceted program and involves
implementation of the following tasks. Some of these tasks are currently ongoing; while
others (i.e. mining of additional feedstocks, fine shredding and stockpiling of processed
material) are proposed for future operations.
Currently Ongoing Operations
Stockpiling of bulk material (feedstocks)
Separation of metal recyclables
Coarse shredding of bulk material to 6” to 8” pieces
Proposed Future Operations
Mining of additional feedstocks from closed portions of the landfill
Fine shredding of coarsely shredded material to 3/8” to 2.5”
Handling and stockpiling of processed material (Risk associated with this task
include fugitive dust emissions during handling of processed material and fugitive
dust generated by wind erosion of open storage piles)
In this risk assessment, health risks from chemicals in fugitive dust from current operations
have been added to risks from dust generated from future recycling operations (mining
activities, fine shredding and stockpiling of processed material) to estimate a
comprehensive operational risk. Evaluation of potential health risks due to these
operations requires 1) an estimation of dust generation from these activities, 2) modeling of
dust to receptor locations, 3) estimation of metals concentrations at receptor locations, and
4) estimation of cancer risks and noncancer hazards. Each of these steps is discussed in
the sections below.
The technical approach of this study was developed in accordance with the following
guidance documents including but not limited to:
Limited HHRA Section: 1 Date: July 2010
1-4
USEPA Risk Assessment Guidance for Superfund, Volume I Part A - Human Health
Evaluation Manual (USEPA 1989)
Sampling and Analysis Plan Guidance and Template (USEPA 2000).
USEPA Office of Air Quality Planning and Standards: Compilation of Air Pollutant
Emission Factors, AP-42 Fifth Edition, January 1995b. Updates provided in
http://www.epa.gov/ttnchie1/ap42/.
ASTM Standard D6051-96 (revised in 2001), Standard Guide for Composite
Sampling and Field Subsampling for Environmental Waste Management Activities
(ASTM 2001).
Guidance for Obtaining Representative Laboratory Analytical Subsamples from
Particulate Laboratory Samples EPA/600/R-03/027, November, 2003.
Limited HHRA Section: 2 Date: July 2010
2-1
2.0 ESTIMATION OF DUST GENERATION
Estimation of dust from current operations was accomplished by field measuring dust from
currently ongoing operations in total (i.e., measuring dust generated from all three current
activities: stockpiling of bulk material, separation of recyclables, and coarse shredding).
Estimation of total dust generation for future activities was accomplished by estimating dust
levels generated from each individual task and summing the parts. The approach selected
(summing of individual parts or obtaining a dust concentration in total) was dependent on
ongoing operations at the landfill. For example, dust generation from current operations in
its entirety could be estimated as these activities are ongoing. Individual emission rates for
each subactivity are not necessary to evaluate risk from the operations as a whole and
therefore were not estimated. However, for proposed future operations, it is not possible to
obtain a total dust emission rate (operations are unable to be simulated). Dust emissions
were therefore estimated for each individual subactivity. In this study, a demonstration
project to collect real life data was performed to obtain relevant and applicable dust
generating data for future mining operations. Because the fine shredding processor is not
currently available, real-life dust generated from fine shredding and its subsequent
stockpiling cannot be obtained. For these cases, conservative dust emission rates were
obtained from USEPA AP-42 (USEPA 1995b).
2.1 Dust Associated with Current Operations
PVT currently stockpiles feedstock material, separates combustible material from metal
recyclables and coarse shreds combustibles to 6” to 8” pieces. Other activities (proposed
for future operations) will be implemented upon approval of the recycling program.
Methods to estimate dust generation from these future activities are discussed in Section
2.2.
ERA collected air samples during current processing activities and analyzed samples for
total RCRA 8 metals (arsenic, barium, cadmium, chromium, lead, mercury, selenium and
silver), total dust and respirable dust (PM10). Sampling methodology and results for each
is described below. Photos and video of the sampling event is provided in Appendix A.
Limited HHRA Section: 2 Date: July 2010
2-2
Air Monitoring for Total RCRA 8 Metals and Total Dust
Active air sampling for total metals and total dust employed two (2) sets of air pumps: The
first set was used to measure total dust, while the second set was used to measure total
metals. Individual pumps (1 for total dust and 1 for total metals) were situated upwind of
processing activities, downwind of processing activities and within the recycling segregation
chamber. Pumps were run for approximately 4 hours, the anticipated duration of general
usage of the plant. Low-flow pumps were employed and set at an air collection rate
appropriate for the chemicals of concern:
Total Dust – 1L/min – 120L total volume
Metals – 2.5L/min – 500L total volume
Analytical laboratory results are provided in Appendix B and are summarized in Table 2-1.
Metals were not detected above laboratory reporting limits in any sample collected. All
detection limits were below their applicable OSHA Permissible Exposure Limits (PELs).
For this reason, USEPA style chronic and acute health risk assessment was not performed
for the worker scenario. Total dust was detected in both the upwind and the downwind
samples at 0.15 mg/m3. In the segregation chamber (noted as “chipper” in the analytical
laboratory reports) total dust measured 1.7 mg/m3. At this time, OSHA regulates wood dust
as a nuisance dust. The maximum permissible exposure for nuisance dust is 15 mg/m3,
total dust. Total dust from current operations InTotal, are below the OSHA PEL for worker
safety.

Limited HHRA Section: 2 Date: July 2010
2-3
Table 2-1: Analytical Results from Active Air Monitoring
Analyte OSHA PEL
(mg/m3)
Maximum Concentration
Detected
(mg/m3)
Total Dust 15 1.7
Arsenic 0.01 < 0.00006
Barium (sulfate) 15 < 0.04
Cadmium 0.005 < 0.0015
Chromium (VI) 0.005 < 0.0025
Lead (inorganic) 0.5 < 0.0041
Mercury (inorganic) 2 < 0.0015
Selenium 0.2 < 0.00017
Silver 0.01 < 0.0012
Air Monitoring for Respirable Dust
Active air sampling for respirable dust employed three (3) individual air pumps: Individual
pumps (1 at each location) were situated upwind of processing activities, downwind of
processing activities and within the recycling segregation chamber. Pumps were run for
approximately 4 hours, the anticipated duration of general usage of the plant. Low-flow
pumps were employed and set at 1.7 L/min for a total volume of 340L.
Respirable dust was also collected by a Real-time Personal DataRam with cyclone
attachment to estimate PM10 emissions from current processing operations. Real-time
PM10 dust concentrations in ambient air was monitored over a continuous 2-hr period
during active processing activities that included bulk material delivery, segregation of
recyclables, coarse shredding and stockpiling of processed material. DataRam data is
provided in Appendix C. Data logging was performed at 1 minute intervals. ERA staff
performed the sampling event by moving the DataRam continuously so that it was always
in the downwind direction of processing activities. If wind was blowing from the northeast,
the DataRam was moved to the southwest side of the processing activities. Additionally,
the DataRam was located in the highest impact area as determined by the visual dust
plume. Winds on the day of the sampling event were variable, but were predominantly

Limited HHRA Section: 2 Date: July 2010
2-4
from the northeast which is the typical wind direction for the area approximately 80-90% of
the time.
The arithmetic average of PM10 results was 0.036 mg/m3. The maximum PM10 was 3.559
mg/m3. 95% Upper Confidence Level of the Mean (UCL) was 0.046 mg/m3. UCL
calculations are also provided in Appendix C. OSHA currently regulates wood dust as a
nuisance dust. The maximum permissible exposure 8-hr time weighted average limit
(TWA) for nuisance dust (PM10 fraction) is 5 mg/m3. Maximum PM10 dust concentration
detected during monitoring activities was well below the 8hr TWA.
2.2 Dust Associated with Future Recycling Operations
Health risks from chemicals in fugitive dust from current operations will be added to risks
from dust generated from future recycling operations (mining activities, fine shredding and
stockpiling of processed material) to estimate a comprehensive operational risk.
1) Mining Activities:
Air Monitoring for Total Dust
Total dust generated from potential mining operations was measured via active air
sampling as previously described. Active air sampling employed three (3) sets of air
pumps: The first pump was situated in the presumed upwind direction of mining activities;
the second and third pumps were located in the presumed downwind direction of mining
activities. Pumps were run for approximately 2 hour at 1 L/min for a total volume of 120L.
Results are summarized in Table 2-2. Laboratory results and COC are provided in
Appendix B.

Limited HHRA Section: 2 Date: July 2010
2-5
Table 2-2: Total Dust Results During Mining Operations
Location
Concentration
Detected
(mg/m3)
UW-2 - Upwind 0.32
DW-1 - Downwind 1 < 0.25
DW-3 - Downwind 2 1.3
Total dust was detected in upwind sample UW-2 at 0.32 mg/m3. The result from sample
UW-1 was determined to be unusable because the tripod on which the cartridge was
situated was blown over by the wind. Downwind samples DW-1 and DW-3 were situated in
the southeast direction of mining activities. DW-1 was run for a total of 2 hr during
demonstration mining activities. Dust for sample DW-1 was collected between 8:30 AM
and 10:30 AM. At 10:30 AM, the sample collection cartridge was replaced. Total dust
captured in sample DW-1 was below the laboratory detection limit of 0.25 mg/m3. Sample
DW-3 was run from 10:30 AM through 11:00 AM but was suspended early due to rain.
Total volume of the sample was 30L. The DW-3 result for total dust was 1.3 mg/m3.
NIOSH Method 0500 requires a minimum volume of 7L to a maximum volume of 133L and
these results were considered valid. The sample volume collected for DW-3 was well within
method parameters. Sample DW-2 was situated in the southwest direction of mining
activities. A total volume of 120L was captured and analyzed for total dust. Total dust at
DW-2 was found to be 0.53 mg/m3. Again, the maximum permissible exposure for
nuisance dust is 15 mg/m3, total dust. Total dust from potential mining operations are
below the OSHA PEL for worker safety.
Air Monitoring for Respirable Dust
PM10 emission rates generated from future mining operations were determined via active
real time monitoring of a pilot demonstration project conducted over a continuous 2 ½ hr
period. Real-time data was collected in lieu of active air pump sampling data because
monitoring with air pumps and filters is generally collected over an abbreviated period of
time and in a fixed location. The pDR real time data may better represent the 8-hour TWA

Limited HHRA Section: 2 Date: July 2010
2-6
as it can be collected over the course of the work day (or over the course of work activities),
and therefore higher dust generation periods are offset by periods of lower dust generation.
Respirable dust was collected by a TSI DustTrak 8520 (equivalent to the pDR used in the
previous study) to estimate PM10 emissions. DustTrak data is provided in Appendix C.
Data logging was performed at 1 minute intervals. ERA staff performed the sampling event
by moving the DustTrak continuously so that it was always in the downwind direction of
processing activities as sampled for current operations. Additionally, the DustTrak was
positioned in the highest impact area to the mining activities as determined by the visual
dust plume. Winds on the day of the sampling event were variable, but were predominantly
from the northeast which is the typical wind direction for the area approximately 80-90% of
the time.
The arithmetic average of PM10 results was 0.05 mg/m3. The maximum PM10 was 0.736
mg/m3. 95% Upper Confidence Level of the Mean (UCL) was 0.0637 mg/m3. UCL
calculations are also provided in Appendix D. Again, the maximum permissible exposure
8-hr time weighted average limit (TWA) for nuisance dust (PM10 fraction) is 5 mg/m3.
Maximum PM10 dust concentration detected during monitoring activities was well below
the OSHA 8hr TWA PEL for worker safety.
Table 2-3: PM10 Dust Results During Mining Operations
Location
Maximum
Concentration
(mg/m3)
Average
Concentration
(mg/m3)
95% UCL
Concentration
(mg/m3)
PDR-1 – PM10 Concentration During Mining Activities 0.736 0.05 0.0637
PM10 dust was measured over a continuous 2 ½ hour period during a demonstration
mining pilot test. 145 individual measurements were collected during the demonstration
project.
2) Fine Shredding: PM10 emissions generated from fine shredding activities were
estimated using equations provided in USEPA Office of Air Quality Planning and

Limited HHRA Section: 2 Date: July 2010
2-7
Standards, AP-42 (USEPA 1995b). Per AP-42 Section 13.2.4, Heavy Construction
Operations (Portable Plants: Crushing Operations), equations and factors provided
in AP-42 Section 11.19.2, Crushed Stone Processing and Pulverized Mineral
Processing should be used to estimate emissions from the fine shredding of wood
products. The derivation of the emission rate for dust from Fine Shredding
operations is further discussed in Section 3.
3) Stockpiling of Processed Materials: PM10 emissions from the handling and
stockpiling of processed materials may be generated by actual handling of materials
as well as by wind erosion of open aggregate storage piles. USEPA AP-42, Section
13.2.4 provides equations and standard factors for estimating emission rates for
aggregate handling. The USEPA acknowledges and provides these standard
equations because it is understood that fugitive dust may be generated by stockpile
handling activities and that these piles are usually left uncovered because of the
need for frequent material transfer into and out of storage. Dust emissions
addressed by these equations include several points in the storage cycle such as
material loading onto the pile, disturbances by strong wind currents, loadout from
the pile and the movement of loading equipment in the storage pile area. Wind
erosion of aggregate storage piles were addressed with standard USEPA AP-42
equations presented in Section 13.2.5, Industrial Wind Erosion. The emission rate
for dust from the stockpiling of processed materials is further discussed in Section
3.

Limited HHRA Section: 3 Date: July 2010
3-1
3.0 AIR DISPERSION MODELING OF DUST TO RESIDENT LOCATIONS
Air emission data were evaluated using SCREEN3. Respirable dust was modeled to the
nearest residential community assumed located approximately 1/4 mile from processing or
mining operations. No evaluation for deposited particulates was performed.
Results from both the active (available for current operations) and real-time sampling
events were evaluated and the Reasonable Maximum Exposure (RME) point concentration
from either of the data sets was used in the air dispersion model, SCREEN3. SCREEN3 is
a single source Gaussian plume model which provides maximum ground-level
concentrations for point, area, flare, and volume sources, as well as concentrations in the
cavity zone, and concentrations due to inversion break-up and shoreline fumigation.
SCREEN3 is a screening version of the ISC3 model. The SCREEN3 air dispersion model
(Version 96043) (USEPA 1995) was used to predict off-site ambient PM10 concentrations
for various scenarios based on the calculated emission rates for current and proposed future
operations.
3.1 Dust Emission Rate Calculations
Emission rates were calculated for current operations and for future activities to estimate
the amount of dust generated by each individual task at the point of production. These
emission rates could then be used in the SCREEN3 air dispersion model to estimate the
amount of respirable dust at the nearest residential community.
The approach selected (summing of individual parts or obtaining a dust concentration in
total) was dependent on ongoing operations at the landfill. For example, dust generation
from current operations in its entirety could be estimated as these activities are ongoing.
Individual emission rates for each subactivity are not necessary to evaluate risk from the
current operations as a whole and therefore were not estimated. However, for proposed
future operations, it is not possible to obtain a total dust emission rate (operations are
unable to be simulated). Dust emissions were therefore estimated for each individual
subactivity. In this study, a demonstration project to collect real-life data was performed to
obtain dust generating data for future mining operations. Because the fine shredding

Limited HHRA Section: 3 Date: July 2010
3-2
processor is not currently available, real-life dust generated from fine shredding and its
subsequent stockpiling cannot be obtained. For these cases, conservative dust emission
rates were obtained from USEPA AP-42 (USEPA 1995b).
Emission Rate from Current Operations
Estimation of emission rates dust from current operations was accomplished by field
measuring dust from currently ongoing operations in total (i.e., measuring dust generated
from all three current activities: stockpiling of bulk material, separation of recyclables and
coarse shredding). The PM10 emission rate (Q) during these activities was determined using
the Box Model described by Stern (Stern, 1984). The 95% UCL of the real-time PM10 data
(0.046 mg/m3) was conservatively chosen as the PM10 concentration to estimate emission rates
from current operations.
The Box Model is presented as below:
610 10 ))/(( meanuhQLE
or )/()( 610 10 LuhEQ mean
where:
Q: PM10 emission rate (g/s-m2)
E10: PM10 concentration (ug/m3)
h: mixing height
umean: mean wind speed (m/s), and
L: landfill length.
The PM10 concentration (E10) was derived from site-specific data obtained during the air
monitoring sampling. The 95% UCL PM10 concentration for data collected via PDR was
0.046 mg/m3. This assumption is a conservative estimate of the average dust generated
by current operations as the data was collected entirely downwind of the activities and
within dust plumes. The emission rate based on this value is 5.72E-06 g/s-m2.
Calculations are presented below.

Limited HHRA Section: 3 Date: July 2010
3-3
)/()( 610 10 LuhEQ mean
Parameters Value Reference Q: PM10 emission rate (g/s-m2) calculated
E10: PM10 concentrations (ug/m3) 46
h: mixing height 2 umean: mean wind speed (m/s) 2.8 site-specific
L: landfill length 45 site-specific
Q = 5.72E-06 g/s-m2
Emission Rates from Future Recycling Activities
1) Mining Activities: The emission rate for future mining activities was also calculated
using measured respirable dust generated via active air monitoring as previously
described. Results of the active air monitor resulted in an arithmetic average PM10
concentration 0.05 mg/m3. The maximum PM10 concentration was 3.559 mg/m3.
95% Upper Confidence Level of the Mean (UCL) was 0.0637 mg/m3. The PM10
emission rate (Q) during mining activities was again determined using a Box Model
(Stern, 1984). The 95% UCL of the PM10 concentration (0.0637 mg/m3) was
conservatively chosen as the PM10 concentration for modeling purposes to
estimate the average dust concentration from mining operations. The emission
rate based on this value is 7.93E-06 g/s-m2. Calculations are presented below.
)/()( 610 10 LuhEQ mean
Parameters Value Reference Q: PM10 emission rate (g/s-m2) calculated
E10: PM10 concentrations (ug/m3) 63.7
h: mixing height 2 umean: mean wind speed (m/s) 2.8 site-specific
L: landfill length 45 site-specific
Q = 7.93E-0 6 g/s-m2
2) Fine Shredding: PM10 emissions generated from fine shredding activities were
estimated using equations provided in USEPA Office of Air Quality Planning and

Limited HHRA Section: 3 Date: July 2010
3-4
Standards, AP-42. Per AP-42 Section 13.2.4, Heavy Construction Operations
(Portable Plants: Crushing Operations), equations and factors provided in AP-42
Section 11.19.2, Crushed Stone Processing and Pulverized Mineral Processing
should be used to estimate emissions from the fine shredding of wood products.
Tertiary Crushing Emission Factor from 11.19.2 Crushed Stone Processing and
Pulverized Mineral Processing estimates that 0.0012 kg of respirable dust is
released per Megagram (Mg) of material processed. In this assessment, it is
conservatively assumed that the processor will be running at its maximum capacity
24 hours a day. The maximum capacity of the processor is assumed to be 80
metric tons/hr.
hrkgMgkghrMgteEmissionRa /096.0/0012.0/80
0.096kg PM10 released per hour is equivalent to an emission rate of 0.0267 g/s of
respirable dust released.
3) Stockpiling of Processed Materials: PM10 emission rate from the handling and
stockpiling of processed materials was derived following USEPA AP-42, Section
13.2.4 which provides equations and standard factors for estimating emission rates
for aggregate handling and storage. Dust emissions addressed by these equations
include several points in the storage cycle such as material loading onto the pile,
disturbances by strong wind currents, loadout from the pile and the movement of
loading equipment in the storage pile area. Wind erosion of aggregate storage piles
were also addressed with standard USEPA AP-42 equations presented in Section
13.2.5, Industrial Wind Erosion. These two emission rates were summed to
conservatively estimate the dust emission rate from the stockpiling of processed
materials.
Emission rate for Aggregate Handling and Storage Pile
Emission rate for Aggregate Handling and Storage Pile is estimated by the following
equation:

Limited HHRA Section: 3 Date: July 2010
3-5
E = k(0.0016) ((U/2.2)1.3 / (m/2)1.4)
Parameters Value Reference E: PM10 emission rate (kg/Mg) calculated
U: mean wind speed (m/s) 63.7 site-specific
M: material moisture content (%) 15 site-specific k: particle size multiplier .35 for PM10
E = 4.56E-05 kg/Mg
Again it is assumed that the material handled would be equal to the maximum
processing rate of the fine processor (80 metric tons/hr). The area of the storage
pile is assumed to be approximately 5,000 ft2 or 464.515 m2.
2
2/00000785.0
515.464
/0000456.0/80mhrkg
m
MgkghrMgteEmissionRa
The area emission rate for Aggregate Storage and Handling of 7.85E-06 kg/hr-m2 is
equivalent to 2.17E-06 g/s-m2
Emission Rate for Industrial Wind Erosion
N
iiPkEF
1
*)*(25*)*(58 2tt uuuuP
Parameters Value Reference EF: Emission Factor (g/m2-yr) calculated
ut: threshold friction velocity (m/s) 1.12 site-specific
u: 0.053 * fastest mile (m/s) 1.59 site-specific P: erosion potential (g/m2) 24.6 site-specific
N: disturbances 365 site-specific
k: particle size multiplier .5 for PM10
EF = 1.42E-04 g/s-m2

Limited HHRA Section: 3 Date: July 2010
3-6
The Emission Rates for Aggregate Storage and Handling and for Industrial Wind Erosion
were summed to have to total Emission Rate for the Stockpiling of processed materials of
1.44E-04 g/s-m2
3.2 Fugitive Dust Concentration
The SCREEN3 air dispersion model (Version 96043) (USEPA 1995) was used to predict
off-site ambient PM10 concentrations for various scenarios based on the calculated
emission rates for both current operations and future recycling operations as described in
the previous section. SCREEN3 determines 1-hour maximum chemical concentrations
under worst-case wind conditions. It assumes that fugitive dust blows in the direction of the
receptor continuously, 100% of the time. The model does not allow for an adjustment to be
made to the percentage of time wind blows in the direction of the residents over a longer
averaging time. To account for this, U.S. EPA states that annual average PM10
concentrations should be calculated by multiplying the 1-hour maximum concentration by a
factor of 0.08 (USEPA 1992). However, this assessment utilized a Hawaii-specific value of
0.2 (Personal Communication with Dr. Barbara Brooks, HEER Office). 0.2 is a factor which
considers Hawaii-specific wind and meteorological conditions and is 2.5 times more health
protective than the USEPA factor.
The source area for current operations (stockpiling of bulk material, separation of
recyclables and coarse shredding of bulk material) were modeled as ground-level sources
of 45 x 45 square meters (0.5 acre). 0.5 acres is a USEPA Region 9 default source size as
well as the approximate area of current processing activities. Likewise, source areas for
mining activities and stockpiling of fine shredded material were also conservatively
assumed to be 45 x 45 square meters. Actual area for these operations would be much
less. The source for the proposed fine shredder was assumed to be a point source rather
than area source because dust emissions are limited to a finite and defined space.
SCREEN3 Areas Source calculations were based on the following assumptions:
Parameter Value Source type areaSource release height 0.1 mLength of larger side for area 45 mLength of smaller side of area 45 m

Limited HHRA Section: 3 Date: July 2010
3-7
Receptor height above ground 1.8 mUrban or Rural Area RuralMeteorology
Stability class 1 – Unstable/Turbulent Anemometer height wind 2.8 m/s
SCREEN3 Point Source calculations were based on the following assumptions:
Parameter Value Source type pointSource release height 1 mStack inside diameter 1 mExit velocity 0 m/sStack gas exit temperature 293KAmbient air temperature 293KReceptor height above ground 1.8 mUrban or Rural Area RuralMeteorology
Stability class 1 – Unstable/Turbulent Anemometer height wind 2.8 m/s
As noted above, air dispersion modeling was conducted for both dust generated in current
processing activities and from future recycling operations.
Fugitive Dust Concentrations from Current Operations
1. SCREEN3 air dispersion modeling results for current processing activities resulted
in a maximum respirable dust concentration of 0.1953 ug/m3 at a distance of 1/4
mile away from dust generating activities based on a calculated emission rate of
5.72E-06 g/s-m2. After applying the 0.2 adjustment factor, the annual average
respirable dust concentration is 0.039 ug/m3 at a distance of 1/4 mile away from
dust generating activities.
Fugitive Dust Concentrations from Future Recycling Activities
2. SCREEN3 air dispersion modeling results for mining operations result in a
maximum respirable dust concentration of 0.2704 ug/m3 at a distance of 1/4 mile
away from dust generating activities. After applying the 0.2 adjustment factor, the
annual average respirable dust concentration is 0.05408 ug/m3 at a distance of 1/4
mile away from dust generating activities.
3. SCREEN3 air dispersion modeling results for the fine shredding of materials
resulted in a maximum respirable dust concentration of 0.4540 ug/m3 at a distance
Limited HHRA Section: 3 Date: July 2010
3-8
of 1/4 mile away from dust generating activities. After applying the 0.2 adjustment
factor, the annual average respirable dust concentration is 0.0908 ug/m3 at a
distance of 1/4 mile away from dust generating activities.
4. SCREEN3 air dispersion modeling results for the stockpiling of processed material
resulted in a maximum respirable dust concentration of 1.135 ug/m3 at a distance of
1/4 mile away from dust generating activities. After applying the 0.2 adjustment
factor, the annual average respirable dust concentration is 0.227 ug/m3 at a
distance of 1/4 mile away from dust generating activities.
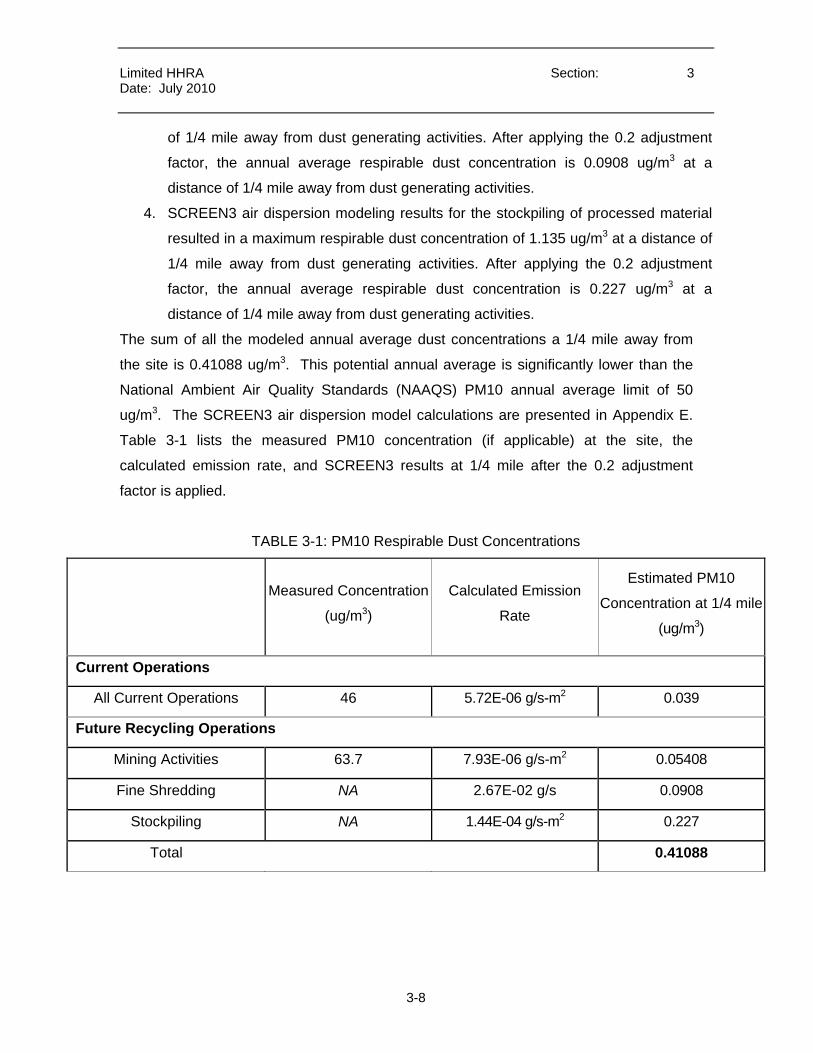
The sum of all the modeled annual average dust concentrations a 1/4 mile away from
the site is 0.41088 ug/m3. This potential annual average is significantly lower than the
National Ambient Air Quality Standards (NAAQS) PM10 annual average limit of 50
ug/m3. The SCREEN3 air dispersion model calculations are presented in Appendix E.
Table 3-1 lists the measured PM10 concentration (if applicable) at the site, the
calculated emission rate, and SCREEN3 results at 1/4 mile after the 0.2 adjustment
factor is applied.
TABLE 3-1: PM10 Respirable Dust Concentrations
Measured Concentration
(ug/m3)
Calculated Emission
Rate
Estimated PM10
Concentration at 1/4 mile
(ug/m3)
Current Operations
All Current Operations 46 5.72E-06 g/s-m2 0.039
Future Recycling Operations
Mining Activities 63.7 7.93E-06 g/s-m2 0.05408
Fine Shredding NA 2.67E-02 g/s 0.0908
Stockpiling NA 1.44E-04 g/s-m2 0.227
Total 0.41088

Limited HHRA Section: 4 Date: July 2010
4-1
4.0 ESTIMATION OF CHEMICAL CONCENTRATIONS IN BULK MATERIAL AND AT
RECEPTOR LOCATIONS
In order to estimate the concentration of chemicals transported by fugitive dust to resident
locations it was first necessary to estimate the respirable dust concentration at receptor
locations. This process required the derivation of emission rates for the current operations
and each of the activities to take place during future recycling operations (described in
Section 3 above). Estimated dust concentrations as determined by the SCREEN3 are then
multiplied by the estimated chemical concentrations in bulk material to estimate the
concentration of Chemicals of Potential Concern in the fugitive dust.
4.1 Estimation of chemical concentration in bulk material
Exposure point concentrations for constituents derived from recycling operations were
estimated using all relevant analytical data collected during the investigation. ERA
collected three (3), five (5) – gallon buckets of bulk C&D material representative of material
accepted by the landfill. Representative material included but was not limited to, painted
and unpainted wood, untreated wood, Copper/Chrome/Arsenic (CCA) treated wood,
drywall, insulation, and small amounts of metal (e.g. nails), concrete, glass, plastics, etc. In
an effort to ensure that the sample submitted to the laboratory included representative
quantities of CCA treated wood, known samples of CCA treated wood were included in the
samples and submitted to the laboratory. Multiple waste stream analyses have been
performed by third parties at PVT Landfill. A waste stream analysis was performed by
Cascadia Consulting Group for the State of Hawaii Department of Business, Economic
Development, & Tourism in 2007 through 2009 that included two summer and two winter
sampling events. A separate study conducted by Element Environmental evaluated two
sets of waste streams in 2010. Appendix G provides the results of the independent 3rd
party studies. Based on these studies, this risk assessment assumes that CCA treated
wood comprises 2.5% of the PVT Landfill waste stream. In an effort to ensure that the
representative fraction of CCA treated wood was included in the bulk sample analyzed by
the laboratory, PVT Landfill required the laboratory to spike the bulk sample with known
quantities of CCA treated wood.

Limited HHRA Section: 4 Date: July 2010
4-2
Samples were sent to a certified laboratory for total RCRA 8 metals analyses as well as
RCRA 8 and pentachlorophenol TCLP and SPLP analyses. Results are provided in Table
4-1. TCLP and SPLP results are used to determination of the leachable potential of
stockpiled processed material. All TCLP and SPLP results were below applicable detection
limits or below hazardous waste determination limits. No further discussion of TCLP and
SPLP results is required.
Table 4-1: Analytical Results
Results (mg/kg)
Arsenic Barium Cadmium Chromium Lead Mercury Selenium Silver
HTB0121-01 233 11 5.5 299 31.6 0.0477 11 5.5
HTB0121-02 111 20.4 4.955 148 9.9 0.0385 9.9 4.955
HTB0121-03 122 10.15 5.05 161 10.15 0.0613 10.15 5.05
Max 233 20.4 5.5 299 31.6 0.0613 11 5.5
Italics indicate samples that were below detection limits. A value of ½ the detection limit is used as a surrogate.
Reasonable Maximum Exposure (RME) values were derived in accordance with USEPA
guidance (USEPA, 2002a). Due to limited sampling, the maximum value detected was
conservatively used to represent concentrations in bulk material. Laboratory data sheets
are presented in Appendix B. In calculating exposure point concentrations, a value equal
to one-half the limit of detection reported by the laboratory was used as a surrogate
concentration for those constituents that were not detected in a particular sample as
specified by U.S. EPA (1989a).
As there is no USEPA-verified Reference Concentration for lead, it was evaluated
separately from the other COPCs. The maximum concentration of lead detected in the
samples was 31.6 mg/kg. This is below all applicable regulatory levels including the HDOH
EAL of 200 mg/kg for residential soil. In addition there were no detectable concentrations
of leachable lead in the TCLP analysis; therefore, lead was not carried forward for
additional analysis.
4.2 Estimation of Chemical Concentrations at Receptor Locations

Limited HHRA Section: 4 Date: July 2010
4-3
Estimation of COPC Concentrations in Dust at Offsite Locations
This assessment utilized a similar approach used in a study conducted by the HDOH to
assess human health risks from soil derived fugitive dust from PVT Landfill (AMEC, 2005).
Respirable particulate data was used in conjunction with bulk material analytical data to
estimate COPC concentrations at specific receptor locations in the adjacent community.
Estimated dust concentrations as determined by the SCREEN3 were multiplied by the
COPC concentrations assumed present in the bulk material to estimate the concentration
of COPCs in fugitive dust. Current operations as well as each future recycling activity
were modeled independently and a separate exposure point concentration was calculated
from each operation. All dust generated was assumed to be operation-derived. Table 4-2
summarizes the calculated COPC Exposure Point Concentrations at potentially affected
residential communities approximately 1/4 mile away from dust generating activities.
TABLE 4-2: Fugitive Dust COPC Exposure Point Concentrations from On-site Activities
Constituent
Current
Operations
Concentration
(mg/m3)
Mining
Activities
(mg/m3)
Fine
Processing
(mg/m3)
Stockpile
Storage
(mg/m3)
METALS
Arsenic 9.09E-09 1.26E-08 2.12E-08 5.29E-08
Barium 7.96E-10 1.10E-09 1.85E-09 4.63E-09
Cadmium 2.15E-10 2.97E-10 4.99E-10 1.25E-09
Chromium VI* 4.66E-10 6.47E-10 1.09E-09 2.71E-09
Lead 1.23E-09 1.71E-09 2.87E-09 7.17E-09
Mercury, Divalent 2.39E-12 3.32E-12 5.57E-12 1.39E-11
Selenium 4.29E-10 5.95E-10 9.99E-10 2.50E-09
Silver 2.15E-10 2.97E-10 4.99E-10 1.25E-09
* This assessment assumed that hexavalent chromium exists at 4% of the total chromium detected, which is the upper end value of speciation studies which detected hexavalent chromium from disposed CCA treated wood samples in concentrations of approximately 0.7 to 4% of the total chromium. Additional details provided in Section 5.1

Limited HHRA Section: 5 Date: July 2010
5-1
5.0 ESTIMATION OF CANCER RISKS AND NON-CANCER HAZARDS
A human health risk assessment was conducted to quantify potential risks to adult and
children residents who might breathe site-related chemicals associated with current and
future recycling activities. Chemicals of Potential Concern (COPCs) included RCRA 8
metals. Residential receptors were evaluated assuming they would be exposed to recycling
derived dust via the inhalation pathway only.
As described in Section 4 above, respirable dust was modeled to specific receptor locations
assumed 1/4 mile away from recycling operations using emission rates estimated from
active and real-time air monitoring or via use of USEPA AP-42 default emission rates for
industrial processes. The air dispersion model, SCREEN3 conservatively estimates
maximum ground-level concentrations of respirable dust at specific set residential receptor
points. Respirable particulate data is used in conjunction with analytical data (of bulk
material) to estimate COPC concentrations at specific receptor locations (in this case 1/4
mile away from current and future recycling activities). Potential health risks via the
inhalation pathway are then estimated for adult and child residents who reside
approximately 1/4 mile from dust generating activities.
The phases of the risk process are described herein. The protocol adopted is consistent
with the approach recommended by the National Research Council (NRC). The NRC,
established by the National Academy of Sciences (NAS) to further scientific knowledge and
to advise the federal government, has established a four-step paradigm for conducting
health-based risk assessments (NAS 1983). This paradigm has been adopted by USEPA
as well as many federal and state regulatory agencies. In accordance with the NRC
recommendations, this risk assessment is organized into the following four steps:
Hazard Identification;
Toxicity Assessment;
Exposure Assessment; and
Risk Characterization.
Each of these steps is detailed in the sections below.
Limited HHRA Section: 5 Date: July 2010
5-2
5.1 Hazard Identification
In this step, compounds assumed to be of concern are selected for inclusion in the
quantitative risk assessment. These compounds are designated as COPCs. COPCs for
this investigation include arsenic, barium, cadmium, chromium, lead, mercury, selenium
and silver. Site-specific valence state of chromium in CCA treated wood was not available.
Based on historic speciation studies, the majority of hexavalent chromium present in CCA
treatment products is reduced to trivalent chromium during the fixation process (Dahlgren
and Hartford 1972). The chemicals within CCA treatment products react with the wood
fibers which affixes the products to the wood. During this process hexavalent chromium is
reduced to low toxicity trivalent chromium (Ung 2004). Speciation studies indicate that both
new and weathered CCA treated wood contain hexavalent chromium in concentrations of
approximately 0.7 to 4% of the total chromium. Shredding of CCA treated wood is not
anticipated to alter the valence state of chromium. To be conservative, this assessment
assumed that hexavalent chromium exists at 4% of the total chromium detected, which is
the upper end value of detected hexavalent chromium from CCA treated wood samples
(Song 2005).
5.2 Toxicity Assessment
The USEPA states that the purpose of the Toxicity Assessment is to “weigh available
evidence regarding the potential for particular contaminants to cause adverse effects in
exposed individuals and to provide, where possible, an estimate of the relationship
between the extent of exposure to a contaminant and the increased likelihood and/or
severity of adverse effects” (USEPA 1989a).” In essence, the Toxicity Assessment can
also be described as a Dose-Response Assessment. A Dose-Response Assessment is
used to identify both the types of adverse health effects a COPC may potentially cause, as
well as the relationship between the amount of COPCs to which receptors may be exposed
(dose) and the likelihood of an adverse health effect (response). The USEPA characterizes
adverse health effects as either carcinogenic or noncarcinogenic and dose-response
relationships are defined for oral and inhalation routes of exposure. Dermal exposure
toxicity criteria are estimated based on oral criteria. The results of the toxicity assessment,
when combined with the results of the exposure assessment provide an estimate of
potential risk.

Limited HHRA Section: 5 Date: July 2010
5-3
The most current USEPA-verified dose-response criteria were used in this assessment.
Dose-response information was obtained from the following sources, in order of priority:
Hawaii Department of Health; Evaluation of Environmental Hazards at Sites
with Contaminated Soil and Groundwater; EHE Guidance (HDOH, 2009)
U.S. EPA's Integrated Risk Information System (IRIS) (USEPA, 2010a);
U.S. EPA’s Regional Screening Level Tables (USEPA, 2010b)
In the case of lead, there is no U.S. EPA-verified Reference Dose. However, because lead
was detected at concentrations well below the Hawaii Department of Health Environmental
Action Level (EAL), and U.S. EPA Regional Residential Screening Levels (RSLs), it was
not considered for further quantitative analysis.
Noncarcinogenic dose-response information for both oral and dermal routes of exposure
were not used as this assessment as this assessment only characterizes inhalation risks to
offsite receptors. To evaluate inhalation exposure, U.S. EPA has derived reference
concentrations (RfCs) for certain compounds. For use in estimating noncarcinogenic,
these RfCs (in units of mg/m3) are compared to an Exposure Concentration (EC) calculated
based on the estimated Exposure Point Concentration. This conversion allows the risk
assessment to consider receptor-specific exposure duration described in the exposure
assessment.
To evaluate carcinogenic risks from oral exposures, carcinogenic dose-response values for
inhalation exposures are generally provided as inhalation unit risk (IUR) values expressed
in terms of (µg/m3)-1. Carcinogenic Risk is estimated by multiplying this IUR value by the
Exposure Concentration. Dose-Response information used in this assessment is listed in
Table 5-1.

Limited HHRA Section: 5 Date: July 2010
5-4
TABLE 5-1: Dose-Response Information
Inhalation Unit
Risk Factor
(ug/m3)-1
Inhalation RfC
(ug/m3) Constituent
METALS
Arsenic 4.30E-03 a b 3.00E-02 a
Barium NA 5.00E-01 a c
Cadmium 1.80E-03 a b 1.00E-02 c
Chromium VI 8.40E-02 a c 1.00E-01 a b
Lead NA NA
Mercury, Divalent NA 3.00E-01 b
Selenium NA 2.00E+01 c
Silver NA NA
NA - Not Applicable (a) Hawaii Department of Health EALs (2009) (b) U.S. EPA (2010). IRIS (c) RSL Table (2010)
5.3 Exposure Assessment
In the Exposure Assessment, the magnitude and frequency of a receptors' potential
exposure to COPCs is quantified. Exposure factors including length and duration of
exposure and potential absorption adjustment factors are designated during this phase of
work. Other receptor specific factors such as ingestion, inhalation, and body weight are
usually quantified in this section but not required for this assessment. Based on the results
of above-described tasks, the final phase of the exposure assessment is the derivation of
exposure point concentrations and the calculation of the Inhalation Exposure
Concentration. The results of the exposure assessment are described in the following
subsections.
5.3.1 Identification of Receptors
Potential human receptors for this investigation are adult and children residents who may
breathe fugitive dust containing COPCs. Adult and child residents were identified based on
characteristics of the site and surrounding area and the specific concerns of the
neighboring community.
5.3.2 Identification of Potential Exposure Pathways

Limited HHRA Section: 5 Date: July 2010
5-5
Potential exposure pathways are the mechanisms by which the receptors in the study area
may be exposed to compounds emitted current operations and future mining and recycling
activities. According to U.S. EPA (1989), four elements must be present in order for a
potential human exposure pathway to be complete:
a source and mechanism of compound release to the environment ;
an environmental transport medium;
an exposure point, or point of potential contact with the potentially impacted
medium; and
a receptor with a route of exposure at the point of contact.
The exposure pathways examined in this risk assessment include the inhalation of fugitive
dust generated from current operations and future mining and recycling operations.
5.3.3 Identification of Exposure Scenarios
Exposure scenarios describe the frequency and magnitude of exposure to chemicals as
they relate to specific receptors and exposure pathways. The exposure scenarios
evaluated in this risk assessment include the following:
Resident Adults presumed to be exposed to contaminants via fugitive dust
generation. Recycling Operations are assumed to occur 24 hrs/day for a 24
year period;
Resident Children presumed to be exposed to contaminants via fugitive dust
generation. Recycling Operations are assumed to occur 24 hrs/day for a 6
year period;
The two residential scenarios are summed to create a total 30 year residential scenario
including 6 years as a child and 24 years as an adult.
5.3.4 Exposure Concentration Calculations
This section describes the equations and assumptions used to evaluate the concentration
of contaminants to which a receptor may be exposed. The equation used to calculate the

Limited HHRA Section: 5 Date: July 2010
5-6
Exposure Concentration (EC) adjusts the Exposure Point Concentration by receptor
specific exposure time factors and averaging over the period of time for which the receptor
is assumed to be exposed. The Exposure Concentration for each compound is compared
to the noncarcinogenic reference concentration for that compound in order to estimate the
potential noncarcinogenic hazard index due to exposure to that compound via inhalation.
For compounds with potential carcinogenic effects, the Exposure Concentration is
calculated by averaging the assumed chemical concentration over the receptor's entire
lifetime (assumed to be 70 years). The Exposure Concentration for each compound is
combined with the cancer Inhalation Unit Risk for that compound in order to estimate the
potential carcinogenic risk due to exposure to that compound via inhalation.
The equations for estimating the Exposure Concentration (both lifetime and chronic) are
presented in the following subsections. The exposure parameters used in each potential
exposure pathway are also discussed in the following subsections.
Estimation of Potential Exposure via Inhalation
Calculations of potential risk resulting from the inhalation of the respirable fraction of
particulates in air (i.e., particles < 10 pm in diameter) are presented in Appendix F. The
equation used to calculate the Exposure Concentration due to inhalation exposure is as
follows:
H
GFEDCBA
where:
A = Exposure Concentration (mg/m3)
B = Compound Concentration in Bulk Material (mg/kg)
C = Concentration of Respirable Particulates in Air (mg/m3)
D = Exposure Time (hr/day)
E = Exposure Frequency (days/year)
F = Exposure duration (years)
G = Inhalation Absorption Adjustment Factor (unitless)
H = Averaging Time (hours).

Limited HHRA Section: 5 Date: July 2010
5-7
Chemical Concentration in Bulk Material
The data used in this risk assessment are provided in Appendix B. Concentration in the
processed material were assumed to be equal to the maximum value detected in the bulk
material samples (Table 4-1).
Concentration of Respirable Particulates in Air
Respirable particulate concentrations in air at offsite locations for the residential scenarios
were calculated in the SCREEN3 analysis as detailed in Section 3. It was assumed that
100% of the respirable particles were derived from onsite operations.
Exposure Time and Frequency
Assuming that dust is generated only during onsite operations, offsite residents would be
exposed to contaminants only for the duration of these operations. However, for this
assessment it was assumed that Recycling Operations are occurring 24 hrs/day for the
entire exposure duration period. Accordingly, offsite adult and children residents were also
assumed to be continuously exposed to fugitive dust generated from the site 24 hours/day,
350 days/year.
Exposure Duration
As previously described, the risk assessment assumes that potential offsite residential
receptors are exposed for a 30 year period. This 30 year duration is split between 6 years
as a child and 24 years as an adult.
Absorption Adjustment Factors
Absorption Adjustment Factors were assumed to be 100% via the inhalation route of
exposure for all COPCs.
Averaging Time
The Exposure Concentration of COPCs used to calculate noncarcinogenic risks must be
averaged over the duration which the receptor is assumed to be exposed (USEPA 1989).
Therefore, the averaging time for noncarcinogenic Exposure Concentration is equal to the
Exposure Duration X 365 days/year X 24 hours/day.

Limited HHRA Section: 5 Date: July 2010
5-8
The Exposure Concentration used to determine potential carcinogenic effects, however,
must be averaged over the entire lifetime (70 years), regardless of the length of time which
the receptor is assumed to be exposed (USEPA 1989). Therefore, the averaging time for
carcinogenic Exposure Concentration is equal to the 70 years X 365 days/year X 24
hours/day.
TABLE 5-2: Exposure Assumptions
Receptor Parameter (units) Value
Adult Resident Exposure Duration (hr/d) 24
Exposure Frequency (d/y) 350
Exposure Period (y) 24
Averaging Period - Lifetime (hr) 613,200
Averaging Period - Chronic Noncancer (hr) 210,240
Fraction from Site (unitless) 1
Child Resident Exposure Duration (hr/d) 24 Exposure Frequency (d/y) 350
Exposure Period (y) 6
Averaging Period - Lifetime (hr) 613,200
Averaging Period - Noncancer (hr) 52,560
Fraction from Site (unitless) 1
5.4 Risk Characterization
The Risk Characterization combines the results of the Exposure Assessment with the
results of the Toxicity Assessment to derive quantitative estimates of the potential for
adverse health effects to occur as a result of potential exposure to processed material
derived dust. The potential for both noncarcinogenic and carcinogenic effects are estimated
for each receptor for each potential exposure pathway identified in the Exposure
Assessment.
The risk characterization is the step in the risk assessment process that combines the
results of the exposure assessment and the toxicity assessment for each compound of
concern in order to estimate the potential for carcinogenic and noncarcinogenic human

Limited HHRA Section: 5 Date: July 2010
5-9
health effects from chronic exposure to that compound. This section summarizes the
results of the risk characterization for each receptor evaluated in the risk assessment.
5.4.1 Noncarcinogenic Risk Characterization
The potential for exposures to COPCs to result in adverse noncarcinogenic health effects is
estimated for each receptor by comparing the Exposure Concentration for each compound
with the Reference Concentration for that compound. The resulting ratio, which is unitless,
is known as the Hazard Quotient (HQ) for that compound. The HQ is calculated using the
following formula:
C
BA
where:
A = Hazard Quotient (unitless);
B = Exposure Concentration (ug/m3); and
C = Reference Concentration (ug/m3).
When the Hazard Quotient for a given compound does not exceed 1, the Reference
Concentration has not been exceeded, and no adverse noncarcinogenic health effects are
expected to occur as a result of exposure to that compound via that route. The HQs for
each compound are summed to yield the Hazard Index (HI) for that pathway. An HI is
calculated for each receptor for each pathway by which the receptor is assumed to be
exposed. A Total Hazard Index for a chemical is then calculated for each receptor by
summing the pathway-specific HIs. A Total HI for a chemical that does not exceed 1 for a
given receptor indicates that no adverse noncarcinogenic health effects are expected to
occur as a result of that receptor's potential exposure to a chemical in the environmental
media. TheHIs calculated for this assessment are presented in Table 5-3. All HIs were
lower than the U.S. EPA and HDOH criterion goal of 1, and therefore all were below the
regulatory level of concern.

Limited HHRA Section: 5 Date: July 2010
5-10
TABLE 5-3: Noncarcinogenic Risk
RECEPTOR HAZARD QUOTIENTS
Current
Operations
Mining
Activities
Fine
Processing
Stockpile
Storage Total
Adult Resident, inhalation exposure 6.E-04 9.E-04 1.E-03 4.E-03 7.E-03
Child Resident, inhalation exposure 6.E-04 9.E-04 1.E-03 4.E-03 7.E-03
5.4.2 Carcinogenic Risk Characterization
The purpose of carcinogenic risk characterization is to estimate the likelihood, over and
above the background cancer rate, that a receptor will develop cancer in his or her lifetime
as a result of facility-related exposures to COPCs in various environmental media. This
likelihood is a function of the Exposure Concentration and the Inhalation Unit Risk (IUR)
Factor for that compound. The relationship between the Excess Lifetime Cancer Risk
(ELCR) and the Exposure Concentration of a compound may be expressed by the
equation:
where:
A = Excess Lifetime Cancer Risk (unitless);
B = Inhalation Unit Risk ((ug/m3)-1); and
C = Exposure Concentration (ug/m3).
The product of the IUR and the EC is unitless, and provides an estimate of the potential
carcinogenic risk associated with a receptor's exposure to that compound via that pathway.
ELCRs are calculated for each potentially carcinogenic compound. For each receptor, the
ELCRs for each pathway by which the receptor is assumed to be exposed are calculated
by summing the potential risks derived for each compound. A Total Excess Lifetime Cancer
Risk is then calculated by summing the pathway-specific ELCRs. The ELCRs calculated for
this assessment are presented in Table 5-4. All risks to the offsite residential receptors
were substantially lower than the USEPA and HDOH regulatory point of departure level of
concern of 1 E-06.
CBA

Limited HHRA Section: 5 Date: July 2010
5-11
TABLE 5-4: Carcinogenic Risk
RECEPTOR Excess Lifetime Cancer Risk
Current
Operations
Mining
Activities
Fine
Processing
Stockpile
Storage Total
Adult Resident, inhalation exposure 2.E-08 3.E-08 4.E-08 1.E-07 2.E-07
Child Resident, inhalation exposure 5.E-09 7.E-09 1.E-08 3.E-08 5.E-08
Total Residential Scenario 2.E-08 3.E-08 6.E-08 1.E-07 3.E-07
TABLE 5-5: Final Risk Results
Hazard Index Lifetime Cancer Risk
Child Adult Child Adult
Current Process 3.E-04 3.E-04 6.E-09 3.E-08
Mining 4.E-04 4.E-04 9.E-09 4.E-08
Fine Shredding 7.E-04 7.E-04 2.E-08 6.E-08
Stockpiling 2.E-03 2.E-03 4.E-08 2.E-07
TOTAL 3.E-03 3.E-03 7.E-08 3.E-07
Total Residential Cancer Risk 3.E-07

Limited HHRA Section: 6 Date: July 2010
6-1
6.0 CONCLUSIONS
This risk assessment was performed to assess the human health impacts associated with
the proposed modification to the PVT Landfill permit to include segregation and processing
of C&D material for recycling initiatives. Impacts assessed included the following:
potential for airborne dust impacts to residential communities due to the recycling
program
potential for health impacts to PVT Landfill recycling program workers
potential leaching impacts of processed materials
In total, potential human health risk was assessed for dust generated by bulk material
mining and delivery, segregation of combustibles and recyclables, coarse and fine
shredding of combustibles and handling and storage of processed materials. ERA
considers this a reasonable “cradle to grave” approach to assess cumulative risk from
current landfill and future recycling operations. To evaluate worker risks, dust and metal
concentrations were compared to OSHA PELS. Potential leaching impacts of processed
materials was conducted via SPLP and TCLP sampling of the bulk material to determine
leaching characteristics of the materials in question. Results of the Human Health Risk
Assessment for offsite residential receptors resulted in Human Health Risks well below all
applicable regulatory levels of concern. Both residential scenarios resulted in a noncancer
hazard index of 0.003, well below the regulatory level of concern of 1. The total residential
Excess Lifetime Cancer Risk (including 6 years as a child, and 24 years as an adult) was
determined to be 3E-07 or a 3 in 10,000,000 probability that a resident will develop cancer
in his or her lifetime, over and above the background cancer rate, as a result of potential
Site-related exposures to COPCs in the air. This is well below the point-of-departure
regulatory level of concern for residential receptors of 1E-06 or 1 in 1,000,000. The
residential scenario assumed migration of fugitive dust (24 hrs/day) to residential areas
located approximately ¼ mile away from dust generating activities. In reality, the majority
of recycling activities (e.g., processing of material) will only occur during working hours.
The recycling program does not pose a potentially significant threat to human health and
the environment. The chemical driver responsible for the majority of the carcinogenic risk

Limited HHRA Section: 6 Date: July 2010
6-2
and non-carcinogenic hazard was arsenic potentially present in the bulk material. The
inhalation of fugitive dust containing arsenic was responsible for nearly 100% of the
assessment’s carcinogenic risks. It should be noted that known quantities of arsenic were
added to the bulk material samples evaluated by the laboratory. Actual concentrations of
arsenic are anticipated to be much lower based on waste acceptance records performed by
3rd parties and provided by PVT. To provide an extra measure of safety, ERA performed
the assessment assuming that bulk material contained up to 932 mg/kg arsenic and 47.8
mg/kg hexavalent chromium. This is 4 times the amount of arsenic and chromium detected
in the samples with added arsenic. All other exposure assumptions being identical, cancer
and noncancer risks were still below the HDOH regulatory levels of concern for residential
scenarios.
Limited HHRA Section: 7 Date: July 2010
7-1
7.0 UNCERTAINTY ANALYSIS
Within any of the four steps of the risk assessment process, assumptions must be made
due to a lack of absolute scientific knowledge. Some of the assumptions are supported by
considerable scientific evidence, while others have less support. Every assumption
introduces some degree of uncertainty into the risk assessment process. Conservative
assumptions are made throughout the risk assessment to ensure that the health of workers
and local residents are protected. Therefore, when all of the assumptions are combined, it
is much more likely that actual risks, if any, are overestimated rather than underestimated.
7.1 Hazard Identification
During the Hazard Identification step, compounds are selected for inclusion in the
quantitative risk assessment. Eight metals known to be present in processed material were
selected as COPCs. This assessment was not exhaustive and did not include all
chemicals and compounds (e.g., pentachlorophenol, dioxins, etc.) that may be disposed of
at the landfill and subsequently processed for recycling. Conversely, this assessment was
extremely health protective in determining the magnitude of chemical concentrations
present in PVT bulk material. Specifically, the evaluation assumed that a specific
proportion of waste processed for recycling would be CCA treated wood. To ensure that
the correct ratio of arsenic, chrome and copper were accounted for, known samples of CCA
treated wood was added (spiked) to the samples analyzed by the laboratory. Actual
concentrations of CCA treated wood are anticipated to be less.
ERA did not perform specific analysis on different types of treated wood per HDOH
recommendation. As noted, ERA prepared a representative composite sample of mixed
wood types and performed analysis on these samples. ERA understands performing
analytical tests on specific types of treated wood, would allow for calculations to determine
maximum amount of specific wood types allowed in the feedstock material. This method
however was deemed inappropriate. Analysis of a single treated wood type is not
appropriate when a mixture of wood types constitutes the feedstock as may be present in
PVT materials. Such an analysis would not take into consideration cumulative health
effects of chemicals in mixed feedstock. To provide an extra measure of safety, ERA
performed the assessment assuming that bulk material contained up to 932 mg/kg arsenic
and 49.8 mg/kg hexavalent chromium, 4 times the amount of arsenic and chromium
Limited HHRA Section: 7 Date: July 2010
7-2
detected in the spiked samples. Estimated risks were still below applicable regulatory
levels of concern.
Although a Batch Test Leaching Model evaluation was not performed, this assessment did
evaluate the leaching potential of bulk material stored in stockpiles prior to processing.
TCLP and SPLP results were below HDOH leaching and hazardous waste determination
criteria.
7.2 Toxicity Assessment
Dose-response values are usually based on limited toxicological data. For this reason, a
margin of safety is built into estimates of both carcinogenic and noncarcinogenic risk, and
actual risks are lower than those estimated. The two major areas of uncertainty introduced
in the dose-response assessment are: (1) animal to human extrapolation; and (2) high to
low dose extrapolation.
Human dose-response values are often extrapolated, or estimated, using the results of
animal studies. Extrapolation from animals to humans introduces a great deal of uncertainty
in the risk assessment because in most instances, it is not known how differently a human
may react to the chemical compared to the animal species used to test the compound. The
procedures used to extrapolate from animals to humans involve conservative assumptions
and incorporate several uncertainty factors that overestimate the adverse effects
associated with a specific dose. As a result, overestimation of the potential for adverse
effects to humans is more likely than underestimation.
Predicting potential health effects from the facility emissions requires the use of models to
extrapolate the observed health effects from the high doses used in laboratory studies to
the anticipated human health effects from low doses experienced in the environment. The
models contain conservative assumptions to account for the large degree of uncertainty
associated with this extrapolation (especially for potential carcinogens) and therefore, tend
to be more likely to overestimate than underestimate the risks.
Additional uncertainty could be introduced with regards to the toxicity of chromium in the
bulk material sampled. Valence state of chromium was not available and based upon
historical information regarding the valence proportion present in discarded CCA treated
wood. Speciation studies indicate that both new and weathered CCA treated wood contain

Limited HHRA Section: 7 Date: July 2010
7-3
hexavalent chromium in concentrations of approximately 0.7 to 4% of the total chromium.
To be conservative, this assessment assumed that hexavalent chromium exists at 4% of
the total chromium detected, which is the upper end value of detected hexavalent
chromium from CCA treated wood samples (Song 2005).
This risk assessment also took a very conservative approach regarding the bioaccessible
fraction of COPCs available to be absorbed by the body. These relative absorption factors
(RAFs) estimate the amount a chemical that is absorbed by the body through different
routes of exposure. Hawaii Department of Health EAL Table and U.S. EPA RSL Table
have recommended dermal and gastro-intestinal absorption fractions for different
compounds. For the inhalation pathway the most conservative default value of 1 was
assumed for these fractions meaning the entire concentration of chemicals would be
available for absorption by the body. More realistic bioaccessible fractions for this pathway
could be derived and would most likely reduce the portrayed risk in this assessment.
7.3 Exposure Assessment
During the exposure assessment, exposure point concentrations are estimated, and
exposure doses are calculated. Exposure point concentrations are the estimated
concentrations of compounds to which humans may be exposed. Because ambient air
chemical concentrations do not exist at the remote receptor locations at levels which would
most likely exceed analytical detection limits, and direct measurement would be
confounded by non-relevant sources, exposure point concentrations were estimated using
models containing numerous assumptions, such as the amount of compound released from
the site, the dispersion of the compound in air and its fate and transport in the environment,
and the location of people potentially exposed to released compounds. Once the
concentrations in air have been predicted, the calculation of human exposure and dose
involves making additional assumptions. The major sources of uncertainty associated with
these assumptions are discussed below.
7.3.1 Estimation of Particulate Emission Factors
Offsite concentrations of COPCs for this risk assessment were either derived from ambient
air-monitoring events or by emission studies via USEPA Office of Air Quality Planning and
Standards, AP-42. During active dust monitoring, real-time dust concentrations were taken

Limited HHRA Section: 7 Date: July 2010
7-4
periodically over a continuous period during which operations were taking place. A 95%
UCL was calculated all the data collected while dust generating activities were ongoing to
determine a conservative average of processing derived dust concentrations. This 95%
UCL of dust monitored during this event was used to model fugitive dust concentration to
offsite receptors. Implementation of the 95% UCL estimates that the value calculated is
greater than or equal to the true mean 95% of the time when calculated for a random data
set. This assumption is health-protective because in the majority of cases overestimates
the amount of dust that could result from processing operations occurring on site. During
this sampling event, dust concentrations were monitored downwind as close as reasonably
possible to dust generating activities and in areas where large amounts of dust appeared to
be generated. In efforts to be conservative, sampling was performed in worst case
scenario locations as to not underestimate that amount of dust generated during
processing activities. This assessment also assumed that the sampling performed was
representative of conditions that exist onsite 24 hours a day, 7 days a week.
7.3.2 Estimation of Airborne Dust Concentrations Offsite
There is some uncertainty in the estimation of airborne dust concentrations, because the
risk assessment does not separately consider dust concentrations on days when winds are
high. This uncertainty is minimal, however, as described below. The current risk
assessment utilizes an EPA screening air dispersion model that assumes winds are
blowing towards residential receptors 24 hours a day, 365 days a year at 2.8 m/s for either
a 1-year or 30-year period. The USEPA states that a 0.08 times multiplication factor should
be used to convert the 1-hr maximum average to an annual average. This was not done in
this evaluation. Instead, an adjustment factor of 0.2 was applied to estimate the annual
average (personal communication with Dr. Barbara Brooks, HEER Office). Had a more
realistic air dispersion model been used, the ambient dust concentrations at remote receptor
locations would have been lower.
This Risk Assessment also only modeled airborne dust concentrations at an assumed ¼ mile
distance from dust generating activities. If dust generating activities were moved closer to
neighboring residences or in the future new residences are built closer to dust generating
activities, the concentration of airborne dust would likely be higher. Likewise, ¼ mile was
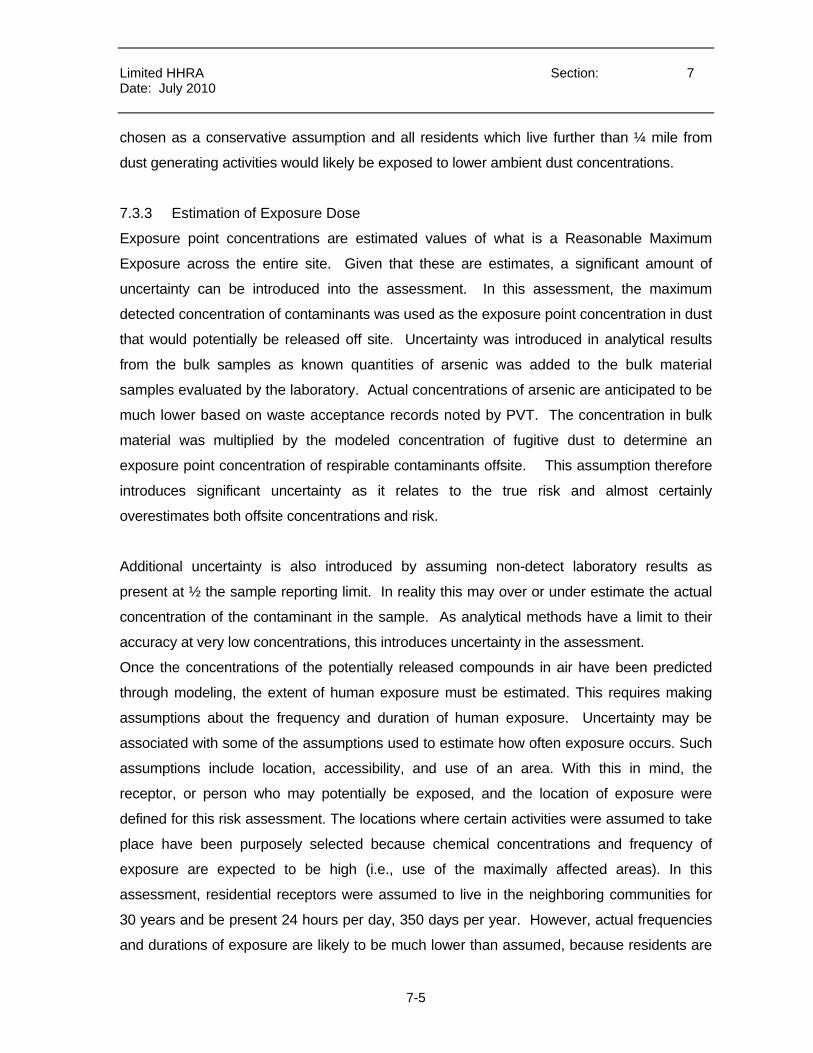
Limited HHRA Section: 7 Date: July 2010
7-5
chosen as a conservative assumption and all residents which live further than ¼ mile from
dust generating activities would likely be exposed to lower ambient dust concentrations.
7.3.3 Estimation of Exposure Dose
Exposure point concentrations are estimated values of what is a Reasonable Maximum
Exposure across the entire site. Given that these are estimates, a significant amount of
uncertainty can be introduced into the assessment. In this assessment, the maximum
detected concentration of contaminants was used as the exposure point concentration in dust
that would potentially be released off site. Uncertainty was introduced in analytical results
from the bulk samples as known quantities of arsenic was added to the bulk material
samples evaluated by the laboratory. Actual concentrations of arsenic are anticipated to be
much lower based on waste acceptance records noted by PVT. The concentration in bulk
material was multiplied by the modeled concentration of fugitive dust to determine an
exposure point concentration of respirable contaminants offsite. This assumption therefore
introduces significant uncertainty as it relates to the true risk and almost certainly
overestimates both offsite concentrations and risk.
Additional uncertainty is also introduced by assuming non-detect laboratory results as
present at ½ the sample reporting limit. In reality this may over or under estimate the actual
concentration of the contaminant in the sample. As analytical methods have a limit to their
accuracy at very low concentrations, this introduces uncertainty in the assessment.
Once the concentrations of the potentially released compounds in air have been predicted
through modeling, the extent of human exposure must be estimated. This requires making
assumptions about the frequency and duration of human exposure. Uncertainty may be
associated with some of the assumptions used to estimate how often exposure occurs. Such
assumptions include location, accessibility, and use of an area. With this in mind, the
receptor, or person who may potentially be exposed, and the location of exposure were
defined for this risk assessment. The locations where certain activities were assumed to take
place have been purposely selected because chemical concentrations and frequency of
exposure are expected to be high (i.e., use of the maximally affected areas). In this
assessment, residential receptors were assumed to live in the neighboring communities for
30 years and be present 24 hours per day, 350 days per year. However, actual frequencies
and durations of exposure are likely to be much lower than assumed, because residents are

Limited HHRA Section: 7 Date: July 2010
7-6
not likely to stay in one place and may, for instance, work far away or move to another
location. Additionally, the majority of recycling activities (e.g., processing of material) will
only occur during working hours, not continuously 24 hours per day. Furthermore the
remaining lifetime of the landfill will probably not approach the estimated duration of lifetime,
residence, or employment. In these cases, the person's potential exposure would be
reduced, and the health risks discussed in this assessment would be overestimated.
7.4 Risk Characterization
The risk of adverse human health effects depends on estimated levels of exposure and dose-
response relationships. Once exposure to and risk from each of the selected compounds is
calculated, the total risk posed by recycling operations is determined by combining the health
risk contributed by each compound. For virtually all combinations of compounds present in
chemicals evaluated in this assessment, there is little or no evidence of interaction. However,
in order not to understate the risk, it is assumed that the effects of different compounds may
be added together.
The current assessment evaluates risk from dust generated from various recycling
operations. The risk estimates derived herein do so in a deterministic manner. Doing so
ensures that risks determined are from facility operations. It does not derive screening levels
for PM10 or COPCs at the fence line. Evaluation of fence line data may be problematic as
sources of dust and COPCs may not be 100% PVT operation derived.

Limited HHRA Section: 8 Date: July 2010
8-1
8.0 REFERENCES
Agency for Toxicity Substances and Disease Registry (ASTDR). 2009
Dahlgren, S. E., and Hartford, W. W. (1972). Kinetics and Mechanism of Fixation of Cu-Cr-
As Wood Preservatives, Parts I-V, Holzforschung. Technischer Verlag Herbert, Berlin.
AMEC Earth & Environmental, Inc. (AMEC). 2005. Human Health Risk Assessment of
Fugitive Dust and Surface Soils, PVT Landfill, O’ahu, Hawai’i. June.
AMEC Earth & Environmental, Inc. (AMEC). 2009. Sampling and Analysis Plan and Human
Health Risk Assessment Protocol, PVT Landfill, O’ahu, Hawai’i. January.
Anderson, E., N. Browne, S. Duletsky, J. Ramig, and T. Warn. 1985. Development of
Statistical Distributions or Ranges of Standard Factors Used in Exposure Assessments.
EPA Contract 68-02-3510/ 68-02-3997.
Cascadia Consulting Group, Inc. 1999. Construction and Demolition Waste Composition
Study. Prepared for State of Hawaii, Department of Business, Economic Development, &
Tourism.
Cowherd, C., G. Muleski, P. Engelhart, and D. Gillette. 1985. Rapid Assessment of
Exposure to Particulate Emissions from Surface Contamination. Prepared for U.S. EPA,
Office of Health and Environmental Assessment, Washington, DC. EPA/600/8-85/002.
Land, C.E. 1975. Tables of confidence limits for linear functions of the normal mean and
variance. Selected Tables in Mathematical Statistics, 3:385-419. American Mathematical
Society, Providence, RI.
NRC. 1983. Risk Assessment in the Federal Government: Managing the Process.
Committee on the Institutional Means for assessment of Risks to Public Health. National
Research Council. National Academy Press. Washington, D.C.

Limited HHRA Section: 8 Date: July 2010
8-2
Suzana Radivojevic and Paul A. Cooper, 2008. Environ. Sci. Technol., 2008, 42 (10), pp
3739–3744 Faculty of Forestry University of Toronto 33 Willcocks St. M5S 3B3 Toronto,
ON, Canada. DOI: 10.1021/es702885f. American Chemical Society
Rohlf, F. James and Robert R. Sokal. 1981. Statistical Tables. W.H. Freeman and
Company. San Francisco. p. 81.
Stern, Arthur C. 1984. Fundamentals of Air Pollution. Academic Press, Inc.
Song, Jinkun; Dubey, Brajesh; Jang, Yong-Chul; Townsend, Timothy, and Helena Solo-
Gabriele. Implication of chromium speciation on disposal of discarded CCA-treated wood.
Journal of Hazardous Materials, Volume 128, Issues 2-3, 6 February 2006, Pages 280-288,
ISSN 0304-3894
Ung, Y.T.. Effectiveness of CCA fixation to avoid hexavalent chromium leaching. Forest
Products Journal. March 1 2004
U.S. EPA. 1986. Superfund Public Health Evaluation Manual. Office of Emergency and
Remedial Response. EPA 540/1-86/060.
U.S. EPA, 1989. Risk Assessment Guidance for Superfund. Volume I: Human Health
Evaluation Manual. Part A. Interim Final. Office of Emergency and Remedial Response.
U.S. EPA. 1991a. Human Health Evaluation Manual, Supplemental Guidance: "Standard
Default Exposure Factors." OSWER Directive 9285.6-03. March 25, 1991.
U.S. EPA. 1991b. Risk Assessment Guidance for Superfund: Volume I - Human Health
Evaluation Manual (Part B, Development of Risk-based Preliminary Remediation Goals).
Office of Emergency and Remedial Response. Washington, DC. PB92-963333.
USEPA. 1995a. SCREEN3 Model User’s Guide. U.S. Environmental Protection Agency,
Office of Air Quality Planning and Standards. Research Triangle Park, NC. EPA-454/B-95-
004. September.

Limited HHRA Section: 8 Date: July 2010
8-3
USEPA Office of Air Quality Planning and Standards: Compilation of Air Pollutant Emission
Factors, AP-42 Fifth Edition, January 1995. Updates provided in
http://www.epa.gov/ttnchie1/ap42/.
U.S. EPA. 1997a. Health Effects Assessment Summary Tables. Fiscal Year 1997. Office of
Health and Environmental Assessment. EPA 540/R-97/036.
U.S. EPA 1997b. Exposure Factors Handbook. Volume 1. General Factors, Office of
Research and Development. Washington D.C. U.S. EPA/600/P-95/002Fa.
U.S. EPA. 2010a. Integrated Risk Information System (IRIS). Office of Health and
Environmental Assessment, Environmental Criteria and Assessment Office, U.S. EPA.
Cincinnati, OH.
U.S. EPA. 2010b. Regional Screening Level Tables (RSL).

APPENDIX A Ambient Air Monitoring Photographs

PHOTOGRAPHIC DOCUMENTATION
PVT Landfill Limited Human Health Risk Assessment
Current Processing Facility Ambient Air Monitoring
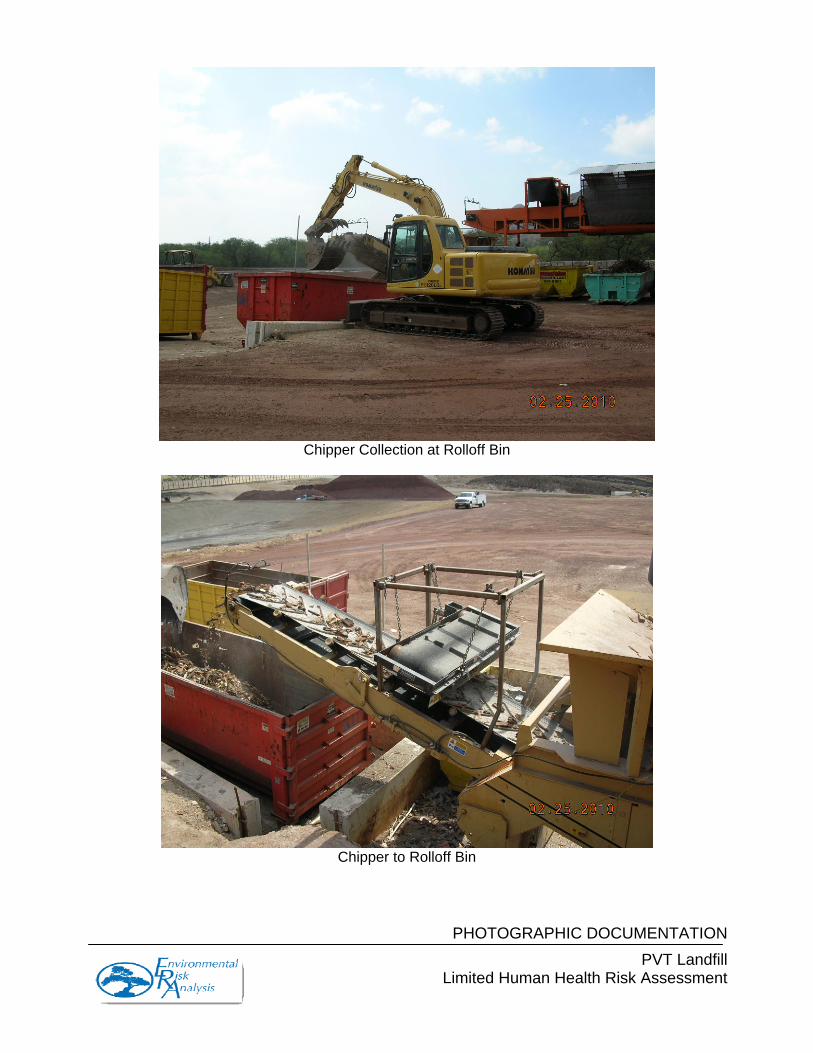
PHOTOGRAPHIC DOCUMENTATION
PVT Landfill Limited Human Health Risk Assessment
Chipper Collection at Rolloff Bin
Chipper to Rolloff Bin
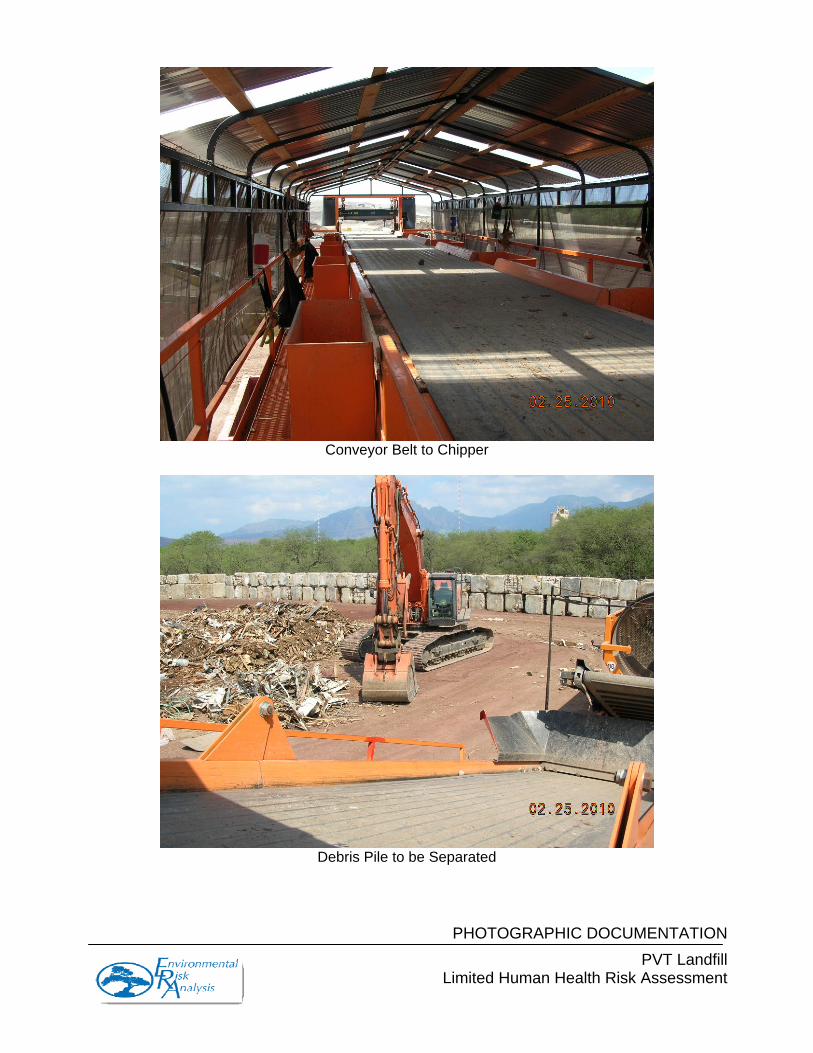
PHOTOGRAPHIC DOCUMENTATION
PVT Landfill Limited Human Health Risk Assessment
Conveyor Belt to Chipper
Debris Pile to be Separated

PHOTOGRAPHIC DOCUMENTATION
PVT Landfill Limited Human Health Risk Assessment
Downwind Air Sampling
Air Sampling at Conveyor Belt
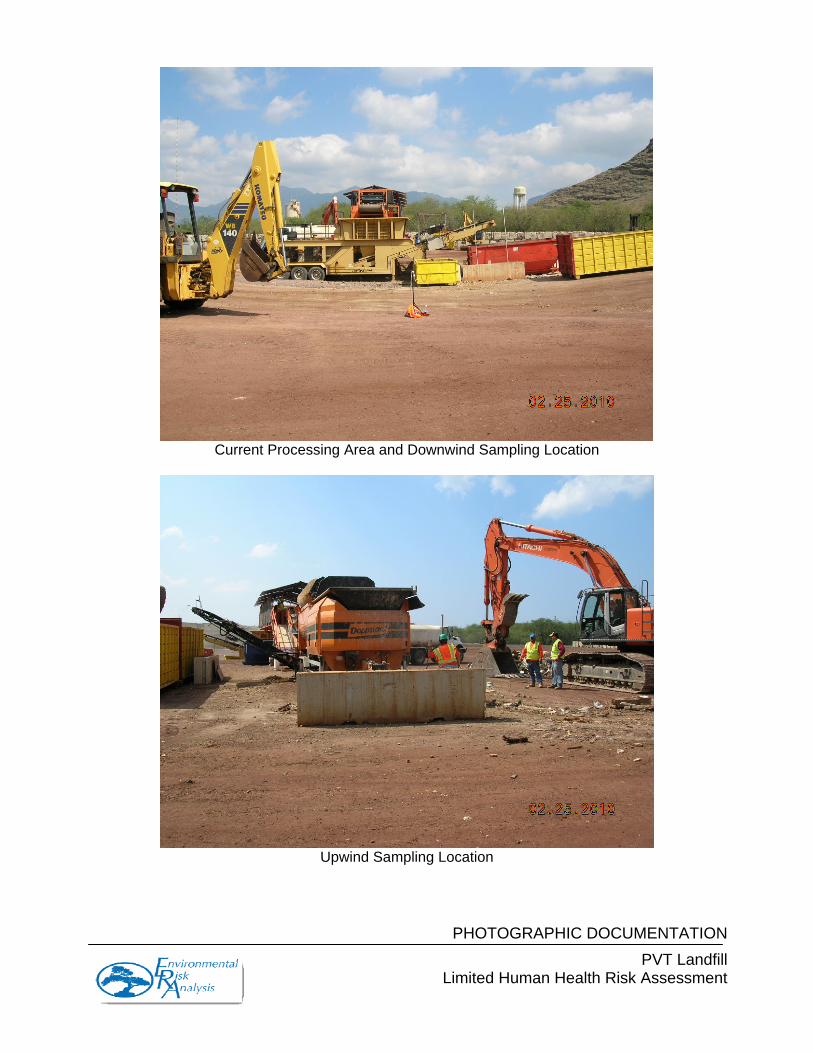
PHOTOGRAPHIC DOCUMENTATION
PVT Landfill Limited Human Health Risk Assessment
Current Processing Area and Downwind Sampling Location
Upwind Sampling Location

PHOTOGRAPHIC DOCUMENTATION
PVT Landfill Limited Human Health Risk Assessment
Future Mining Demonstration Project Ambient Air Monitoring

PHOTOGRAPHIC DOCUMENTATION
PVT Landfill Limited Human Health Risk Assessment
Mining Demonstration and Upwind Sampling Location
Downwind Sampling Location

PHOTOGRAPHIC DOCUMENTATION
PVT Landfill Limited Human Health Risk Assessment
Mining of C&D Waste
Dust Plume during Mining Operations
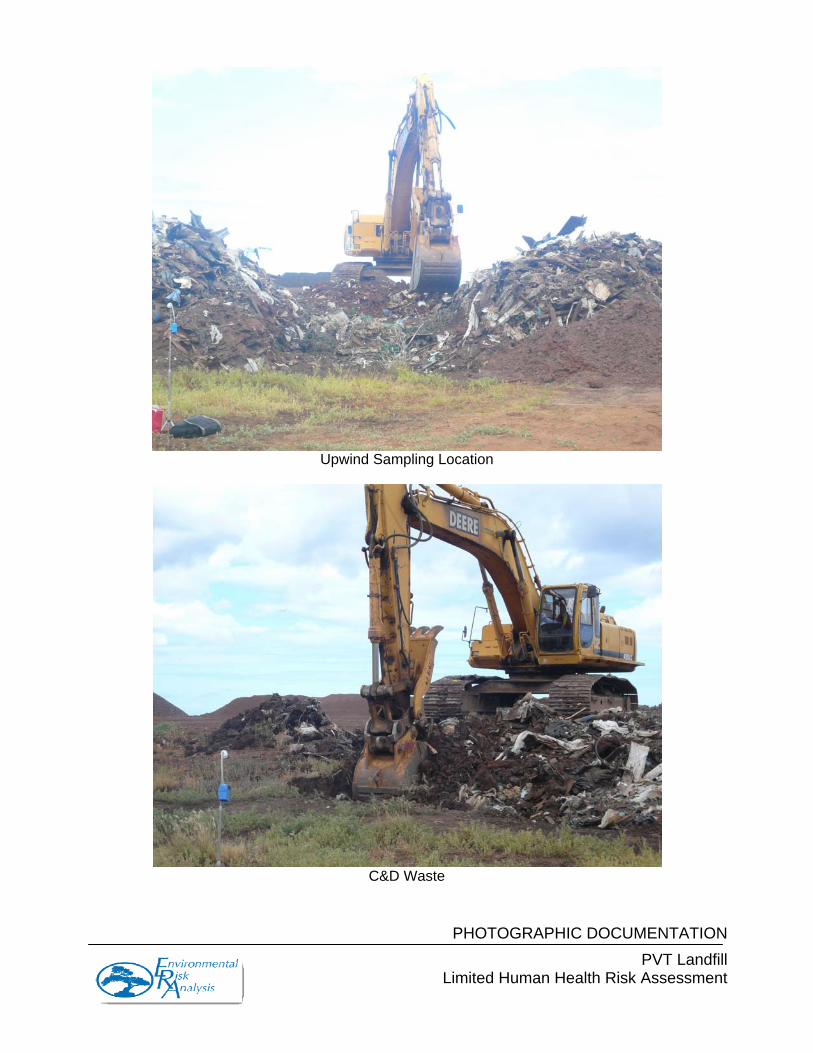
PHOTOGRAPHIC DOCUMENTATION
PVT Landfill Limited Human Health Risk Assessment
Upwind Sampling Location
C&D Waste
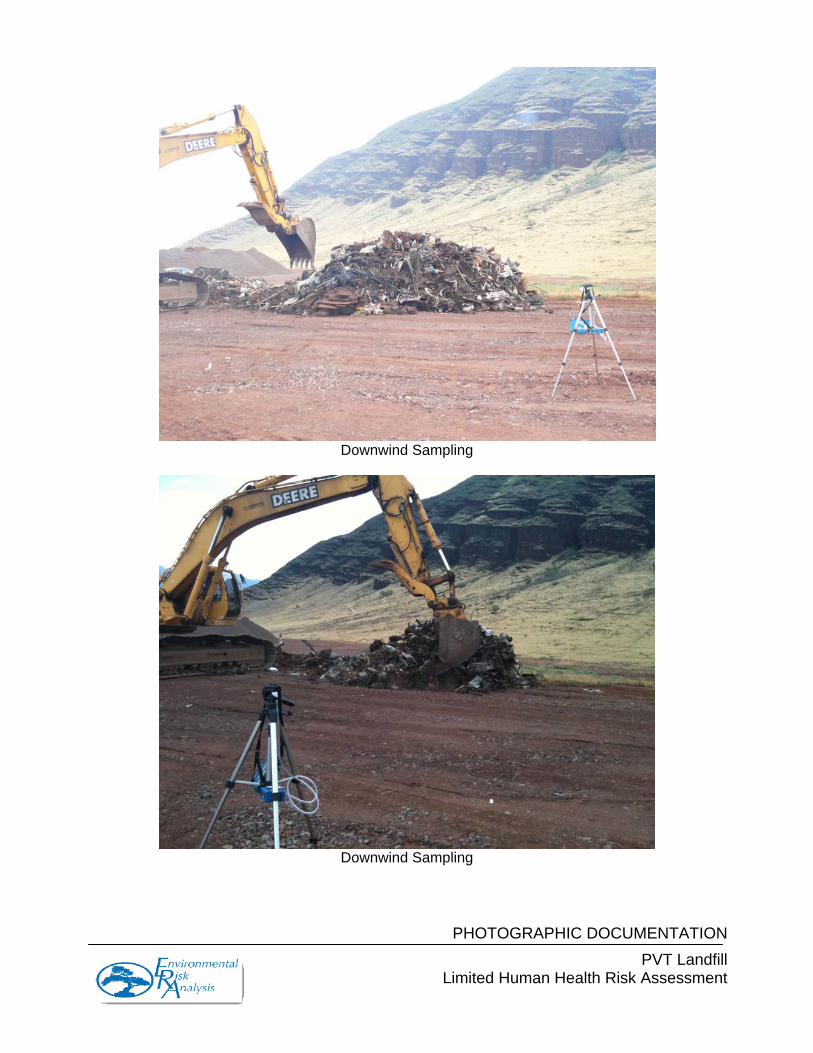
PHOTOGRAPHIC DOCUMENTATION
PVT Landfill Limited Human Health Risk Assessment
Downwind Sampling
Downwind Sampling


