Q4FY17 FINANCIALS
APRIL 25, 2017

INDEX
1. Key Highlights 4
2. Financial Highlights 8
3. Business Highlights 12
4. Shareholding 20

4
No. of Customers(Total: 13.8 lacs | IDFC Bharat Ltd.1
customers: 9.6 lacs)
Customers acquired in the month of Mar : 60.9K (B+: 21.9K; B: 39.0K)
CASA/Gross Advances
Non Interest Franchise Income/Total Non Interest Income
37.8%
Non Interest Franchise Income/Total Operating Income
11.9%
Retailisation of Funded Book2: ` 16,818 Cr
Balance Sheet Growth
All figures in ` Crores
1. Formerly known as Grama Vidiyal Micro Finance Ltd. (GVMFL)2. Retailisation of Funded Book = Bharat Bank, B Plus, SME, Buyout, Onlending
Key Highlights: FY17 (1 of 2)
25,90659,555
1,25,0572,45,613
4,14,090
Mar-16 Jun-16 Sep-16 Dec-16 Mar-17
Points of Presence (8,613)
104409
1,1544,684
8,613
Mar-16 Jun-16 Sep-16 Dec-16 Mar-17
0.90%1.75%
3.32%
1.76%
4.06%
Mar-16 Jun-16 Sep-16 Dec-16 Mar-17
7.9%
25.2%
Mar-16 Mar-17
Mar 16: ` 83,216
35%
Mar 17: ` 1,12,160
CASA Mar 17 – ` 2,094 Cr
Q4 vs Q3 FY17 vs FY16
-3%

5
Key Highlights: FY17 (2 of 2)
Outstanding Credit1
` 85,172 CrNet Adv: ` 49,402 Cr
Credit Inv: ` 17,165 Cr LC/BG: ` 18,605 Cr
PAT
` 1,019.7 CrQ4 FY17: ` 176.0 Cr
RoA | RoE
1.0% | 7.2%
Network & Customers
Asset mix (` 1,12,160) Income
` 3,030 CrNII: ` 2,076 CrNon Int: ` 954 Cr
NIM
2.1%Loan: 3.1%
EPS | Book value
3.0 | 43.2
Funding mix (` 90,470) Expenses
` 1,277 CrHR: ` 597 Cr
Others: ` 680 Cr
C/I Ratio
42.1%
Headcount
3,906
Mar’16: 2,405 (+62%)
CASA Ratio2
5.2%CASA4:Bharat: ` 153 CrBharat Plus: ` 433 CrWholesale: ` 1,508 Cr
Asset Quality Capital Adequacy
18.9%
Tier 1: 18.5%
IDFC Bank vs. Bankex3
2,094
17,970
10,434
26,706
2,099
7,776
23,391
CASA
FD
Infra Bonds
Bonds & Deb.
FC Loans
CBLO/Repo/LAF
Others incl CDs
69%
47%
GNPL: 3.0%
NNPL: 1.1%Net RSA: 1.3%
49,402
17,165
2,202
19,264
16,942
7,184
Net Advances
Credit Inv.
Cash & Bank
Statutory Inv.
Trading Inv.
Other Assets NII/Total
HR/Total
21%
NetworkBranches: 74ATMs: 47Micro ATMs: 5,661Aadhar Pay: 2,481BC & IDFC Bharat Ltd.: 350
CustomersTotal: 13.8 lacsIDFC Bharat Ltd.: 9.6 lacs
32%
58%
YoY
1. Outstanding Credit (FB+ NFB) grew 19% from ` 71,354 Cr as on 31st Dec, 16 to ` 85,172 Cr as on 31st Mar, 17. Outstanding Funded Credit grew 18% from ` 56,641 Cr as on 31st Dec 16 to ` 66,567 Cr as on 31st Mar, 17
2. CASA Ratio = CASA / (CASA+FD+CD)3. 1st April 16 to 31st Mar 174. Average SA per account: Bharat banking` 2,834, Bharat plus: ` 26,987

6
Customer Outreach : 8,613
e. Payment Points: 5,8221
c. Corporate BCs: 350
b. Retail Branches: 702
a. Wholesale
Bank: 43
d. MATM & ATM : 2,367
1. Of which PDS Agent: 3,341, Aadhar Pay: 2,4812. Of which Bharat: 57, Bharat Plus: 133. In addition, 5 Bharat Plus branches also cater to Wholesale clients. (Total Wholesale branches: 9)

7
Building a National Footprint
20 states 19 major cities 33,000 villages 8,613 Points of Presence
150 districts
Rajasthan
Gujarat
Madhya Pradesh
Maharashtra
Karnataka
Gurgaon
Punjab
Haryana
AP+ Telengana
Priority states for Bharat branch network
Madhya Pradesh Karnataka Rajasthan Gujarat Maharashtra
Micro ATM, E PDS & Aadhar Pay Network
Rural & Urban centres across India Receiving end of remittance corridors & DBT Micro ATM Network around branches and in
select districts
Light Branches in District HQ- Andhra Pradesh, Meghalaya, Tripura, West Bengal, Tamil Nadu
BC & IDFC Bharat Ltd. Partnerships: Micro loans & Small Savings through 350 branches
New Delhi
Mumbai
Pune
Bangalore
Hyderabad
Chennai
KolkataAhmedabad
Jaipur
Indore
Coimbatore
Branch network
Shillong
8
FINANCIAL HIGHLIGHTS

9
Note: Figures for the previous periods have been reclassified for consistency with the current period.
Balance Sheet grew 35% YoYNet retail & corporate assets grew by 36%
All figures in ` Crores
Particulars Mar-16 Dec-16 Mar-17% Growth
(QoQ)% Growth
(YoY)Shareholders' Funds 13,633 14,486 14,678 1% 8%Deposits 8,219 27,001 40,208 49% 389%CASA 445 900 2,094 133% 371%Fixed Deposits 4,263 16,311 17,970 10% 321%Certificate of Deposits 3,511 9,791 20,144 106% 474%
Borrowings 57,160 68,445 50,262 -27% -12%Other liabilities and provisions 4,204 5,643 7,011 24% 67%Total Liabilities 83,216 1,15,576 1,12,160 -3% 35%
Cash and Bank Balances 984 3,880 2,202 -43% 124%Net Retail and Corporate Assets 48,813 56,641 66,567 18% 36%Net Advances 45,699 46,983 49,402 5% 8%Credit Investments 3,114 9,658 17,165 78% 451%
Statutory Investments 12,977 17,389 19,264 11% 48%CRR 1,920 2,533 2,900 14% 51%SLR 11,057 14,856 16,364 10% 48%
Trading Investments 15,558 30,078 16,942 -44% 9%Fixed and Other Assets 4,884 7,589 7,184 -5% 47%Total Assets 83,216 1,15,576 1,12,160 -3% 35%

10 All figures in ` CroresNote: Figures for the previous periods have been reclassified for consistency with the current period.
PAT growth of 7% YoY in Q4FY17 vs. Q4FY16
Particular Q4 FY16 Q3 FY17 Q4 FY17 FY 17% Growth (QoQ)(Q4 FY17 vs Q3
FY17)
% Growth (YoY)(Q4 FY17 vs Q4
FY16)
Operating Income 554.5 855.0 558.4 3,030.4 -35% 1%Net Interest Income 403.8 535.4 515.6 2,076.1 -4% 28%Non Interest Income 150.7 319.5 42.7 954.3 -87% -72%Fee and Commission 55.4 102.9 69.7 361.1 -32% 26%Trading Gains (Debt & Equity) 74.2 218.9 (25.8) 590.1 -112% -135%Other Income 21.1 (2.2) (1.2) 3.1 -48% -105%
Operating Expenses 294.7 379.0 298.1 1,277.0 -21% 1%HR 144.8 202.8 100.1 597.2 -51% -31%Non HR 149.9 176.2 197.9 679.8 12% 32%
Pre-Prov Op Profit (Ppop) 259.9 476.0 260.3 1,753.5 -45% 0%Provisions & Contingencies 11.9 231.8 4.8 282.5 -98% -60%Profit Before Tax 247.9 244.2 255.5 1,471.0 5% 3%Tax 82.9 53.0 79.5 451.2 50% -4%Profit After Tax 165.1 191.2 176.0 1,019.7 -8% 7%
11
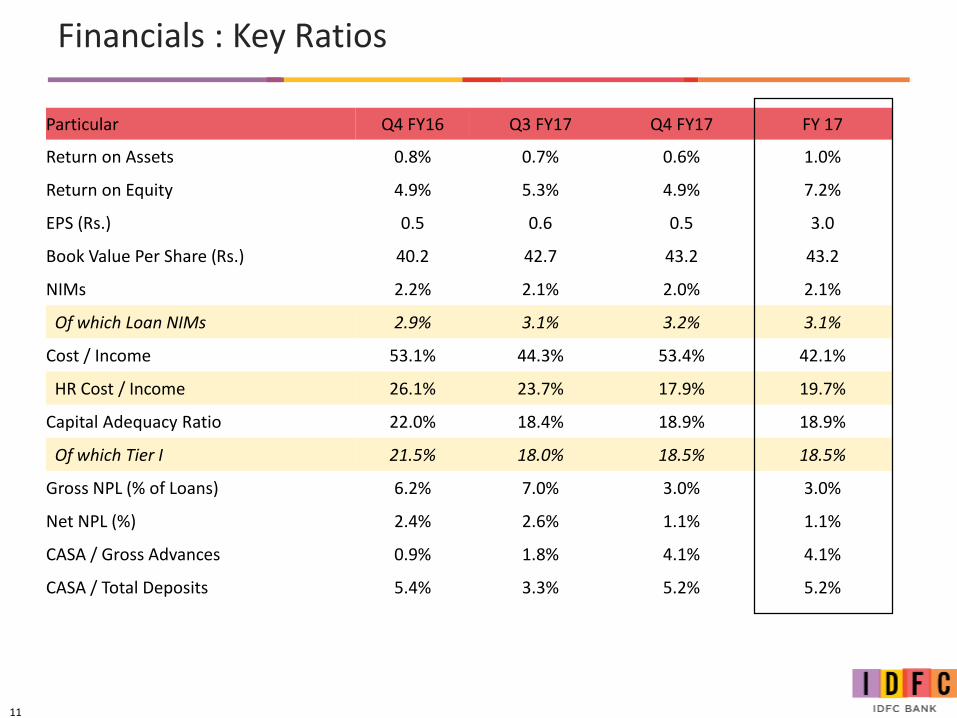
Financials : Key Ratios
Particular Q4 FY16 Q3 FY17 Q4 FY17 FY 17
Return on Assets 0.8% 0.7% 0.6% 1.0%
Return on Equity 4.9% 5.3% 4.9% 7.2%
EPS (Rs.) 0.5 0.6 0.5 3.0
Book Value Per Share (Rs.) 40.2 42.7 43.2 43.2
NIMs 2.2% 2.1% 2.0% 2.1%
Of which Loan NIMs 2.9% 3.1% 3.2% 3.1%
Cost / Income 53.1% 44.3% 53.4% 42.1%
HR Cost / Income 26.1% 23.7% 17.9% 19.7%
Capital Adequacy Ratio 22.0% 18.4% 18.9% 18.9%
Of which Tier I 21.5% 18.0% 18.5% 18.5%
Gross NPL (% of Loans) 6.2% 7.0% 3.0% 3.0%
Net NPL (%) 2.4% 2.6% 1.1% 1.1%
CASA / Gross Advances 0.9% 1.8% 4.1% 4.1%
CASA / Total Deposits 5.4% 3.3% 5.2% 5.2%

12
BUSINESS HIGHLIGHTS

13
Retail bank: Comprehensive Product Suite
Segment Key Products
Mass
• Joint Liability group loan • Micro Enterprise Loan • Two wheeler loan • Personal Loan • Home Loan, Loan against property, Micro housing loan• Liabilities – Saving Accounts (zero and minimum balance), Term deposits,
Recurring Savings deposit• Payments – Micro ATMs, ATMs , Aadhaar Pay • Insurance (health, life, general) • Mutual funds
Merchant
• Current accounts, Savings account (Min. balance), term loans • Payments – Micro ATMs, ATMs , Aadhaar Pay • Insurance ( health, life, general) • Mutual funds
SME• Current Account, Saving Account (Min. balance),Term Deposits• Term Loan, Working Capital, Commercial vehicle loans• Insurance, Portfolio Mgt services
MSME
• Working Capital Loan• Commercial vehicle loan • Equipment hypothecation loan • Liabilities – Saving Accounts, Term deposits, Recurring Savings deposit• Payments – Micro ATMs, ATMs, Aadhaar Pay • Insurance ( health, life, general) • Mutual funds

14
Bharat Plus Snapshot
Branch Network
13 Branches
Liabilities• ~ 1.38 lacs customers• ~ 1.24 lacs CASA accounts
Assets & AUM (End March 2017)• Net funded advances: ` 1,189 Cr• Wealth AUM: ̀ 245 Cr
Presence across 5 cities in India: Mumbai, Delhi NCR, Bangalore, Chennai & Ahmedabad
` 3,072 Cr deposit book as of 31 March 2017:
• ` 433 Cr of CASA
• ` 2,639 Cr of Fixed Deposits
Breakdown of total funded advances:
• Home loans: ` 441 Cr• Working Capital funded book: ` 164 Cr• Commercial Vehicle: ` 96 Cr• Loan against property: ` 92 Cr• Personal loan: ` 74 Cr
Non-funded book as of Mar, 31: ` 40 Cr

15
Bharat Plus: Q4 FY17 highlights
13,249 30,855
73,763
1,38,572
2,746 12,578 20,714
Q1 Q2 Q3 Q4
# of Customers
# of customers of which Digitally acquired
Strong traction in assets disbursement in Q4
125.9
26.0 24.2 16.7
192.8
94.4
228.4
64.5 46.2 65.2
404.2
125.2
Home Loans Loan AgainstProperty
PersonalLoans
CommercialVehicle loans
Total WorkingCapital
(limits setup) - Fund +
Non Fund
Q4 vs Q3 Assets Disbursals (Rs Cr)
Q3 Q4
Customer acquisition rate accelerated
Note: Excludes SME

16
Bharat: ~12.4 lac customers acquired and serviced through branches and Micro ATMs
Customer Touchpoints
• 8,384 Customer Points• 326 IDFC Bharat Ltd.
locations• 24 BC locations
Customer Network• 12.4 lacs unique customers
(9.63 Lacs of IDFC Bharat Ltd.)• 1.76 lacs Liability & 1.22 lacs
asset customers sourced through Branches & MATM
Assets & Liabilities
• ` 1,598 Cr of advances (1,148 Crs of IDFC Bharat Ltd)
• ` 153 Cr of CASA• ` 2,922 Cr disbursed in FY17
•57 Branches across MP, Karnataka, AP, Tripura & Meghalaya
•5,470 MATMs
•2,481 Aadhar Pay
•28 ATMs
•More than 2.74 Lacs customers acquired through Branches and MATMs
•No. of loan accounts surpassed 10lacs
•Branch Based advances are at ` 222 Cr
•MSME assets are at ` 15 Cr whereas Onlendingadvances reached ` 189 Cr
• Deposit balances are at ` 325 Cr
17
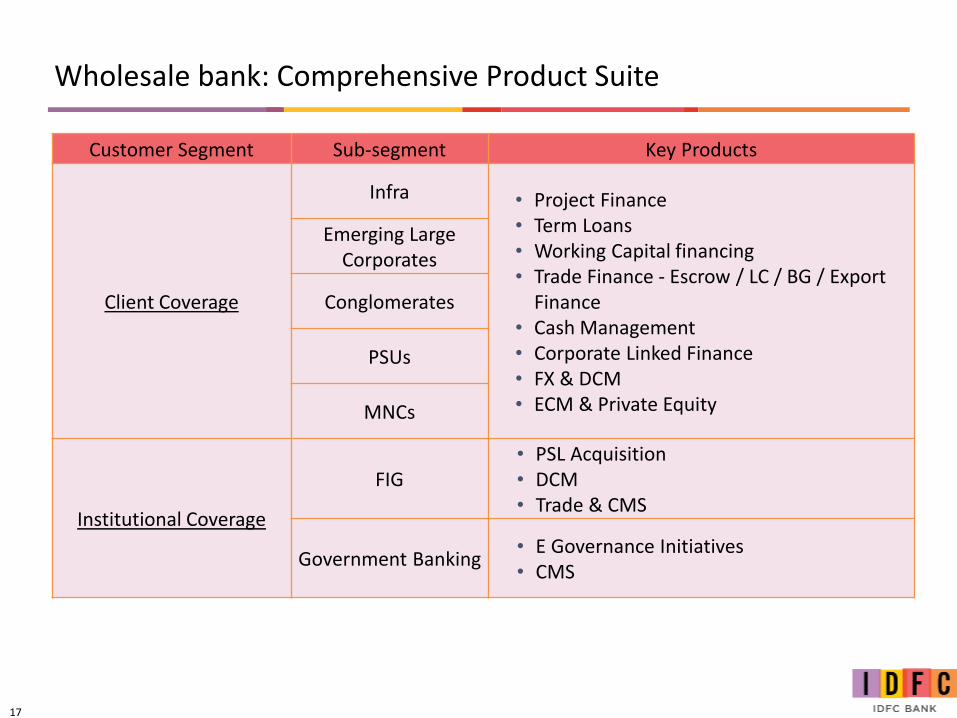
Customer Segment Sub-segment Key Products
Client Coverage
Infra • Project Finance • Term Loans • Working Capital financing• Trade Finance - Escrow / LC / BG / Export
Finance• Cash Management• Corporate Linked Finance• FX & DCM • ECM & Private Equity
Emerging Large Corporates
Conglomerates
PSUs
MNCs
Institutional Coverage
FIG• PSL Acquisition• DCM• Trade & CMS
Government Banking• E Governance Initiatives • CMS
Wholesale bank: Comprehensive Product Suite
18
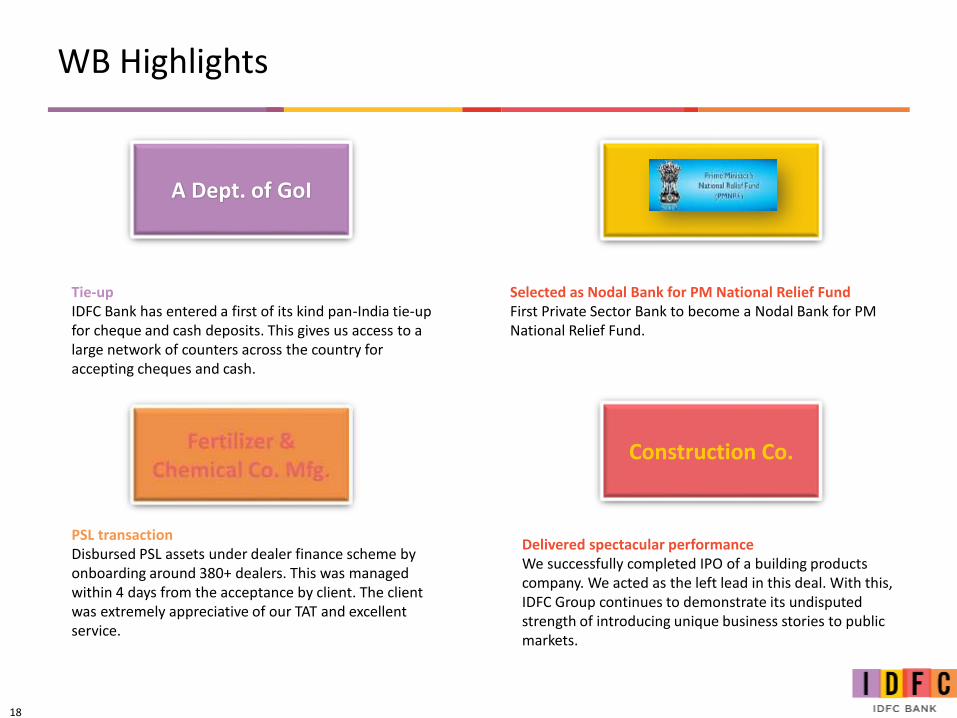
WB Highlights
Tie-upIDFC Bank has entered a first of its kind pan-India tie-up for cheque and cash deposits. This gives us access to a large network of counters across the country for accepting cheques and cash.
Selected as Nodal Bank for PM National Relief FundFirst Private Sector Bank to become a Nodal Bank for PM National Relief Fund.
PSL transaction Disbursed PSL assets under dealer finance scheme by onboarding around 380+ dealers. This was managed within 4 days from the acceptance by client. The client was extremely appreciative of our TAT and excellent service.
Delivered spectacular performanceWe successfully completed IPO of a building products company. We acted as the left lead in this deal. With this, IDFC Group continues to demonstrate its undisputed strength of introducing unique business stories to public markets.
Construction Co.
A Dept. of GoI
19
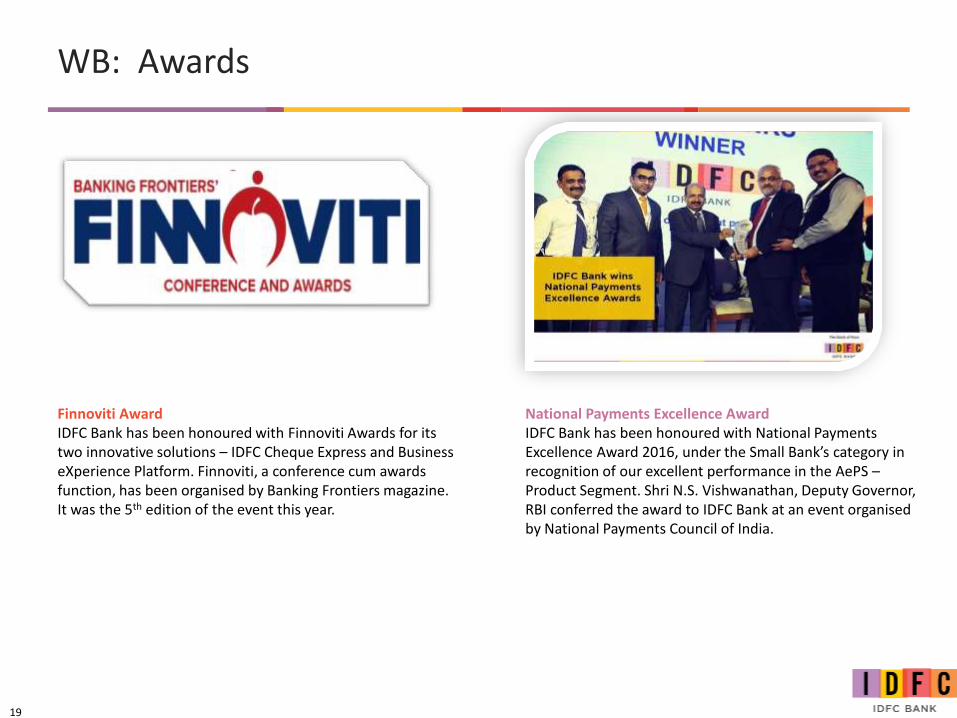
WB: Awards
Finnoviti AwardIDFC Bank has been honoured with Finnoviti Awards for its two innovative solutions – IDFC Cheque Express and Business eXperience Platform. Finnoviti, a conference cum awards function, has been organised by Banking Frontiers magazine. It was the 5th edition of the event this year.
National Payments Excellence AwardIDFC Bank has been honoured with National Payments Excellence Award 2016, under the Small Bank’s category in recognition of our excellent performance in the AePS –Product Segment. Shri N.S. Vishwanathan, Deputy Governor, RBI conferred the award to IDFC Bank at an event organised by National Payments Council of India.

20
Shareholding pattern
% of Top 10 shareholders
Sr No Name Category Mar-17
1 IDFC (Promoters) Promoters 52.9%
2 GoI Government 7.7%
3 The Royal Bank Of Scotland FII 3.1%
4 Blackrock Fund FII 1.6%
5 Platinum Investment Management FII 1.4%
6 Vanguard FII 1.2%7 Capital Group Inc FII 0.9%
8 Emerging Markets Funds FII 0.9%
9 LIC FIs / Insurance Co 0.9%
10 HSBC Global Investment Funds FII 0.7%
GoI, 7.7%
FIs / Insurance Co / Banks,
2.2%FDI / FII /
NRI / FN /FPI / Overseas
Bodies, 20.9%
MF, 1.3%
Corporate Bodies, 2.4%
Retail, 12.7%
IDFC (Promoters),
52.9%
Shareholding as on 31st Mar 2017
THANK YOU


