QoS Measurements Methods and Tools
Contact:Jarmo prokkola
[email protected]: +358 20 722 2346
VTT Technical Reseach Centre of Finland
Easy Wireless Workshop,IST Summit, Budapest, 05.07.2007

VTT TECHNICAL RESEARCH CENTRE OF FINLAND
2Easy Wireless Workshop, IST Summit, Budapest, 05.07.2007, J. Prokkola
Network performance vs. QoS
•Network traffic measurements are employed to study the pure networkperformance
•Active measurements are performed by injecting traffic with knownproperties into the network
•Passive measurements consists of monitoring the existing trafficflow(s) at one or more points
•QoS measurements lie logically above network traffic measurements,and relate to the performance of networking applications.
•Objective QoS relates to something concrete and quantitative•Packet loss, Delay, Jitter, Connection break length…
•Subjective QoS corresponds to the service quality from the userperspective.
•Mean Opinion Score (MOS) tests are often used•Subjective QoS can be estimated within certain limits from the
basis of objective QoS (e.g., PESQ algorithm)
VTT TECHNICAL RESEARCH CENTRE OF FINLAND
3Easy Wireless Workshop, IST Summit, Budapest, 05.07.2007, J. Prokkola
The purpose of QoS measurements & monitoring
•Answers to the question: How do the applications see the network?
•Realtime QoS monitoring benefits•Network administrators•Network equipment manufacturers (testing)•Networking application developers•Operators•End users•Networking performance
•QoS aware applications (e.g., adapting video traffic flow)•Handover triggering•Congestion control management
•Accurate QoS measurements can be used by•Network equipment manufacturers (testing)•Networking application developers•Researchers

VTT TECHNICAL RESEARCH CENTRE OF FINLAND
4Easy Wireless Workshop, IST Summit, Budapest, 05.07.2007, J. Prokkola
Common QoS Measurement Architecture
•QoS measurement architecture includes:•(a) Measurement points
•Located at network nodes(e.g., hosts, routers, firewalls)
•(b) Traffic measurement tool•Captures packets and collects
information of the desired traffic flow•(c) QoS analysis tool
•Analyzes the collected data andcalculates the actual QoS statistics
•(d) QoS monitor or database•Analysis can be done in realtime,
and/or after the traffic traces have beencollected.
•Analysis can be centralized to aspecific server, or distributed to thenetwork.
Trafficmeasurement tool
Measurement point(network node)
Measurement point(network node)
Trafficmeasurement tool
QoS analysistool
…
QoS(realtime monitor
or database)
a
b
c
d
Figure 1. Functional decomposition of QoSmeasurement architecture.
VTT TECHNICAL RESEARCH CENTRE OF FINLAND
5Easy Wireless Workshop, IST Summit, Budapest, 05.07.2007, J. Prokkola
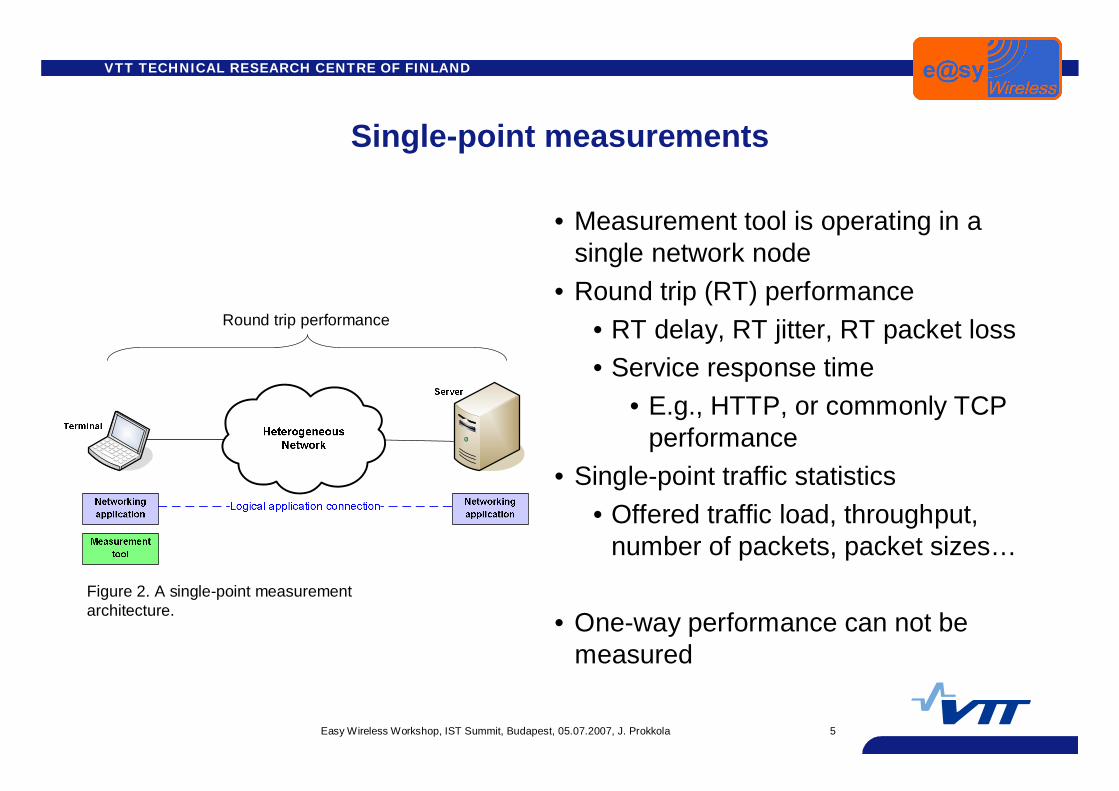
Singlepoint measurements
•Measurement tool is operating in asingle network node
•Round trip (RT) performance•RT delay, RT jitter, RT packet loss•Service response time
•E.g., HTTP, or commonly TCPperformance
•Singlepoint traffic statistics•Offered traffic load, throughput,
number of packets, packet sizes…
•Oneway performance can not bemeasured
Round trip performance
Figure 2. A singlepoint measurementarchitecture.
VTT TECHNICAL RESEARCH CENTRE OF FINLAND
6Easy Wireless Workshop, IST Summit, Budapest, 05.07.2007, J. Prokkola
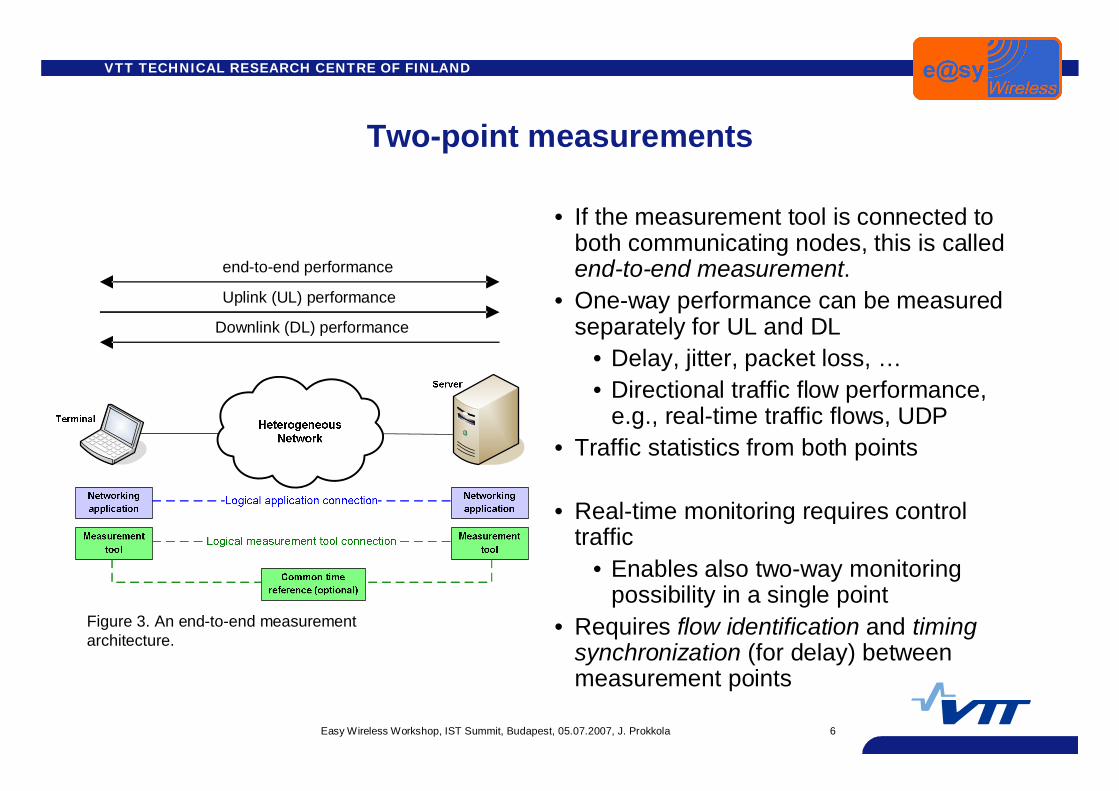
Twopoint measurements
•If the measurement tool is connected toboth communicating nodes, this is calledendtoend measurement.
•Oneway performance can be measuredseparately for UL and DL
•Delay, jitter, packet loss, …•Directional traffic flow performance,
e.g., realtime traffic flows, UDP•Traffic statistics from both points
•Realtime monitoring requires controltraffic
•Enables also twoway monitoringpossibility in a single point
•Requires flow identification and timingsynchronization (for delay) betweenmeasurement points
endtoend performance
Uplink (UL) performance
Downlink (DL) performance
Figure 3. An endtoend measurementarchitecture.
VTT TECHNICAL RESEARCH CENTRE OF FINLAND
7Easy Wireless Workshop, IST Summit, Budapest, 05.07.2007, J. Prokkola
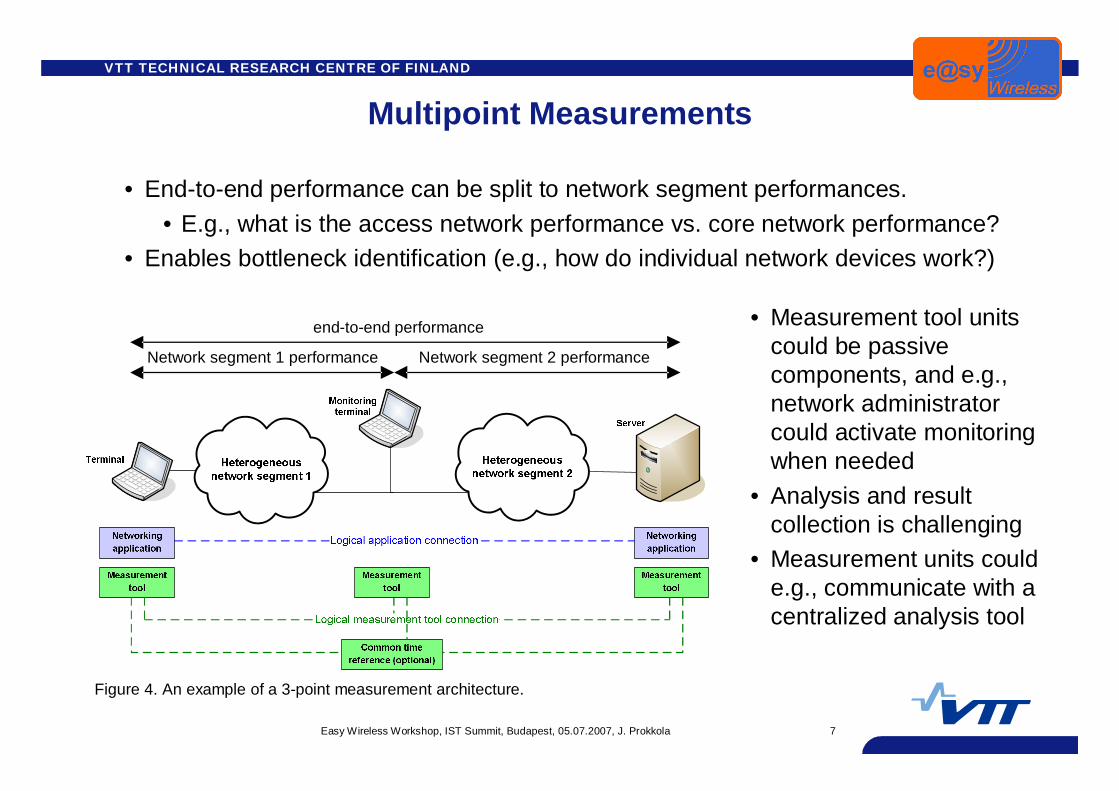
Multipoint Measurements
•Endtoend performance can be split to network segment performances.•E.g., what is the access network performance vs. core network performance?
•Enables bottleneck identification (e.g., how do individual network devices work?)
endtoend performance
Network segment 1 performance Network segment 2 performance
•Measurement tool unitscould be passivecomponents, and e.g.,network administratorcould activate monitoringwhen needed
•Analysis and resultcollection is challenging
•Measurement units coulde.g., communicate with acentralized analysis tool
Figure 4. An example of a 3point measurement architecture.
VTT TECHNICAL RESEARCH CENTRE OF FINLAND
8Easy Wireless Workshop, IST Summit, Budapest, 05.07.2007, J. Prokkola
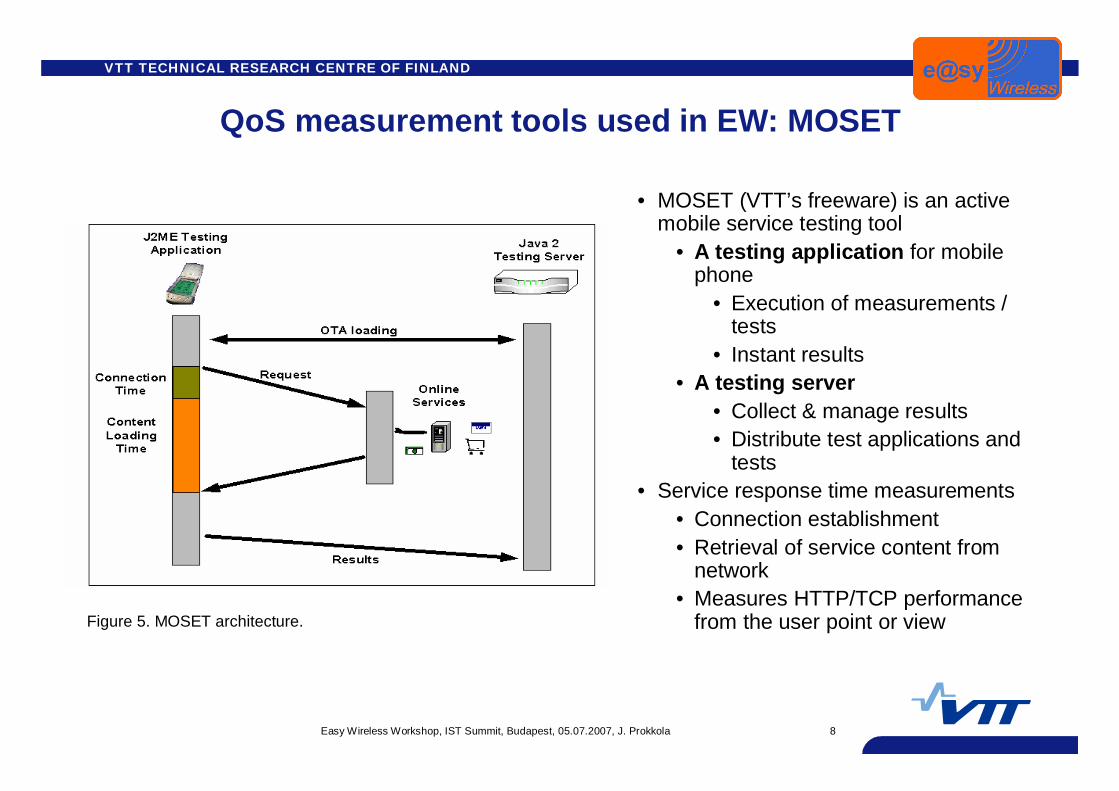
QoS measurement tools used in EW: MOSET
• MOSET (VTT’s freeware) is an activemobile service testing tool
•A testing application for mobilephone
•Execution of measurements /tests
•Instant results•A testing server
•Collect & manage results•Distribute test applications and
tests• Service response time measurements
•Connection establishment•Retrieval of service content from
network•Measures HTTP/TCP performance
from the user point or viewFigure 5. MOSET architecture.

VTT TECHNICAL RESEARCH CENTRE OF FINLAND
9Easy Wireless Workshop, IST Summit, Budapest, 05.07.2007, J. Prokkola
QoS measurement tools used in EW: QoSMeT
•QoSMeT (VTT) is a passive tool for measuringoneway endtoend network QoS from theapplication’s point of view
•Realtime measurements & accurate perpacket statistics
•Is able to measure QoS of realtimeapplications (e.g., VoIP, video conferencing),but other networking applications can bemeasured as well.
•The tool works practically over any kind ofnetwork as long as IP is supported
•QoSMeT can be run in the same device withthe measured application or within the networkpath at desired points
•Measures e.g.: Delay, Jitter, Packet loss,Connection break duration (e.g., during ahandover), Throughput and Offered load, andthe volume of data sent/received
•GPS is used for clock synchronizationFigure 6. QoSMeT architecture.
VTT TECHNICAL RESEARCH CENTRE OF FINLAND
10Easy Wireless Workshop, IST Summit, Budapest, 05.07.2007, J. Prokkola
QoS measurement tools used in EW: M5 MultiAnalyzer
•M5 (NetHawk) enables protocol monitoring, call and session tracing, keyperformance indicator (KPI) analysis, QoS measurements, and radiooptimization measurements
•Monitors and analyzes UTRAN, GERAN, UMAN, IMS, WiMAX and corenetwork interfaces at the same time.
•Supports all common transport techniques –STM1/OC3, STM4/OC12, E1/J1/T1 in different modes and Ethernet
•Product components: Standard PC, NetHawk Adapters & cables andNetHawk M5 analysis SW
•Enables multipoint flow measurements with QoSMeT•QoSMeT handles the endpoints, while M5 takes traces within the
network path and decodes QoSMeT’s control packets
VTT TECHNICAL RESEARCH CENTRE OF FINLAND
11Easy Wireless Workshop, IST Summit, Budapest, 05.07.2007, J. Prokkola
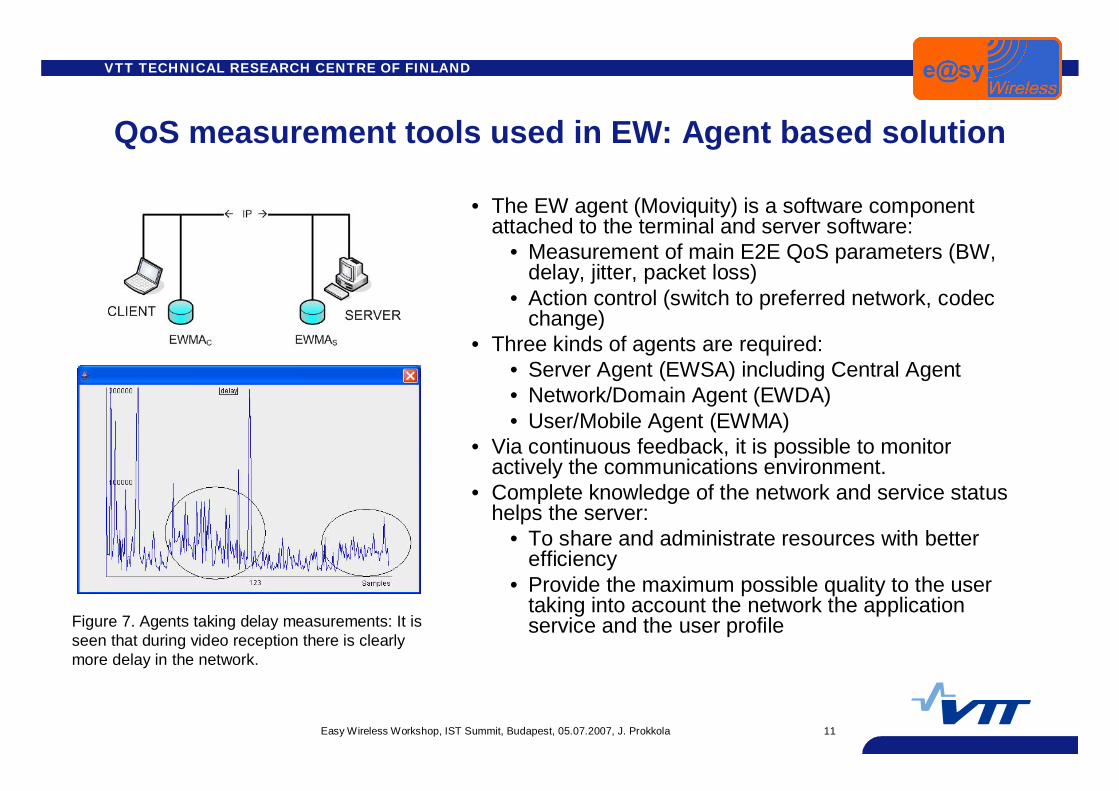
QoS measurement tools used in EW: Agent based solution
• The EW agent (Moviquity) is a software componentattached to the terminal and server software:
•Measurement of main E2E QoS parameters (BW,delay, jitter, packet loss)
•Action control (switch to preferred network, codecchange)
• Three kinds of agents are required:•Server Agent (EWSA) including Central Agent•Network/Domain Agent (EWDA)•User/Mobile Agent (EWMA)
• Via continuous feedback, it is possible to monitoractively the communications environment.
• Complete knowledge of the network and service statushelps the server:
•To share and administrate resources with betterefficiency
•Provide the maximum possible quality to the usertaking into account the network the applicationservice and the user profileFigure 7. Agents taking delay measurements: It is
seen that during video reception there is clearlymore delay in the network.

VTT TECHNICAL RESEARCH CENTRE OF FINLAND
12Easy Wireless Workshop, IST Summit, Budapest, 05.07.2007, J. Prokkola
EW Measurement Examples:VHO Performance
•A simple handover scenario (VoIP application using Mobile IP):LAN WLAN 3G WLAN LAN
•Great differences in delay and jitter between network technologies(e.g., 3G onewaydelay is only barely acceptable for VoIP)
•Connection break length is on the order of seconds during handovers
0
0.02
0.04
0.06
0.08
0.1
0.12
0.14
0.16
0.18
0.2
0.0 50.0 100.0 150.0 200.0 250.0Time [s]
Del
ay [s
]
0.01
0.1
1
10
0.0 50.0 100.0 150.0 200.0 250.0
Time [s]
Con
nect
ion
loss
leng
th [s
]
Delay Connection break length
VTT TECHNICAL RESEARCH CENTRE OF FINLAND
13Easy Wireless Workshop, IST Summit, Budapest, 05.07.2007, J. Prokkola
0.0
200.0
400.0
600.0
800.0
1000.0
1200.0
10 100 1000 10000 100000 1000000 10000000UDP packet size [B], TCP downloaded file size [B]
Goo
dput
[kbi
t/s] UDP HSDPA
UDP 3G
TCP HSDPA
TCP 3G
UDP HSDPA Throughput
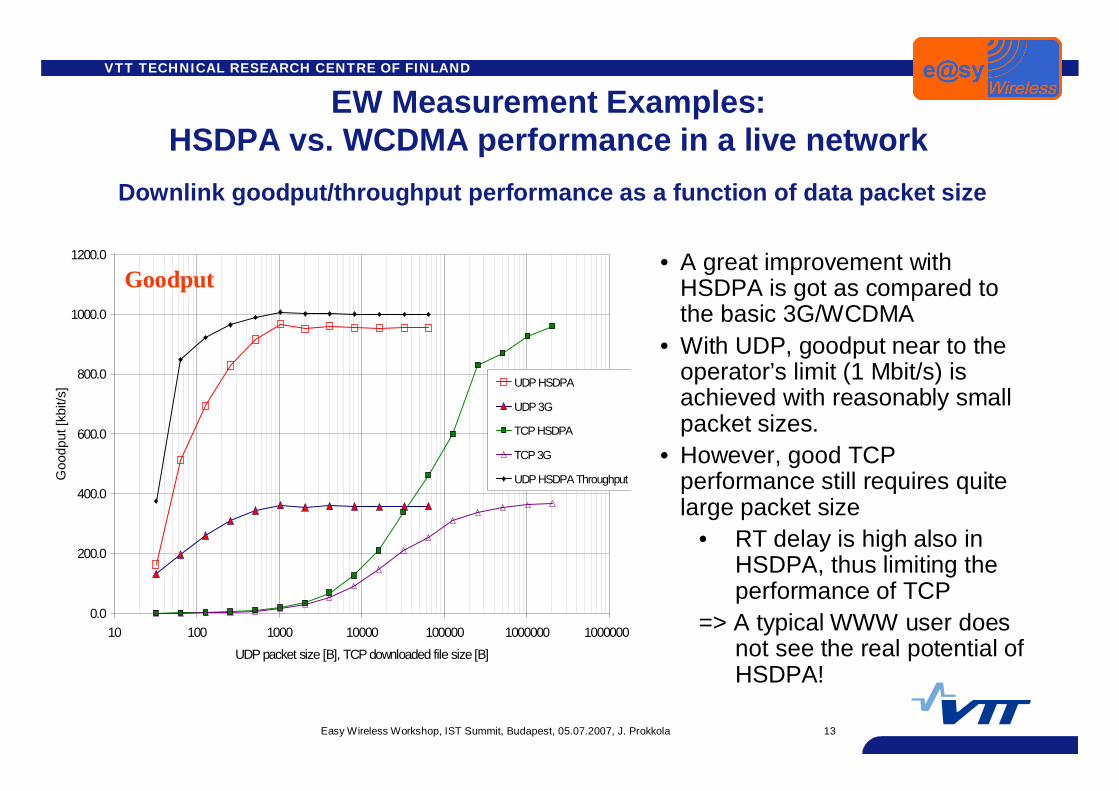
EW Measurement Examples:HSDPA vs. WCDMA performance in a live network
•A great improvement withHSDPA is got as compared tothe basic 3G/WCDMA
•With UDP, goodput near to theoperator’s limit (1 Mbit/s) isachieved with reasonably smallpacket sizes.
•However, good TCPperformance still requires quitelarge packet size
• RT delay is high also inHSDPA, thus limiting theperformance of TCP
=> A typical WWW user doesnot see the real potential ofHSDPA!
Goodput
Downlink goodput/throughput performance as a function of data packet size
VTT TECHNICAL RESEARCH CENTRE OF FINLAND
14Easy Wireless Workshop, IST Summit, Budapest, 05.07.2007, J. Prokkola
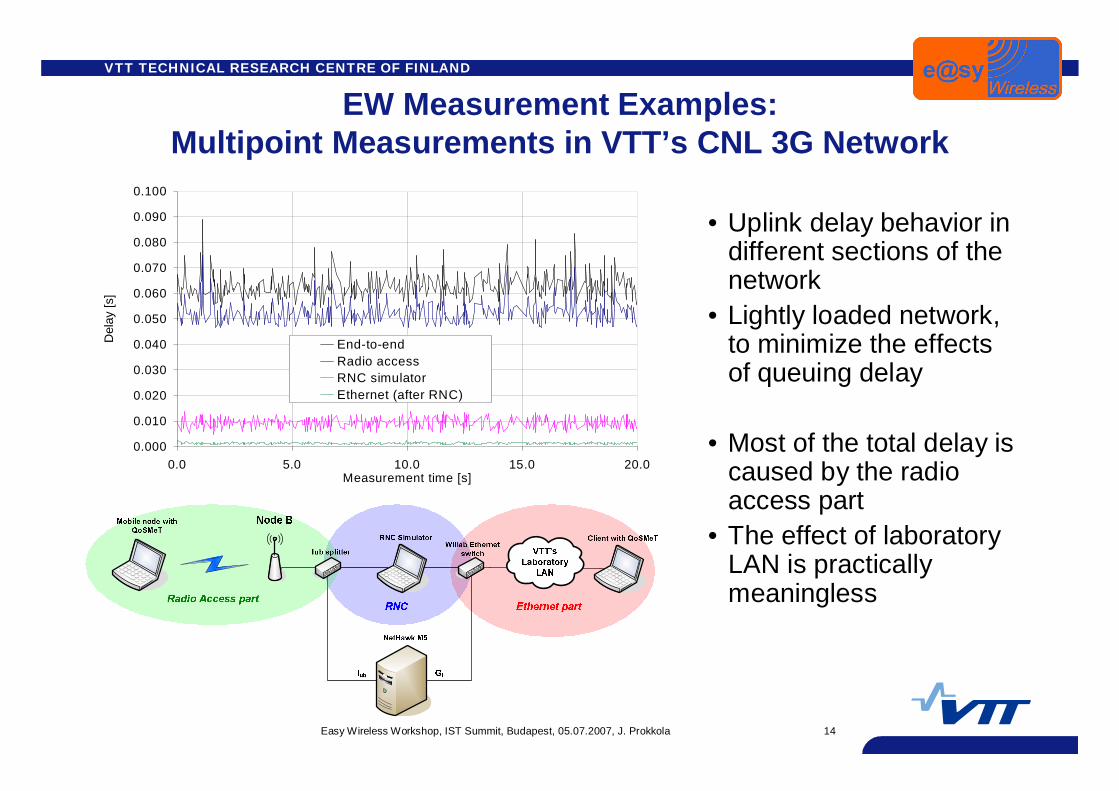
EW Measurement Examples:Multipoint Measurements in VTT’s CNL 3G Network
•Uplink delay behavior indifferent sections of thenetwork
•Lightly loaded network,to minimize the effectsof queuing delay
•Most of the total delay iscaused by the radioaccess part
•The effect of laboratoryLAN is practicallymeaningless
0.000
0.010
0.020
0.030
0.040
0.050
0.060
0.070
0.080
0.090
0.100
0.0 5.0 10.0 15.0 20.0Measurement time [s]
Del
ay [s
]
EndtoendRadio accessRNC simulatorEthernet (after RNC)
VTT TECHNICAL RESEARCH CENTRE OF FINLAND
15Easy Wireless Workshop, IST Summit, Budapest, 05.07.2007, J. Prokkola
Conclusions
•The complexity of QoS measurements grow when increasing thenumber of measurement points
•While single point measurements are simple, the informationprovided is very limited
•Analysis of even a large monitoring network can be simple ifonly traffic statistics are needed. However, traffic flow behavioranalysis is complicated and needs also clock synchronization ifdelay measurements are desired.
•QoS measurements play important role in EW, several tools areused, and new tools have been developed
•The tools are used in revealing the performance of the existingnetworks, giving feedback to applications, and in measuring theperformance of the developed QoS methods.
•Interesting performance behaviors have been found in numerousmeasurements in EW, and several publications have been done.


