Faculty of Health, Medicine and Life Sciences (FHML)
Master’s degree programme in Global Health
05.05.2014 – 31.08.2014
T.M. Kafczyk
Master’s thesis:
Quality of Life and Perception of Aging in Institutionalized and
Non-Institutionalized Elderly in the South Canara Region in India
I am truly grateful and humbled by the reliable and outstanding supervision, both in a
didactic and inter-personal way, of my first supervisor, Prof. Dr. G.I.J.M. Kempen,
Maastricht University, Dept. of Health Services Research. My thanks also go to my
second supervisor, Dr. J.S.M. Krumeich, Maastricht University, Dept. of Health, Ethics
and Society, who was especially at the beginning of the thesis project of priceless help in
pulling the strings to allow me to work on this important topic in Manipal, Karnataka
state, India. Another word of thanks which I absolutely want to express to my field
supervisor in Manipal, T. Andrews J, Manipal University, Dept. of Public Health, who was
of significant help, a source of great advice and field wisdom and who had always an
open ear for my problems.
Maastricht, August 26 2014
Note: this study was conducted in cooperation with the Dept. of Public Health, Manipal
University, Manipal 576 104, Karnataka, India. The placement took place from May 5 to
June 20 2014.
II
Abstract
Introduction
India will soon have the second largest population over 60 after China. Amplified by
globalization, older people face now a decline in traditional values that is reflected in a
breakdown of traditional family structures and a rise in the number of old age homes. In
light of these changes, a better understanding of how different living arrangements affect
quality of life and the self-perception of aging (SPA) is urgently warranted. This study
investigated if the living arrangement (community versus old age home) determined
differences in quality of life and if these differences are partly explained by the SPA
among older adults in India.
Methods
Purposive sampling was applied to collect data in India in the South Canara region in
Karnataka state in non-institutionalized and institutionalized older people ≥ 55 years old.
The mean age of the final sample of 139 participants was 69.75 (SD = 8.83) years.
Quality of life was assessed with the WHOQOL-BREF instrument, SPA was assessed with
the Attitudes Toward Own Aging subscale of the Lawton Philadelphia Geriatric Centre
Moral Scale. The statistical analysis was based on multiple regression analysis.
Results
Institutionalized elderly people showed lower quality of life scores in the domains physical
health, psychological health, social relationships and environment. The SPA did not vary
between the living arrangements and did not seem to explain the relationship between
living arrangement and quality of life. Instead, SPA changed the relationship between
living arrangement and quality of life. Possible explanations and implications are
discussed.
Conclusion
The results highlight the need to improve quality of life particularly in institutionalized
older people in the South Canara region. However, definite conclusions about whether
this should be done through the improvement of SPA cannot be drawn due to limitations
of the present study. A follow-up study is warranted in order to shed more light on this
important topic.
III
Table of contents
Abstract ............................................................................................................... II
Table of contents .................................................................................................. III
List of figures ........................................................................................................ V
List of tables ........................................................................................................ VI
List of abbreviations ............................................................................................. VII
1. Introduction ...................................................................................................... 1
1.1 Aging .......................................................................................................... 1
1.1.1 Demographic shift ................................................................................... 2
1.1.2 Health status .......................................................................................... 3
1.1.3 Perception of aging.................................................................................. 4
1.2 Caring structures .......................................................................................... 6
1.2.1 Impact of globalization ............................................................................ 6
1.2.2 Old age homes ....................................................................................... 7
1.2.3 Quality of life .......................................................................................... 8
1.3 Rationale and aim of the study ....................................................................... 9
1.4 Research question and hypotheses .................................................................10
1.4.1 Research question ..................................................................................10
1.4.2 Hypotheses ...........................................................................................10
2. Methods ..........................................................................................................12
2.1 Data collection .............................................................................................12
2.1.1 Sampling ..............................................................................................12
2.1.2 Procedure .............................................................................................15
2.2 Variables and measurement instruments ........................................................16
2.2.1 Independent variable: living arrangement .................................................16
2.2.2 Dependent variable: quality of life ............................................................16
2.2.3 Mediating variable: self-perception of aging ...............................................17
2.2.4 Covariates .............................................................................................18
2.2.5 Validity and reliability .............................................................................18
2.3 Statistical analysis .......................................................................................19
2.4 Ethical considerations ...................................................................................20
3. Results ............................................................................................................21
3.1 Descriptive statistics ....................................................................................21
3.2 Hypotheses .................................................................................................22
3.2.1 Hypothesis one: living arrangement and quality of life ................................22
IV
3.2.2 Hypothesis two: living arrangement and self-perception of aging .................24
3.2.3 Hypothesis three: self-perception of aging and quality of life .......................24
3.2.4 Hypothesis four: mediating role of self-perception of aging .........................26
4. Discussion and conclusion ..................................................................................29
4.1 Discussion ...................................................................................................29
4.2 Study limitations ..........................................................................................34
4.3 Future directions ..........................................................................................36
4.3.1 Research ...............................................................................................36
4.3.2 Policy implications ..................................................................................37
4.4 Conclusion ..................................................................................................39
References ..........................................................................................................40
Appendices ..........................................................................................................45
Appendix 1 Global AgeWatch domains and indicators .............................................45
Appendix 2 Demographics in Karnataka ...............................................................46
Appendix 3 Informed consent template ................................................................47
Appendix 4 WHOQOL-BREF and domain facets ......................................................51
Appendix 5 WHOQOL-BREF user agreement ..........................................................55
Appendix 6 Self-perception of aging questionnaire .................................................58
Appendix 7 Translation of the self-perception of aging questionnaire ........................59
Appendix 8 Ethical clearance certificate ................................................................64
Appendix 9 Correlations among study variables .....................................................66
Appendix 10 Study summary: statistical diagrams .................................................67
Appendix 11 Regression with interaction term .......................................................68
V
List of figures
Figure 1: Population pyramids in India for 1950, 2000 and 2050 ................................. 3
Figure 2: Conceptual diagram of the study model .....................................................11
Figure 3: Recruitment and data collection procedure .................................................16
Figure 4: Statistical diagram of the study model with effect terms ..............................19
Figure 5: Quality of life domains as a function of self-perception of aging per living
arrangement ........................................................................................................33
VI
List of tables
Table 1: Global AgeWatch health status domain ........................................................ 4
Table 2: Characteristics of old age homes ................................................................13
Table 3: Characteristics of study areas and participants per living arrangement ...........14
Table 4: Descriptive characteristics of the study sample ............................................22
Table 5: Regression results for living arrangement on quality of life controlling for
covariates ............................................................................................................23
Table 6: Regression results for living arrangement on self-perception of aging controlling
for covariates .......................................................................................................24
Table 7: Regression results for self-perception of aging on quality of life controlling for
covariates ............................................................................................................25
Table 8: Regression results for living arrangement on quality of life controlling for self-
perception of aging and covariates .........................................................................28
VII
List of abbreviations
BCa Bias-corrected and accelerated bootstrap
CI Confidence interval
DALYs Disability Adjusted Life-Years
GDP Gross domestic product
H1-4 Hypothesis 1-4
SPA Self-perception of aging
SPSS Statistical Package for the Social Sciences
Note: elderly people living in the community are described in the present study as “non-
institutionalized” and elderly people living in old age homes are described as
“institutionalized”. Both formulations (e.g. old age home and institution) are used
interchangeable.
Maastricht University | FHML | Tom Kafczyk | Master’s thesis | Chapter: 1. Introduction
1
1. Introduction
In this first chapter, the background of the study is described. First, the topic “aging” is
introduced. Here, an emphasis is put on the demographic shift and the health status and
the self-perception of aging (SPA) of older people in India. Next, caring structures in
India are described, followed by the rationale and aim of the study. Finally, the research
question and hypotheses of the present study are stated.
1.1 Aging
“Population ageing is unprecedented, without parallel in human history—and the twenty-
first century will witness even more rapid ageing than did the century just past.” (United
Nations, 2001, second paragraph).
Aging is a normal phenomenon and means the effects of older age (Devi & Roopa, 2013;
Mahapatra, 2010). It is often associated with a decline in vitality (Sinclair & Guarente,
1997). More precise, aging has three aspects: biological, psychological and social
(Mahapatra, 2010). Age-related changes include a decline in physical and cognitive
abilities such as abilities in daily living activities or learning (Lockenhoff et al., 2009).
Research is undertaken to reverse or mitigate these biological changes and to increase
longevity (e.g. Baur et al., 2006; de Grey et al., 2004). However, the causes of aging, on
a molecular level, have yet to be determined (Sinclair & Guarente, 1997). Age-related
socio-emotional aspects of aging include wisdom, knowledge, received respect, life
satisfaction and family authority (Lockenhoff et al., 2009). Especially the perceived socio-
emotional characteristics of aging vary across cultures. The proportion of older persons in
the society or cultural aspects such as status differences, were found to affect societal
views on the socio-emotional aspects of aging. Basic biological age-related changes are
perceived to be similar across cultures (Lockenhoff et al., 2009).
Aging can lead to an increased vulnerability due to, for example, financial insecurity or
neglect in the society (Devi & Roopa, 2013; Mahapatra, 2010). In India, a non-universal
social pension scheme might contribute to financial insecurity (Pension watch, 2014).
Currently, about 19% of the population over 60 are covered by the pension scheme
(Pension watch, 2014). States as well as the children have a moral and legal obligation to
Maastricht University | FHML | Tom Kafczyk | Master’s thesis | Chapter: 1. Introduction
2
care and provide security for older persons in India while the extent of this liability
varies; for instance, Hindu, Muslim or Christian common law describes different
obligations. The Code of Criminal Procedure 1973 governs all religions and communities.
It obliges children to care for their parents. Furthermore, the Maintenance and Welfare of
Parents and Senior Citizen Act 2007 obliges the family (including relatives) and the state
to care for the needs based maintenance and the welfare of elderly (National Human
Rights Commission, 2011). The Act has to be brought to action on a state level; not all
states notified the act (National Human Rights Commission, 2011).
1.1.1 Demographic shift
Population aging has become a major global demographic trend. Underlying population
aging is a reduction in mortality followed by a reduction in fertility along with a
lengthening of life expectancy (United Nations, 2001, 2013), whereas not all extra life
years are necessarily spend free of disabilities (Robine et al., 2005). The process is called
“demographic transition”. Developed countries have gone through the demographic
transition already. Developing countries such as India are presently in the transition
(United Nations, 2001); but developing countries are ageing now at faster speed than
more developed countries did (HelpAge International, 2000; United Nations, 2001).
Soon, there will be more older people than children in the world (World Health
Organization, 2014a). The major demographic shift has economic, social and political
consequences for societies. While developed countries faced the challenges of population
ageing earlier, developing countries are only starting to tackle some of the challenges
(e.g. housing or health facilities for older people). Due to its undeniable importance, the
World Health Organization devoted the World Health Day 2012 to the topic “ageing and
health” (World Health Organization, 2014a). Moreover, the Madrid International Strategic
Plan of Action on Aging, adopted during the World Assembly on Ageing in 2002,
emphasized the well-being of older persons as a priority for action (United Nations, 2002,
2013).
Demographic shift in India
In India, declining fertility and mortality rates, accompanied by decreasing child mortality
rates and an increasing life expectancy led to an increase in the number of elderly
persons (Lena, Ashok, Padma, Kamath, & Kamath, 2009). At the present point in time,
approximately 8% of the population are over 60 years old. The population in India aged
60 and older will double in the next 40 years to over 220 million in 2050 (Chatterji et al.,
Maastricht University | FHML | Tom Kafczyk | Master’s thesis | Chapter: 1. Introduction
3
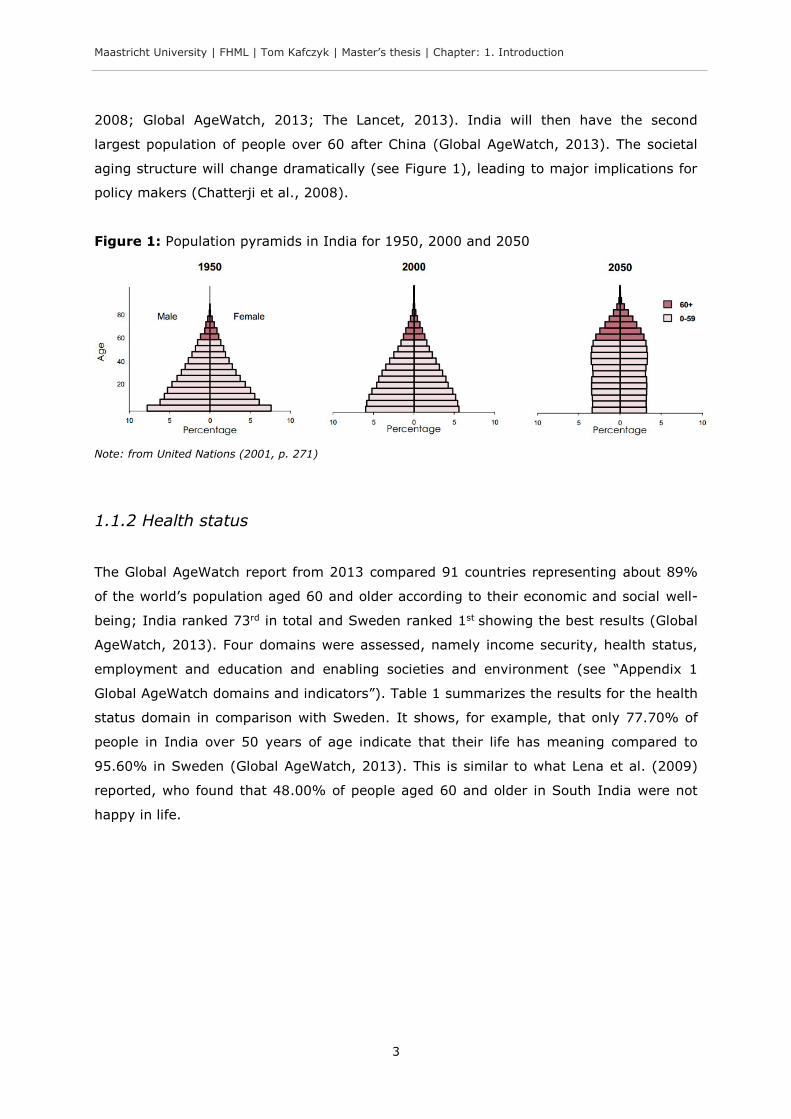
2008; Global AgeWatch, 2013; The Lancet, 2013). India will then have the second
largest population of people over 60 after China (Global AgeWatch, 2013). The societal
aging structure will change dramatically (see Figure 1), leading to major implications for
policy makers (Chatterji et al., 2008).
Figure 1: Population pyramids in India for 1950, 2000 and 2050
Note: from United Nations (2001, p. 271)
1.1.2 Health status
The Global AgeWatch report from 2013 compared 91 countries representing about 89%
of the world’s population aged 60 and older according to their economic and social well-
being; India ranked 73rd in total and Sweden ranked 1st showing the best results (Global
AgeWatch, 2013). Four domains were assessed, namely income security, health status,
employment and education and enabling societies and environment (see “Appendix 1
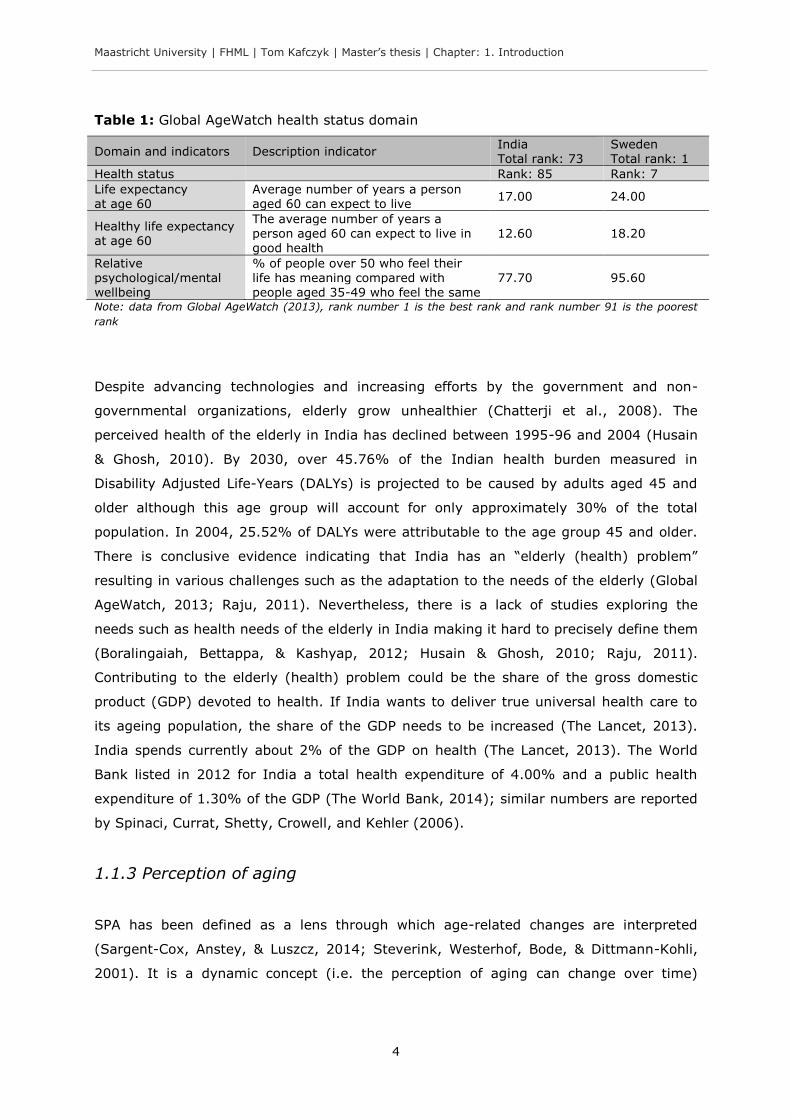
Global AgeWatch domains and indicators”). Table 1 summarizes the results for the health
status domain in comparison with Sweden. It shows, for example, that only 77.70% of
people in India over 50 years of age indicate that their life has meaning compared to
95.60% in Sweden (Global AgeWatch, 2013). This is similar to what Lena et al. (2009)
reported, who found that 48.00% of people aged 60 and older in South India were not
happy in life.
Maastricht University | FHML | Tom Kafczyk | Master’s thesis | Chapter: 1. Introduction
4
Table 1: Global AgeWatch health status domain
Domain and indicators Description indicator India Total rank: 73
Sweden Total rank: 1
Health status Rank: 85 Rank: 7
Life expectancy at age 60
Average number of years a person aged 60 can expect to live
17.00 24.00
Healthy life expectancy at age 60
The average number of years a person aged 60 can expect to live in good health
12.60 18.20
Relative psychological/mental wellbeing
% of people over 50 who feel their life has meaning compared with people aged 35-49 who feel the same
77.70 95.60
Note: data from Global AgeWatch (2013), rank number 1 is the best rank and rank number 91 is the poorest
rank
Despite advancing technologies and increasing efforts by the government and non-
governmental organizations, elderly grow unhealthier (Chatterji et al., 2008). The
perceived health of the elderly in India has declined between 1995-96 and 2004 (Husain
& Ghosh, 2010). By 2030, over 45.76% of the Indian health burden measured in
Disability Adjusted Life-Years (DALYs) is projected to be caused by adults aged 45 and
older although this age group will account for only approximately 30% of the total
population. In 2004, 25.52% of DALYs were attributable to the age group 45 and older.
There is conclusive evidence indicating that India has an “elderly (health) problem”
resulting in various challenges such as the adaptation to the needs of the elderly (Global
AgeWatch, 2013; Raju, 2011). Nevertheless, there is a lack of studies exploring the
needs such as health needs of the elderly in India making it hard to precisely define them
(Boralingaiah, Bettappa, & Kashyap, 2012; Husain & Ghosh, 2010; Raju, 2011).
Contributing to the elderly (health) problem could be the share of the gross domestic
product (GDP) devoted to health. If India wants to deliver true universal health care to
its ageing population, the share of the GDP needs to be increased (The Lancet, 2013).
India spends currently about 2% of the GDP on health (The Lancet, 2013). The World
Bank listed in 2012 for India a total health expenditure of 4.00% and a public health
expenditure of 1.30% of the GDP (The World Bank, 2014); similar numbers are reported
by Spinaci, Currat, Shetty, Crowell, and Kehler (2006).
1.1.3 Perception of aging
SPA has been defined as a lens through which age-related changes are interpreted
(Sargent-Cox, Anstey, & Luszcz, 2014; Steverink, Westerhof, Bode, & Dittmann-Kohli,
2001). It is a dynamic concept (i.e. the perception of aging can change over time)
Maastricht University | FHML | Tom Kafczyk | Master’s thesis | Chapter: 1. Introduction
5
(Sargent-Cox et al., 2014). In the context of aging, SPA is considered an important
concept because it affects future health, health behaviours and help-seeking behaviour
(Cheng, Yip, Jim, & Hui, 2012; Kleinspehn-Ammerlahn, Kotter-Gruhn, & Smith, 2008;
Sargent-Cox et al., 2014). For example, SPA is a significant predictor of mortality (Levy,
Slade, Kunkel, & Kasl, 2002; Uotinen, Rantanen, & Suutama, 2005). It has a greater
impact on survival than gender, socioeconomic status, functional health and loneliness
(Levy, Slade, Kunkel, et al., 2002) and can alternate the cardiovascular response to
stress and a wide array of other functions such as cognitive and behavioural outcomes,
handwriting, mathematical performance, physical performance, memory or views of
other older people (Levy, 1996, 2000, 2003; Levy, Hausdorff, Hencke, & Wei, 2000; Levy
& Myers, 2004; Levy, Slade, & Kasl, 2002; Levy, Slade, Kunkel, et al., 2002; Moser,
Spagnoli, & Santos-Eggimann, 2011). Moreover, SPA contributes to the interpretation of
illness and quality of life (Low, Molzahn, & Schopflocher, 2013).
SPA seems to develop by internalization and depends to some degree on common
stereotypes (Kotter-Gruhn & Hess, 2012; Levy, Slade, Kunkel, et al., 2002). In
accordance with this point are findings after which the frequency of contacts of younger
individuals with older people diminishes stereotypes (Lockenhoff et al., 2009). One
contributing factor to the SPA was described as the “societally sanctioned denigration of
the aged” (Levy, Slade, Kunkel, et al., 2002, p. 268). Stigmatized groups share the same
stereotypes that influence their self-perception (Levy, Slade, Kunkel, et al., 2002). This
could mean, for example, that the attitude of younger people towards old people living in
old age homes affects the perception of aging of older people (Dubey, Bhasin, Gupta, &
Sharma, 2011).
The aforementioned studies on SPA barely studied the variability across different settings
such as institutions, little attention has been paid to it (Kleinspehn-Ammerlahn et al.,
2008). Particularly in India, with changing caring structures and the breakdown of strong
traditional cultural systems after which the family needs to care for the elderly (see next
section “1.2 Caring structures”), the perception of aging has not been studied yet.
We may conclude that India is in a demographic transition with a growing older
population that will soon be the second largest in the world. Elderly people are compared
to younger people facing more problems such as health problems. Furthermore, SPA is
an important variable. It has shown to be a significant predictor of mortality and
contributes to quality of life. In light of societal changes in India (that are discussed in
the next subsection), a better understanding of the concept of SPA is needed.
Maastricht University | FHML | Tom Kafczyk | Master’s thesis | Chapter: 1. Introduction
6
1.2 Caring structures
This section is subdivided into three subsections. First, aging in the context of
globalization and consequences for caring structures is discussed. Next, the rise of old
age homes in India is described. Lastly, quality of life in older people is elaborated.
1.2.1 Impact of globalization
Traditionally, older persons played an important role in the family and the community in
India, their opinions carried weight (Mahapatra, 2010). Informal support systems (e.g.
values, kinship) provided support to the elderly. According to Dubey et al. (2011) old age
has never been a problem for India, just since the disintegration of the joint family old
people face now a problem. “The older generation is caught between the decline in
traditional values on one hand and the absence of an adequate social security system on
the other hand thus, finding it difficult to adjust in the family.” (Dubey et al., 2011, p.
98). Nowadays in India, amplified by globalization due to economic development, a
gradual vanishing of the traditional societal structures and social and economic values
takes place. This trend is exemplified in the transition from joint families to nuclear
families. Informal support systems are breaking down leading to increasing economic
insecurity, social isolation and abuse and neglect of the elderly within the society (Dubey
et al., 2011; Ingle & Nath, 2008; Lena et al., 2009; Mahapatra, 2010; Raju, 2011).
There is evidence, that the modernization of societies is associated with unfavourable
attitudes towards aging and a lower status of elderly within the society (Bengtson, Dowd,
Smith, & Inkeles, 1975; Lockenhoff et al., 2009). As well, with rising proportions of
elderly, as expected for India (Chatterji et al., 2008), the views of the society of aging
become less favourable and authority within families depends less on age (Lockenhoff et
al., 2009). At present, India with a young population and high status differences was
found to have a favourable view on socio-emotional aspects of aging (Lockenhoff et al.,
2009). Westernization might play a role as well. Generally, Eastern cultures hold more
positive views of aging than western cultures (e.g. Italy or France). One reason might be
higher status differences in Eastern cultures (Lockenhoff et al., 2009). This holds true for
India that has shown more positive views on aging (Lockenhoff et al., 2009).
Nevertheless, “westernization” is progressing in India (Stigler et al., 2010), what could
affect the societal views on aging.
The aforementioned changes contributed to a change in the care for the elderly towards
institutionalized care (see next subsection). Mahapatra (2010, p. 116) wrote in this
Maastricht University | FHML | Tom Kafczyk | Master’s thesis | Chapter: 1. Introduction
7
context: “The rapid increase in the elderly population, the changes in the family system,
the lifestyle of the younger generation have led to changes in the living arrangements of
elderly both in developed countries and developing ones.”
1.2.2 Old age homes
“India is at a crossroads and has to decide whether to go the family care way or the
institutional/ community care way.” (Raju, 2011, p. 13).
In order to give elderly people without social security system and without someone to
care for them a place where they get attention and care, old age homes were created
(Mahapatra, 2010). Depending on the context, old age homes are defined differently. The
National Centre for Health and Statistics defined it as “[…] a residence facility with three
or more beds that provided nursing and personal care to the aged who are chronically ill
or destitute or needy persons”.” (in Mahapatra, 2010, p. 120). Devi and Roopa (2013, p.
7) add, old age homes “are needed to take care of the lonely and forsaken elderly in the
evening of their lives”.
The demand for old age homes in India is increasing. An important reason is that less
adult children are caring for their parents in India (Liebig, 2003; Mahapatra, 2010). As a
result, old age homes “have sprung up” to meet the needs of the elderly that have not
been recognized earlier; consequently the population living in old age homes is rising
(Lena et al., 2009; Singh, Kumar, & Reddy, 2012).
Major reasons to shift to an old age home in India include the maladjustment of the
elderly in the family, poverty of the elderly and the migration of children in search of
employment opportunities (Devi & Roopa, 2013). In addition, Mahapatra (2010)
mentioned the following reasons: feeling of loneliness at home (e.g. no kids, loss of
husband/wife, loss of control), having no one to care for them (e.g. family might not be
willing to care for their older family members at home), decline of physical and mental
functioning or seeking a change from the urban hype.
The societal change towards nuclear families driven by factors associated with
globalization is reflected to some degree in the rising demand of old age homes. The new
form of institutionalized care for older family members in the Indian society has been
considered by Devi and Roopa (2013) as borrowed from the “West”. Since the idea of old
age homes in India is relatively new, the adjustment and well-being of residents in old
age homes is an important field of study. However, there is a scarcity of research
Maastricht University | FHML | Tom Kafczyk | Master’s thesis | Chapter: 1. Introduction
8
investigating the results of these changes from non-institutional to institutional care in
the Indian context. “There is much research on the problem of the institutionalized old
people abroad but in India, very little organized information is available about the
problem of the aged living the families and in old age homes.” (Devi & Roopa, 2013, p.
7).
1.2.3 Quality of life
The World Health Organization defines quality of life as “an individual’s perception of
his/her position in life in the context of the culture and value systems in which he/she
lives, and in relation to his/her goals expectations, standards and concerns. It is a broad-
ranging concept, incorporating in a comparing way the person’s physical health,
psychological state, level of independence, social relationships, and their relationship to
salient features of their environment.” (in Devi & Roopa, 2013, p. 8).1
Mathew, George, and Paniyadi (2009) reported that institutionalized older people in
Kerala, India, have more stress and report lower quality of life than their non-
institutionalized counterparts. Dongre and Deshmukh (2012) identified factors that could
explain why elderly in India in old age homes have a lower quality of life. They identified
the working status, not being neglected, involvement in social activities and the
relationship with family as factors that determine quality of life. These factors can be
expected to be lower in residents in old age homes and could therefore explain why
Mathew et al. (2009) found a lower quality of life. This is in line with Raju (2011, p. 8)
who stated that non-institutionalized elderly people are better adjusted because of the
“deep rooted” tradition in the Indian society that it is the duty of the family to “look after
the elderly”. The family is perceived to be the main provider of elderly care and the
better environment (Dongre & Deshmukh, 2012). Dubey et al. (2011) bring in another
factor that could partly explain why institutionalized elderly people demonstrate lower
quality of life. They reported that women in the state Jammu and Kashmir, India, living
with their families in contrast to institutionalized older people had a more positive
perception of aging while the attitude of younger people towards old people living in old
age homes was unsatisfactorily (see subsection “1.1.3 Perception of aging”). Antonelli,
Rubini, and Fassone (2000) reported results for elderly in Italy that are similar to what
1 Leventhal and Colman (2007, p. 756) add: “Quality may be better in one domain (e.g., social relationships) than another (e.g., ambulatory ability), but whatever and wherever it differs, the judgment of quality is a product of both the individual’s assessment of his or her personal experience within a variety of domains (i.e., data) and the integration of these observations into an overall judgment using a decision rule yet unspecified.”
Maastricht University | FHML | Tom Kafczyk | Master’s thesis | Chapter: 1. Introduction
9
Dubey et al. (2011) found in India: institutionalized elderly people compared to their
non-institutionalized counterparts had a more negative self-concept. Contrary to what
has been mentioned above, Devi and Roopa (2013) reported lower quality of life in non-
institutionalized elderly in Karnataka in the age group 65-70 compared to elderly that are
71-76 years old. However, Devi and Roopa (2013) did not offer an explanation.
Ultimately, there is a lack of studies in quality of life research in this respect, making it
hard define the needs of the elderly and consequently to enable the conditions or
circumstances in which successive elderly cohorts grow older with more quality in their
life.
To summarize what has been mentioned so far, India’s population is growing and aging.
Due to processes associated with globalization, older people face now a decline in
traditional values that is leading to a breakdown of family structures and a rise in the
number of old age homes. Not the family but institutions look now more and more after
the elderly. Non-institutionalized older people living among their family might be better
adjusted and hence show a higher quality of life. The perception of aging could be one
factor that explains this relationship. In light of the societal changes in India, a better
understanding of different living arrangements and hence caring structures and their
impact on quality of life could be beneficial. Interesting is furthermore, if or how the SPA
is involved in this relationship.
1.3 Rationale and aim of the study
The present study assumes that processes associated with globalization such as
modernization changed traditional family dynamics. With fewer children caring for their
parents and a breakdown in traditional norms, more and more elderly have to move to
an old age home. Accordingly, old age homes reflect changing caring-structures in India
towards institutionalization. India will soon have the second largest population of older
people in the world and yet, the impact of this change from traditional caring structures
within the family to institutions is not well understood. This holds particularly true for the
impact on quality of life. Spending the last years in an old age home and not as
traditionally dominant among the family in the community may negatively affect quality
of life (Mathew et al., 2009). Moreover, the SPA could mediate this relationship as the
experience associated with moving to an old age home could affect the SPA (Dubey et
al., 2011). The SPA can explain why the external event of living in an old age home leads
Maastricht University | FHML | Tom Kafczyk | Master’s thesis | Chapter: 1. Introduction
10
to differences in quality of life. In light of the ever growing population in India over 60
(Global AgeWatch, 2013), factors affecting quality of life is an urgent issue (Low et al.,
2013) and should have priority in research.
The aim of the present study is to shed light on potential differences in quality of life of
elderly people in India living in the community versus living in old age homes; and to
shed light on the SPA of elderly people as a possible concept that partly explains the
difference. This understanding could help policy-makers to design better strategies to
enhance the quality of life of older persons in late life.
1.4 Research question and hypotheses
In this section, the research question and stipulated hypotheses are introduced followed
by a conceptual diagram of the study model.
1.4.1 Research question
The research question is: Does living arrangement (community versus old age home)
determines differences in quality of life and is this difference partly explained by the
perception of aging among older adults over 55? As sex, age and health may influence
living arrangement, the perception of aging and quality of life, the influence of these
variables will be taken into account.
1.4.2 Hypotheses
Hypothesis 1 (H1): Older people in old age homes have a more negative quality of life
compared to older people living in the community.
Hypothesis 2 (H2): Older people in old age homes have a more negative SPA compared
to older people living in the community.
Hypothesis 3 (H3): Older people with a more negative SPA report a more negative
quality of life compared to older people with a more positive SPA.
From these three hypotheses, a final fourth hypothesis can be formulated:
Hypothesis 4 (H4): The association between living arrangement and quality of life is
partly explained by SPA.
Maastricht University | FHML | Tom Kafczyk | Master’s thesis | Chapter: 1. Introduction
11
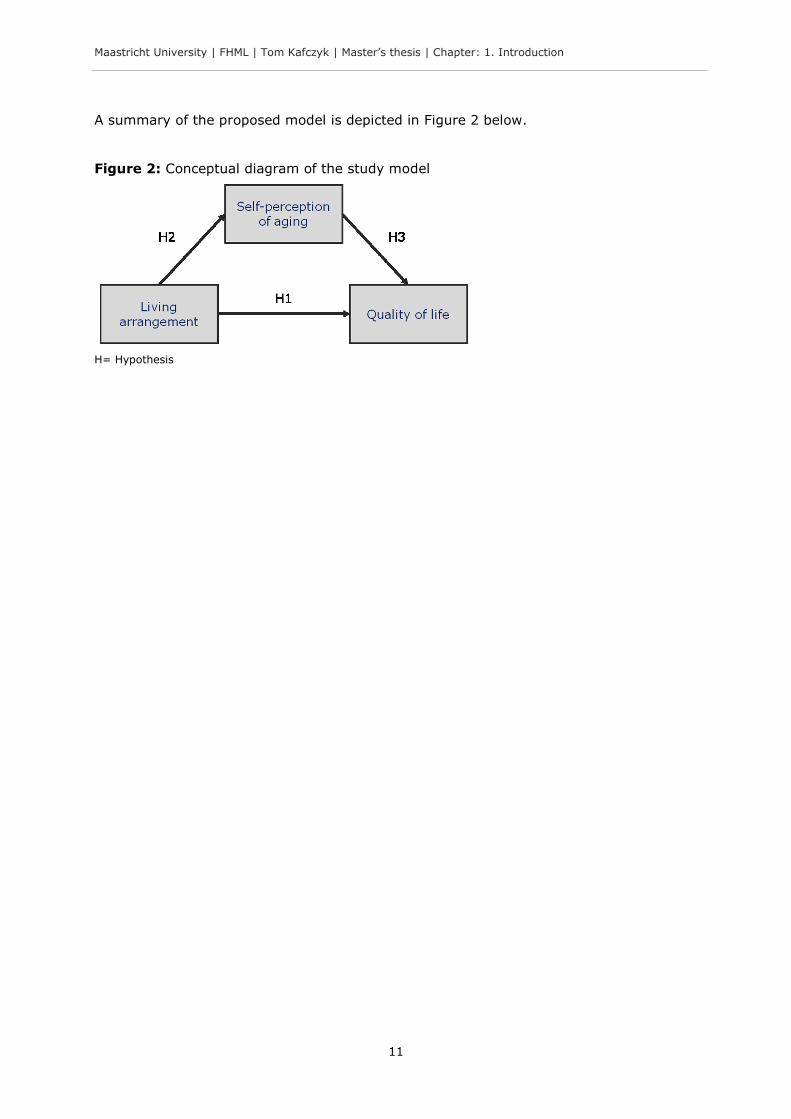
A summary of the proposed model is depicted in Figure 2 below.
Figure 2: Conceptual diagram of the study model
H= Hypothesis
Maastricht University | FHML | Tom Kafczyk | Master’s thesis | Chapter: 2. Methods
12
2. Methods
In this second chapter the proposed methods of the present study will be described.
First, the data collection is elaborated. Next, the variables that are used are introduced.
Finally, the statistical analysis of the data is described followed by ethical considerations.
2.1 Data collection
In this section, first, the sampling is described with details about the inclusion- and
exclusion criteria, the recruitment procedure, the sampling area and the sample size.
Second, the data collection procedure in the field is outlined.
The data collection took place from May 24 to June 10 2014.
2.1.1 Sampling
Inclusion criteria
Three inclusion criteria for the present study were defined: (1) participants were ≥ 55
years old, (2) participants gave an informed consent and (3) the participants lived either
in the community or in an old age home at the time of data collection.
Worldwide, there is no standard numerical criterion to define an older person (World
Health Organization, 2014b). Often the pension age of ≥ 60 is used (e.g. Mathew et al.,
2009; World Health Organization, 2014b); in other contexts, for example Africa, the age
of ≥ 50 is considered as old (World Health Organization, 2014b). The present study has
adopted the age of ≥ 55 to define an older person for three reasons. First, to account for
a lower life expectancy in India; life expectancy at age 60 is 17-18 years in India (Global
AgeWatch, 2013; Jeyalakshmi, Chakrabarti, & Gupta, 2011) compared to approximately
23 in more developed regions such as Europe and as high as 26 in Japan (Global
AgeWatch, 2013; United Nations, 2013). Second, most Indians seem to consider
themselves as old before the age of 60 (Dubey et al., 2011). And lastly, in view of
practical issues such as resource constraints in the present study, the age of ≥ 55
enabled to collect more data in an easy way. Indirectly through more data more
statistical power was achieved.
Maastricht University | FHML | Tom Kafczyk | Master’s thesis | Chapter: 2. Methods
13
Exclusion criteria
Two exclusion criteria were defined: (1) the participant was unable to communicate
intended answers (e.g. participant is unable to speak or give answers otherwise) and (2)
the participant did not understand instructions (written and verbally) (e.g. due to severe
dementia, visual and hearing impairment). Eventually, the exclusion of participants was
subject to the researchers’ interpretation in a case to case manner in consultation with
the translator (see below) and employees (e.g. manager) within the old age homes or
relatives in the community.
Two different sampling methods were employed for the different living arrangements and
are described in the following.
Recruitment: old age home
There is no record of old age homes in Karnataka state hence, a convenient sample had
to be deployed to recruit participants from institutions (T. Andrews, personal
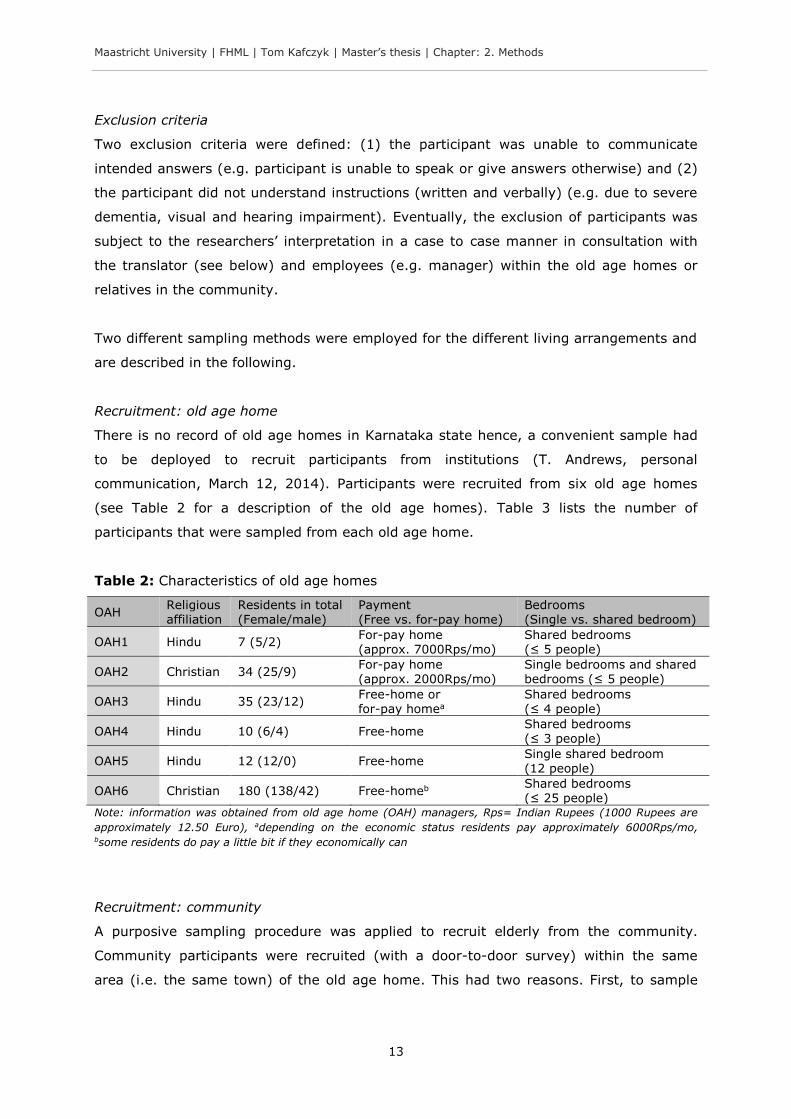
communication, March 12, 2014). Participants were recruited from six old age homes
(see Table 2 for a description of the old age homes). Table 3 lists the number of
participants that were sampled from each old age home.
Table 2: Characteristics of old age homes
OAH Religious affiliation
Residents in total (Female/male)
Payment (Free vs. for-pay home)
Bedrooms (Single vs. shared bedroom)
OAH1 Hindu 7 (5/2) For-pay home (approx. 7000Rps/mo)
Shared bedrooms (≤ 5 people)
OAH2 Christian 34 (25/9) For-pay home (approx. 2000Rps/mo)
Single bedrooms and shared bedrooms (≤ 5 people)
OAH3 Hindu 35 (23/12) Free-home or for-pay homea
Shared bedrooms (≤ 4 people)
OAH4 Hindu 10 (6/4) Free-home Shared bedrooms (≤ 3 people)
OAH5 Hindu 12 (12/0) Free-home Single shared bedroom (12 people)
OAH6 Christian 180 (138/42) Free-homeb Shared bedrooms (≤ 25 people)
Note: information was obtained from old age home (OAH) managers, Rps= Indian Rupees (1000 Rupees are
approximately 12.50 Euro), adepending on the economic status residents pay approximately 6000Rps/mo, bsome residents do pay a little bit if they economically can
Recruitment: community
A purposive sampling procedure was applied to recruit elderly from the community.
Community participants were recruited (with a door-to-door survey) within the same
area (i.e. the same town) of the old age home. This had two reasons. First, to sample
Maastricht University | FHML | Tom Kafczyk | Master’s thesis | Chapter: 2. Methods
14
participants from the same area reduces extraneous variables such as access to
transport or noise pollution and in this way the influence of other (not controlled)
environmental variables on the study outcome was kept as minimal as possible; and
second, to collect data in the same town was practically more feasible with regards to the
time- and resource constraints of the present study work.
Sampling area
Data was collected in the South Canara region in Karnataka state, India, in the Dakshina
Kannada and Udupi district; both districts bound to the west with the Arabian Sea. From
1.2 billion people in India, 61.1 million lives in the state of Karnataka. Within Karnataka,
about 2.1 million lives in Dakshina Kannada district and about 1.2 million lives in Udupi
district (see “Appendix 2 Demographics in Karnataka”). Kannada is the official language
and most widely spoken in Karnataka. The vast majority is Hindu, with fewer Muslims
and Christians (Ministry of Home Affairs, 2014a). The percentage of urban population in
Karnataka has increased from 34.00% in 2001 to 38.67% in 2011. In Dakshina Kannada
district 47.67% lived in urban areas in 2011 and in Udupi 28.37% (Indian Census, 2011).
Urbanization in Karnataka and South Canara is rapidly increasing.
In Dakshina Kannada district, data was collected in the city Mangalore. In Udupi district,
data was collected in the village Thekatte, the city Udupi and the towns Brahmavar,
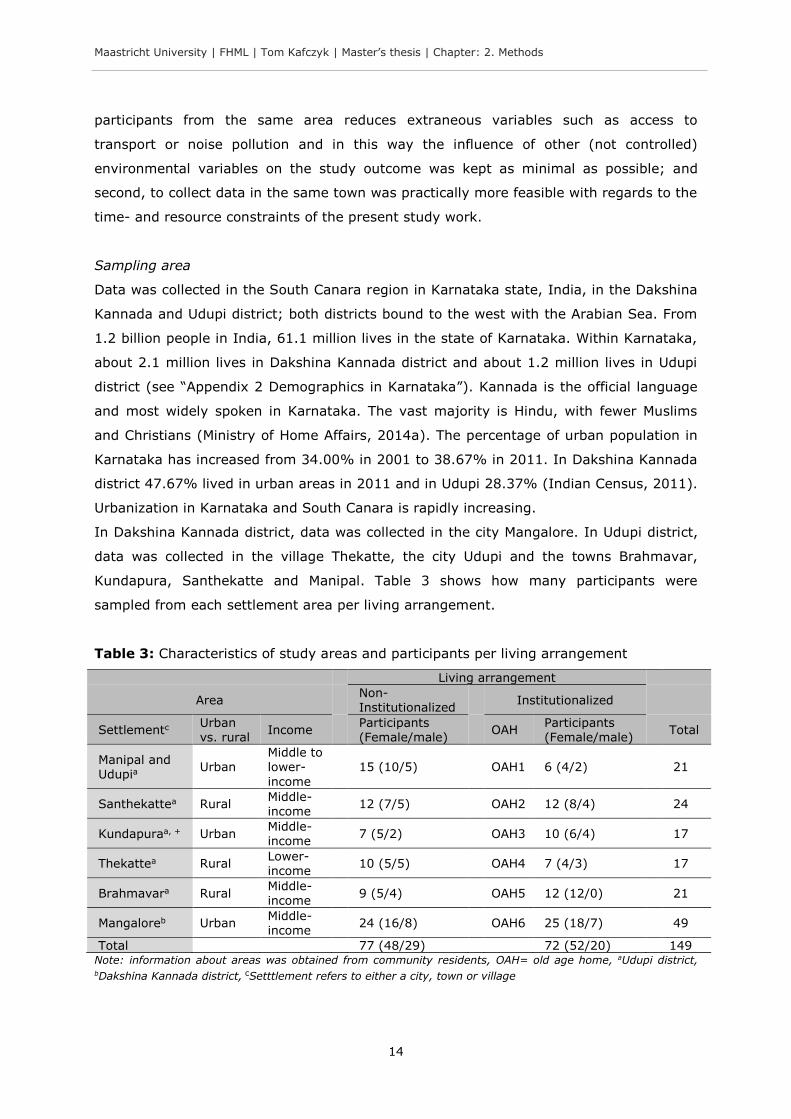
Kundapura, Santhekatte and Manipal. Table 3 shows how many participants were
sampled from each settlement area per living arrangement.
Table 3: Characteristics of study areas and participants per living arrangement
Living arrangement
Area Non-Institutionalized
Institutionalized
Settlementc Urban vs. rural
Income Participants (Female/male)
OAH Participants (Female/male)
Total
Manipal and Udupia
Urban Middle to lower-
income
15 (10/5) OAH1 6 (4/2)
21
Santhekattea Rural Middle-income
12 (7/5) OAH2 12 (8/4)
24
Kundapuraa, + Urban Middle-income
7 (5/2) OAH3 10 (6/4)
17
Thekattea Rural Lower-income
10 (5/5) OAH4 7 (4/3)
17
Brahmavara Rural Middle-income
9 (5/4) OAH5 12 (12/0)
21
Mangaloreb Urban Middle-income
24 (16/8) OAH6 25 (18/7)
49
Total 77 (48/29) 72 (52/20) 149 Note: information about areas was obtained from community residents, OAH= old age home, aUdupi district,
bDakshina Kannada district, cSetttlement refers to either a city, town or village
Maastricht University | FHML | Tom Kafczyk | Master’s thesis | Chapter: 2. Methods
15
Target sample size
The general rule of thumb was applied, that at least 10 participants per variable are
needed in order to obtain adequate statistical results. The target sample size was set at a
minimum of approximately 120 participants, i.e. six (variables) multiplied with 10
(participants) multiplied by two (living arrangements).
2.1.2 Procedure
Each participant was invited to take part in the study individually. The study details were
explained and the possibility to ask questions was given. A subject information sheet was
handed over to the participant along with contact addresses in case of any further
questions, doubts or requests. If the participant agreed to participate, an informed
consent had to be signed stating for instance that the participation is voluntary and
confidential. If the participant was not able to sign, an oral consent was obtained and
confirmed by the signature of a witness (see “Appendix 3 Informed consent template”).
If the participant had no further questions, the questionnaires were filled in. Because
some elderly were not able to do the paper and pencil task or did not want to self-
administer the questionnaires, assistance in filling in the questionnaires was provided.
Reasons for assistance included illiteracy2, visual impairments or writing limitations. Each
participant was asked if she or he could or wants to fill in the questionnaire by her- or
himself. Two modes of questionnaire administration were hence used: (1) interview-style
(interviewer reads the questions and writes down the answers) and (2) questionnaire-
form (self-administered). English and Kannada version questionnaires were employed. If
the participant was bilingual in both languages, the participant was asked which language
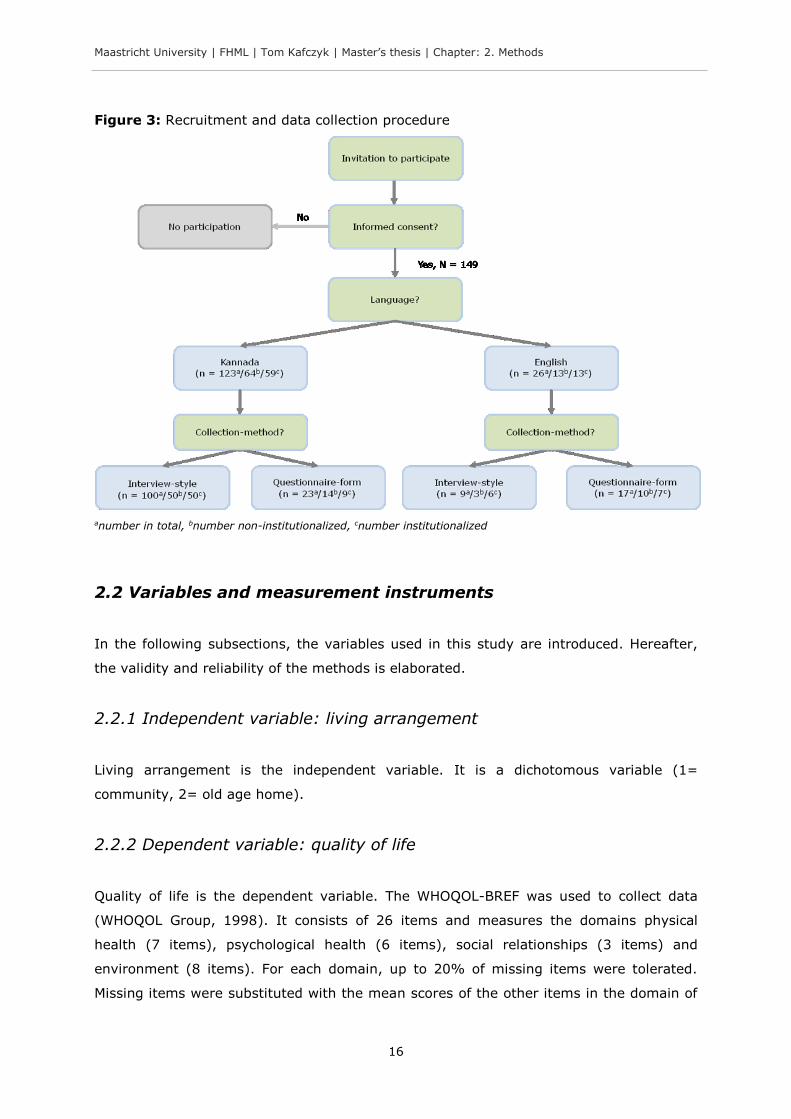
she or he preferred. The procedure is summarized in Figure 3 (along with the frequency
of the language and interview-form).
Translator
Because the principal investigator was not fluent in Kannada, a translator was employed
for this study. The translator was a Master of Science student at Manipal University,
fluent in Kannada (native) and English.
2 In 2011, Dakshina Kannada district had a literacy rate of 88.57%, Udupi district of 86.24% (Indian Census, 2011).
Maastricht University | FHML | Tom Kafczyk | Master’s thesis | Chapter: 2. Methods
16
Figure 3: Recruitment and data collection procedure
anumber in total, bnumber non-institutionalized, cnumber institutionalized
2.2 Variables and measurement instruments
In the following subsections, the variables used in this study are introduced. Hereafter,
the validity and reliability of the methods is elaborated.
2.2.1 Independent variable: living arrangement
Living arrangement is the independent variable. It is a dichotomous variable (1=
community, 2= old age home).
2.2.2 Dependent variable: quality of life
Quality of life is the dependent variable. The WHOQOL-BREF was used to collect data
(WHOQOL Group, 1998). It consists of 26 items and measures the domains physical
health (7 items), psychological health (6 items), social relationships (3 items) and
environment (8 items). For each domain, up to 20% of missing items were tolerated.
Missing items were substituted with the mean scores of the other items in the domain of
Maastricht University | FHML | Tom Kafczyk | Master’s thesis | Chapter: 2. Methods
17
the respective participant. Two general items measure health satisfaction and overall
quality of life. Answers were given on a 5-point Likert scale in relation to the last two
weeks (see “Appendix 4 WHOQOL-BREF and domain facets”). The domain scores ranged
on a scale from 0 to 100, higher scores indicate a “better” quality of life.3 Some items
had to be recoded. A translated version in Kannada was available from the World Health
Organization (Chandra, Deepthivarma, Jairam, & Thomas, 2003). Skevington, Lotfy, and
O'Connell (2004) found a Cronbach’s alpha in a field trial in India (Delhi) of 0.76 for the
physical domain, 0.80 for the psychological domain, 0.63 for the social domain and 0.84
for the environmental domain. Hwang, Liang, Chiu, and Lin (2003) confirmed these
results for older people but found a higher Cronbach’s alpha for the social domain with
0.73. In the present study, the Cronbach’s alpha for the physical domain was 0.80, for
the psychological domain 0.62, for the social domain 0.75 and for the environmental
domain 0.76. Permission to use the English and Kannada version of the WHOQOL-BREF
for the purpose of this study was obtained prior the study start (see “Appendix 5
WHOQOL-BREF user agreement”).
2.2.3 Mediating variable: self-perception of aging
Self-perception of aging (SPA) is considered the mediating variable. SPA was measured
with the Attitudes Toward Own Aging subscale from the Lawton Philadelphia Geriatric
Centre Morale Scale (Lawton, 1975). The scale has been used in different studies (e.g.
Jang, Poon, Kim, & Shin, 2004; Levy, Slade, & Kasl, 2002; Sargent-Cox et al., 2014) and
consists of five items. Respondents answered in a yes/no or better/worse format for each
item (see “Appendix 6 Self-perception of aging questionnaire”). Two items had to be re-
coded. The score in sum ranges theoretically from 0 to 5. For each high morale response
a “1” was given, each low morale response received a “0”. For example, if “Do things
keep getting worse as you get older?” was answered with a “yes” then a “0” was given.
Higher scores indicate a more positive SPA. A translated version into Kannada language
was not found in the literature. The English version was hence translated in Kannada
following the validated two-phase translation procedure from Sperber (2004). The reader
is referred to “Appendix 7 Translation of the self-perception of aging questionnaire” for a
detailed description of the procedure. Jang, Poon, Kim, and Shin (2004) established a of
Cronbach’s alpha of 0.71. In the present study, a Cronbach’s alpha of 0.70 was found.
Permission to use the scale is granted (Lawton, 2003).
3 At first, a sum score for each of the domains was calculated. The scores range theoretically from 7 to 35 for the physical domain, 6 to 30 for the psychological domain, from 3 to 15 for the social relationships domain and from 8 to 40 for the environmental domain. These raw scores were then converted to a 0-100 scale.
Maastricht University | FHML | Tom Kafczyk | Master’s thesis | Chapter: 2. Methods
18
2.2.4 Covariates
Covariates were obtained to statistically control for variables that could confound the
outcome. For practical reasons and reasons of feasibility it has been decided to control
for three variables. These are sex (0= female, 1= male), age (numerical in years) and
health (1= very dissatisfied, 2= dissatisfied, 3= neither satisfied nor dissatisfied, 4=
satisfied, 5= very dissatisfied). For the latter, the question “How satisfied are you with
your health?” was asked, one general question from the WHOQOL-BREF questionnaire
(WHOQOL Group, 1998). Age and health have been shown to influence quality of life
(Dongre & Deshmukh, 2012; Kumar, Majumdar, & G, 2014). A less consistent finding in
the literature is that the sex of elderly people influences quality of life (Barua, Mangesh,
Kumar, & Saajan, 2005; Devi & Roopa, 2013). As well, age and health have been shown
to affect the perception of aging (Jang et al., 2004; Kleinspehn-Ammerlahn et al., 2008).
2.2.5 Validity and reliability
Validity and reliability has been ensured by using already existing and validated
measurement instruments that are frequently used in the literature. The internal
consistency of the instruments (in English) was found to be acceptable to good in
previous studies what has been confirmed by the internal consistency measures obtained
in this study. The translated versions of the instruments (in Kannada language) were
either validated by the World Health Organization (WHOQOL-BREF) or were translated in
the present study with a strict and validated translation procedure (SPA scale, see
“Appendix 7 Translation of the self-perception of aging questionnaire”). Furthermore, to
reduce the influence of extraneous variables on the study outcome, a purposive sampling
was applied to sample elderly from both the community and institutions from the same
area. The principal investigator was moreover aware of potential biases due to his own
role in the study and tried to minimize these biases (e.g. interviewer bias4) as much as
possible.
4 The interviewer bias means that the interviewer influences the respondents’ answer; the interviewer is not
completely neutral (Bowling, 2005).
Maastricht University | FHML | Tom Kafczyk | Master’s thesis | Chapter: 2. Methods
19
2.3 Statistical analysis
The Statistical Package for the Social Sciences (SPSS, v. 20) was used to analyze the
data. In order to avoid data entry errors to SPSS, a double entry verification method was
used using the update syntax of SPSS to identify mismatches.
The model, terms and relation to hypotheses
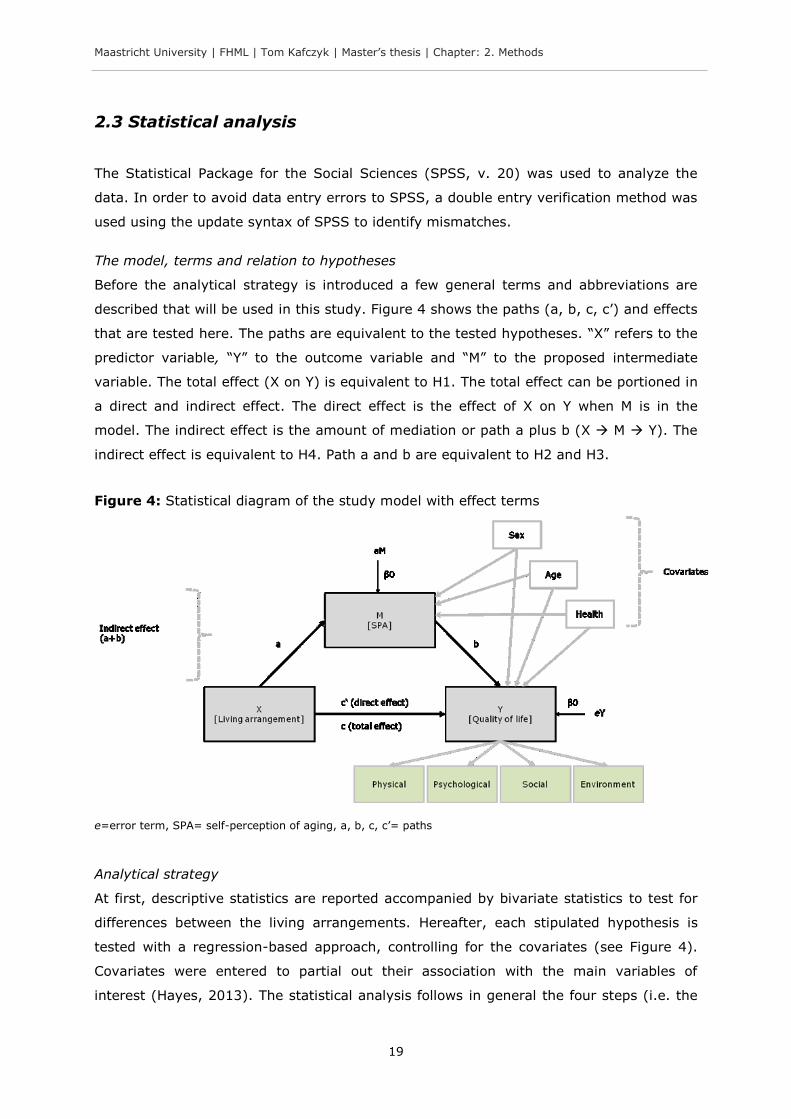
Before the analytical strategy is introduced a few general terms and abbreviations are
described that will be used in this study. Figure 4 shows the paths (a, b, c, c’) and effects
that are tested here. The paths are equivalent to the tested hypotheses. “X” refers to the
predictor variable, “Y” to the outcome variable and “M” to the proposed intermediate
variable. The total effect (X on Y) is equivalent to H1. The total effect can be portioned in
a direct and indirect effect. The direct effect is the effect of X on Y when M is in the
model. The indirect effect is the amount of mediation or path a plus b (X M Y). The
indirect effect is equivalent to H4. Path a and b are equivalent to H2 and H3.
Figure 4: Statistical diagram of the study model with effect terms
e=error term, SPA= self-perception of aging, a, b, c, c’= paths
Analytical strategy
At first, descriptive statistics are reported accompanied by bivariate statistics to test for
differences between the living arrangements. Hereafter, each stipulated hypothesis is
tested with a regression-based approach, controlling for the covariates (see Figure 4).
Covariates were entered to partial out their association with the main variables of
interest (Hayes, 2013). The statistical analysis follows in general the four steps (i.e. the
Maastricht University | FHML | Tom Kafczyk | Master’s thesis | Chapter: 2. Methods
20
four hypotheses) of the mediation analysis described by Baron and Kenny (1986).
However, the procedure from Baron and Kenny (1986) seems to be in some aspects
outdated and restrictive (e.g. Hayes, 2009, 2013; Rucker, Preacher, Tormala, & Petty,
2011; Shrout & Bolger, 2002). For example, the procedure by Baron and Kenny (1986)
was shown to have less power in detecting mediation effects than newer methods (e.g.
Hayes, 2009; Shrout & Bolger, 2002). In addition, the four step approach requires that
each path in the model is significant. Although one path is not significant, the indirect
effect should always be tested (Hayes, 2013). To test hypothesis four, consequently, a
bootstrapping procedure was performed that is the recommended method to test the
indirect effects (Hayes, 2009, 2013; Preacher & Hayes, 2004; Shrout & Bolger, 2002).5
Supplementary, a Sobel test, i.e. a normal theory test for the indirect effect, was
performed. Assumptions to run the statistical tests were tested.6 There were no extreme
violations. Outliers of greater than three standard deviations of the residuals from the
mean were removed if their influence on the test outcome was of serious concern.
Statistical significance was set at an alpha level of 0.05. In addition, to account for
multiple comparisons, a Bonferroni correction was applied (e.g. Zhang, Quan, Ng, &
Stepanavage, 1997). The alpha of 0.05 was divided by the number of comparisons (i.e.
four WHOQOL-BREF domains). Hence, an alpha of 0.0125 was considered as significant
each time quality of life was the outcome variable (in H1, H3 and H4). To take into
account multiple comparison for the bootstrapping procedure in H4, a 99% confidence
interval (CI) was used to infer significance. The 95% CI is reported nevertheless, for
reasons of familiarity, completeness and to increase replicability.7
2.4 Ethical considerations
This study was reviewed by the Institutional Ethics Committee, Kasturba Hospital,
Manipal, India. The study protocol received approval May 13 2014 (no. IEC 300/2014)
(see “Appendix 8 Ethical clearance certificate”).
5 Bootstrapping estimates the indirect effect by resampling the original sample with replacement (here 10000 bootstrap samples were used). It generates a representation of the sampling distribution of the indirect effect to compute a confidence interval (CI). If the CI for the indirect effect does not include zero, it suggests a significance of the indirect effect (i.e. mediation) (Hayes, 2013). 6 For bivariate statistics, the assumptions normality and homogeneity of variance were tested. For multiple regression, the assumptions independence of residuals, linear relationship, homoscedasticity, multicolinearity and normal distribution of residuals were tested. 7 In the following text, two asterisks highlight a Bonferonni corrected significance (**p < 0.0124), one asterisk highlights a non-corrected significance (*p < 0.05).
Maastricht University | FHML | Tom Kafczyk | Master’s thesis | Chapter: 3. Results
21
3. Results
In this third chapter, first descriptive statistics are reported. Secondly, results are
presented to test each stipulated hypothesis. Additionally, from “Appendix 9 Correlations
among study variables” correlations between the study variables can be obtained.
From 149 initially conducted interviews, 10 were excluded from the data analysis to not
affect the trustworthiness of the data. During the data collection, while the interviews
were conducted, it became clear that three participants from the community and four
from old age homes did not understand the instructions. As well, during two interviews in
the community relatives influenced or answered in the name of the participants. The
participants answered therefore not entirely independent. One participant’s age in an old
age home turned out to be under 55 years of age. These participants were excluded from
the analysis. The analysis is therefore based on a sample of 139 participants.
3.1 Descriptive statistics
From the final sample of 139 participants, 72 were from the community and 67 from old
age homes. The majority (67%) of the sample was female and there were more females
(73%) in institutions compared to the community (61%). However, the difference was
not significant. Participants in institutions were with a mean age of 71.64 (SD = 9.40)
significantly older than participants in the community with a mean age of 68.04 (SD =
8.00). The self-perception of aging (SPA) did not differ significantly between participants
in the community (M = 3.24, SD = 1.60) and institutions (M = 2.88, SD = 1.65).
Significant differences in quality of life between elderly people in the community and old
age homes were found. Elderly people in old age homes reported significantly lower
scores in all quality of life domains compared to elderly people in the community (see
Table 4).
Maastricht University | FHML | Tom Kafczyk | Master’s thesis | Chapter: 3. Results
22
Table 4: Descriptive characteristics of the study sample
Living arrangement
Characteristic Non-institutionalized (N= 72)
Institutionalized (N= 67)
Total (N= 139)
Statistical comparison
Sex Female (N (%)) Male (N (%))
44 (61.11%) 28 (38.89%)
49 (73.13%) 18 (26.87%)
93 (66.91%) 46 (33.09%)
X2 (1, N= 139)= 2.27, p= 0.152
Age (Mean ± SD) 68.04 ± 8.00 71.64 ± 9.40 69.65 ± 8.83 t(137) = -2.26, p = 0.025*
Health (Mean ± SD) 3.26 ± 1.05 3.34 ± 0.96 3.30 ± 1.00 t(137) = -0.46, p = 0.643
SPA (Mean ± SD) 3.24 ± 1.60 2.88 ± 1.65 3.06 ± 1.63 t(137) = 1.29, p = 0.199
Domains of QOL (Mean ± SD)
Physical 61.86 ± 18.61 51.60 ± 16.78 56.88 ± 18.42 t(136) = 3.40, p = 0.001** Psychological 61.20 ± 14.78 54.49 ± 14.36 57.97 ± 14.91 t(135) = 2.69, p = 0.008** Social relations 67.38 ± 20.30 51.77 ± 22.00 59.80 ± 22.47 t(134) = 4.30, p < 0.001** Environment 60.13 ± 15.83 50.12 ± 13.78 55.31 ± 15.65 t(137) = 3.96, p < 0.001** *p < 0.05, **p < 0.0125, X2 = Chi-Square test, t = Student’s t-test, SD= standard deviation, SPA= self-
perception of aging, QOL= quality of life
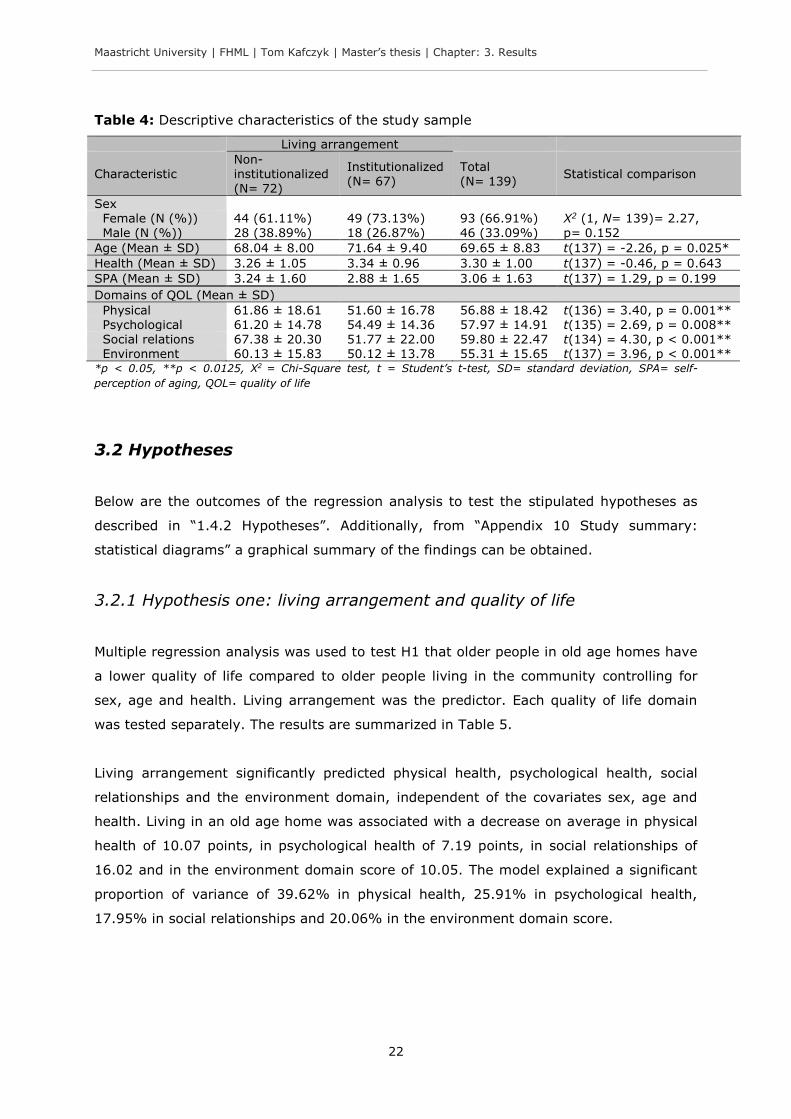
3.2 Hypotheses
Below are the outcomes of the regression analysis to test the stipulated hypotheses as
described in “1.4.2 Hypotheses”. Additionally, from “Appendix 10 Study summary:
statistical diagrams” a graphical summary of the findings can be obtained.
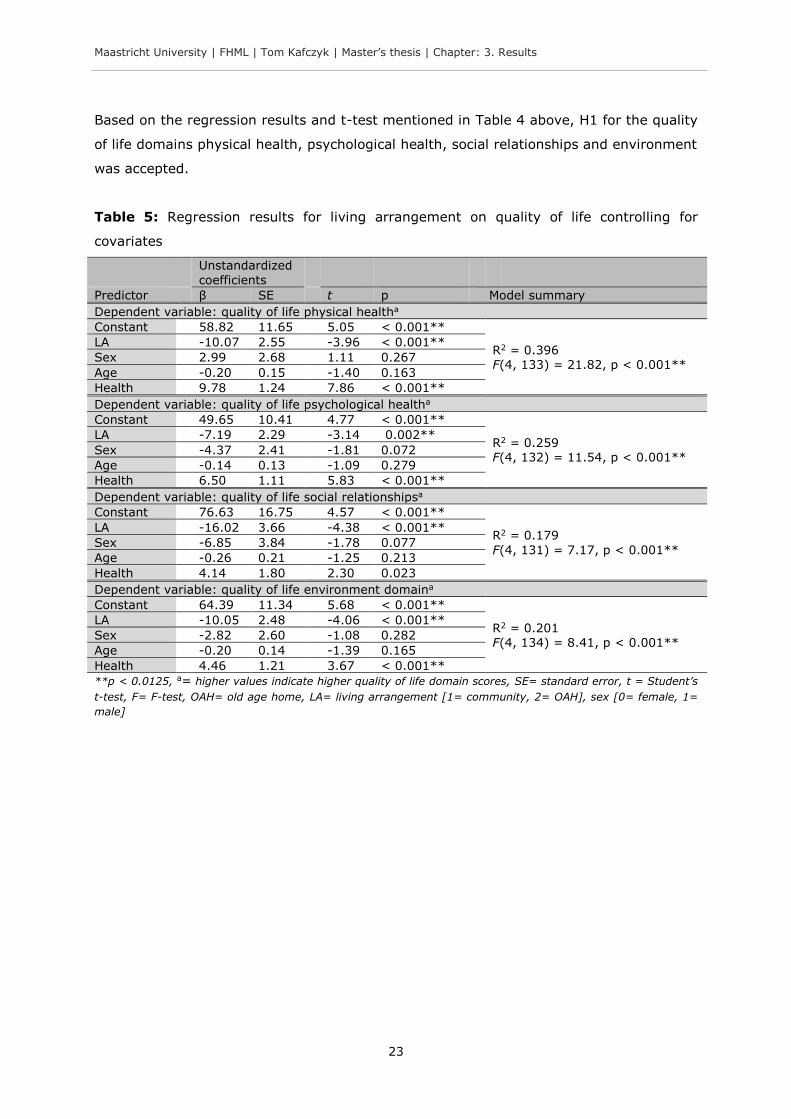
3.2.1 Hypothesis one: living arrangement and quality of life
Multiple regression analysis was used to test H1 that older people in old age homes have
a lower quality of life compared to older people living in the community controlling for
sex, age and health. Living arrangement was the predictor. Each quality of life domain
was tested separately. The results are summarized in Table 5.
Living arrangement significantly predicted physical health, psychological health, social
relationships and the environment domain, independent of the covariates sex, age and
health. Living in an old age home was associated with a decrease on average in physical
health of 10.07 points, in psychological health of 7.19 points, in social relationships of
16.02 and in the environment domain score of 10.05. The model explained a significant
proportion of variance of 39.62% in physical health, 25.91% in psychological health,
17.95% in social relationships and 20.06% in the environment domain score.
Maastricht University | FHML | Tom Kafczyk | Master’s thesis | Chapter: 3. Results
23
Based on the regression results and t-test mentioned in Table 4 above, H1 for the quality
of life domains physical health, psychological health, social relationships and environment
was accepted.
Table 5: Regression results for living arrangement on quality of life controlling for
covariates
Unstandardized
coefficients
Predictor β SE t p Model summary
Dependent variable: quality of life physical healtha
Constant 58.82 11.65 5.05 < 0.001**
R2 = 0.396 F(4, 133) = 21.82, p < 0.001**
LA -10.07 2.55 -3.96 < 0.001**
Sex 2.99 2.68 1.11 0.267
Age -0.20 0.15 -1.40 0.163
Health 9.78 1.24 7.86 < 0.001**
Dependent variable: quality of life psychological healtha
Constant 49.65 10.41 4.77 < 0.001**
R2 = 0.259 F(4, 132) = 11.54, p < 0.001**
LA -7.19 2.29 -3.14 0.002**
Sex -4.37 2.41 -1.81 0.072
Age -0.14 0.13 -1.09 0.279
Health 6.50 1.11 5.83 < 0.001**
Dependent variable: quality of life social relationshipsa
Constant 76.63 16.75 4.57 < 0.001**
R2 = 0.179
F(4, 131) = 7.17, p < 0.001**
LA -16.02 3.66 -4.38 < 0.001**
Sex -6.85 3.84 -1.78 0.077
Age -0.26 0.21 -1.25 0.213
Health 4.14 1.80 2.30 0.023
Dependent variable: quality of life environment domaina
Constant 64.39 11.34 5.68 < 0.001**
R2 = 0.201 F(4, 134) = 8.41, p < 0.001**
LA -10.05 2.48 -4.06 < 0.001**
Sex -2.82 2.60 -1.08 0.282
Age -0.20 0.14 -1.39 0.165
Health 4.46 1.21 3.67 < 0.001**
**p < 0.0125, a= higher values indicate higher quality of life domain scores, SE= standard error, t = Student’s
t-test, F= F-test, OAH= old age home, LA= living arrangement [1= community, 2= OAH], sex [0= female, 1=
male]
Maastricht University | FHML | Tom Kafczyk | Master’s thesis | Chapter: 3. Results
24
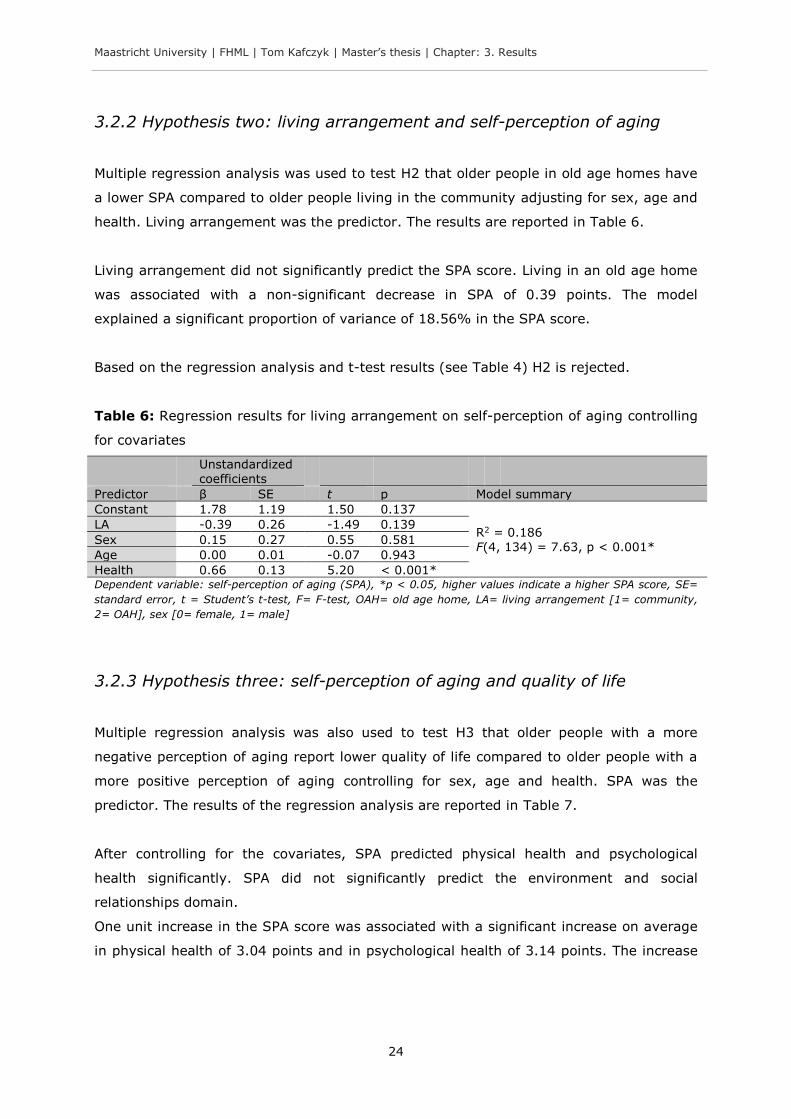
3.2.2 Hypothesis two: living arrangement and self-perception of aging
Multiple regression analysis was used to test H2 that older people in old age homes have
a lower SPA compared to older people living in the community adjusting for sex, age and
health. Living arrangement was the predictor. The results are reported in Table 6.
Living arrangement did not significantly predict the SPA score. Living in an old age home
was associated with a non-significant decrease in SPA of 0.39 points. The model
explained a significant proportion of variance of 18.56% in the SPA score.
Based on the regression analysis and t-test results (see Table 4) H2 is rejected.
Table 6: Regression results for living arrangement on self-perception of aging controlling
for covariates
Unstandardized coefficients
Predictor β SE t p Model summary
Constant 1.78 1.19 1.50 0.137
R2 = 0.186 F(4, 134) = 7.63, p < 0.001*
LA -0.39 0.26 -1.49 0.139
Sex 0.15 0.27 0.55 0.581
Age 0.00 0.01 -0.07 0.943
Health 0.66 0.13 5.20 < 0.001* Dependent variable: self-perception of aging (SPA), *p < 0.05, higher values indicate a higher SPA score, SE=
standard error, t = Student’s t-test, F= F-test, OAH= old age home, LA= living arrangement [1= community,
2= OAH], sex [0= female, 1= male]
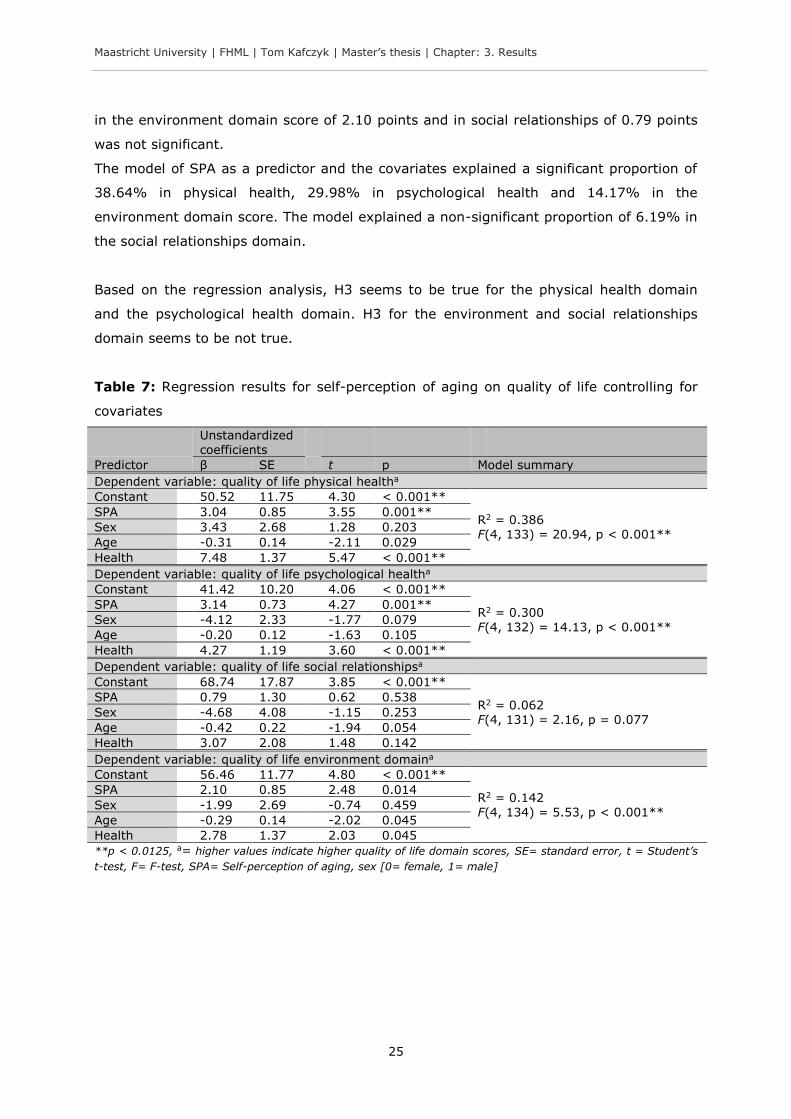
3.2.3 Hypothesis three: self-perception of aging and quality of life
Multiple regression analysis was also used to test H3 that older people with a more
negative perception of aging report lower quality of life compared to older people with a
more positive perception of aging controlling for sex, age and health. SPA was the
predictor. The results of the regression analysis are reported in Table 7.
After controlling for the covariates, SPA predicted physical health and psychological
health significantly. SPA did not significantly predict the environment and social
relationships domain.
One unit increase in the SPA score was associated with a significant increase on average
in physical health of 3.04 points and in psychological health of 3.14 points. The increase
Maastricht University | FHML | Tom Kafczyk | Master’s thesis | Chapter: 3. Results
25
in the environment domain score of 2.10 points and in social relationships of 0.79 points
was not significant.
The model of SPA as a predictor and the covariates explained a significant proportion of
38.64% in physical health, 29.98% in psychological health and 14.17% in the
environment domain score. The model explained a non-significant proportion of 6.19% in
the social relationships domain.
Based on the regression analysis, H3 seems to be true for the physical health domain
and the psychological health domain. H3 for the environment and social relationships
domain seems to be not true.
Table 7: Regression results for self-perception of aging on quality of life controlling for
covariates
Unstandardized coefficients
Predictor β SE t p Model summary
Dependent variable: quality of life physical healtha
Constant 50.52 11.75 4.30 < 0.001**
R2 = 0.386 F(4, 133) = 20.94, p < 0.001**
SPA 3.04 0.85 3.55 0.001**
Sex 3.43 2.68 1.28 0.203
Age -0.31 0.14 -2.11 0.029
Health 7.48 1.37 5.47 < 0.001**
Dependent variable: quality of life psychological healtha
Constant 41.42 10.20 4.06 < 0.001**
R2 = 0.300
F(4, 132) = 14.13, p < 0.001**
SPA 3.14 0.73 4.27 0.001**
Sex -4.12 2.33 -1.77 0.079
Age -0.20 0.12 -1.63 0.105
Health 4.27 1.19 3.60 < 0.001**
Dependent variable: quality of life social relationshipsa
Constant 68.74 17.87 3.85 < 0.001**
R2 = 0.062 F(4, 131) = 2.16, p = 0.077
SPA 0.79 1.30 0.62 0.538
Sex -4.68 4.08 -1.15 0.253
Age -0.42 0.22 -1.94 0.054
Health 3.07 2.08 1.48 0.142
Dependent variable: quality of life environment domaina
Constant 56.46 11.77 4.80 < 0.001**
R2 = 0.142 F(4, 134) = 5.53, p < 0.001**
SPA 2.10 0.85 2.48 0.014
Sex -1.99 2.69 -0.74 0.459
Age -0.29 0.14 -2.02 0.045
Health 2.78 1.37 2.03 0.045
**p < 0.0125, a= higher values indicate higher quality of life domain scores, SE= standard error, t = Student’s
t-test, F= F-test, SPA= Self-perception of aging, sex [0= female, 1= male]

Maastricht University | FHML | Tom Kafczyk | Master’s thesis | Chapter: 3. Results
26
3.2.4 Hypothesis four: mediating role of self-perception of aging
According to Baron and Kenny (1986), H4 that the association between living
arrangement and quality of life is partly explained by SPA cannot be true because one
path of the model (path a, see subsection “3.2.2 Hypothesis two: living arrangement and
self-perception of aging”) was not significant. Furthermore, the significant relationship
between living arrangement and the quality of life domains still persist after entering SPA
into the model (see Table 8). Following Baron and Kenny (1986), if the relationship
between living arrangement and quality of life would have been (partly) explained by
SPA, then the β coefficients of living arrangement should not be significant anymore.
Living arrangement still significantly predicted the quality of life domains. However, in
addition to the approach suggested by Baron and Kenny (1986), a more recent approach
was adopted in the present study (Hayes, 2009, 2013; Preacher & Hayes, 2004; Rucker
et al., 2011; Shrout & Bolger, 2002): bootstrapping and the Sobel test were used to
estimate the indirect effect (i.e. H4). The results are reported below.8 The β coefficient of
living arrangement from the final model (see Table 8) provides an estimation of the
direct effect on quality of life and is reported here as well (although this is not crucial to
answer the hypothesis but it will provide the reader with further information).
Quality of life domain: physical health
The direct effect of living arrangement on the quality of life domain physical health was
significant. A bootstrapped confidence interval (CI) for the indirect effect of living
arrangement on physical health through SPA was significant at the 95% CI, β = -1.14,
95% bias-corrected and accelerated bootstrap (BCa) CI [-3.21, -0.05], because the
range does not include zero. To adjust for multiple comparisons, however, the 99% CI
was calculated as well. The effect vanished at the 99% CI, β = -1.10, 99% BCa CI [-
3.81, 0.38]; the CI now includes zero thus indicating a non-significant result. The Sobel
test supports the non-significance of the indirect effect (z = -1.44, p = 0.150).
Based on the bootstrapped indirect effect estimation, the Sobel test and the Baron and
Kenny (1986) procedure, H4 for the physical health domain seems to be not true.
8 Note: bootstrapping and the Sobel test were calculated with PROCESS (v. 2.11) for SPSS (more information on PROCESS in Hayes, 2013).
Maastricht University | FHML | Tom Kafczyk | Master’s thesis | Chapter: 3. Results
27
Quality of life domain: psychological health
This direct effect of living arrangement on the quality of life domain psychological health
was significant. A bootstrapped CI for the indirect effect of living arrangement on
psychological health through SPA was not significant, β = -1.09, 95% BCa CI [-2.99,
0.25], because the range does include zero. The Sobel test supports this finding (z = -
1.33, p = 0.183).
Based on the bootstrapped indirect effect estimation, the Sobel test and the Baron and
Kenny (1986) procedure, H4 for the psychological domain is rejected.
Quality of life domain: social relationships
The direct effect of living arrangement on the quality of life domain social relationships
was significant. A bootstrapped CI for the indirect effect of living arrangement on social
relationships through SPA was not significant, β = 0.00, 95% BCa CI [-1.27, 1.27]. The
Sobel test indicates a similar result (z = 0.00, p = 0.999).
Based on the bootstrapped indirect effect estimation, the Sobel test and the Baron and
Kenny (1986) procedure, H4 for the social relationships domain is rejected.
Quality of life domain: environment
The direct effect of living arrangement on the quality of life domain environment was
significant. A bootstrapped CI for the indirect effect of living arrangement on the
environment score through SPA was not significant, β = -0.66, 95% BCa CI [-2.40,
0.08]. The Sobel test supports this finding (z = -1.13, p = 0.258).
Based on the bootstrapped indirect effect estimation, the Sobel test and the Baron and
Kenny (1986) procedure, H4 for the environment domain is rejected.
Maastricht University | FHML | Tom Kafczyk | Master’s thesis | Chapter: 3. Results
28
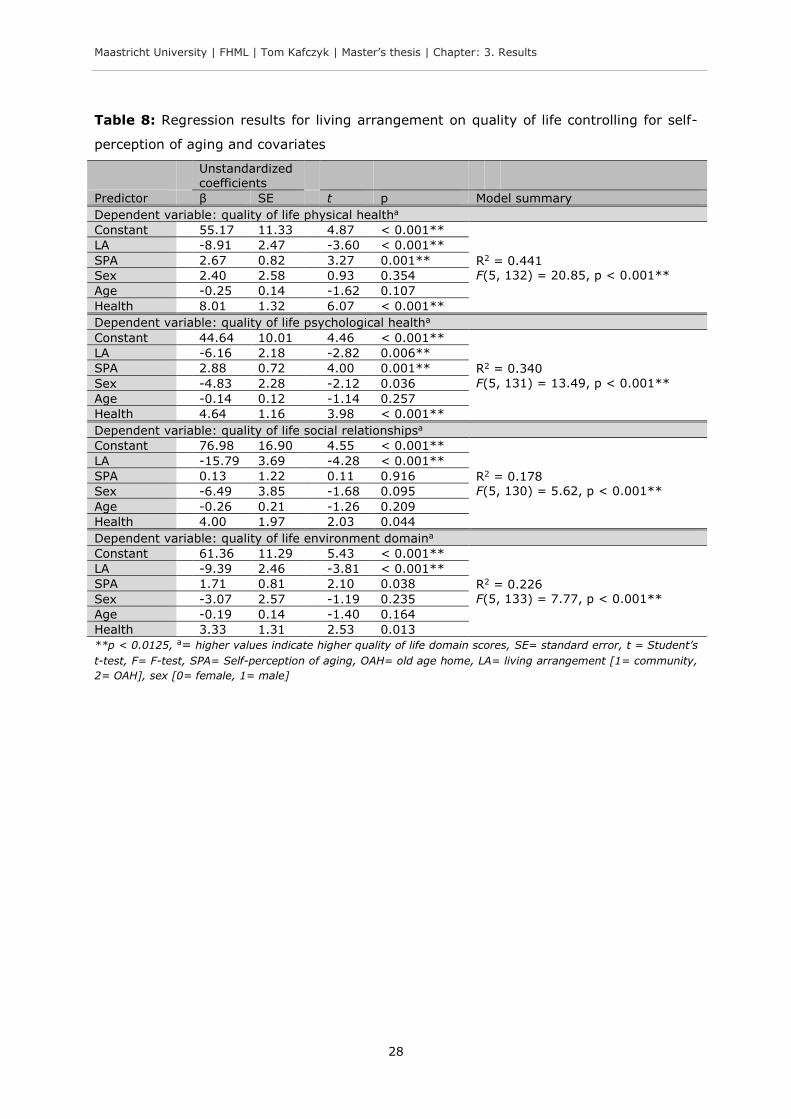
Table 8: Regression results for living arrangement on quality of life controlling for self-
perception of aging and covariates
Unstandardized coefficients
Predictor β SE t p Model summary
Dependent variable: quality of life physical healtha
Constant 55.17 11.33 4.87 < 0.001**
R2 = 0.441 F(5, 132) = 20.85, p < 0.001**
LA -8.91 2.47 -3.60 < 0.001**
SPA 2.67 0.82 3.27 0.001**
Sex 2.40 2.58 0.93 0.354
Age -0.25 0.14 -1.62 0.107
Health 8.01 1.32 6.07 < 0.001**
Dependent variable: quality of life psychological healtha
Constant 44.64 10.01 4.46 < 0.001**
R2 = 0.340
F(5, 131) = 13.49, p < 0.001**
LA -6.16 2.18 -2.82 0.006**
SPA 2.88 0.72 4.00 0.001**
Sex -4.83 2.28 -2.12 0.036
Age -0.14 0.12 -1.14 0.257
Health 4.64 1.16 3.98 < 0.001**
Dependent variable: quality of life social relationshipsa
Constant 76.98 16.90 4.55 < 0.001**
R2 = 0.178 F(5, 130) = 5.62, p < 0.001**
LA -15.79 3.69 -4.28 < 0.001**
SPA 0.13 1.22 0.11 0.916
Sex -6.49 3.85 -1.68 0.095
Age -0.26 0.21 -1.26 0.209
Health 4.00 1.97 2.03 0.044
Dependent variable: quality of life environment domaina
Constant 61.36 11.29 5.43 < 0.001**
R2 = 0.226 F(5, 133) = 7.77, p < 0.001**
LA -9.39 2.46 -3.81 < 0.001**
SPA 1.71 0.81 2.10 0.038
Sex -3.07 2.57 -1.19 0.235
Age -0.19 0.14 -1.40 0.164
Health 3.33 1.31 2.53 0.013
**p < 0.0125, a= higher values indicate higher quality of life domain scores, SE= standard error, t = Student’s
t-test, F= F-test, SPA= Self-perception of aging, OAH= old age home, LA= living arrangement [1= community,
2= OAH], sex [0= female, 1= male]
Maastricht University | FHML | Tom Kafczyk | Master’s thesis | Chapter: 4. Discussion and conclusion
29
4. Discussion and conclusion
This last chapter discusses first the results within the context of the hypotheses that
were formulated. Next, some study limitations that threaten the internal and external
validity are presented. Based on the study findings and limitations, several
recommendations for future research and policies are elaborated. Finally, a conclusion is
formulated.
4.1 Discussion
Quality of life and SPA in older persons is barely studied in the Indian context in different
living arrangements. The present study shed further light on these important concepts
and their interplay. It might have been the first study that used a quantitative approach
to examine the role of SPA in differences in quality of life among non-institutionalized and
institutionalized Indian elderly.
Hypothesis one: living arrangement and quality of life
As hypothesized, institutionalized elderly had a significantly lower quality of life in the
domains physical health, psychological health, social relationships and environment. The
mean difference between the living arrangements in the domain scores was 10.26 for
physical health, 6.71 for psychological health, 15.61 for social relationships and 10.01 for
the environment domain (see Table 4).
Particularly, differences in social relationships have been found. This means that older
persons in old age homes are on average less satisfied with, for example, their personal
relationships and social support. This is what has been expected. Dongre and Deshmukh
(2012) stated that social activities and the relationship to the family are factors that
determine quality of life. Such factors can be expected to be less or lower respectively in
old age homes in India, although empirical data is missing. Furthermore, the social
capital could be lower because residents might not be part of a wider social network and
have less social commitments. Social capital has been defined by Putnam (1995, p. 77)
as the “[...] features of social organization such as networks, norms, and social trust that
facilitate coordination and cooperation for mutual benefit.” The social capital was found to
be an associated factor with well-being and health of older adults in the community
outside of India (e.g. Cramm, van Dijk, & Nieboer, 2013; Momtaz, Haron, Ibrahim, &
Maastricht University | FHML | Tom Kafczyk | Master’s thesis | Chapter: 4. Discussion and conclusion
30
Hamid, 2014; Norstrand & Chan, 2014). However, what role social capital plays in India
specifically in old age homes needs to be investigated empirically.
That the physical and psychological health domain scores are lower is not surprising as
well. This means, for example, that older persons in old age homes report to have less
mobility and have more negative feelings. Mahapatra (2010) mentioned physical and
mental decline as well as the feeling of loneliness as reasons to move to an institution.
Following this reasoning, participants had already a lower quality of life when they shifted
to the institution. Alternatively, it can also be argued that the sense of purpose in the old
age home is lower and therefore led to differences observed in psychological health.
Participants in the community (M = 3.43, SD = 0.90) stated that their life is to a greater
extend meaningful compared to those in old age homes (M = 3.11, SD = 0.87), t(135) =
2.13, p = 0.035.9 However, due to the cross-sectional design of the present study causal
inferences can not be made.
The environment domain as an aspect of quality of life was lower as well in
institutionalized elderly. This means that elderly people living in old age homes are on
average less satisfied with, for example, their financial resources, their freedom, the
accessibility and quality of health and social care, the old age home environment, the
opportunity to acquire new skills or the opportunity for leisure activities compared to
elderly in the community. For instance, elderly people in the community (M = 2.58, SD =
1.18) experienced on average more to have enough money to meet their needs
compared to those in old age homes (M = 1.96, SD = 1.16), t(137) = 3.16, p = 0.002.10
This was expected; poverty was mentioned as one of the main reasons to shift to an old
age home (Devi & Roopa, 2013). The pension coverage could contribute to the
difference. However, the coverage in old age homes is not established (Pension watch,
2014). It seems that old age homes cannot provide the same quality of life in the aspect
environment that is given in the community. One reason might be that old age homes
have not the resources (financial-wise, space-wise etc.). For instance, all old age homes
in this study had shared bedrooms with up to 25 older people sleeping in one room (see
Table 2). Residents in shared bedrooms might feel a lack of freedom/privacy what
negatively affects quality of life.
9 The results are from the question from the psychological health domain of the WHOQOL-BREF: “To what extent do you feel your life to be meaningful?” (see “Appendix 4 WHOQOL-BREF and domain facets”). The question was rated on a scale from 1 (= not at all) to 5 (= an extreme amount). 10 The results are from the question from the environment domain of the WHOQOL-BREF: “Have you enough money to meet your needs?” (see “Appendix 4 WHOQOL-BREF and domain facets”). The question was rated on a scale from 1 (= not at all) to 5 (= completely).
Maastricht University | FHML | Tom Kafczyk | Master’s thesis | Chapter: 4. Discussion and conclusion
31
The results of H1 support researchers from India stating that the family is the better
environment for elderly people (Dongre & Deshmukh, 2012) and that non-
institutionalized older people are better adjusted because of the tradition in the Indian
society that it is the duty of the family to care for the elderly (Raju, 2011).
The difference in quality of life is in accordance with an outcome of a study by Mathew et
al. (2009). In contrast, results from Devi and Roopa (2013) indicated that older people in
the community have a lower quality of life compared to older people living in old age
homes. However, our study and studies of Mathew et al. (2009) and Devi and Roopa
(2013) are only partially comparable. The studies had different inclusion criteria and were
conducted in different settings. The results, nevertheless, are highly relevant given the
rapid increase of the older population in India (Global AgeWatch, 2013; United Nations,
2001) and the accompanying rise of the number of old age homes (Liebig, 2003;
Mahapatra, 2010). From a human rights perspective (United Nations, 2014), the findings
highlight the need to ensure a standard of living in which elderly people can grow older
with more quality in their lives.
Hypothesis two: living arrangement and self-perception of aging
Contrary to what has been hypothesized, living in an old age home compared to living in
the community was not associated with significant differences in self-perception of aging
(SPA). This means that the living arrangement is not associated with the SPA. The results
contradict findings of a study by Dubey et al. (2011). An explanation would be that SPA
stronger depends on common stereotypes of aging present in society than on differences
between living arrangements (Kotter-Gruhn & Hess, 2012; Levy, Slade, Kunkel, et al.,
2002). Possible is also that moving to an old age home initially affects the SPA but that
due to adaptation processes an adjustment in a positive direction occurs. This is similar
to what Gilbert, Pinel, Wilson, Blumberg, and Wheatley (1998) described as the
psychological immune system. Likely is furthermore that moving to an old age home
could have been an improvement for some elderly that were “lonely and forsaken” before
(Devi & Roopa, 2013, p. 7). Individuals in old age homes could contrast their perception
of aging to other more negative (life) events in the past compared to community elderly
who had more positive experiences. This is known as a contrast effect (Amundson,
2010). Mahapatra (2010, p. 120) described this point as follows: “For many older people
who have no one to support them, old age homes serve as a safe heaven.” Another
possible explanation is that participants in institutions compared their aging to that of
other residents and not to something as the “general population” leading to a response
shift (Amundson, 2010).
Maastricht University | FHML | Tom Kafczyk | Master’s thesis | Chapter: 4. Discussion and conclusion
32
Hypothesis three: self-perception of aging and quality of life
In accordance with what has been hypothesized, SPA did significantly predict differences
in quality of life in the domains physical health and psychological health. It did not
predict the environment and social relationships domain. This means that a low SPA
score predicts a low quality of life score (see Figure 5). This is in line with a previous
study of Low et al. (2013).
Hypothesis four: mediating role of self-perception of aging
One might argue that the above discussed differences in quality of life are partly
explained by SPA, but there was no evidence that SPA functions as an intermediate
variable. An explanation could be that SPA is not influenced by living arrangement (as
discussed above) what affects the likelihood of a significant indirect effect through the
variables X M Y. Alternatively, SPA could change the relationship between living
arrangement and quality of life. This latter assumption was tested with a regression
analysis (see “Appendix 11 Regression with interaction term”). An interaction term of
living arrangement by SPA was added to the model reported in Table 8. The results
indicate that SPA was a moderator in the relationship between living arrangement and
physical health, β = -5.58, t(131) = -3.63, p < 0.001, social relationships, β = -1.88,
t(129) = -1.37, p = 0.002, and environment, β = -4.04, t(132) = -2.91, p = 0.004. SPA
did not function as a significant moderator between living arrangement and the quality of
life domain psychological health, β = -1.88, t(130) = -1.37, p = 0.173. The results
suggest that with an increasing SPA score elderly in the community report significantly
higher quality of life scores (see Figure 5). When the SPA score is low, no significant
relationship between living arrangement and quality of life can be observed (see also
“Appendix 11 Regression with interaction term”).
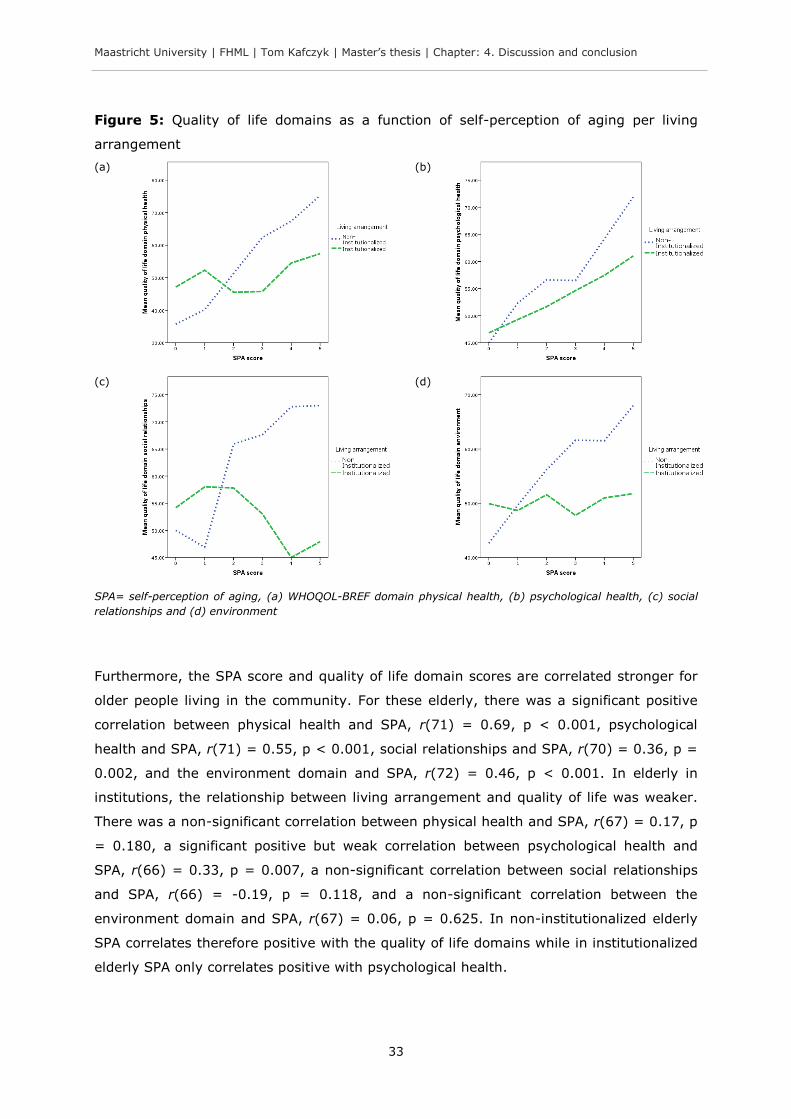
Maastricht University | FHML | Tom Kafczyk | Master’s thesis | Chapter: 4. Discussion and conclusion
33
Figure 5: Quality of life domains as a function of self-perception of aging per living
arrangement
(a)
(b)
(c)
(d)
SPA= self-perception of aging, (a) WHOQOL-BREF domain physical health, (b) psychological health, (c) social
relationships and (d) environment
Furthermore, the SPA score and quality of life domain scores are correlated stronger for
older people living in the community. For these elderly, there was a significant positive
correlation between physical health and SPA, r(71) = 0.69, p < 0.001, psychological
health and SPA, r(71) = 0.55, p < 0.001, social relationships and SPA, r(70) = 0.36, p =
0.002, and the environment domain and SPA, r(72) = 0.46, p < 0.001. In elderly in
institutions, the relationship between living arrangement and quality of life was weaker.
There was a non-significant correlation between physical health and SPA, r(67) = 0.17, p
= 0.180, a significant positive but weak correlation between psychological health and
SPA, r(66) = 0.33, p = 0.007, a non-significant correlation between social relationships
and SPA, r(66) = -0.19, p = 0.118, and a non-significant correlation between the
environment domain and SPA, r(67) = 0.06, p = 0.625. In non-institutionalized elderly
SPA correlates therefore positive with the quality of life domains while in institutionalized
elderly SPA only correlates positive with psychological health.
Maastricht University | FHML | Tom Kafczyk | Master’s thesis | Chapter: 4. Discussion and conclusion
34
The results indicate that quality of life and the perception of aging have different
relationships depending on the living situation. This has practical implications. While in
community elderly strategies to enhance the SPA are more indicated, in elderly in
institutions strategies targeting directly the quality of life aspects might be more
promising. The following quote derived from Jang et al. (2004, p. 486) who refer to a
paper of Levy, Slade, Kunkel, et al. (2002) may be partially relevant for community-
living elderly people in India: “Enhancement of positive self-perception has important
practical implications because it is strongly connected with better adjustment to changes
in old age and it leads to a higher quality of life regardless of objective life circumstances
[...].”
Covariates
The covariates sex and health did not vary significantly between the groups. The
covariate age differed significantly between the living arrangements. Older persons in
this study living in old age homes were on average older (approximately 3.60 years).
This difference is not surprising since people are more likely to move to an old age home
with progressing age. Age, however, did not influence the study outcome: after the effect
of age on quality of life was removed from the effect of living arrangement on quality of
life, the main effects for all quality of life domains were still highly significant.
Research question
To answer the research question if living arrangement (community versus old age home)
determines differences in quality of life and if this difference is partly explained by the
perception of aging among older adults over 55, the answer is two-fold. The living
arrangement determines differences in quality of life but SPA did not partly explain this
relationship. Instead, SPA seems to be a moderator indicating that the association
between living arrangement and quality of life depends on the perception of aging. If the
SPA is low, no significant differences between the living arrangements in quality of life
can be observed. On the other hand, if the SPA is high, significant differences were
observed.
4.2 Study limitations
Some study limitations are important to mention here. First, some of the effects
observed in this study could be attributable to unmodeled effects within the old age
Maastricht University | FHML | Tom Kafczyk | Master’s thesis | Chapter: 4. Discussion and conclusion
35
homes or within the different areas and neighbourhoods. Bhushanam, Sreedevi, and
Kameshwaran (2013), for instance, suggested differences in the nutritional status of
residents in paid and unpaid old age homes. To test these “clusters” or organizational
units need to be part of a follow-up study. Multilevel modelling could be used assuming
an appropriate sample size (Hayes, 2013).
Second, due to practical constraints only three covariates and in total six variables were
examined in this study. This was necessary to not jeopardize the statistical power;
however, six variables can barely reflect the complex reality. Other not assessed
variables could have influenced or explained some of the observed variation in the
dependent variable. On an individual level, these are variables such as marital status,
feeling of personal control, social network, objective health status, income, education or
the participation in daily life (Barua et al., 2005; Cantor & Sanderson, 1999; Peterson,
1999; Pinquart & Sorensen, 2000; Thiyagarajan J, Prince, & Webber, 2014). On the level
of the old age home and household respectively, these are variables such as living in a
shared bedroom (more relevant in old age homes) or hygienic conditions. On the level of
the town, these are variables such as age-friendly transportation, availability of geriatric
health facilities or the availability and accessibility of recreational facilities. The covariate
“health” was measured here with only one question. There are problems with one-
question variables that methodologically need to be clarified in the future (Schwarz &
Strack, 1999). Participants might have had a different interpretation of the concept
“health” and thus a different interpretation of “How satisfied are you with your health?”.
One can also argue that objectively participants in old age homes have had a lower
health status but subjectively the participants reported the same health satisfaction
(Frederick & Loewenstein, 1999).
Third, another weakness of the study is that with the cross-sectional data collected here,
it is hard to make any causal claims. Longitudinal data has certainly advantages to
disentangle causal associations. Similarly, the direction of the effects is unclear. While
the relationship X M Y was modelled, it could as well have been X Y M (Hayes,
2013).
Lastly, another limitation is that different data collection methods (interview-form and
questionnaire-form). The majority of the data was collected in interview-form. While this
was necessary because most people did not want to or could not self-administer the
questionnaires, it is unclear whether the collection method biased the results. It is known
that differences in the mode of questionnaire administration can have effects on the
quality and accuracy of the data (Bowling, 2005). Both methods applied here are
Maastricht University | FHML | Tom Kafczyk | Master’s thesis | Chapter: 4. Discussion and conclusion
36
associated with different biases such as recall bias, social desirability bias or interviewer
bias (Bowling, 2005).11 Likewise, the different languages (Kannada and English) might
have biased the outcome. The meanings of the questionnaires in both languages might
have been the same, but the interpretation could have been different. In “Appendix 7
Translation of the self-perception of aging questionnaire” a discussion of the limitations of
the translation of the SPA scale is presented. In addition, the settings and places where
data was collected (e.g. a kitchen or common room) varied resulting in differences in the
amount of privacy. The interaction of mode of administration, language and data
collection setting on the data quality is unclear.
Inferences based on the present results should therefore be done with caution. The data
could behave differently if the data would have been analyzed in its respective
organizational units or clusters. Furthermore, the time, location, principal investigator
and translator are further restrictions to the generalizability of the results. Likewise, the
selected participants itself could be a limitation to the generalizability. Older persons
unwilling to participate are not reflected in the data. As well, other groups of elderly,
such as homeless elderly, have not been studied. It is moreover worth pointing out, that
inferences are only possible within the boundaries of the operational definitions and
methods chosen for the present study.
4.3 Future directions
In this section, future directions for research and implications for policies based on the
study results are discussed.
4.3.1 Research
Further research is warranted in order to build on the present findings and shed more
light on the important topic examined here - a follow-up study is recommended. Future
research should try to minimize the study limitations mentioned above.
Multilevel-analysis and multiple comparisons need to be employed to test for differences
within the organizational units and clusters; these methods could yield to new insights
11 The recall bias means that different cognitive processes are necessary to recall information in an interview-style (oral information) compared to a self-administrated form (visual information) what could bias the results (Bowling, 2005). The social desirability bias is the tendency of participants to present themselves in the best possible way (Bowling, 2005). The interviewer bias was introduced above (see footnote 4).
Maastricht University | FHML | Tom Kafczyk | Master’s thesis | Chapter: 4. Discussion and conclusion
37
into factors at the different levels responsible for the observed variation in quality of life.
Mixed methods including qualitative research could yield to more information as well.
Qualitative research can provide in-depth information about “the how and why”. For
example, ethnography can be employed to answer the question: “Which specific aspects
in an old age home characterize the life of an older person and how do these aspects
relate to the interpretation of quality of life and SPA?” Another question answerable with
qualitative methods that derived from the present study is: “Why does quality of life
depends less on SPA in institutionalized elderly compared to non-institutionalized?”
Future research should also place more emphasis on the role of SPA as a moderator;
more complex models (e.g. mediated moderation, multiple moderators) could be
considered (Jang et al., 2004). Moreover, because differences in age- and sex-sub-
groups in quality of life have been reported in India (Barua et al., 2005; Devi & Roopa,
2013), sub-group analysis by sex and age could be considered. Other variables not
considered here such as education need to be collected and assessed (see section “4.2
Study limitations”). Health as a covariate could be measured more rigorous and
methodologically sound. Longitudinal data would have an advantage in terms of causal
attributions of study effects; for example, the direction of the effect could be tested in
this way (e.g. X Y M versus X M Y). Furthermore, the effect of the interaction
of mode of questionnaire administration, language and data collection setting on the
quality of the data needs to be tested.
The discussion above brought up some topics that could be investigated in future
research in order to increase the understanding of the findings presented here. For
example, the role of stereotypes of aging, adaptation processes or contrast effects on
SPA (see section “4.1 Discussion”). Moreover, the role of social capital and pension
coverage in India specifically in institutions could be an interesting field of study in the
context of quality of life.
4.3.2 Policy implications
The present study provides evidence for the need to improve the quality of life
particularly in institutionalized elderly in the geographical study area. Especially the
improvement of social relationships could increase quality of life.
On the local level, within old age homes, an environment has to be created that is
adequate for the health and well-being of the residents. This includes meaningful
activities. To offer more (social) leisure activities might be an option for old age homes to
Maastricht University | FHML | Tom Kafczyk | Master’s thesis | Chapter: 4. Discussion and conclusion
38
improve the quality of life domain environment and social relationships (Ra, An, & Rhee,
2013). To improve physical and psychological health, regular services are an option, such
as psychological counselling (Hepple, 2004), physiotherapy (Harada, Chiu, Fowler, Lee, &
Reuben, 1995) or occupational therapy (Steultjens et al., 2004). However, there is no
clear-cut evidence for a single measure. Instead, a holistic approach including multiple
measures on various levels should be considered.
The present work suggests the development of community strategies to enhance the
perception of aging in order to improve quality of life. An example would be programmes
for older adults that build on the principles of lifelong learning and active aging. Such
programmes have shown to be effective in enhancing the SPA in older adults in Spain,
Mexico, Chile and Cuba (Fernández-Ballesteros et al., 2013).
To indirectly benefit the local situation, on the national level, an increase of the share of
the gross domestic product that is devoted to health is an option. In this way, universal
health care for the aged population is more likely. As well, efforts to increase the pension
scheme coverage could be considered (Pension watch, 2014); this might lead to an
enhancement of financial security and consequently the domain environment of quality of
life. Another option is the development of a national monitoring and evaluation system of
the living situation of elderly in institutions. With such a system, the quality of care and
quality of life of residents in old age homes nationwide could be assessed and evaluated
regularly. This could lead to informed decision- and policy making.
On the global level, high income countries that have gone through the demographic
transition earlier and are experienced in institutionalized care for older people might play
an advisory role for India and be involved in other forms of development assistance to
improve institutionalized care.
The recommendations, however, are only partially valid. First, further research is
required obtaining high quality data. In addition, the process of policy-making should
involve older persons as well (participatory policy making). Second, implications might
vary depending on the old age home and geographical area. And lastly, financial aspects
and financial responsibilities have to be clarified. Who will pay for better facilities and
more services? Policies in India only encourage the construction and maintenance of old
age homes (Dongre & Deshmukh, 2012).
Maastricht University | FHML | Tom Kafczyk | Master’s thesis | Chapter: 4. Discussion and conclusion
39
4.4 Conclusion
In conclusion, the present study used cross-sectional data from elderly in the community
and old age homes to assess differences in quality of life and the role of the perception of
aging as a mediator. While the results highlight lower quality of life scores in the domains
physical health, psychological health, social relationships and environment among people
living in an old age homes compared to those living in the community, the perception of
aging did not vary between the different living settings. SPA did predict physical health
and psychological health, but evidence that it partly explains differences in quality of life
was not found. Instead, SPA was identified as a moderator. The results suggest that the
relationship between living arrangement and physical, psychological and environmental
quality of life changed as a function of SPA. Strategies should be implemented to
enhance the quality of life of older persons particularly in institutionalized elderly.
Definite conclusions about whether this should be done through SPA cannot be drawn
based on the present study. A larger longitudinal follow-up study is recommended.
Maastricht University | FHML | Tom Kafczyk | Master’s thesis | Chapter: References
40
References
Acquadro, C., Conway, K., Hareendran, A., & Aaronson, N. (2008). Literature review of
methods to translate health-related quality of life questionnaires for use in
multinational clinical trials. Value in Health, 11(3), 509–521.
Amundson, R. (2010). Quality of life, disability, and hedonic psychology. Journal for the
Theory of Social Behavior, 40(4), 374-392.
Antonelli, E., Rubini, V., & Fassone, C. (2000). The self-concept in institutionalized and
non-institutionalized elderly people. Journal of Environmental Psychology, 20(2),
151–164.
Baron, R. M., & Kenny, D. A. (1986). The moderator-mediator variable distinction in
social psychological research: conceptual, strategic, and statistical considerations.
Journal of Personality and Social Psychology, 51(6), 1173-1182.
Barua, A., Mangesh, R., Kumar, H. H., & Saajan, M. (2005). Assessment of the domains
of quality of life in the geriatric population. Indian Journal of Psychiatry, 47(3),
157-159.
Baur, J. A., Pearson, K. J., Price, N. L., Jamieson, H. A., Lerin, C., Kalra, A., . . . Sinclair,
D. A. (2006). Resveratrol improves health and survival of mice on a high-calorie
diet. Nature, 444(7117), 337-342.
Bengtson, V. L., Dowd, J. J., Smith, D. H., & Inkeles, A. (1975). Modernization,
modernity, and perceptions of aging: a cross-cultural study. The Journals of
Gerontology, 30(6), 688-695.
Bhushanam, G. V., Sreedevi, K., & Kameshwaran, J. (2013). A comparative study on the
living conditions and nutritional status of elderly in paid and unpaid homes of
Chennai, India. International Journal of Scientific and Research Publications, 3(9),
1-4.
Boralingaiah, P., Bettappa, P., & Kashyap, S. (2012). Prevalence of psycho-social
problems among elderly in urban population of Mysore City, Karnataka, India.
Indian Journal of Psychological Medicine, 34(4), 360-364.
Bowling, A. (2005). Mode of questionnaire administration can have serious effects on
data quality. Journal of Public Health, 27(3), 281-291.
Cantor, N., & Sanderson, C. A. (1999). Life task participation and well-being: the
importance of taking part in daily life. In D. Kahneman, E. Diener & N. Schwarz
(Eds.), Well-being: the foundations of hedonic psychology (pp. 230-243). New
York: Russel Sage Foundation.
Chandra, P. S., Deepthivarma, S., Jairam, K. R., & Thomas, T. (2003). Relationship of
psychological morbidity and quality of life to illness-related disclosure among HIV-
infected persons. Journal of Psychosomatic Research, 54(3), 199-203.
Chatterji, S., Kowal, P., Mathers, C., Naidoo, N., Verdes, E., Smith, J. P., & Suzman, R.
(2008). The health of aging populations in China and India. Health Affairs, 27(4),
1052-1063.
Cheng, S. T., Yip, L. C., Jim, O. T., & Hui, A. N. (2012). Self-perception of aging and
acute medical events in chronically institutionalized middle-aged and older
persons with schizophrenia. International Journal of Geriatric Psychiatry, 27(9),
907-913.
Cramm, J. M., van Dijk, H. M., & Nieboer, A. P. (2013). The importance of neighborhood
social cohesion and social capital for the well being of older adults in the
community. The Gerontologist, 53(1), 142-152.
de Grey, A. D., Campbell, F. C., Dokal, I., Fairbairn, L. J., Graham, G. J., Jahoda, C. A., &
Porterg, A. C. (2004). Total deletion of in vivo telomere elongation capacity: an
ambitious but possibly ultimate cure for all age-related human cancers. Annuals of
the New York Academy of Sciences, 1019, 147-170.
Maastricht University | FHML | Tom Kafczyk | Master’s thesis | Chapter: References
41
Devi, L., & Roopa, K. S. (2013). Quality of life of elderly men and women in institutional
and non-institutional settings in urban Bangalore district. Research Journal of
Family, Community and Consumer Sciences, 1(3), 7-13.
Dongre, A. R., & Deshmukh, P. R. (2012). Social determinants of quality of elderly life in
a rural setting of India. Indian Journal of Palliative Care, 18(3), 181-189.
Dubey, A., Bhasin, S., Gupta, N., & Sharma, N. (2011). A study of elderly living in old
age home and within family set-up in Jammu. Studies on Home and Community
Science, 5(2), 93-98.
Fernández-Ballesteros, R., Caprara, M., Schettini, R., Bustillos, A., Mendoza-Nunez, V.,
Orosa, R., . . . Zamarrón, M. D. (2013). Effects of university programs for older
adults: changes in cultural and group stereotype, self-perception of aging, and
emotional balance. Educational Gerontology, 39(2), 119-131.
Frederick, S., & Loewenstein, G. (1999). Hedonic adaptation. In D. Kahneman, E. Diener
& N. Schwarz (Eds.), Well-being: the foundations of hedonic psychology (pp. 302-
329). New York: Russell Sage Foundation.
Gilbert, D. T., Pinel, E. C., Wilson, T. D., Blumberg, S. J., & Wheatley, T. P. (1998).
Immune neglect: a source of durability bias in affective forecasting. Journal of
Personality and Social Psychology, 75(3), 617-638.
Global AgeWatch. (2013). Global AgeWatch Index 2013: insight report, summary and
methodology. Retrieved 01 February, 2014, from http://www.helpage.org/global-
agewatch/reports/global-agewatch-index-2013-insight-report-summary-and-
methodology/
Harada, N., Chiu, V., Fowler, E., Lee, M., & Reuben, D. B. (1995). Physical therapy to
improve functioning of older people in residential care facilities. Physical Therapy,
75(9), 830-839.
Hayes, A. F. (2009). Beyond Baron and Kenny: statistical mediation analysis in the new
millennium. Communication Monographs, 76(4), 408-420.
Hayes, A. F. (2013). Introduction to mediation, moderation, and conditional process
analysis: a regression-based approach. New York: The Guilford Press.
HelpAge International. (2000). The aging and development report: a summary. British
Medical Journal, 321.
Hepple, J. (2004). Psychotherapies with older people: an overview. Advances in
Psychiatric Treatment, 10, 371-377.
Husain, Z., & Ghosh, S. (2010). Is health status of elderly worsening in India: a
comparison of successive rounds of National Sample Survey data. Journal of
Biosocial Science, 43(2), 211-231.
Hwang, H. F., Liang, W. M., Chiu, Y. N., & Lin, M. R. (2003). Suitability of the WHOQOL-
BREF for community-dwelling older people in Taiwan. Age and Ageing, 32(6),
593-600.
Indian Census. (2011). Udupi District Population Census 2011, Karnataka literacy sex
ratio and density. Retrieved 31 January 2014, from
http://www.census2011.co.in/census/district/268-udupi.html
Ingle, G. K., & Nath, A. (2008). Geriatric health in India: concerns and solutions. Indian
Journal of Community Medicine, 33(4), 214-218.
Jang, Y., Poon, L. W., Kim, S.-Y., & Shin, B.-K. (2004). Self-perception of aging and
health among older adults in Korea. Journal of Aging Studies, 18(4), 485–496.
Jeyalakshmi, S. S., Chakrabarti, S. S., & Gupta, S. N. (2011). Situational analysis of the
elderly in India. Retrieved 28 February, 2014, from
http://mospi.nic.in/mospi_new/upload/elderly_in_india.pdf
Kleinspehn-Ammerlahn, A., Kotter-Gruhn, D., & Smith, J. (2008). Self-perceptions of
aging: do subjective age and satisfaction with aging change during old age? The
Journals of Gerontology Series B: Psychological Sciences and Social Sciences,
63(6), 377-385.
Maastricht University | FHML | Tom Kafczyk | Master’s thesis | Chapter: References
42
Kotter-Gruhn, D., & Hess, T. M. (2012). The impact of age stereotypes on self-
perceptions of aging across the adult lifespan. The Journals of Gerontology Series
B: Psychological Sciences and Socical Sciences, 67(5), 563-571.
Kumar, S. G., Majumdar, A., & G, P. (2014). Quality of life (QOL) and its associated
factors using WHOQOL-BREF among elderly in urban Puducherry, India. Journal of
Clinical and Diagnostic Research, 8(1), 54-57.
Lawton, M. P. (1975). The Philadelphia Geriatric Center Morale Scale: a revision. The
Journals of Gerontology, 30(1), 85-89.
Lawton, M. P. (2003). Lawton's PGC Morale Scale. Retrieved 20 March, 2014, from
http://www.abramsoncenter.org/pri/documents/PGC_morale_scale.pdf
Lena, A., Ashok, K., Padma, M., Kamath, V., & Kamath, A. (2009). Health and social
problems of the elderly: a cross-sectional study in Udupi taluk, Karnataka. Indian
Journal of Community Medicine, 34(2), 131-134.
Leventhal, H., & Colman, S. (2007). Quality of life: a process view. Psychology and
Health 12(6), 753-767.
Levy, B. (1996). Improving memory in old age through implicit self-stereotyping. Journal
of Personality and Socical Psychology, 71(6), 1092-1107.
Levy, B. (2000). Handwriting as a reflection of aging self-stereotypes. Journal of Geriatric
Psychiatry, 33(1), 81-94.
Levy, B. (2003). Mind matters: cognitive and physical effects of aging self-stereotypes.
The Journals of Gerontol Series B: Psychological Science and Social Science,
58(4), 203-211.
Levy, B., Hausdorff, J. M., Hencke, R., & Wei, J. Y. (2000). Reducing cardiovascular
stress with positive self-stereotypes of aging. The Journals of Gerontol Series B:
Psychological Science and Social Science, 55(4), 205-213.
Levy, B., & Myers, L. M. (2004). Preventive health behaviors influenced by self-
perceptions of aging. Preventive Medicine, 39(3), 625-629.
Levy, B., Slade, M. D., & Kasl, S. V. (2002). Longitudinal benefit of positive self-
perceptions of aging on functional health. The Journals of Gerontol Series B:
Psychological Science and Social Science, 57(5), 409-417. doi:
10.1093/geronb/57.5.P409
Levy, B., Slade, M. D., Kunkel, S. R., & Kasl, S. V. (2002). Longevity increased by
positive self-perceptions of aging. Journal of Personality and Socical Psychology,
83(2), 261-270.
Liebig, P. S. (2003). Old-age homes and services: old and new approaches to aged care.
Journal of Aging & Social Policy, 15(2-3), 159-178.
Lockenhoff, C. E., De Fruyt, F., Terracciano, A., McCrae, R. R., De Bolle, M., Costa, P. T.,
. . . Yik, M. (2009). Perceptions of aging across 26 cultures and their culture-level
associates. Psychology and Aging, 24(4), 941-954.
Low, G., Molzahn, A. E., & Schopflocher, D. (2013). Attitudes to aging mediate the
relationship between older peoples’ subjective health and quality of life in 20
countries. Health and Quality of Life Outcomes, 11(1), 146. doi:
info:pmid/23984754
Mahapatra, S. (2010). Second home after home for elderly: a study of old age homes in
the globalized era. Indian Journal of Gerontology, 24(1), 115-122.
Mathew, M. A., George, L. S., & Paniyadi, N. (2009). Comparative study on stress, coping
strategies and quality of life of institutionalized and non-institutionalized elderly in
Kottayam district, Kerala. Indian Journal of Gerontology, 23(1), 79-87.
Ministry of Home Affairs. (2014a). Census of India - socio-cultural aspects. Retrieved 06
March, 2014, from
http://censusindia.gov.in/Census_Data_2001/Census_Data_Online/Social_and_cu
ltural/Religion.aspx
Ministry of Home Affairs. (2014b). Census of India, provisional population totals India,
Karnataka. Retrieved 26 February, 2014, from
Maastricht University | FHML | Tom Kafczyk | Master’s thesis | Chapter: References
43
http://censuskarnataka.gov.in/PROVISIONAL%20POPULATION%20TOTALS_2011
_KARNATAKA.pdf
Momtaz, Y. A., Haron, S. A., Ibrahim, R., & Hamid, T. A. (2014). Social embeddedness as
a mechanism for linking social cohesion to well-being among older adults:
moderating effect of gender. Journal of Clinical Interventions in Aging, 9, 863-
870.
Moser, C., Spagnoli, J., & Santos-Eggimann, B. (2011). Self-perception of aging and
vulnerability to adverse outcomes at the age of 65-70 years. Journals of
Gerontololgy Series B: Psychological Sciences and Social Sciences, 66(6), 675-
680.
National Human Rights Commission. (2011). Know your rights elderly people. New Delhi:
National Human Rights Commission.
Norstrand, J., & Chan, K. T. (2014). The relationship between health and community
across aging cohorts. Journal of Aging Research, 2014(Article ID 626097).
Pension watch. (2014). Country fact sheet India. Retrieved 04 July, 2014, from
http://www.pension-watch.net/pensions/country-fact-file/india
Peterson, C. (1999). Personal control and well-being. In D. Kahneman, E. Diener & N.
Schwarz (Eds.), Well-being: the foundations of hedonic psychology (pp. 288-301).
New York: Russel Sage Foundation.
Pinquart, M., & Sorensen, S. (2000). Influences of socioeconomic status, social network,
and competence on subjective well-being in later life: a meta-analysis. Psychology
and Aging, 15(2), 187-224.
Preacher, K. J., & Hayes, A. F. (2004). SPSS and SAS procedures for estimating indirect
effects in simple mediation models. Behavior Research Methods, Instruments, &
Computers, 36(4), 717-731.
Putnam, R. (1995). Bowling alone: America's declining social capital. Journal of
Democracy, 6(1), 65-78.
Ra, J., An, S., & Rhee, K. J. (2013). The relationship between psychosocial effects and
life satisfaction of the Korean elderly: moderating and mediating effects of leisure
activity. Journal of Arts and Humanities, 2(11), 21-35.
Raju, S. S. (2011). Studies on ageing in India: a review. Building knowledge base on
Population Ageing in India Working paper: 2. New Delhi: United Nations
Population Fund (UNFPA).
Robine, J.-M., Jagger, C., van Oyen, H., Cambois, E., Romieu, E., Clavel, A., . . . Le Roy,
S. (2005). Are we living longer, healthier lives in the EU? Disability-Free Life
Expectancy (DFLE) in EU countries from 1991 to 2003 based on the Eropean
Community Household Panel (ECHP). Retrieved 03 July, 2014, from
http://ec.europa.eu/health/archive/ph_projects/2003/action1/docs/2003_1_08_re
p2_en.pdf
Rucker, D. D., Preacher, K. J., Tormala, Z. L., & Petty, R. E. (2011). Mediation analysis in
social psychology: current practices and new recommendations. Social and
Personality Psychology Compass, 5(6), 359-371.
Sargent-Cox, K. A., Anstey, K. J., & Luszcz, M. A. (2014). Longitudinal change of self-
perceptions of aging and mortality. The Journals of Gerontol Series B:
Psychological Science and Social Science, 69(2), 168-173.
Schwarz, N., & Strack, F. (1999). Reports of subjective well-being: judgmental processes
and their methodological implications. In D. Kahneman, E. Diener & N. Schwarz
(Eds.), Well-being: the foundations of hedonic psychology (pp. 61-84). New York:
Russel Sage Foundation.
Shrout, P. E., & Bolger, N. (2002). Mediation in experimental and nonexperimental
studies: new procedures and recommendations. Psychological Methods, 7(4),
422-445.
Sinclair, D. A., & Guarente, L. (1997). Extrachromosomal rDNA circles - a cause of aging
in yeast. Cell, 91(7), 1033-1042.
Maastricht University | FHML | Tom Kafczyk | Master’s thesis | Chapter: References
44
Singh, A. P., Kumar, K. L., & Reddy, C. (2012). Psychiatric morbidity in geriatric
population in old age homes and community: a comparative study. Indian Journal
of Psychological Medicine, 34(1), 39-43.
Skevington, S. M., Lotfy, M., & O'Connell, K. A. (2004). The World Health Organization's
WHOQOL-BREF quality of life assessment: psychometric properties and results of
the international field trial. A report from the WHOQOL Group. Quality of Life
Research, 13(2), 299-310.
Sperber, A. D. (2004). Translation and validation of study instruments for cross-cultural
research. Gastroenterology, 126(1 Suppl 1), 124-128.
Spinaci, S., Currat, L., Shetty, P., Crowell, V., & Kehler, J. (2006). Tough choices:
investing in health for development: experiences from national follow-up to the
Commission on Macroeconomics and Health. Geneva: World Health Organization.
Steultjens, E. M. J., Dekker, J., Bouter, L. M., Jellema, S., Bakker, E. B., & van den Ende,
C. H. M. (2004). Occupational therapy for community dwelling elderly people: a
systematic review. Age and Ageing, 33(5), 453-460.
Steverink, N., Westerhof, G. J., Bode, C., & Dittmann-Kohli, F. (2001). The personal
experience of aging, individual resources, and subjective well-being. Journals of
Gerontology Series B: Psychological Sciences and Social Sciences, 56(6), 364-
373.
Teresi, J. A., Ramirez, M., Lai, J. S., & Silver, S. (2008). Occurrences and sources of
Differential Item Functioning (DIF) in patient-reported outcome measures:
description of DIF methods, and review of measures of depression, quality of life
and general health. Psychological Science, 50(4), 538.
The Lancet. (2013). How to cope with an ageing population. The Lancet, 382(9900),
1225.
The World Bank. (2014). Data base: indicators: health expenditure, total (% of GDP) and
health expenditure, public (% of GDP). Retrieved 20 July 2014
http://data.worldbank.org/indicator/
Thiyagarajan J, A., Prince, M., & Webber, M. (2014). Social support network typologies
and health outcomes of older people in low and middle income countries - a 10/66
Dementia Research Group population-based study. International Review of
Psychiatry, 26(4), 476-485.
United Nations. (2001). World population ageing: 1950-2050. Retrieved 03 February,
2014, from
http://webcache.googleusercontent.com/search?q=cache:http://www.un.org/esa/
population/publications/worldageing19502050/
United Nations. (2002). Report of the Second World Assembly on Ageing. Madrid, 8-12
April 2002. New York: United Nations.
United Nations. (2013). World population ageing 2013. New York: United Nations.
United Nations. (2014). Universal declaration of human rights. Retrieved 13 July, 2014,
from http://www.un.org/en/documents/udhr/
Uotinen, V., Rantanen, T., & Suutama, T. (2005). Perceived age as a predictor of old age
mortality: a 13-year prospective study. Age and Ageing, 34(4), 368-372.
WHOQOL Group. (1998). Development of the World Health Organization WHOQOL-BREF
quality of life assessment. Psychological Medicine, 28(3), 551-558.
World Health Organization. (2014b). Definition of an older or elderly person: proposed
working definition of an older person in Africa for the MDS project. Retrieved 27
June, 2014, from http://www.who.int/healthinfo/survey/ageingdefnolder/en/
World Health Organization. (2014a). World Health Day 2012: ageing and health.
Retrieved 24 June, 2014, from
http://www.who.int/kobe_centre/ageing/world_health_day_2012/en/
Zhang, J., Quan, H., Ng, J., & Stepanavage, M. E. (1997). Some statistical methods for
multiple endpoints in clinical trials. Controlled Clinical Trials, 18(3), 204-221.
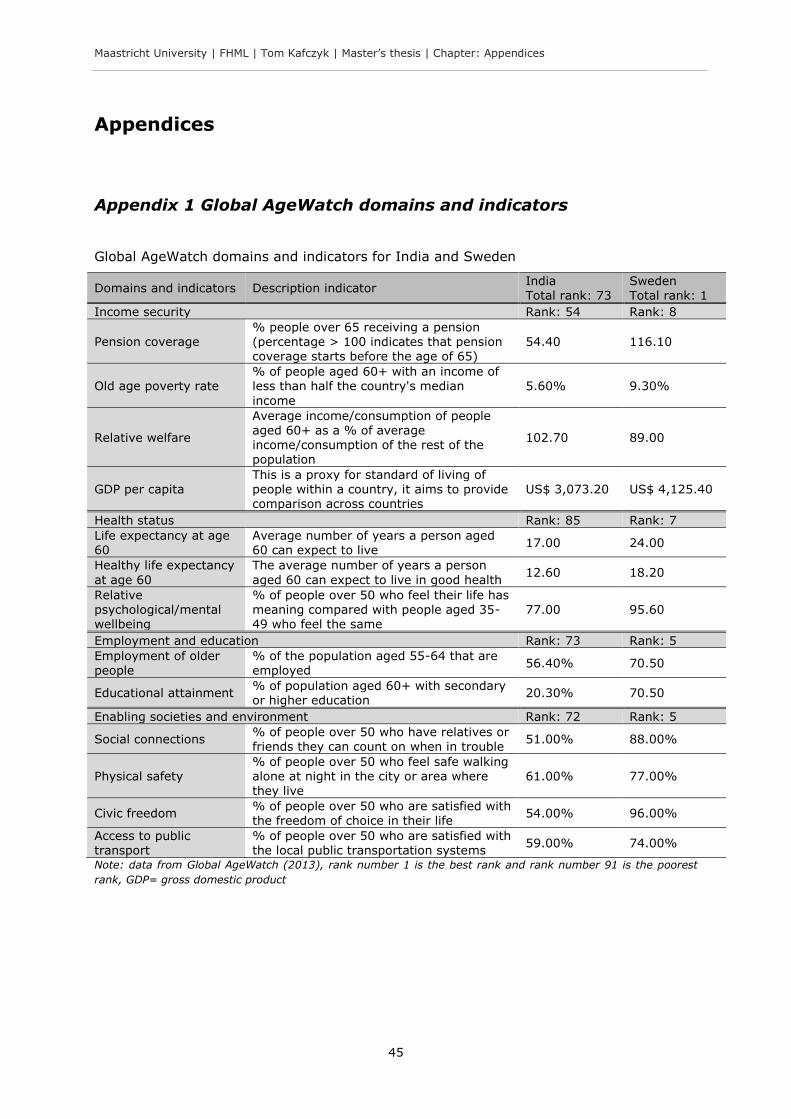
Maastricht University | FHML | Tom Kafczyk | Master’s thesis | Chapter: Appendices
45
Appendices
Appendix 1 Global AgeWatch domains and indicators
Global AgeWatch domains and indicators for India and Sweden
Domains and indicators Description indicator India Total rank: 73
Sweden Total rank: 1
Income security Rank: 54 Rank: 8
Pension coverage % people over 65 receiving a pension (percentage > 100 indicates that pension
coverage starts before the age of 65)
54.40 116.10
Old age poverty rate % of people aged 60+ with an income of less than half the country's median
income
5.60% 9.30%
Relative welfare
Average income/consumption of people aged 60+ as a % of average income/consumption of the rest of the population
102.70 89.00
GDP per capita This is a proxy for standard of living of people within a country, it aims to provide comparison across countries
US$ 3,073.20 US$ 4,125.40
Health status Rank: 85 Rank: 7
Life expectancy at age 60
Average number of years a person aged 60 can expect to live
17.00 24.00
Healthy life expectancy
at age 60
The average number of years a person
aged 60 can expect to live in good health 12.60 18.20
Relative psychological/mental wellbeing
% of people over 50 who feel their life has meaning compared with people aged 35-49 who feel the same
77.00 95.60
Employment and education Rank: 73 Rank: 5
Employment of older people
% of the population aged 55-64 that are employed
56.40% 70.50
Educational attainment % of population aged 60+ with secondary or higher education
20.30% 70.50
Enabling societies and environment Rank: 72 Rank: 5
Social connections % of people over 50 who have relatives or friends they can count on when in trouble
51.00% 88.00%
Physical safety % of people over 50 who feel safe walking alone at night in the city or area where they live
61.00% 77.00%
Civic freedom % of people over 50 who are satisfied with the freedom of choice in their life
54.00% 96.00%
Access to public transport
% of people over 50 who are satisfied with the local public transportation systems
59.00% 74.00%
Note: data from Global AgeWatch (2013), rank number 1 is the best rank and rank number 91 is the poorest
rank, GDP= gross domestic product
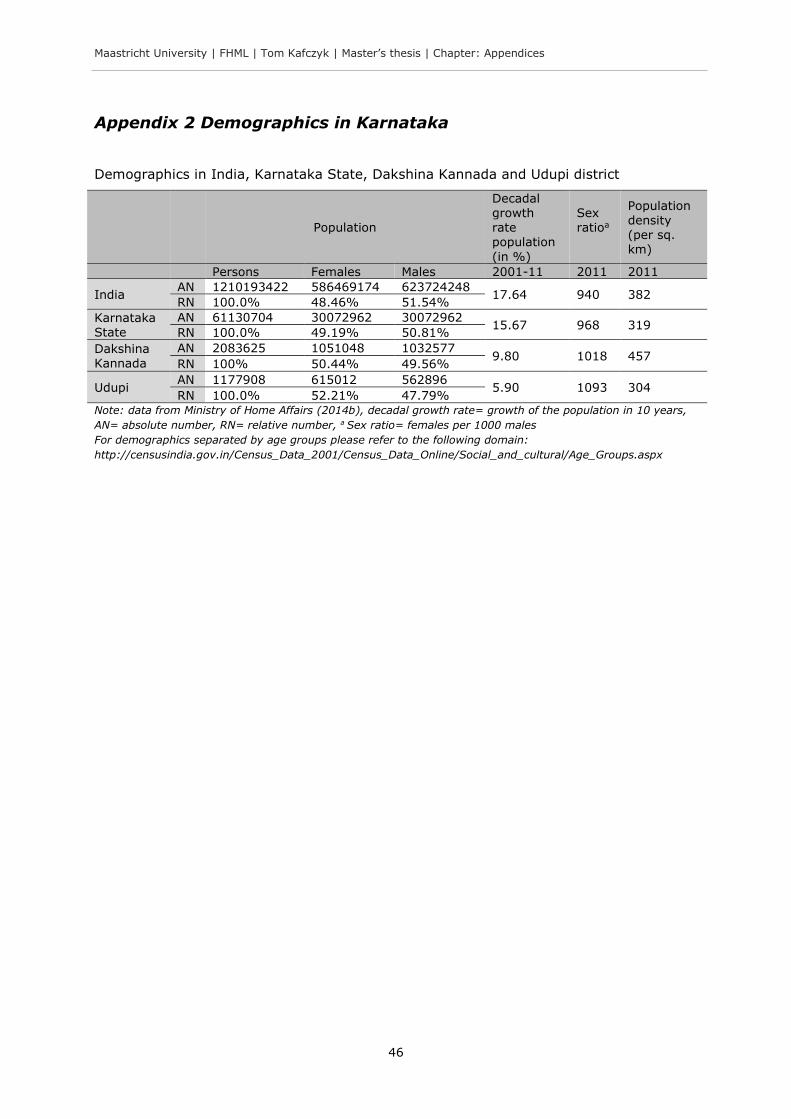
Maastricht University | FHML | Tom Kafczyk | Master’s thesis | Chapter: Appendices
46
Appendix 2 Demographics in Karnataka
Demographics in India, Karnataka State, Dakshina Kannada and Udupi district
Population
Decadal growth rate population
(in %)
Sex ratioa
Population density (per sq. km)
Persons Females Males 2001-11 2011 2011
India AN 1210193422 586469174 623724248
17.64 940 382 RN 100.0% 48.46% 51.54%
Karnataka State
AN 61130704 30072962 30072962 15.67 968 319
RN 100.0% 49.19% 50.81%
Dakshina
Kannada
AN 2083625 1051048 1032577 9.80 1018 457
RN 100% 50.44% 49.56%
Udupi AN 1177908 615012 562896
5.90 1093 304 RN 100.0% 52.21% 47.79%
Note: data from Ministry of Home Affairs (2014b), decadal growth rate= growth of the population in 10 years,
AN= absolute number, RN= relative number, a Sex ratio= females per 1000 males
For demographics separated by age groups please refer to the following domain:
http://censusindia.gov.in/Census_Data_2001/Census_Data_Online/Social_and_cultural/Age_Groups.aspx
Maastricht University | FHML | Tom Kafczyk | Master’s thesis | Chapter: Appendices
47
Appendix 3 Informed consent template
Note: the informed consent here is only a template; the format used in the study was
more “age-friendly” (i.e. bigger font size).
Invitation letter
To: Older persons living in the community or old age homes in Udupi district who are
invited to participate in the “Quality of Life and Perception of Aging Project”
This invitation letter is part of the informed consent that consists of two parts:
Part A: Subject Information Sheet
Part B: Informed Consent Form
Dear respected participant,
I am Tom Kafczyk, a final year master student of Global Health from Maastricht
University. I am now undertaking a thesis-project for the partial fulfilment of the course
in collaboration with Manipal University. The project is about quality of life and perception
of aging. I am going to give you information (Part A) and invite you to be part of this
project. You do not have to decide right now whether or not you will participate in the
research.
If you accept to participate I will ask you to sign an informed consent (Part B)/give oral
consent and to fill out questionnaires. It should not take longer than 20 minutes. You
may answer the questionnaire yourself, or it can be read out to you and the answer you
chose will be written down for you. If you do not want to answer any of the questions,
you may just want to skip them and move on to the next questions. You do not have to
give us any reason for not answering a question.
Thank you very much. Do you have any questions?
Yours sincerely
Tom Kafczyk
Maastricht and Manipal University
Mobile: [anonymized]
Maastricht University | FHML | Tom Kafczyk | Master’s thesis | Chapter: Appendices
48
Part A: SUBJECT INFORMATION SHEET
Protocol title: Quality of Life and Perception of Aging in Institutionalized and Non-
Institutionalized Elderly in Karnataka State
Language: English and Kannada
Principal Investigator: Tom Kafczyk
Designation: PG student in Global Health (Maastricht/Manipal University)
Contact number: [anonymized]
Please read this form carefully. If you don’t understand the language or any information
in this document, please discuss with the principal investigator.
Introduction to the research study
India will soon have the second largest population over 60 after China. Amplified by
globalization, older people face now a decline in traditional values that is reflected in a
breakdown of family structures and a rise in the number of old age homes. Not family
but institutional care for the elderly is on the rise. In light of these changes, a better
understanding of how different living arrangements affect quality of life and the
perception of aging is needed. This quantitative study aims to contribute to a better
understanding of the interplay of living arrangement, perception of aging and quality of
life in elderly in Karnataka.
Purpose of the study
The purpose of the present study is to shed light on potential differences in quality of life
of elderly people living in the community versus living in old age homes and how the
perception of aging of the elderly may explain at least partly this difference. The study
will thus help to identify the need to enhance quality of life and the perception of aging
and might assist policy-makers in identifying appropriate strategies.
Who can take part
Elderly persons within old age homes and within the community in Udupi and Dakshina
Kannada district will be asked to participate. Inclusion criteria are ≥ 55 years and giving
informed consent.
Information about the study
It is a comparative cross-sectional study. The data will be collected in approximately two
month. The target population size is 120 (60 in old age homes and 60 in communities).
Two questionnaires are used: the WHOQOL-BREF and the Attitude Toward Own Aging
subscale of the Lawton Philadelphia Geriatric Centre Morale Scale. It should not take
Maastricht University | FHML | Tom Kafczyk | Master’s thesis | Chapter: Appendices
49
longer than 20 minutes. None of the questions are sensitive or embarrassing. The study
does not involve any kind of physical examination of the participants.
Your role in the study
You are invited for participation to provide with your valuable responses.
What are the risks?
There is no potential risk in the study. The information provided by the participants will
be treated as confidential. This proposal has been reviewed and approved by the
Institutional Review Committee, Kasturba Hospital, Manipal that is a committee whose
task it is to make sure that research participants are protected from harm.
What are the potential benefits of participating in the study?
This study may provide new insights into the quality of life and perception of aging
research. These evidences can have policy implications and might thus indirectly benefit
the participants. Participants will not receive any incentives.
Confidentiality of information
The information provided will be treated as confidential and anonymous and no one else
except the principal investigator will have access to the provided information.
Voluntary participation
Whether or not you take part in the study is your choice. If you do not wish to
participate, you do not have to give a reason. You have the right to access information
collected as part of the study.
Whom to contact in case of any questions
If you have any questions about this form or any study related issues, you may contact
the following person.
Name: Dr. Lena Ashok
Address: Assistant Professor
Dept. of Public Health
Manipal University
Telephone No.: [anonymized]
Maastricht University | FHML | Tom Kafczyk | Master’s thesis | Chapter: Appendices
50
Part B: Informed consent Form
I have read the Subject Information Sheet and its contents were explained. I had the
opportunity to ask questions and received satisfactorily answers.
I understand that my participation in the study is voluntary and that I have the right to
withdraw at any time without giving any reason, without my medical care or legal rights
being affected.
I agree to take part in the above study I confirm that I have received a copy of the
subject information sheet along with this signed and dated informed consent form.
______________________________________ __________
Name & Signature of the research subject Date
______________________________________ __________
Name & signature of the witness Date
______________________________________ __________
Name & signature of the person explaining the consent Date
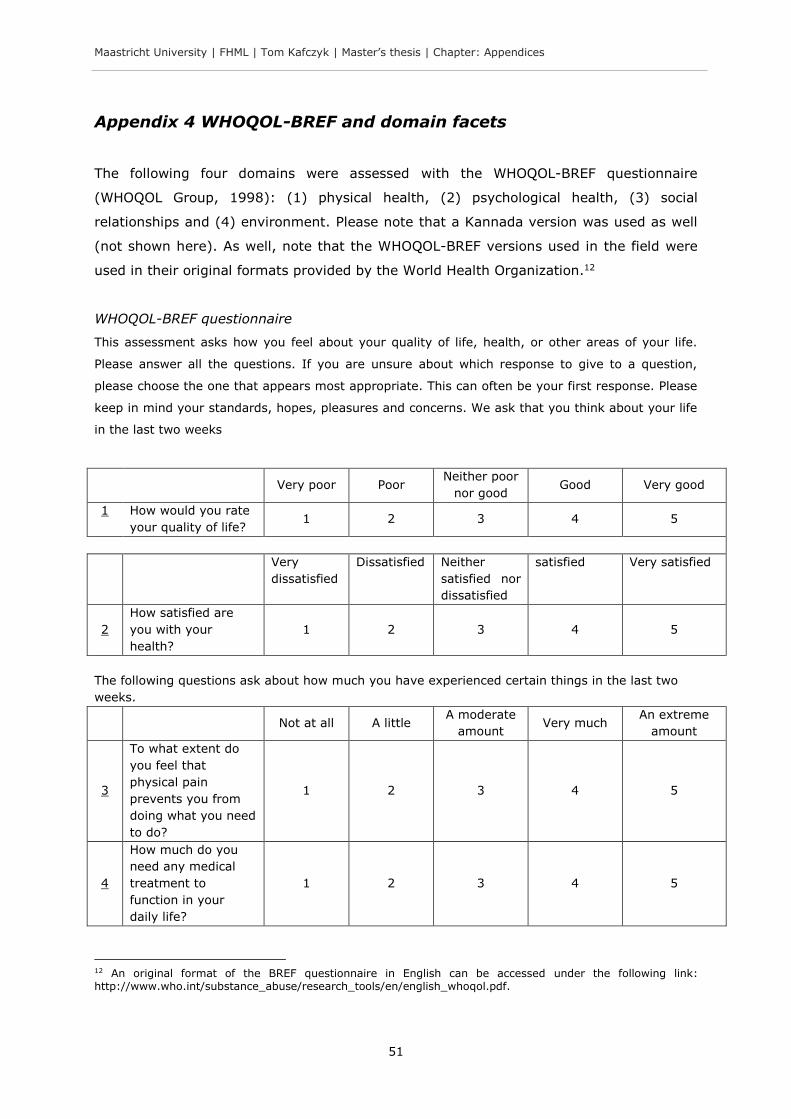
Maastricht University | FHML | Tom Kafczyk | Master’s thesis | Chapter: Appendices
51
Appendix 4 WHOQOL-BREF and domain facets
The following four domains were assessed with the WHOQOL-BREF questionnaire
(WHOQOL Group, 1998): (1) physical health, (2) psychological health, (3) social
relationships and (4) environment. Please note that a Kannada version was used as well
(not shown here). As well, note that the WHOQOL-BREF versions used in the field were
used in their original formats provided by the World Health Organization.12
WHOQOL-BREF questionnaire
This assessment asks how you feel about your quality of life, health, or other areas of your life.
Please answer all the questions. If you are unsure about which response to give to a question,
please choose the one that appears most appropriate. This can often be your first response. Please
keep in mind your standards, hopes, pleasures and concerns. We ask that you think about your life
in the last two weeks
Very poor Poor Neither poor
nor good Good Very good
1
How would you rate
your quality of life? 1 2 3 4 5
Very
dissatisfied
Dissatisfied Neither
satisfied nor
dissatisfied
satisfied Very satisfied
2
How satisfied are
you with your
health?
1 2 3 4 5
The following questions ask about how much you have experienced certain things in the last two
weeks.
Not at all A little A moderate
amount Very much
An extreme
amount
3
To what extent do
you feel that
physical pain
prevents you from
doing what you need
to do?
1 2 3 4 5
4
How much do you
need any medical
treatment to
function in your
daily life?
1 2 3 4 5
12 An original format of the BREF questionnaire in English can be accessed under the following link: http://www.who.int/substance_abuse/research_tools/en/english_whoqol.pdf.
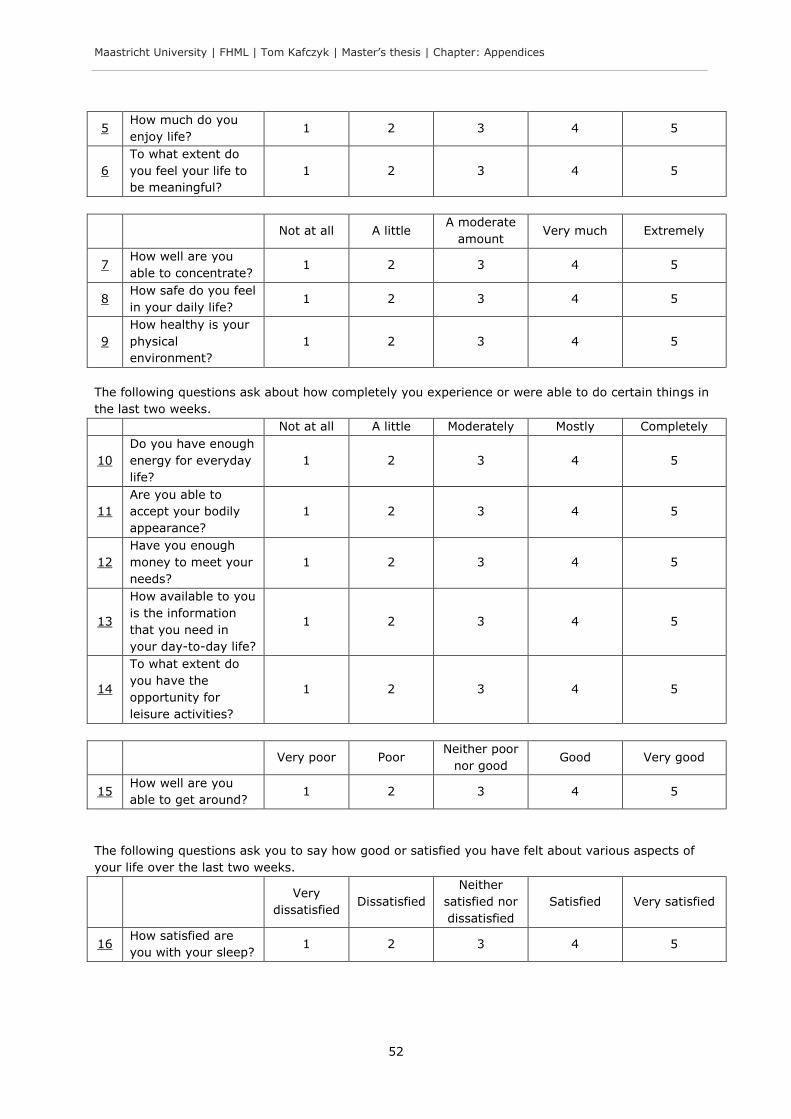
Maastricht University | FHML | Tom Kafczyk | Master’s thesis | Chapter: Appendices
52
5 How much do you
enjoy life? 1 2 3 4 5
6
To what extent do
you feel your life to
be meaningful?
1 2 3 4 5
Not at all A little A moderate
amount Very much Extremely
7 How well are you
able to concentrate? 1 2 3 4 5
8 How safe do you feel
in your daily life? 1 2 3 4 5
9
How healthy is your
physical
environment?
1 2 3 4 5
The following questions ask about how completely you experience or were able to do certain things in
the last two weeks.
Not at all A little Moderately Mostly Completely
10
Do you have enough
energy for everyday
life?
1 2 3 4 5
11
Are you able to
accept your bodily
appearance?
1 2 3 4 5
12
Have you enough
money to meet your
needs?
1 2 3 4 5
13
How available to you
is the information
that you need in
your day-to-day life?
1 2 3 4 5
14
To what extent do
you have the
opportunity for
leisure activities?
1 2 3 4 5
Very poor Poor Neither poor
nor good Good Very good
15 How well are you
able to get around? 1 2 3 4 5
The following questions ask you to say how good or satisfied you have felt about various aspects of
your life over the last two weeks.
Very
dissatisfied Dissatisfied
Neither
satisfied nor
dissatisfied
Satisfied Very satisfied
16 How satisfied are
you with your sleep? 1 2 3 4 5
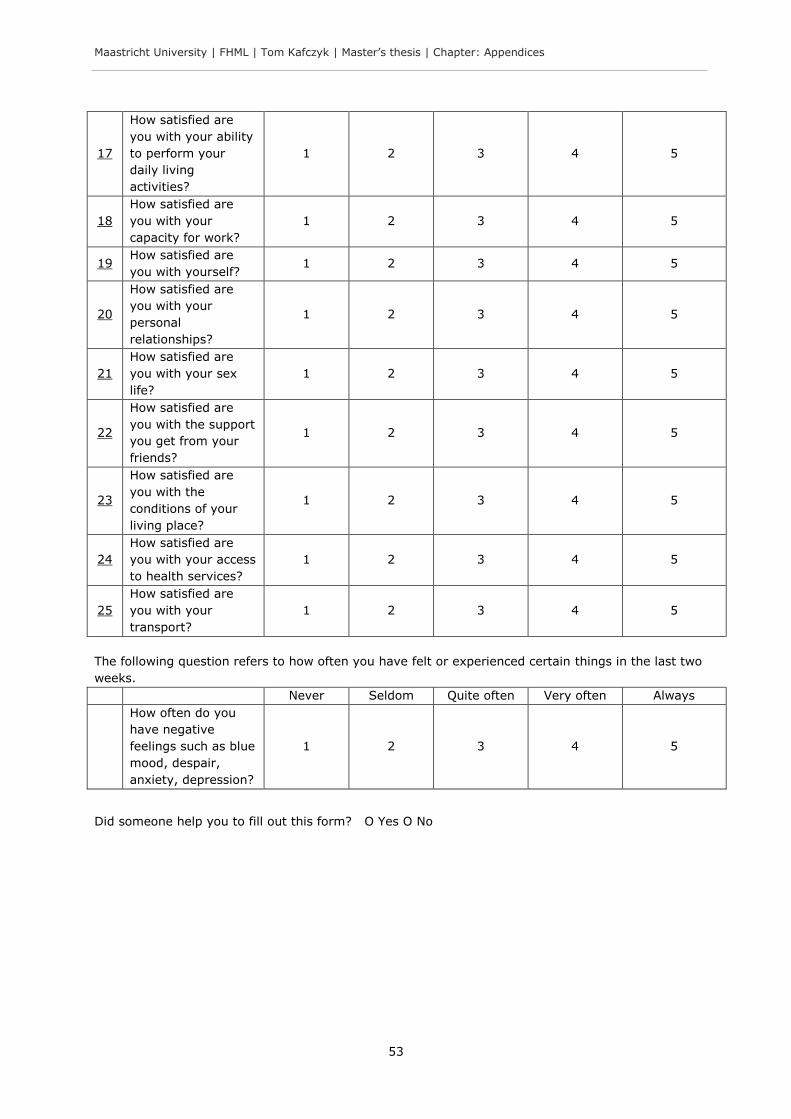
Maastricht University | FHML | Tom Kafczyk | Master’s thesis | Chapter: Appendices
53
17
How satisfied are
you with your ability
to perform your
daily living
activities?
1 2 3 4 5
18
How satisfied are
you with your
capacity for work?
1 2 3 4 5
19 How satisfied are
you with yourself? 1 2 3 4 5
20
How satisfied are
you with your
personal
relationships?
1 2 3 4 5
21
How satisfied are
you with your sex
life?
1 2 3 4 5
22
How satisfied are
you with the support
you get from your
friends?
1 2 3 4 5
23
How satisfied are
you with the
conditions of your
living place?
1 2 3 4 5
24
How satisfied are
you with your access
to health services?
1 2 3 4 5
25
How satisfied are
you with your
transport?
1 2 3 4 5
The following question refers to how often you have felt or experienced certain things in the last two
weeks.
Never Seldom Quite often Very often Always
How often do you
have negative
feelings such as blue
mood, despair,
anxiety, depression?
1 2 3 4 5
Did someone help you to fill out this form? O Yes O No
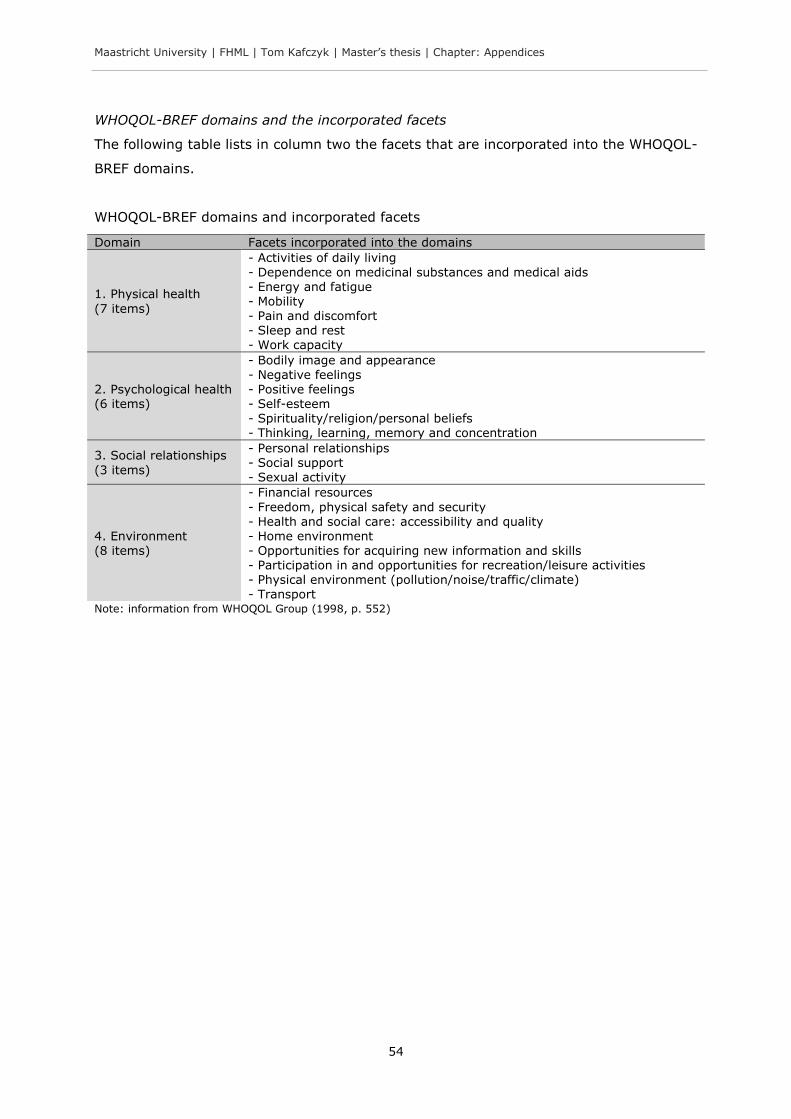
Maastricht University | FHML | Tom Kafczyk | Master’s thesis | Chapter: Appendices
54
WHOQOL-BREF domains and the incorporated facets
The following table lists in column two the facets that are incorporated into the WHOQOL-
BREF domains.
WHOQOL-BREF domains and incorporated facets
Note: information from WHOQOL Group (1998, p. 552)
Domain Facets incorporated into the domains
1. Physical health
(7 items)
- Activities of daily living - Dependence on medicinal substances and medical aids - Energy and fatigue - Mobility - Pain and discomfort - Sleep and rest - Work capacity
2. Psychological health (6 items)
- Bodily image and appearance
- Negative feelings - Positive feelings - Self-esteem - Spirituality/religion/personal beliefs - Thinking, learning, memory and concentration
3. Social relationships
(3 items)
- Personal relationships - Social support - Sexual activity
4. Environment (8 items)
- Financial resources
- Freedom, physical safety and security - Health and social care: accessibility and quality - Home environment - Opportunities for acquiring new information and skills - Participation in and opportunities for recreation/leisure activities - Physical environment (pollution/noise/traffic/climate) - Transport
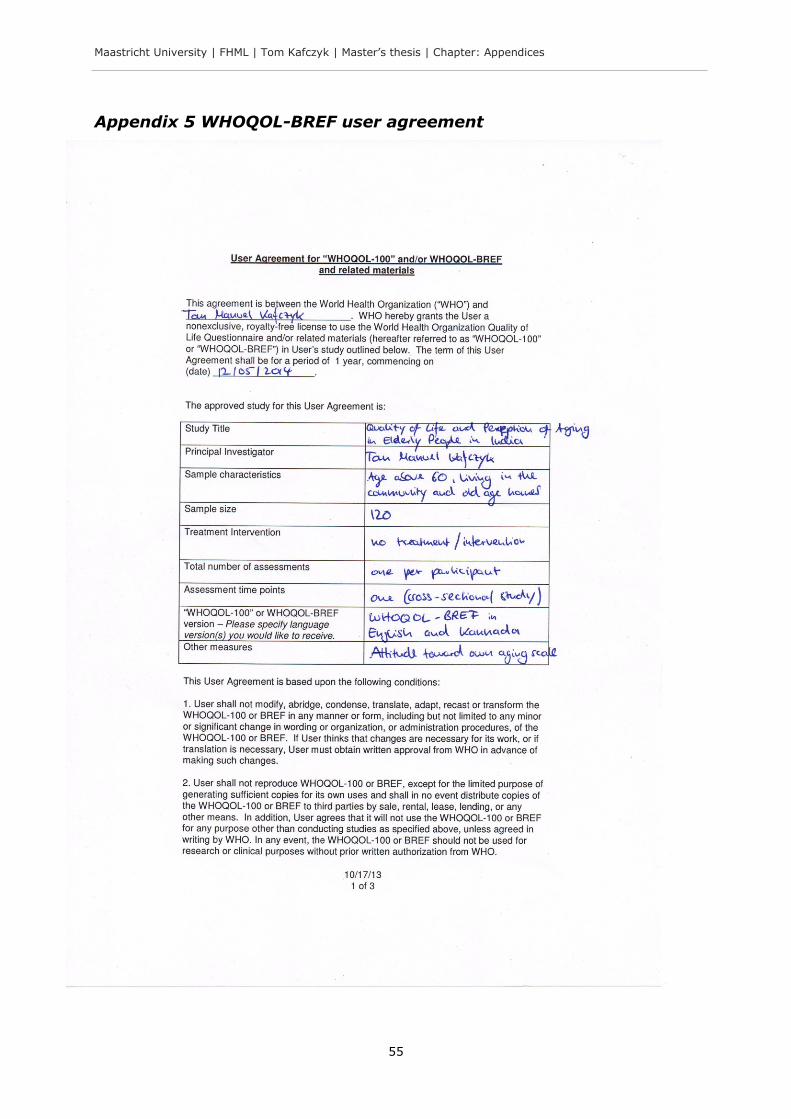
Maastricht University | FHML | Tom Kafczyk | Master’s thesis | Chapter: Appendices
55
Appendix 5 WHOQOL-BREF user agreement
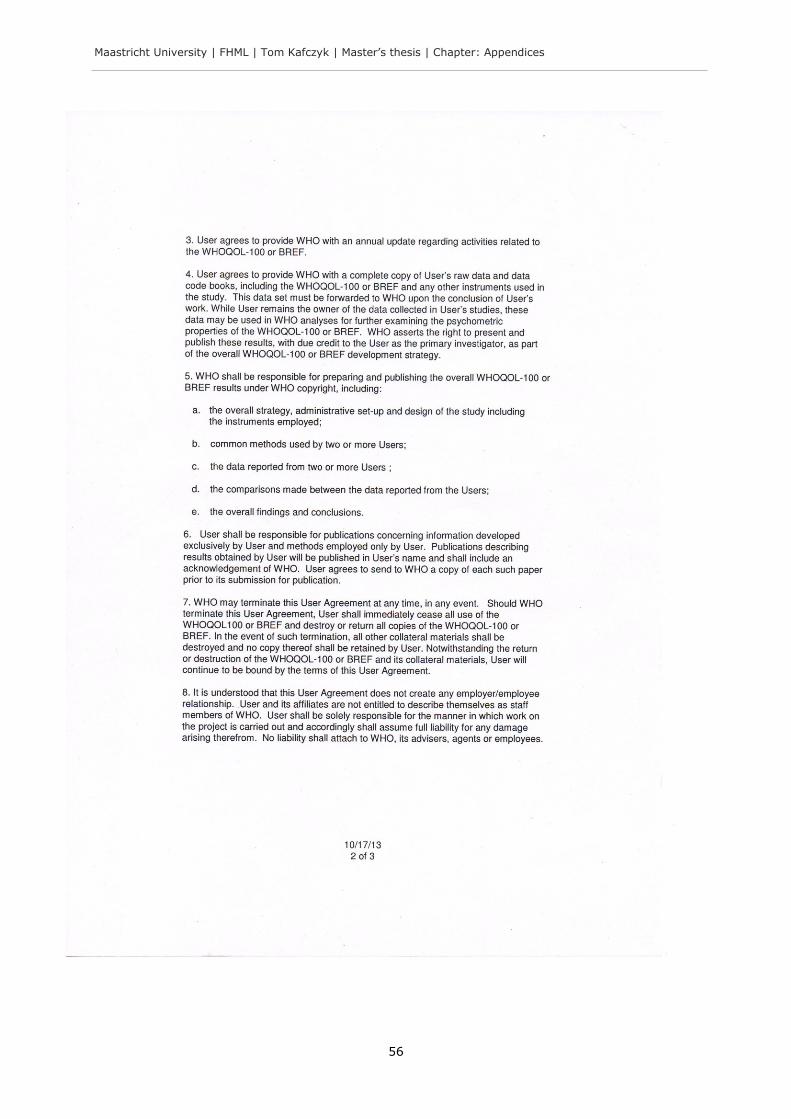
Maastricht University | FHML | Tom Kafczyk | Master’s thesis | Chapter: Appendices
56
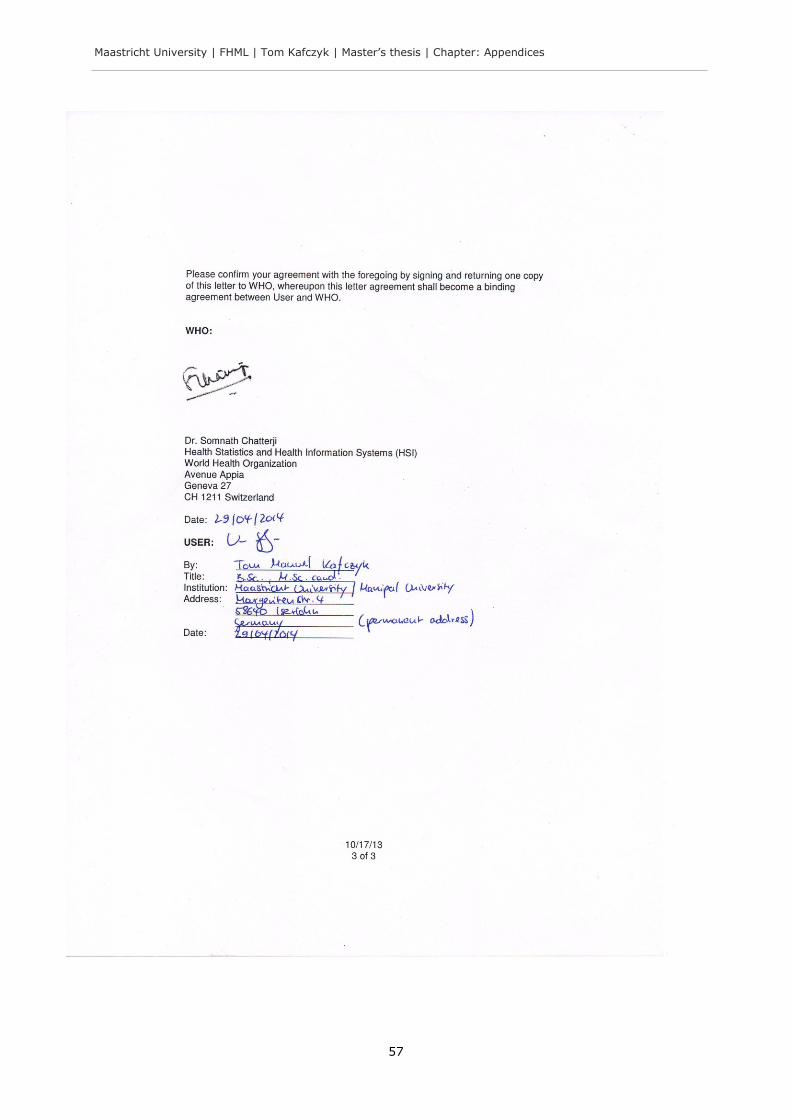
Maastricht University | FHML | Tom Kafczyk | Master’s thesis | Chapter: Appendices
57
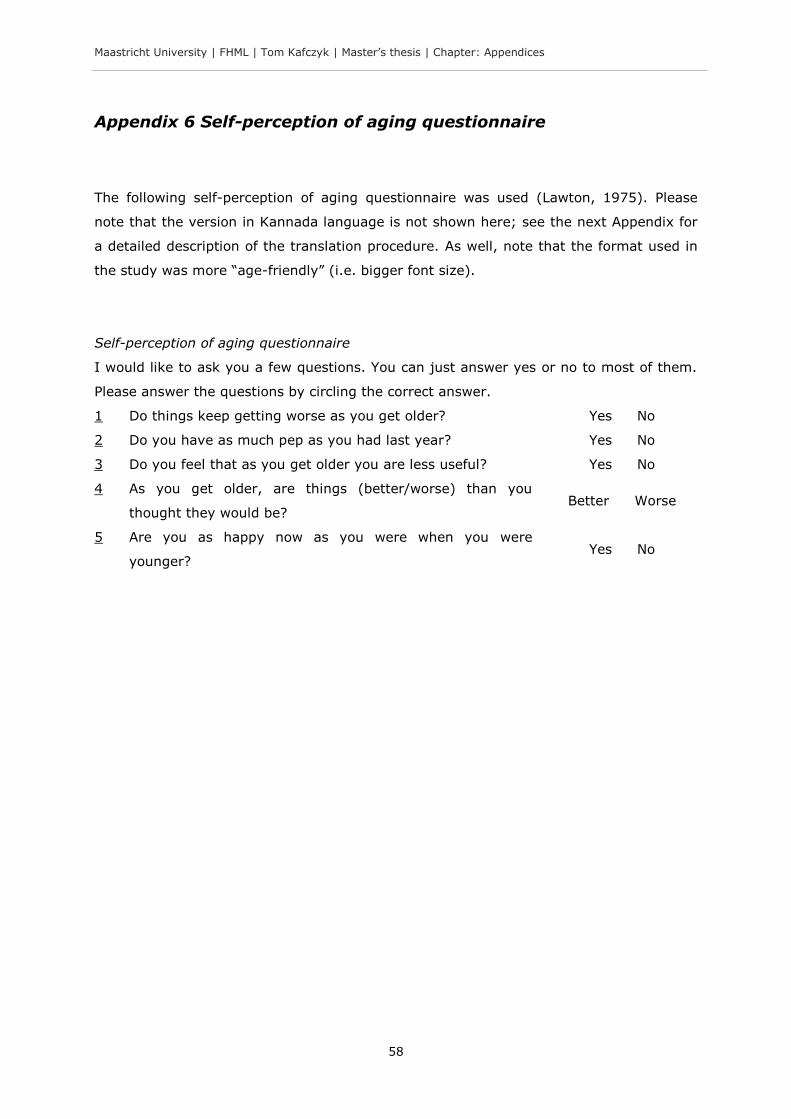
Maastricht University | FHML | Tom Kafczyk | Master’s thesis | Chapter: Appendices
58
Appendix 6 Self-perception of aging questionnaire
The following self-perception of aging questionnaire was used (Lawton, 1975). Please
note that the version in Kannada language is not shown here; see the next Appendix for
a detailed description of the translation procedure. As well, note that the format used in
the study was more “age-friendly” (i.e. bigger font size).
Self-perception of aging questionnaire
I would like to ask you a few questions. You can just answer yes or no to most of them.
Please answer the questions by circling the correct answer.
1 Do things keep getting worse as you get older? Yes No
2 Do you have as much pep as you had last year? Yes No
3 Do you feel that as you get older you are less useful? Yes No
4 As you get older, are things (better/worse) than you
thought they would be? Better Worse
5 Are you as happy now as you were when you were
younger? Yes No
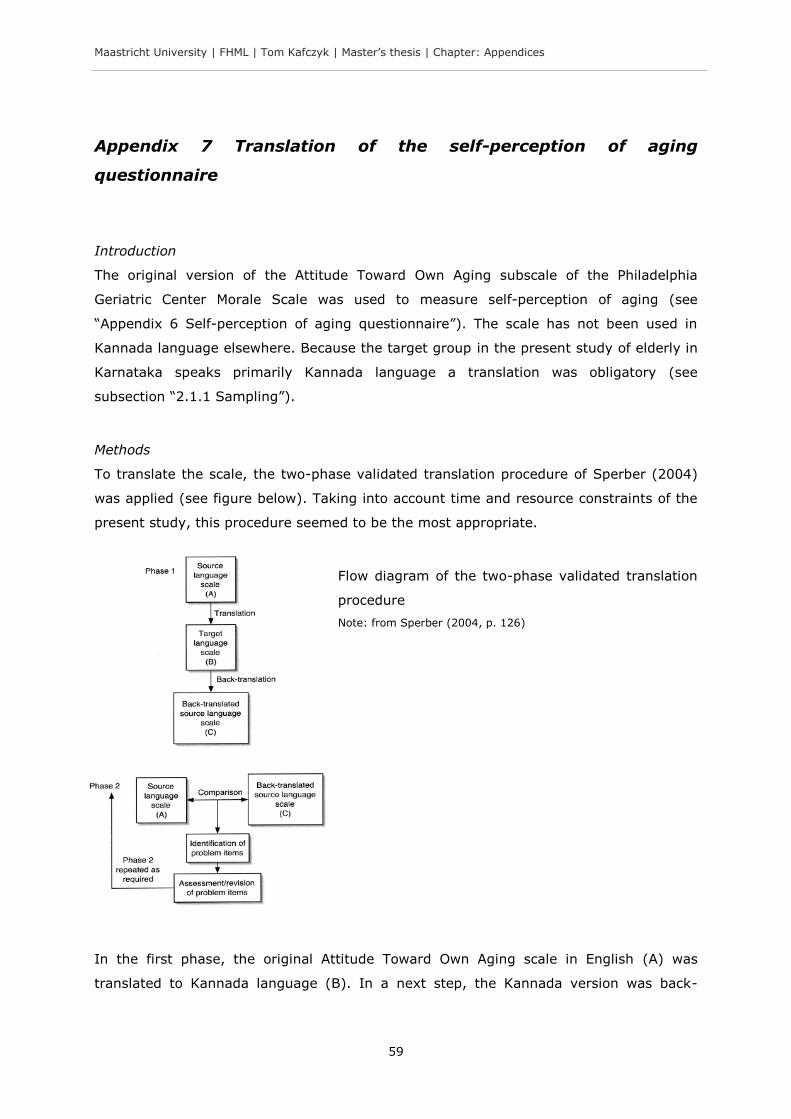
Maastricht University | FHML | Tom Kafczyk | Master’s thesis | Chapter: Appendices
59
Appendix 7 Translation of the self-perception of aging
questionnaire
Introduction
The original version of the Attitude Toward Own Aging subscale of the Philadelphia
Geriatric Center Morale Scale was used to measure self-perception of aging (see
“Appendix 6 Self-perception of aging questionnaire”). The scale has not been used in
Kannada language elsewhere. Because the target group in the present study of elderly in
Karnataka speaks primarily Kannada language a translation was obligatory (see
subsection “2.1.1 Sampling”).
Methods
To translate the scale, the two-phase validated translation procedure of Sperber (2004)
was applied (see figure below). Taking into account time and resource constraints of the
present study, this procedure seemed to be the most appropriate.
Flow diagram of the two-phase validated translation
procedure
Note: from Sperber (2004, p. 126)
In the first phase, the original Attitude Toward Own Aging scale in English (A) was
translated to Kannada language (B). In a next step, the Kannada version was back-
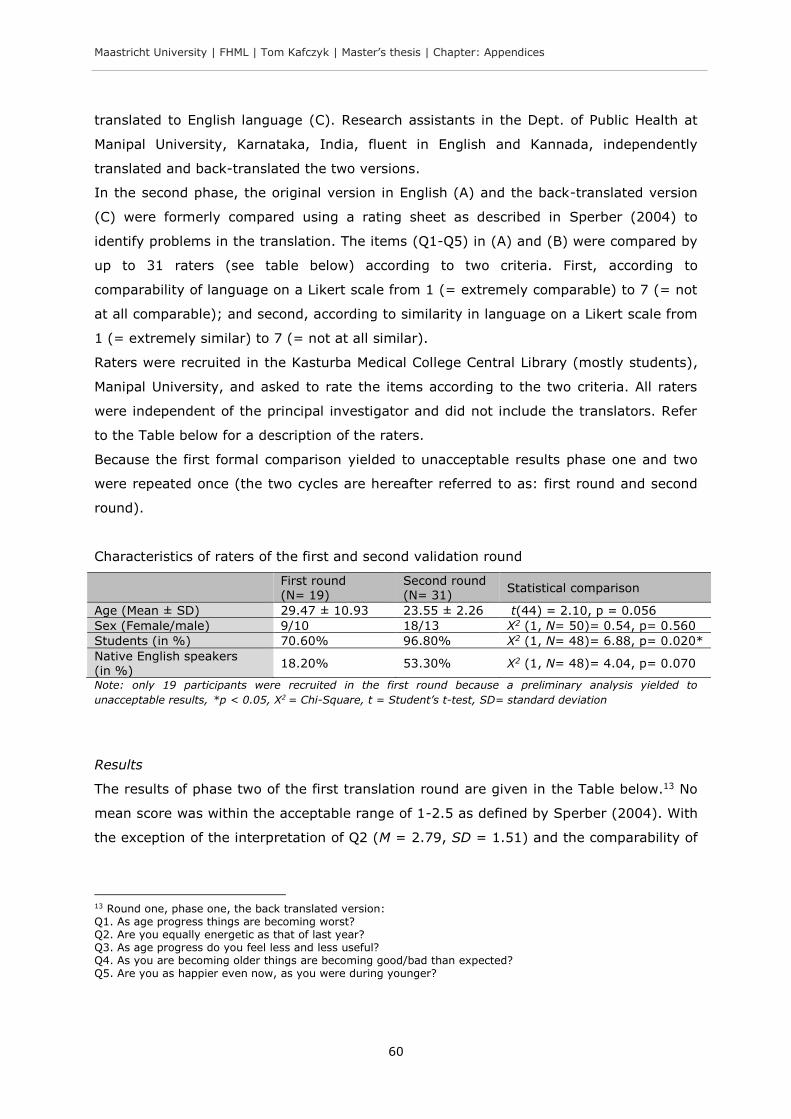
Maastricht University | FHML | Tom Kafczyk | Master’s thesis | Chapter: Appendices
60
translated to English language (C). Research assistants in the Dept. of Public Health at
Manipal University, Karnataka, India, fluent in English and Kannada, independently
translated and back-translated the two versions.
In the second phase, the original version in English (A) and the back-translated version
(C) were formerly compared using a rating sheet as described in Sperber (2004) to
identify problems in the translation. The items (Q1-Q5) in (A) and (B) were compared by
up to 31 raters (see table below) according to two criteria. First, according to
comparability of language on a Likert scale from 1 (= extremely comparable) to 7 (= not
at all comparable); and second, according to similarity in language on a Likert scale from
1 (= extremely similar) to 7 (= not at all similar).
Raters were recruited in the Kasturba Medical College Central Library (mostly students),
Manipal University, and asked to rate the items according to the two criteria. All raters
were independent of the principal investigator and did not include the translators. Refer
to the Table below for a description of the raters.
Because the first formal comparison yielded to unacceptable results phase one and two
were repeated once (the two cycles are hereafter referred to as: first round and second
round).
Characteristics of raters of the first and second validation round
First round (N= 19)
Second round (N= 31)
Statistical comparison
Age (Mean ± SD) 29.47 ± 10.93 23.55 ± 2.26 t(44) = 2.10, p = 0.056
Sex (Female/male) 9/10 18/13 X2 (1, N= 50)= 0.54, p= 0.560
Students (in %) 70.60% 96.80% X2 (1, N= 48)= 6.88, p= 0.020*
Native English speakers (in %)
18.20% 53.30% X2 (1, N= 48)= 4.04, p= 0.070
Note: only 19 participants were recruited in the first round because a preliminary analysis yielded to
unacceptable results, *p < 0.05, X2 = Chi-Square, t = Student’s t-test, SD= standard deviation
Results
The results of phase two of the first translation round are given in the Table below.13 No
mean score was within the acceptable range of 1-2.5 as defined by Sperber (2004). With
the exception of the interpretation of Q2 (M = 2.79, SD = 1.51) and the comparability of
13 Round one, phase one, the back translated version: Q1. As age progress things are becoming worst? Q2. Are you equally energetic as that of last year? Q3. As age progress do you feel less and less useful? Q4. As you are becoming older things are becoming good/bad than expected? Q5. Are you as happier even now, as you were during younger?
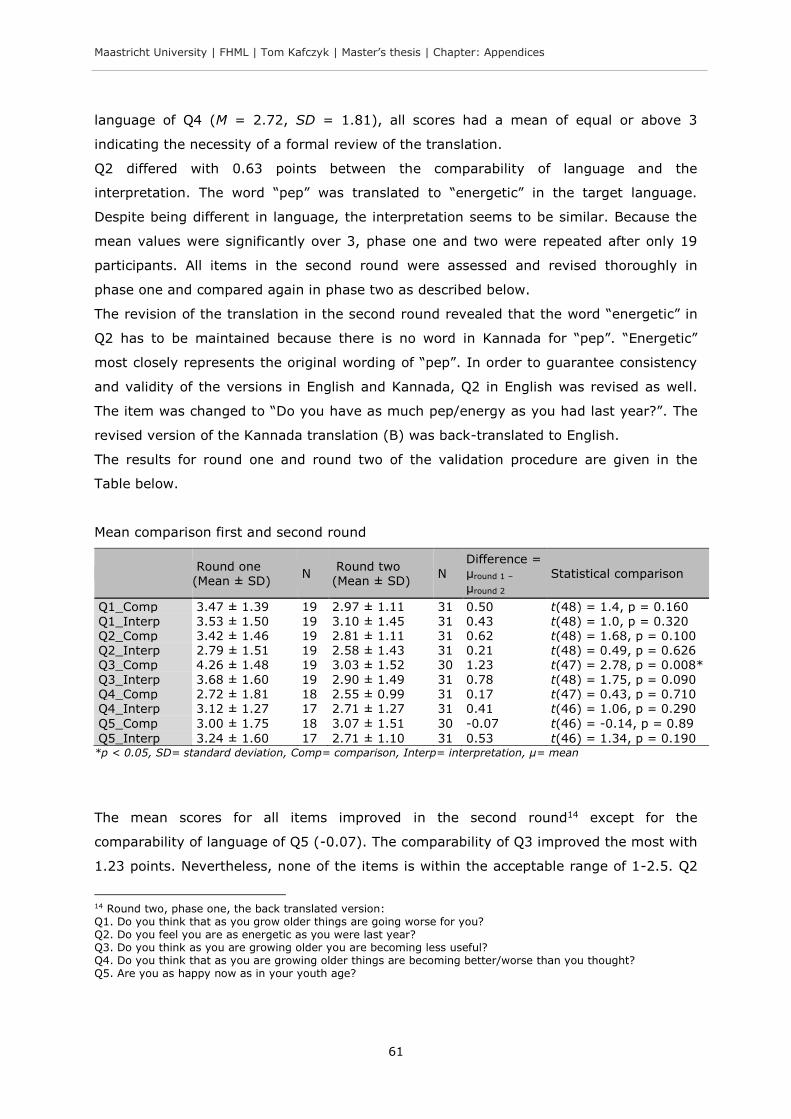
Maastricht University | FHML | Tom Kafczyk | Master’s thesis | Chapter: Appendices
61
language of Q4 (M = 2.72, SD = 1.81), all scores had a mean of equal or above 3
indicating the necessity of a formal review of the translation.
Q2 differed with 0.63 points between the comparability of language and the
interpretation. The word “pep” was translated to “energetic” in the target language.
Despite being different in language, the interpretation seems to be similar. Because the
mean values were significantly over 3, phase one and two were repeated after only 19
participants. All items in the second round were assessed and revised thoroughly in
phase one and compared again in phase two as described below.
The revision of the translation in the second round revealed that the word “energetic” in
Q2 has to be maintained because there is no word in Kannada for “pep”. “Energetic”
most closely represents the original wording of “pep”. In order to guarantee consistency
and validity of the versions in English and Kannada, Q2 in English was revised as well.
The item was changed to “Do you have as much pep/energy as you had last year?”. The
revised version of the Kannada translation (B) was back-translated to English.
The results for round one and round two of the validation procedure are given in the
Table below.
Mean comparison first and second round
Round one (Mean ± SD)
N Round two (Mean ± SD)
N Difference = µround 1 –
µround 2
Statistical comparison
Q1_Comp 3.47 ± 1.39 19 2.97 ± 1.11 31 0.50 t(48) = 1.4, p = 0.160
Q1_Interp 3.53 ± 1.50 19 3.10 ± 1.45 31 0.43 t(48) = 1.0, p = 0.320 Q2_Comp 3.42 ± 1.46 19 2.81 ± 1.11 31 0.62 t(48) = 1.68, p = 0.100 Q2_Interp 2.79 ± 1.51 19 2.58 ± 1.43 31 0.21 t(48) = 0.49, p = 0.626 Q3_Comp 4.26 ± 1.48 19 3.03 ± 1.52 30 1.23 t(47) = 2.78, p = 0.008*
Q3_Interp 3.68 ± 1.60 19 2.90 ± 1.49 31 0.78 t(48) = 1.75, p = 0.090 Q4_Comp 2.72 ± 1.81 18 2.55 ± 0.99 31 0.17 t(47) = 0.43, p = 0.710 Q4_Interp 3.12 ± 1.27 17 2.71 ± 1.27 31 0.41 t(46) = 1.06, p = 0.290
Q5_Comp 3.00 ± 1.75 18 3.07 ± 1.51 30 -0.07 t(46) = -0.14, p = 0.89
Q5_Interp 3.24 ± 1.60 17 2.71 ± 1.10 31 0.53 t(46) = 1.34, p = 0.190 *p < 0.05, SD= standard deviation, Comp= comparison, Interp= interpretation, µ= mean
The mean scores for all items improved in the second round14 except for the
comparability of language of Q5 (-0.07). The comparability of Q3 improved the most with
1.23 points. Nevertheless, none of the items is within the acceptable range of 1-2.5. Q2
14 Round two, phase one, the back translated version: Q1. Do you think that as you grow older things are going worse for you? Q2. Do you feel you are as energetic as you were last year? Q3. Do you think as you are growing older you are becoming less useful? Q4. Do you think that as you are growing older things are becoming better/worse than you thought? Q5. Are you as happy now as in your youth age?
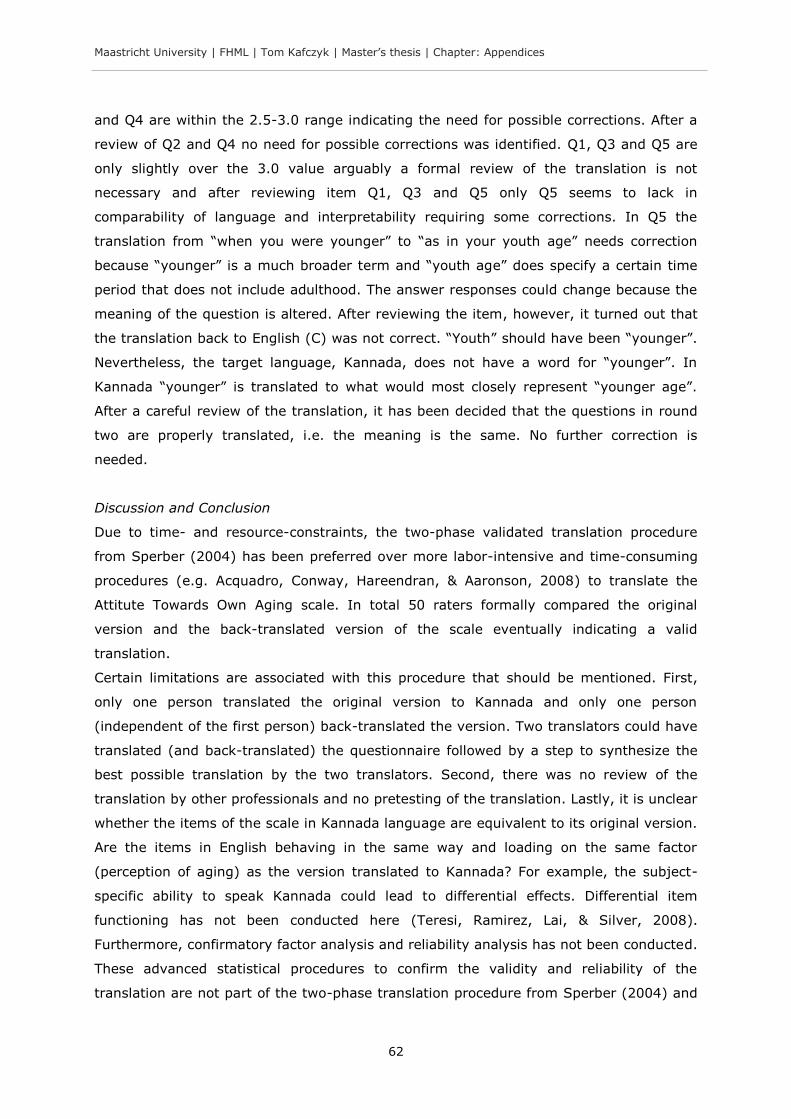
Maastricht University | FHML | Tom Kafczyk | Master’s thesis | Chapter: Appendices
62
and Q4 are within the 2.5-3.0 range indicating the need for possible corrections. After a
review of Q2 and Q4 no need for possible corrections was identified. Q1, Q3 and Q5 are
only slightly over the 3.0 value arguably a formal review of the translation is not
necessary and after reviewing item Q1, Q3 and Q5 only Q5 seems to lack in
comparability of language and interpretability requiring some corrections. In Q5 the
translation from “when you were younger” to “as in your youth age” needs correction
because “younger” is a much broader term and “youth age” does specify a certain time
period that does not include adulthood. The answer responses could change because the
meaning of the question is altered. After reviewing the item, however, it turned out that
the translation back to English (C) was not correct. “Youth” should have been “younger”.
Nevertheless, the target language, Kannada, does not have a word for “younger”. In
Kannada “younger” is translated to what would most closely represent “younger age”.
After a careful review of the translation, it has been decided that the questions in round
two are properly translated, i.e. the meaning is the same. No further correction is
needed.
Discussion and Conclusion
Due to time- and resource-constraints, the two-phase validated translation procedure
from Sperber (2004) has been preferred over more labor-intensive and time-consuming
procedures (e.g. Acquadro, Conway, Hareendran, & Aaronson, 2008) to translate the
Attitute Towards Own Aging scale. In total 50 raters formally compared the original
version and the back-translated version of the scale eventually indicating a valid
translation.
Certain limitations are associated with this procedure that should be mentioned. First,
only one person translated the original version to Kannada and only one person
(independent of the first person) back-translated the version. Two translators could have
translated (and back-translated) the questionnaire followed by a step to synthesize the
best possible translation by the two translators. Second, there was no review of the
translation by other professionals and no pretesting of the translation. Lastly, it is unclear
whether the items of the scale in Kannada language are equivalent to its original version.
Are the items in English behaving in the same way and loading on the same factor
(perception of aging) as the version translated to Kannada? For example, the subject-
specific ability to speak Kannada could lead to differential effects. Differential item
functioning has not been conducted here (Teresi, Ramirez, Lai, & Silver, 2008).
Furthermore, confirmatory factor analysis and reliability analysis has not been conducted.
These advanced statistical procedures to confirm the validity and reliability of the
translation are not part of the two-phase translation procedure from Sperber (2004) and
Maastricht University | FHML | Tom Kafczyk | Master’s thesis | Chapter: Appendices
63
were not feasible for the purpose of this study. However, future larger research projects
using the translation to Kannada language of the Attitude Toward Own Aging scale should
consider advanced statistical procedures to confirm the validity and reliability of the
scale.
Conclusion
Despite limitations of the validated translation procedure used to translate the Attitude
Toward Own Aging scale, evidence for the validity of the translation has been provided.
Within the constraints of the used procedure from Sperber (2004), after a careful review
of the translated items, it is concluded that no further improvements of the translated
version into Kannada language was feasible.
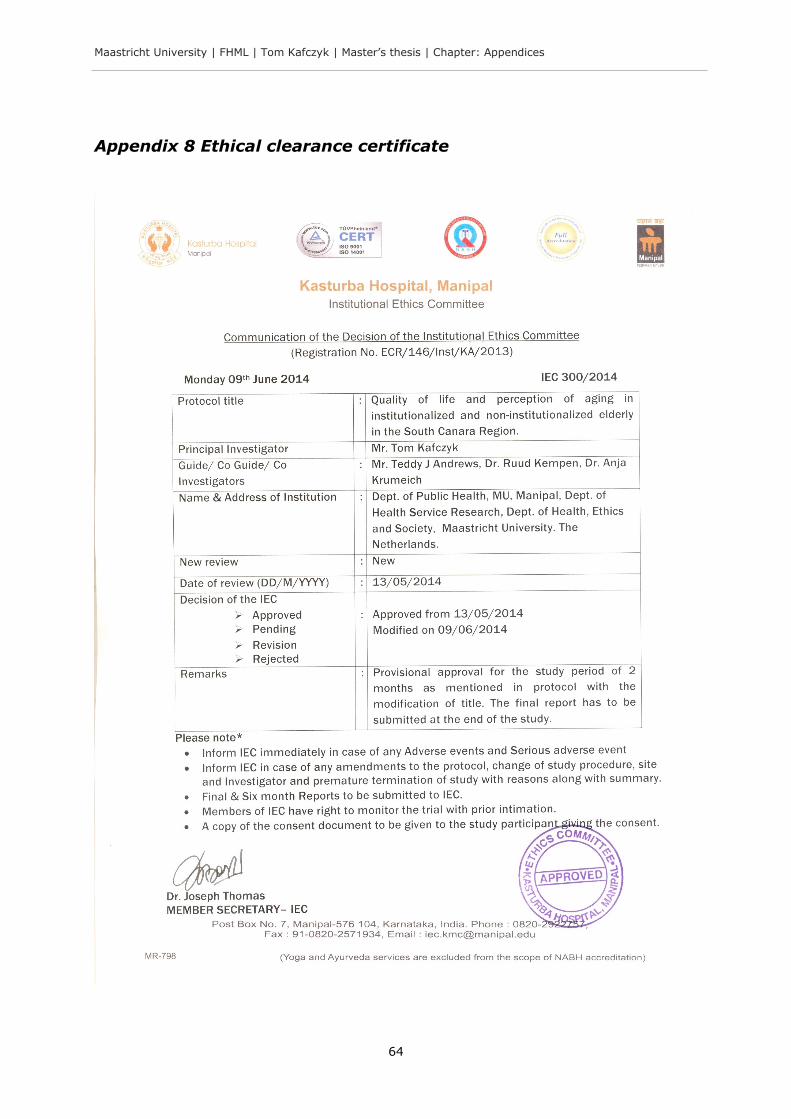
Maastricht University | FHML | Tom Kafczyk | Master’s thesis | Chapter: Appendices
64
Appendix 8 Ethical clearance certificate

Maastricht University | FHML | Tom Kafczyk | Master’s thesis | Chapter: Appendices
65
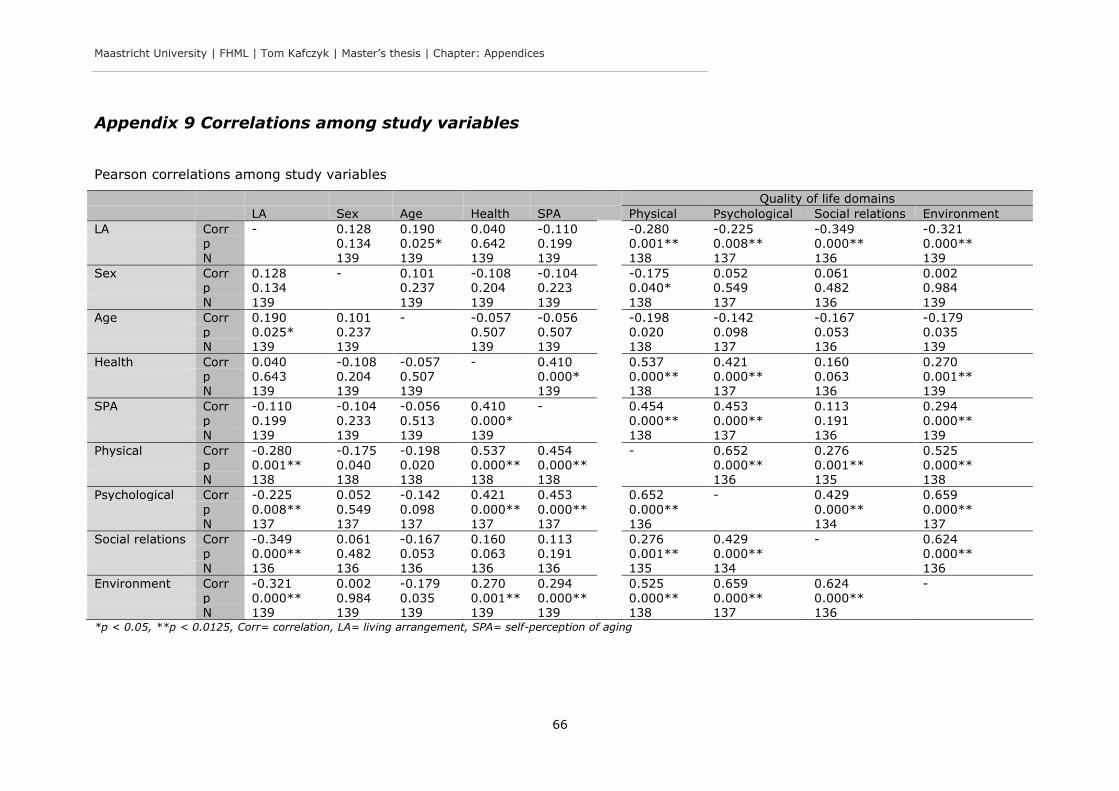
Maastricht University | FHML | Tom Kafczyk | Master’s thesis | Chapter: Appendices
66
Appendix 9 Correlations among study variables
Pearson correlations among study variables
Quality of life domains
LA Sex Age Health SPA Physical Psychological Social relations Environment
LA Corr - 0.128 0.190 0.040 -0.110 -0.280 -0.225 -0.349 -0.321 p 0.134 0.025* 0.642 0.199 0.001** 0.008** 0.000** 0.000**
N 139 139 139 139 138 137 136 139
Sex Corr 0.128 - 0.101 -0.108 -0.104 -0.175 0.052 0.061 0.002 p 0.134 0.237 0.204 0.223 0.040* 0.549 0.482 0.984
N 139 139 139 139 138 137 136 139
Age Corr 0.190 0.101 - -0.057 -0.056 -0.198 -0.142 -0.167 -0.179 p 0.025* 0.237 0.507 0.507 0.020 0.098 0.053 0.035 N 139 139 139 139 138 137 136 139
Health Corr 0.040 -0.108 -0.057 - 0.410 0.537 0.421 0.160 0.270 p 0.643 0.204 0.507 0.000* 0.000** 0.000** 0.063 0.001** N 139 139 139 139 138 137 136 139
SPA Corr -0.110 -0.104 -0.056 0.410 - 0.454 0.453 0.113 0.294
p 0.199 0.233 0.513 0.000* 0.000** 0.000** 0.191 0.000** N 139 139 139 139 138 137 136 139
Physical Corr -0.280 -0.175 -0.198 0.537 0.454 - 0.652 0.276 0.525 p 0.001** 0.040 0.020 0.000** 0.000** 0.000** 0.001** 0.000** N 138 138 138 138 138 136 135 138
Psychological Corr -0.225 0.052 -0.142 0.421 0.453 0.652 - 0.429 0.659
p 0.008** 0.549 0.098 0.000** 0.000** 0.000** 0.000** 0.000** N 137 137 137 137 137 136 134 137
Social relations Corr -0.349 0.061 -0.167 0.160 0.113 0.276 0.429 - 0.624 p 0.000** 0.482 0.053 0.063 0.191 0.001** 0.000** 0.000** N 136 136 136 136 136 135 134 136
Environment Corr -0.321 0.002 -0.179 0.270 0.294 0.525 0.659 0.624 -
p 0.000** 0.984 0.035 0.001** 0.000** 0.000** 0.000** 0.000** N 139 139 139 139 139 138 137 136 *p < 0.05, **p < 0.0125, Corr= correlation, LA= living arrangement, SPA= self-perception of aging
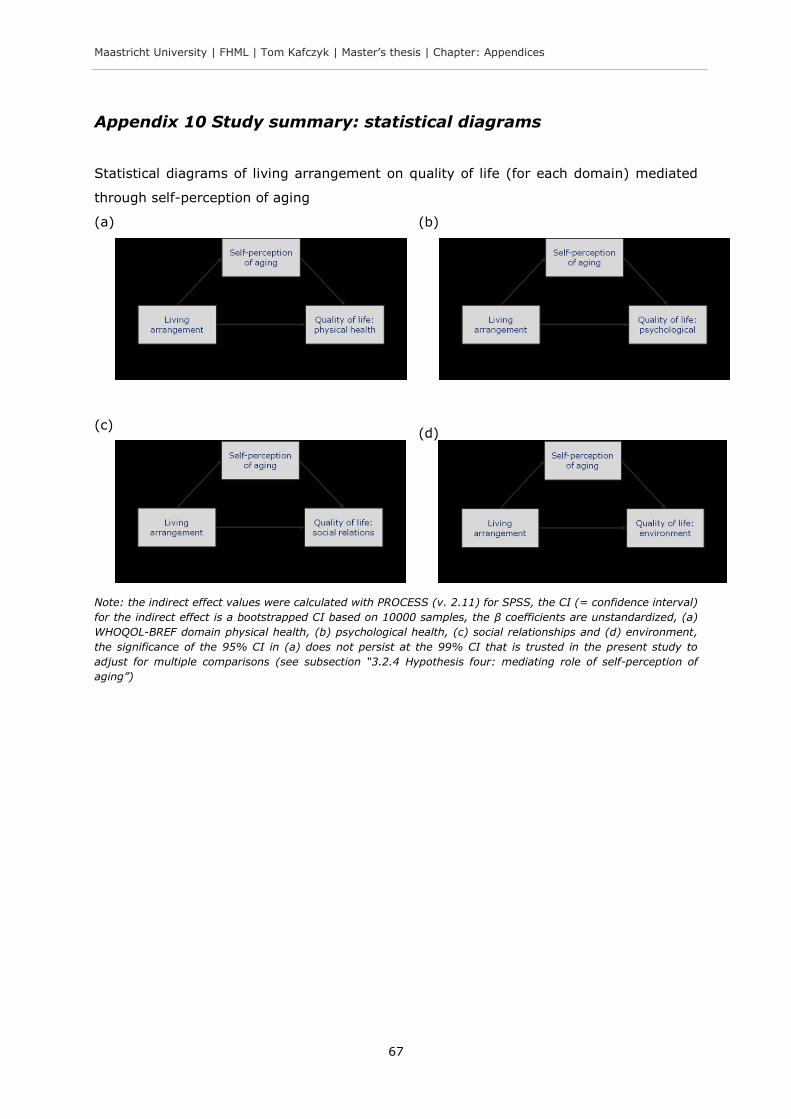
Maastricht University | FHML | Tom Kafczyk | Master’s thesis | Chapter: Appendices
67
Appendix 10 Study summary: statistical diagrams
Statistical diagrams of living arrangement on quality of life (for each domain) mediated
through self-perception of aging
(a)
(b)
(c)
(d)
Note: the indirect effect values were calculated with PROCESS (v. 2.11) for SPSS, the CI (= confidence interval)
for the indirect effect is a bootstrapped CI based on 10000 samples, the β coefficients are unstandardized, (a)
WHOQOL-BREF domain physical health, (b) psychological health, (c) social relationships and (d) environment,
the significance of the 95% CI in (a) does not persist at the 99% CI that is trusted in the present study to
adjust for multiple comparisons (see subsection “3.2.4 Hypothesis four: mediating role of self-perception of
aging”)
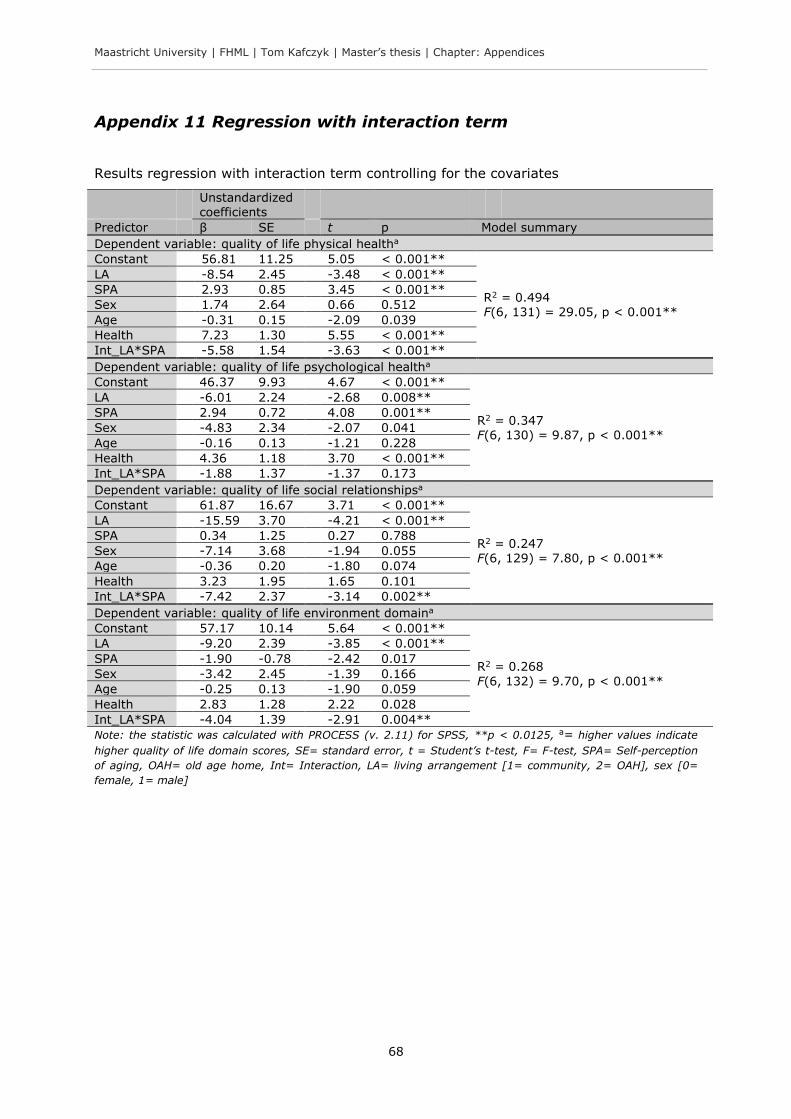
Maastricht University | FHML | Tom Kafczyk | Master’s thesis | Chapter: Appendices
68
Appendix 11 Regression with interaction term
Results regression with interaction term controlling for the covariates
Unstandardized coefficients
Predictor β SE t p Model summary
Dependent variable: quality of life physical healtha
Constant 56.81 11.25 5.05 < 0.001**
R2 = 0.494 F(6, 131) = 29.05, p < 0.001**
LA -8.54 2.45 -3.48 < 0.001**
SPA 2.93 0.85 3.45 < 0.001**
Sex 1.74 2.64 0.66 0.512
Age -0.31 0.15 -2.09 0.039
Health 7.23 1.30 5.55 < 0.001**
Int_LA*SPA -5.58 1.54 -3.63 < 0.001**
Dependent variable: quality of life psychological healtha
Constant 46.37 9.93 4.67 < 0.001**
R2 = 0.347 F(6, 130) = 9.87, p < 0.001**
LA -6.01 2.24 -2.68 0.008**
SPA 2.94 0.72 4.08 0.001**
Sex -4.83 2.34 -2.07 0.041
Age -0.16 0.13 -1.21 0.228
Health 4.36 1.18 3.70 < 0.001**
Int_LA*SPA -1.88 1.37 -1.37 0.173
Dependent variable: quality of life social relationshipsa
Constant 61.87 16.67 3.71 < 0.001**
R2 = 0.247 F(6, 129) = 7.80, p < 0.001**
LA -15.59 3.70 -4.21 < 0.001**
SPA 0.34 1.25 0.27 0.788
Sex -7.14 3.68 -1.94 0.055
Age -0.36 0.20 -1.80 0.074
Health 3.23 1.95 1.65 0.101
Int_LA*SPA -7.42 2.37 -3.14 0.002**
Dependent variable: quality of life environment domaina
Constant 57.17 10.14 5.64 < 0.001**
R2 = 0.268
F(6, 132) = 9.70, p < 0.001**
LA -9.20 2.39 -3.85 < 0.001**
SPA -1.90 -0.78 -2.42 0.017
Sex -3.42 2.45 -1.39 0.166
Age -0.25 0.13 -1.90 0.059
Health 2.83 1.28 2.22 0.028
Int_LA*SPA -4.04 1.39 -2.91 0.004**
Note: the statistic was calculated with PROCESS (v. 2.11) for SPSS, **p < 0.0125, a= higher values indicate
higher quality of life domain scores, SE= standard error, t = Student’s t-test, F= F-test, SPA= Self-perception
of aging, OAH= old age home, Int= Interaction, LA= living arrangement [1= community, 2= OAH], sex [0=
female, 1= male]
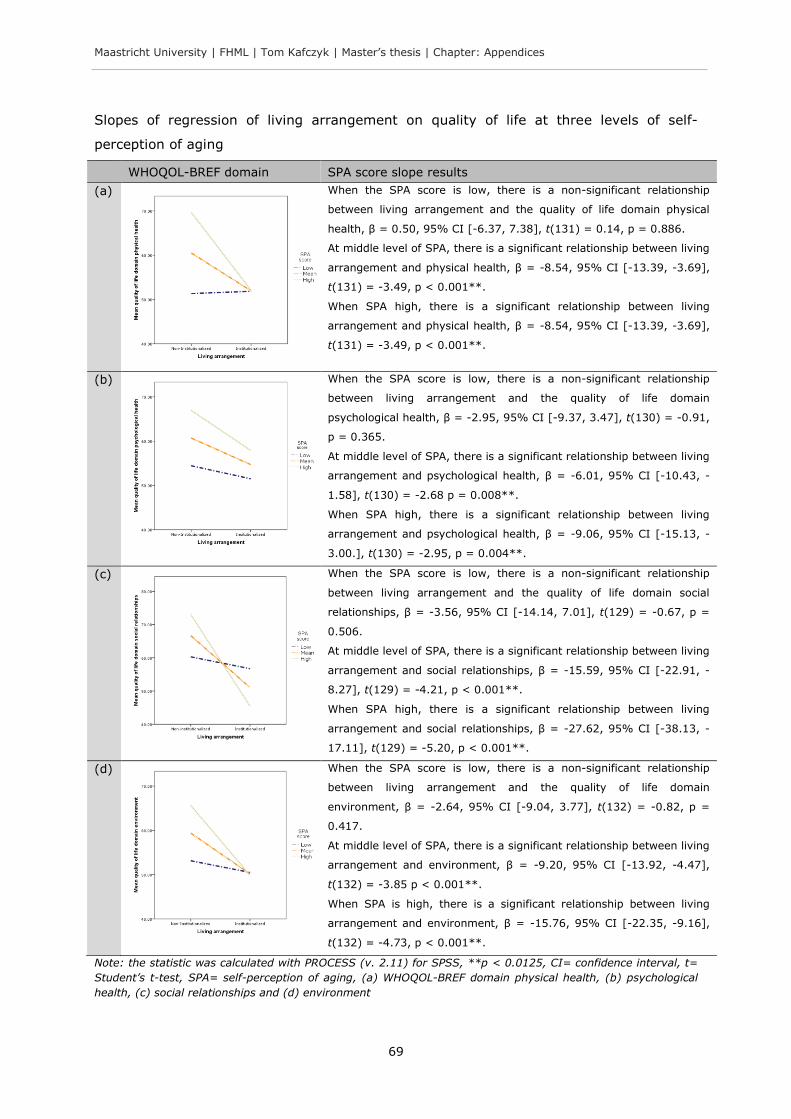
Maastricht University | FHML | Tom Kafczyk | Master’s thesis | Chapter: Appendices
69
Slopes of regression of living arrangement on quality of life at three levels of self-
perception of aging
WHOQOL-BREF domain SPA score slope results
(a)
When the SPA score is low, there is a non-significant relationship
between living arrangement and the quality of life domain physical
health, β = 0.50, 95% CI [-6.37, 7.38], t(131) = 0.14, p = 0.886.
At middle level of SPA, there is a significant relationship between living
arrangement and physical health, β = -8.54, 95% CI [-13.39, -3.69],
t(131) = -3.49, p < 0.001**.
When SPA high, there is a significant relationship between living
arrangement and physical health, β = -8.54, 95% CI [-13.39, -3.69],
t(131) = -3.49, p < 0.001**.
(b)
When the SPA score is low, there is a non-significant relationship
between living arrangement and the quality of life domain
psychological health, β = -2.95, 95% CI [-9.37, 3.47], t(130) = -0.91,
p = 0.365.
At middle level of SPA, there is a significant relationship between living
arrangement and psychological health, β = -6.01, 95% CI [-10.43, -
1.58], t(130) = -2.68 p = 0.008**.
When SPA high, there is a significant relationship between living
arrangement and psychological health, β = -9.06, 95% CI [-15.13, -
3.00.], t(130) = -2.95, p = 0.004**.
(c)
When the SPA score is low, there is a non-significant relationship
between living arrangement and the quality of life domain social
relationships, β = -3.56, 95% CI [-14.14, 7.01], t(129) = -0.67, p =
0.506.
At middle level of SPA, there is a significant relationship between living
arrangement and social relationships, β = -15.59, 95% CI [-22.91, -
8.27], t(129) = -4.21, p < 0.001**.
When SPA high, there is a significant relationship between living
arrangement and social relationships, β = -27.62, 95% CI [-38.13, -
17.11], t(129) = -5.20, p < 0.001**.
(d)
When the SPA score is low, there is a non-significant relationship
between living arrangement and the quality of life domain
environment, β = -2.64, 95% CI [-9.04, 3.77], t(132) = -0.82, p =
0.417.
At middle level of SPA, there is a significant relationship between living
arrangement and environment, β = -9.20, 95% CI [-13.92, -4.47],
t(132) = -3.85 p < 0.001**.
When SPA is high, there is a significant relationship between living
arrangement and environment, β = -15.76, 95% CI [-22.35, -9.16],
t(132) = -4.73, p < 0.001**.
Note: the statistic was calculated with PROCESS (v. 2.11) for SPSS, **p < 0.0125, CI= confidence interval, t=
Student’s t-test, SPA= self-perception of aging, (a) WHOQOL-BREF domain physical health, (b) psychological
health, (c) social relationships and (d) environment


