T e x t i l e M i l l s L i m i t e d
Quarterly Report
Condensed Interim Financial Information
For The 3rd
Quarter Ended March 31, 2019

Quarterly Report (1)
Company Information
BOARD OF DIRECTORS Mohomed Bashir - Chairman
Zain Bashir - Vice Chairman/ Executive Director
Mohammed Zaki Bashir - Chief Executive Officer
Ziad Bashir - Non Executive Director
S.M. Nadim Shafiqullah - Non Executive Director
Dr. Amjad Waheed - Independent Director
Ehsan A. Malik - Independent Director
CHIEF FINANCIAL OFFICER Abdul Aleem
COMPANY SECRETARY Salim Ghaffar
AUDIT COMMITTEE Dr. Amjad Waheed - Chairman & Member
Mohomed Bashir - Member
S.M. Nadim Shafiqullah - Member
Salim Ghaffar - Secretary
HUMAN RESOURCE AND Ehsan A. Malik - Chairman & Member
REMUNERATION Mohomed Bashir - Member
COMMITTEE Zain Bashir - Member
Salim Ghaffar - Secretary
BANKERS Allied Bank Limited Bank Al Habib Limited
Askari Bank Limited
Al Baraka Bank (Pakistan) Limited
Bank Alfalah Limited (Islamic)
Bankislami Pakistan Limited
The Bank Of Punjab
Dubai Islamic Bank Pakistan Limited
Faysal Bank Limited
Habib Bank Limited
Habib Metropolitan Bank Limited
MCB Bank Limited
MCB Islamic Bank Limited
Meezan Bank Limited
National Bank Of Pakistan
Samba Bank Limited
Silkbank Limited
Soneri Bank Limited
Standard Chartered Bank (Pakistan) Limited
United Bank Limited
The Bank of Khyber
AUDITORS Kreston Hyder Bhimji & Co. Chartered Accountants
INTERNAL AUDITORS Grant Thornton Anjum Rahman Chartered Accountants
LEGAL ADVISORS A.K. Brohi & Co Advocates
REGISTERED OFFICE Plot No.82, Main National Highway,
Landhi, Karachi-75120
SHARE REGISTRAR FAMCO Associates (Private) Limited 8-F, Next To Hotel Faran, Nursery, Block 6,
P.E.C.H.S., Shahrah-E-Faisal, Karachi.
Phone No. (+92-021) 34380101-5
Fax No. (+92-021) 34380106
MILLS Landhi Industrial Area, Karachi-75120
E-MAIL [email protected]
URL www.gulahmed.com
Quarterly Report (2)
DIRECTORS’ REVIEW REPORT TO THE SHAREHOLDERS
The Directors of your Company are pleased to present their review of the affairs of the Company
for the nine months ended March 31, 2019.
ECONOMIC OVERVIEW
Economic data revealed that stabilization and reform measures adopted in the recent past are
taking hold, although slower than expected. The current account deficit has narrowed to US$ 8.8
billion in Jul-Feb of fiscal year 2018-19 compared to a deficit of US$ 11.4 billion during the
same period last year registering a fall of 22.6 percent. Large-scale Manufacturing (LSM)
declined by 2.3 percent during Jul-Jan FY19 against 7.2 percent growth recorded in the same
period last year. Average headline CPI inflation reached 6.5 percent in Jul-Feb FY19 compared
to 3.8 percent recorded in the same period last year. The year on year inflation rose to of 8.2
percent in February 2019 which is the highest increase in inflation since June 2014. The
Government of Pakistan is expected to join an IMF Program in the near future. Such programs
can entail higher interest rates, a more flexible exchange rate and higher utility rates for gas and
power. The country will need more rigorous trade policies to boost its export led growth strategy.
Foreign direct investment and official inflows remained insufficient to finance the current
account deficit, with the gap being bridged through the country’s own resources. Country’s FX
reserves increased to USD 14.8 billion by end of January 2019 due to realization of bilateral
official flows (inflows from UAE and Saudi Arabia amounted to USD 3 billion and USD 1
billion respectively).
INDUSTRIAL OVERVIEW
The textile industry continues to demonstrate a downward trajectory as the industry growth saw a
decline of 0.3 percent in nine months of current fiscal year as compared to a growth of 0.7
percent in the same period last year. Textile industry total exports for nine months of FY 2018-
19 amounted to US$ 9,138 million as compared to US$ 8,865 million for the same period last
year, registering a growth of 3 percent. Knit wear and bed wear, cotton cloth and cotton yarn
registered growth of 8 percent, 4 percent and 2 percent respectively, while readymade garments
decreased by 0.2 percent.
The industry continues to benefit from the abolished 5 percent customs duty and a 5 percent sales
tax on imported cotton from February 2019 onwards, the latest evaluations on major crops are
portraying a dull performance by the agriculture sector and the overall industry performance is
uncertain. Nevertheless, the recent relief of Duty from China on imported Pakistani products, and
the Government export led strategies can prove to be a silver lining.
Quarterly Report (3)
FINANCIAL PERFORMANCE
Your company has continued to reap significant benefits by investments in most modern
technology, focusing on economically beneficial markets, products and customers, efficient
process management, cost rationalization efforts, change in PKR/US$ parity, strategic and timely
procurement of raw material while taking full advantage of available credit lines etc. The
combined results of all such measures has enabled the company to fully utilize its capabilities
and improve both the top and bottom line.
Key performance numbers are presented below:
Units Nine Months ended Nine Months ended
March 31, 2019 March 31, 2018
Export sales Rs. in millions 23,945 18,929
Local sales Rs. in millions 16,579 13,707
Total sales Rs. in millions 40,524 32,636
Gross profit Rs. in millions 9,476 6,795
Profit before tax Rs. in millions 2,980 1,433
Profit after tax Rs. in millions 2,697 1,255
Earnings per share (EPS) Rupees 7.57 3.52
Debt to equity ratio Times 0.60 0.54
Current ratio Times 1.15 1.12
Break-up-value per share Rupees 40.47 33.13
FUTURE OUTLOOK
The Government is striving to take steps in-order to implement an export led growth strategy. The recent
duty relief from China to Pakistan has laid new grounds for Pakistani export market to flourish and for
businesses to grab the opportunity. The impact of Government’s corrective measures will unfold in the
coming months, however, consistency of policies, specifically export related needs to be ensured. It is
critical that the trade and fiscal deficits are brought under control. The waiver of prior GIDC dues as well
as elimination of GIDC going forward, if approved, is still awaited by the textile industry. With backdrop
of IMF bailout, we are optimistic that the economy is on the correct track towards stabilization
considering the paradigm shift towards creating a conducive environment to encourage exports.
CONSOLIDATED FINANCIAL STATEMENTS
Consolidated financial statements for the nine months ended March 31, 2019 of the Company and its
subsidiaries Gul Ahmed International Limited (FZC) – UAE, GTM (Europe) Limited – UK, GTM USA
Corp. – USA and Sky Home Corp. – USA are annexed.

Quarterly Report (4)
ACKNOWELDGEMENT
We acknowledge and appreciate the efforts and valuable support of all stakeholders.
For and on behalf of the Board
April 30, 2019 Karachi
Mohomed Bashir Chairman
Mohammad Zaki Bashir Chief Executive Officer
Quarterly Report (5)
Condensed Interim Un-consolidated Statement of Financial Position As at March 31, 2019
Un-Audited Audited
March June
Note 2019 2018
EQUITY AND LIABILITIES
Rupees in '000
SHARE CAPITAL AND RESERVES Authorised share capital
7,500,000 7,500,000 750,000,000 ordinary shares of Rs.10 each
Issued, subscribed and paid-up capital 3,564,955 3,564,955 356,495,525 ordinary shares of Rs. 10 each
Reserves 10,861,825 9,055,772
14,426,780 12,620,727
NON-CURRENT LIABILITIES Long term financing - Secured 5 8,691,693 6,911,869
Deferred liabilities
Deferred taxation - net 10,593 23,692
Staff gratuity 69,720 63,165
80,313 86,857
CURRENT LIABILITIES Trade and other payables 9,721,807 7,008,948
Accrued mark-up/profit 254,442 175,633
Short term borrowings 19,871,888 15,076,081
Current maturity of long term financing 5 1,250,524 1,365,857
Unclaimed dividend 4,679 6,421
Unpaid dividend 19,975 11,052
31,123,315 23,643,992
CONTINGENCIES AND COMMITMENTS 7
54,322,101 43,263,445
ASSETS
NON-CURRENT ASSETS Property, plant and equipment 8 18,157,739 16,104,319
Intangible assets 9 48,220 23,985
Long term investment 58,450 58,450
Long term loans and advances 3,217 37,314
Long term deposits 290,755 202,959
18,558,381 16,427,027
CURRENT ASSETS Stores and spares 1,461,443 961,088
Stock-in-trade 23,102,893 16,143,933
Trade debts 5,712,782 5,398,565
Loans, advances and other receivables 1,773,365 1,197,376
Short term prepayments 118,823 239,661
Refunds due from Government 2,084,881 1,827,764
Taxation - net 866,787 597,781
Cash and bank balances 642,746 470,250
35,763,720 26,836,418
54,322,101 43,263,445
The annexed notes from 1 to 17 form an integral part of this condensed interim un-consolidated financial
information.
MOHOMED BASHIR
MOHAMMED ZAKI BASHIR
ABDUL ALEEM
Chairman Chief Executive Officer
Chief Financial Officer

Quarterly Report (6)
Condensed Interim Un-consolidated Statement of Profit or Loss For the nine months ended 31 March, 2019
Un-Audited Nine months ended Quarter ended
January to January to
Note July to March July to March March March
2019 2018 2019 2018
---------------------------- Rupees in '000----------------------------
Sales - net 40,523,718 32,636,135 13,774,009 11,710,692
Cost of sales 31,047,282 25,840,670 10,605,323 9,020,919
Gross profit 9,476,436 6,795,465 3,168,686 2,689,773
Distribution costs 3,462,493 2,884,263 1,244,903 987,877
Administrative costs 1,940,190 1,749,174 706,044 638,949
Other operating costs 234,514 122,709 51,702 66,391
5,637,197 4,756,146 2,002,649 1,693,217
3,839,239 2,039,319 1,166,037 996,556
Other income 125,517 74,406 76,116 (80,666)
Operating profit 3,964,756 2,113,725 1,242,153 915,890
Finance cost 984,845 680,946 393,114 223,605
Profit before taxation 2,979,911 1,432,779 849,039 692,285
Taxation
- Current 11 295,718 177,783 200,959 55,036
- Deferred (13,099) - 3,273 -
282,619 177,783 204,232 55,036
Profit after taxation 2,697,292 1,254,996 644,807 637,249
Earning per share - basic and diluted (Rs.) 7.57 3.52 1.81 1.79
The annexed notes from 1 to 17 form an integral part of this condensed interim un-consolidated financial information.
MOHOMED BASHIR MOHAMMED ZAKI BASHIR ABDUL ALEEM
Chairman Chief Executive Officer Chief Financial Officer

Quarterly Report (7)
Condensed Interim Un-consolidated Statement of Comprehensive Income For the nine months ended 31 March, 2019
Un-Audited Nine months ended Quarter ended
July to July to January to January to
Note March March March March
2019 2018 2019 2018
---------------------------- Rupees in '000----------------------------
Profit after taxation 2,697,292 1,254,996 2,046,015 637,249
Other comprehensive income - - - -
Total comprehensive income
2,697,292 1,254,996 2,046,015 637,249
The annexed notes from 1 to 17 form an integral part of this condensed interim un-consolidated financial information.
MOHOMED BASHIR
MOHAMMED ZAKI BASHIR
ABDUL ALEEM
Chairman Chief Executive Officer
Chief Financial Officer

Quarterly Report (8)
Condensed Interim Un-Consolidated Statement of Cash Flows For the nine months ended 31 March, 2019
Un-Audited
Nine months ended
July to
Note July to March March
2019 2018
CASH FLOWS FROM OPERATING ACTIVITIES -----------Rupees in '000-----------
Profit before taxation 2,979,911 1,432,779
Adjustments for: Depreciation 1,403,381 1,365,390
Amortisation 10,298 7,412
Provision for gratuity 27,614 34,722
Finance cost 984,845 689,197
Provision for slow moving/obsolete stores
22,476
spares and loose tools 17,052
Impairment allowance against doubtful trade debts 23,176 31,604
Loss on disposal of property, plant and equipment 37,544 15,778
Gain on disposal of property, plant and equipment (25,290) (66,189)
Cash flows from operating activities before adjustments of
2,484,044 2,094,966
5,463,955
working capital 3,527,745
Changes in working capital: Increase/(decrease) in current assets
Stores and spares (522,831) (29,409)
Stock-in-trade (6,958,960) (3,940,078)
Trade debts (337,393) (1,300,145)
Loans, advances and other receivables (575,989) (895,135)
Short term prepayments 120,838 (116,071)
Refunds due from Government (257,117) 134,231
Increase in current liabilities (8,531,452) (6,146,607)
2,712,859
Trade and other payables 2,585,086
Cash used in operations before adjustment of following
(5,818,593) (3,561,521)
(354,638) (33,776)
Adjustments for: Gratuity paid (21,059) (35,315)
Finance cost paid (906,036) (715,002)
Income tax paid or deducted (564,724) (283,595)
Decrease in Long term loans and Advances 34,097 1,241
Increase in Long term deposits (87,796) (1,598)
Net Cash used in Operating activities
(1,545,518) (1,034,269)
(1,900,156) (1,068,045)
CASH FLOWS FROM INVESTING ACTIVITIES
Addition to property, plant and equipment
(3,598,341) (895,172)
Addition to intangible assets (34,533) (240)
Proceeds from sale of property, plant and equipment 129,286 211,242
Net cash used in investing activities (3,503,588) (684,170)
Balance carried forward
(5,403,744) (1,752,215)
Quarterly Report (9)
Gul Ahmed Textile Mills Limited Condensed Interim Un-Consolidated Cash Flow Statement For the nine months ended 31 March, 2019
Un-Audited
Note
Nine months ended
July to March July to March
2019 2018
-----------Rupees in '000-----------
Balance brought forward (5,403,744) (1,752,215)
CASH FLOWS FROM FINANCING ACTIVITIES
Long term financing obtained
2,671,706 425,754
Long term financing repaid (1,007,215) (559,953)
Dividend paid (884,058) (353,084)
Net cash generated from financing activities 780,433 (487,283)
Net decrease in cash and cash equivalents (4,623,311) (2,239,498)
Cash and cash equivalents - at the beginning of the period (14,605,831) (11,665,461)
Cash and cash equivalents - at the end of the period 10
(19,229,142) (13,904,959)
The annexed notes from 1 to 17 form an integral part of this condensed interim un-consolidated financial
information.
MOHOMED BASHIR
MOHAMMED ZAKI BASHIR
ABDUL ALEEM
Chairman
Chief Executive Officer
Chief Financial Officer
Quarterly Report (10)
Condensed Interim Un-consolidated Statement of Changes in Equity For the nine months ended 31 March, 2019
Share Capital
Capital reserve - Revenue Reserve
Reserves
Total Share Premium General Unappropriated
Reserve Profit
------------------------------------ Rupees '000------------------------------------
Balance as at June 30, 2017 (Audited) 3,564,955 1,405,415 4,980,000 963,547 5,943,547 10,913,917
Transfer to general reserve - - 400,000 (400,000) - -
Transactions with owners Final dividend for the year ended June 30, - - - (356,496) (356,496) (356,496)
2017
Total Comprehensive income for the nine months ended March 31, 2018 (un-audited)
Profit after taxation - - - 1,254,996 1,254,996 1,254,996
Balance as at March 31, 2018 (Un-audited)
3,564,955 1,405,415 5,380,000 1,462,047 6,842,047 11,812,417
Total comprehensive income for the period January 01, 2018 to June 30, 2018
Profit after taxation
- - - 2,074,973 2,074,973 2,074,973
Other comprehensive loss - - - (11,667) (11,667) (11,667)
- - - 2,063,306 2,063,306 2,063,306
Balance as at 30 June, 2018 3,564,955 1,405,415 5,380,000 2,270,357 7,650,357 12,620,727
Transfer to unappropriated profit (5,380,000) 5,380,000 - -
Final dividend for the year ended June 30,2018 - - - (891,239) (891,239) (891,239)
Total Comprehensive income for the nine months ended March 31, 2019 (un-audited)
Profit after taxation - - - 2,697,292 2,697,292 2,697,292
Balance as at March 31, 2019 (Un-audited)
- -
3,564,955 1,405,415 - 9,456,410 9,456,410 14,426,780
The annexed notes from 1 to 17 form an integral part of this condensed interim un-consolidated financial information.
MOHOMED BASHIR MOHAMMED ZAKI BASHIR ABDUL ALEEM
Chairman Chief Executive Officer Chief Finance Officer

Quarterly Report (11)
Notes to the Condensed Interim Un-consolidated
Financial Information (Un-audited)
For the nine months ended 31 March, 2019
1 LEGAL STATUS AND ITS OPERATIONS
1.1 Gul Ahmed Textile Mills Limited (The Company) was incorporated on April 01, 1953 in Pakistan as a private limited company, subsequently
converted into public limited company on January 07, 1955 and is listed on Pakistan Stock Exchange Limited. The Company is a composite
textile mill and is engaged in the manufacture and sale of textile products.
Name
Chief
Address
Date of
Country of
Status
Executive
%of Holding
Incorporation Incorporation
officer
P.O.box 8705, Q4-
Gul Ahmed 29, Sharjah
Mr. Mohomed Airport
December 11,
Operational International International free U.A.E 100%
Bashir 2002
Limited FZC zone, Sharjah,
U.A.E.
City Wharf, New GTM (Europe)
Mr. Mohomed Bailey Street,
Limited - Indirect Manchester M3
April 17, 2003
U.K 100%
Operational Bashir 5ER, United
subsidiary
Kingdom
GTM USA - Mr. Mohomed 515, 7 West 34th Street, New York,
March 19, 2012
U.S.A 100%
Operational Indirect subsidiary Bashir USA
Street No. 328,
Sky Home- Mr. Mohomed South King
Charles Road,
Operational Indirect February 28, 2017
U.S.A 100%
Bashir City Raleigh,
Subsidiary
State North Carolina
All four subsidiaries are engaged in distribution/trading of textile related products.
1.2 Geographical locations and addresses of all lands owned by the Company are as follows;
Unit Area Address
Unit 1,2 & 3 25.07 Acres Plot No. HT-4, Landhi Industrial Area, Landhi Karachi
Unit 4 & 5 14.9 Acres Survey No.82, Deh Landhi ,Karachi
Unit 6,7 & 8 18.56 Acres Plot No. H-7, Landhi Industrial Area, Landhi, Karachi
Lasani warehouse 4.17 Acres Plot No. H-19, Landhi Industrial Area, Landhi, Karachi
MTF Plot 44.04 acres P.U. No. 48, 49, 50, & 51, Near Machine Tool Factory
Deh Khanto Tapo Landhi, Karachi
Plot 2 Kanal,19 Plot No. 24-A, C-III, Gulberg Lahore
Marlas and
153.5 Sq. Feet
1.3 Geographical locations and addresses of all factory building and warehouses on rented premises are as follows;
Unit
Highway stitching complex Yarn Dyeing and Knitting unit Stitching unit Hussaini stitching unit Apparel division
Address Plot# 369, Main National Highway, Landhi, Karachi Plot# HT/3A,KDA Scheme 3, Landhi Industrial area, Karachi Plot# ST-17/1 and ST-17/3, Federal 'B' Area, Azizabad, Karachi Plot# HT/8,KDA Scheme 3, Landhi Industrial area, Karachi Plot# 12, Sector 23, Korangi Industrial area, Karachi
1.4 As at March 31, 2019, the Company has 115 outlets.
2 BASIS OF PREPARATION
These condensed interim unconsolidated financial statements have been prepared in accordance with the accounting and reporting standards as
applicable in Pakistan for interim financial reporting. The accounting and reporting standards as applicable in Pakistan for interim financial reporting
comprise of: - International Accounting Standard (IAS) 34, Interim Financial Reporting, issued by International Accounting Standard Board (IASB) as notified under the
Companies Act, 2017; and - Provisions of and directives issued under the Companies Act, 2017.
This condensed interim un-consolidated financial information comprise of the condensed interim un-consolidated statement of financial position as at
March 31, 2019 and the condensed interim un-consolidated statement of profit or loss, condensed interim un-consolidated statement of comprehensive
income, condensed interim un-consolidated statement of cash flows and condensed interim un-consolidated statement of changes in equity for the nine
months ended March 31, 2019.
The comparative statement of financial position, presented in this condensed interim un-consolidated financial Information, as at June 30, 2018 has been
extracted from the audited un-consolidated financial statements of the Company for the year ended June 30, 2018, whereas the comparative condensed
interim un-consolidated statement of profit or loss, condensed interim un-consolidated statement of comprehensive income, condensed interim un-
consolidated statement of cash flows and condensed interim un-consolidated statement of changes in equity for the half year ended March 31, 2019 have
been extracted from the condensed interim un-consolidated financial information of the Company for the nine months ended March 31, 2018.
The Company’s registered office is situated at Plot No. 82, Main National Highway, Landhi, Karachi.
The Company is a subsidiary of Gul Ahmed Holdings (Private) Limited.
The Company has the following subsidiaries:
Details of Subsidiaries

Quarterly Report (12)
This condensed interim unconsolidated financial information do not include all the information required in annual financial statements prepared in
accordance with approved accounting standards as applicable in Pakistan, and should be read in conjunction with the un-consolidated financial
statements for the year ended June 30, 2018.
2.1 Change in accounting standards, interpretations and amendments to published approved accounting and reporting standards
New standards, amendments and interpretation to published approved accounting and reporting standards which are effective during the nine
(a) months ended March 31, 2019
There are certain amendments and an interpretation to approved accounting and reporting standards which are mandatory for the Company's annual
accounting period beginning on July 1, 2018; however, these do not have any significant impact on these unconsolidated condensed interim financial
statements hence not detailed. Further following new standards have become effective during the period due to which certain changes in accounting
policies have been made;
IFRS 15 'Revenue from contracts with customers' -
IFRS 15 'Revenue from Contracts with customers' applies to all revenue arising from contracts with customers, unless those contracts are not in the scope
of other standards and it has superseded IAS 11 “Construction Contracts”, IAS 18 “Revenue” and related interpretations. The new standard establishes a
five-step model to account for revenue arising from contracts with customers based on the principle that an entity should recognize revenue representing
the transfer of promised goods or services to customers at an amount that reflects the consideration to which the entity expects to be entitled in exchange
for those goods or services. The standard requires entities to exercise judgement, taking into consideration all of the relevant facts and circumstances
when applying each step of the model to contracts with their customers.
The Company has concluded that this standard do have significant impact on these condensed interim financial statements as it is already in compliance
with the significant provisions of this standard.
b) New standards and amendments to published approved accounting and reporting standards that are not yet effective
There are new standards, certain amendments and interpretation to the approved accounting and reporting standards that will be mandatory for the
Company's annual accounting periods beginning on or after July 1, 2019. However, these will not have any material impact except IFRS-16 "Leases"
whose impact is being assessed.
Further the Securities and Exchange Commission of Pakistan through its notification SRO 229 dated Feburaray 14, 2019 and its press release dated
February 15, 2019 has also defferred the applicability of the standards for the periods ending on or after June 30, 2019. The impact of the provisions of
this standard including estimation of expected credit losses is being assessed.
3 ACCOUNTING POLICIES
Same accounting policies and methods of computation are adopted for the preparation of these condensed interim un-consolidated financial statements
as those applied in the preparation of un-consolidated financial statements for the year ended June 30, 2018 except for changes due to IFRS 9 and IFRS
15 as detailed above in note 2.1 which do not have significant impact on these condensed interim unconsolidated financial statements.
4 ACCOUNTING ESTIMATES, JUDGEMENTS AND FINANCIAL RISK MANAGEMENT
The preparation of these condensed interim un-consolidated financial statements requires management to make estimates, assumptions and use
judgments that affect the application of policies and reported amounts of assets and liabilities and income and expenses. Estimates, assumptions and
judgments are continually evaluated and are based on historical experience and other factors, including reasonable expectations of future events.
Revisions to accounting estimates are recognised prospectively commencing from the period of revision. Judgments and estimates made by the
management in the preparation of these condensed interim financial statements are the same as those that were applied to financial statements as at and
for the year ended June 30, 2018.
The Company's financial risk objectives and policies are consistent with those disclosed in the annual audited financial statements as at and for the year
ended June 30, 2018.
5 LONG TERM FINANCING - SECURED
Un-Audited Audited
March June
2019 2018
Rupees in '000
Opening balance 8,277,726 7,824,892
Add: Obtained during the period / year 2,671,706 1,270,701
Less: Repaid during the period / year (1,007,215) (817,867)
9,942,217 8,277,726
Less: Current portion shown under current liabilities (1,250,524) (1,365,857)
8,691,693 6,911,869

Quarterly Report (13)
6 TRADE AND OTHER PAYABLES
Trade and other payables include provision in respect of;
a) Increase in gas tariff rates notified vide SRO No. (I) / 2015 dated 31 August, 2015, and Oil and Gas Regulatory Authority (OGRA) notification dated 30 December, 2016 was challenged in Honorable Sindh Hight Court by the Company, as was disclosed in note no. 10.1.2 of the financial statements for the year ended June 30, 2018. The Oil and Gas Regulatory Authority (OGRA) issued another notification dated October 04, 2018, revising the tariff effective from September 27, 2018, subsequent to this notification the Company paid the bills accordingly, hence after this notification no subsequent provision has been made; However, upto the September 2018 the Company has provided banker's verified various Cheques of Rs. 250.675 million (June-2018: 217.356 million) as security to Nazir of High Court Sindh and also, as a matter of prudence, maintained full provision up to the September 2018 amounting to Rs. 410.601 million (June-2018: 377.283 million) in the unconsolidated financial statements.
b) The Company as mentioned in note 10.1.3 of the financial statements for the year ended June 30, 2018 had filed a suit in the Honorable Sindh High Court challenging the charging of captive power tariff instead of industry tariff. The OGRA has issued another notification dated October 04, 2018 revising the tariff effective September 27, 2018, subsequent to this notification the Company paid the bills accordingly, hence after this notification no subsequent provision has been made; However, upto the September 2018 the Company has provided banker's verified various cheques of Rs. 388.570 million (June-2018: Rs. 332.397 million) as security to Nazir of High Court of Sindh and also, as a matter of prudence, maintained full provision up to September, 2018 amounting to Rs. 626.230 million (June-2018: Rs. 570.057 million) in the unconsolidated financial statements.
7 CONTINGENCIES AND COMMITMENTS
Contingencies
The status of contingencies, as reported in the annual financial statements for the year ended June 30, 2018 remained unchanged during the current
period except following;
a) In the matter of Gas Infrastructure Development Cess (GIDC), wherein there is no change in its status as disclosed in note 14.4 of the financial statements for the year ended June 30, 2018 except that the amount of provision of Rs. 2,174 million (June-2018: Rs.1,725 million) commencing from May 22, 2015 to the balance sheet date.
Guarantees
(a) Guarantees of Rs. 1,106 million (June-2018: Rs. 839 million) has been issued by banks on behalf of the company which are secured by pari passu
hypothecation charge over stores and spares, stock-in-trade, trade debts and other receivables. These guarantees includes guarantees issued by
related party amounting to Rs. 892 million (June 2018: Rs. 771 million).
(b) Post dated cheques of Rs. 3,493 million (June-2018: Rs. 3,440 million) are issued to Custom Authorities in respect of duties on imported items
availed on the basis of consumption and export plans.
(c) Bills discounted Rs. 4,326 million (June-2018: Rs. 1,292 million).
(d) Corporate guarantee of Rs 124.947 million (June 2018: Rs. 110.450 million) has been issued to a bank in favor of indirect subsidiary company -
GTM (Europe) Limited - UK. This has been issued in accordance with the requirement of Companies Act, 2017.
Commitments
(a) The Company is committed for capital expenditure as at March 31, 2019 of Rs. 739 million (June 2018: Rs. 1,234 million).
(b) The Company is committed to minimum rental payments for Retail outlets for each of the following period as follows:
Un-Audited Audited
March June
2019 2018
Rupees in '000
Not more than one year 819,353 800,204
More than one year but not more than five years 2,806,231 2,276,407
More than five years 625,238 815,837
4,250,822 3,892,448
Quarterly Report (14)
8 PROPERTY, PLANT AND EQUIPMENT
Operating fixed assets 8.1 & 8.2 15,429,523 14,908,714
Capital work in progress (CWIP) 8.4 2,728,216 1,195,605
18,157,739 16,104,319
Un-Audited March March
8.1 Additions during the period 2019 2018
Rupees in '000
Buildings and structures on leasehold land 201,122 725,085
Plant and machinery 1,712,654 2,331,987
Furniture and fixtures 4,240 2,750
Office equipment 105,746 28,465
Vehicles 41,969 52,600
2,065,731 3,140,887
8.1.1 Additions to building and structure on leasehold land , plant and machinery and office equipment include transfers from capital work-in-progress
amounting to Rs. 161.06 million (March 2018: Rs. 605 million) , Rs. 1,496 million (March 2018: Rs. 2,074 million) and 60.45 million ( March 2018:
Rs. 40k) respectively.
Un-Audited
March March
2019 2018
Rupees in '000
8.2 Disposals - operating fixed assets (at net book value)
Rupees in '000
Plant and machinery 83,157 63,179
Vehicles 58,383 97,652
141,540 160,831
8.2.1 Disposals include assets scrapped at Net book value during the period of Rs. Nil (March 2018: Rs. 0.22 million).
8.3 Depreciation charge during the period 1,403,381 1,365,390
Un-Audited March March
2019 2018
Rupees in '000
8.4 Additions - capital work in progress (at cost)
Machinery 2,660,950 402,108
Building 529,335 238,565
Others 60,452 -
3,250,737 640,673
9 INTANGIBLE ASSETS
Note Un-Audited Audited
March June
2019 2018
Rupees in '000
Intangible - net book value 9.1&9.2 48,220 23,985
Un-Audited March March
2019 2018
9.1 Additions - intangibles (at cost) Rupees in '000
34,533
Computer Software 240
9.2 Amortization charge during the period 10,298 7,412
10 CASH AND CASH EQUIVALENTS 2017 2016
Cash and cash equivalents comprises of: Cash and bank balances 642,746 497,768
Short term borrowings (19,871,888) (14,402,727)
(19,229,142) (13,904,959)
11 TAXATION Provision for current taxation has been made on the basis of normal tax liability, final taxation, tax credit and
separate block income under the Income Tax Ordinance, 2001.

Quarterly Report (15)
12 SEGMENT INFORMATION
The Company's Operations have been divided in four segments based on the nature of process and internal reporting. Following are the four reportable business segments:
a) Spinning : b) Weaving: c) Retail and
Distribution:
d) Processing, Home
Textile and Apparel
Production of different qualities of yarn using both natural and artificial fibers. Weaving is a method of fabric production in which two distinct sets of yarns or threads are interlaced at right angles to form a fabric. On the retail front, Ideas by Gul Ahmed offers fabrics and made-ups, ranging from home accessories to clothing.
Processing of greige fabrics into various types of finished fabrics for sale as well as to manufacture and sale of madeups and home textile products.
Transactions among the business segments are recorded at cost.
12.1 Segment Profitability
Spinning
Weaving
Retail and Distribution
Processing, Home Textile Elimination Of Inter Total
and Apparel
Segment Transactions
March-2019 March-2018 March-2019 March-2018 March-2019 March-2018 March-2019 March-2018 March-2019 March-2018 March-2019 March-2018
------------------------------------------------ Rs. 000s------------------------------------------------
Sales 7,420,559 5,617,969 1,216,841 1,332,613 14,105,442 10,947,041 27,617,699 23,811,047 (9,836,823) (9,072,535) 40,523,718 32,636,135 Cost of sales 6,181,002 4,816,341 1,283,996 1,214,213 9,502,221 7,479,803 23,916,886 21,402,848 (9,836,823) (9,072,535) 31,047,282 25,840,670
Gross profit 1,239,557 801,628 (67,155) 118,400 4,603,221 3,467,238 3,700,813 2,408,199 - - 9,476,436 6,795,465
Distribution cost and Administrative
cost 106,659 109,961 48,650 51,133 3,422,391 2,965,219 1,824,983 1,507,124 - - 5,402,683 4,633,437
Profit/(Loss) before tax and before
charging following 1,132,898 691,667 (115,805) 67,267 1,180,830 502,019 1,875,830 901,075 - - 4,073,753 2,162,028
Finance Cost
984,845 680,946
Other operating cost 234,514 122,709 Other income (125,517) (74,406)
Profit before taxation
1,093,842 729,249
2,979,911 1,432,779 Taxation 282,619 177,783
Profit after taxation 2,697,292 1,254,996
Depreciation and Amortisation Expense 386,776 378,708 238,942 222,009 240,033 176,389 547,928 595,696 - - 1,413,679 1,372,802
12.2 Segment assets and liabilities
Spinning
Weaving
Retail and Distribution
Processing, Home Textile Unallocated
Total and Apparel
Un-Audited Audited Un-Audited Audited Un-Audited Audited Un-Audited Audited Un-Audited Audited Un-Audited Audited
March-2019 June - 2018 March-2019 June - 2018 March-2019 June - 2018 March-2019 June - 2018 March-2019 June - 2018 March-2019 June - 2018
------------------------------------------------ Rs. 000s------------------------------------------------
Assets 12,588,863 11,021,310 3,384,140 3,357,067 10,813,660 5,396,751 24,856,206 22,155,720 2,679,232 1,332,597 54,322,101 43,263,445
Liabilities 4,437,964 3,802,668 2,126,916 1,895,092 2,060,909 905,830 12,205,529 7,524,144 19,064,003 16,514,984 39,895,321 30,642,718
Segment Capital & Intangible Expenditure 445,131 830,051 835,216 1,844,453 202,147 217,508 275,520 143,483 342,249 297,537 2,100,264 3,333,032
12.3 The Company has implemented Microsoft Dynamics 365 for Retail & Distribution, which has now enabled the Company to disclose the figures separately for the segment.
12.4 Unallocated items represent those assets and liabilities which are common to all segments and these include investment in subsidiary, long term deposits, other receivables,
deferred liabilities, certain common borrowing and other corporate assets and liabilities.
12.5 Based on judgement made by management, Processing, Home Textile and Apparel segments have been aggregated into single operating segment as the segments have similar
economic characteristics in respect of nature of the products, nature of production process, type of customers, method of distribution and nature of regularity environment.
12.6 Information about major customer
Revenue from major customer whose revenue exceeds 10% of gross sales is Rs.7,696 million (March-2018: Rs. 7,474 million).

Quarterly Report (16)
12.7 Information by geographical area
Revenue Non-current assets
Mar-19 Mar-18 Mar-19 Jun-18
-------------------Rupees in '000-------------------
Pakistan 18,243,054 14,216,737 18,499,931 16,368,577
Germany 7,435,156 4,980,158 - -
United States 2,881,182 2,740,670 - -
France 1,793,736 1,209,397 - -
Netherlands 2,109,154 1,656,399 - -
United Kingdom 1,319,005 1,466,359 - -
Italy 1,830,408 1,741,697 - -
Spain 465,265 1,053,161 - -
China 672,969 701,047 - -
Sweden 685,103 573,301 - -
United Arab Emirates 14,786 139,581 58,450 58,450
Other Countries 3,073,900 2,157,628
40,523,718 32,636,135 18,558,381 16,427,027
13 TRANSACTIONS AND BALANCES WITH RELATED PARTIES
The related parties comprise subsidiaries, associated companies, companies where directors also hold
directorship, directors of the company and key management personnel. The Company in the normal course
of business carried out transaction with various related parties.
Relationship with Nature of transactions Un-Audited
Mar-19 Mar-18
the Company Rupees in '000
Parent Company Dividend paid 598,067 239,227
Subsidiaries and Sale of goods 1,563,899 928,321
indirect subsidiaries Commission paid 303,289 141,978
Associated Companies Purchase of goods 11,410 30,075
and other related parties Sale of goods 1,458 72
Rent paid 57,816 60,003
Fees paid 2,500 2,040
Donation paid 917 -
Bills discounted 7,439,447 6,583,960
Commission / Bank charges paid 70,538 49,321
Mark up / Interest charged 43,483 6,432
Provident fund contribution 130,974 116,775
Dividend paid 26,979 10,896
Service Rendered 40,852 -
Relationship with Nature of outstanding balances
Un-Audited Audited
Mar-19 Jun-18
the Company Rupees in '000
Subsidiaries and Trade and other payables 36,317 37,943
indirect subsidiaries Long term investment 58,450 58,450
Trade debts 1,202,214 390,603
Other receivables - 22,526
Corporate guarantee issued in favour
of subsidiary company 124,947 110,450
Advance from Customer - -
Associated companies Borrowings from Banks 983,027 964,494
and others related parties Trade and other payables - Creditors 8,095 15,731
Payable to employee's provident fund 20,026 21,025
Bank guarantee 892,459 770,804
Accrued mark-up 43,482 8,785
Accrued rent 1,950 -
Loans to key management personnel
& executive 93,984 54,594
Trade debts 2,116 -
Deposit with banks 3,012 115,270
Prepaid rent 31,231 42,588
There are no transactions with directors of the Company and key management personnel other than under
the terms of employment for the period ending March 31, 2019 amounting to Rs. 733 million (March 31,
2018: Rs. 632 million) on account of remuneration.
Quarterly Report (17)
14 FAIR VALUES
Fair value is the price that would be received to sell an asset or paid to transfer a liability in an orderly
transaction in the principal (or most advantageous) market at the measurement date under current market
conditions (i.e. an exit price) regardless of whether that price is directly observable or estimated using
another valuation technique.
The Company while assessing fair values uses valuation techniques that are appropriate in the circumstances using
relevant observable data as far as possible and minimizing the use of unobservable inputs. Fair values are
categorized into following three levels based on the input used in the valuation techniques;
- Level 1 Quoted prices in active markets for identical assets or liabilities that can be assessed at
measurement.
- Level 2 Inputs other than quoted prices included within level 1 that are observable for the asset or liability,
either directly (that is, as prices) or indirectly (that is, derived from prices).
- Level 3 Inputs are unobservable inputs for the asset or liability Inputs for the asset or liability that are not
based on observable market data (that is, unobservable inputs).
Financial assets and liabilities of the Company are either short term in nature or are repriced periodically
therefore; their carrying amounts approximate their fair values.
15 DATE OF AUTHORISATION
These financial statements were authorised for issue on April 30, 2019 by the Board of Directors of the
Company.
16 GENERAL
16.1 Allocations for the workers' profit participation fund, workers' welfare fund and taxation are provisional and
final liability including liability for deferred taxation will be determined on the basis of annual results.
16.2 Figures have been rounded off to the nearest thousand rupees.
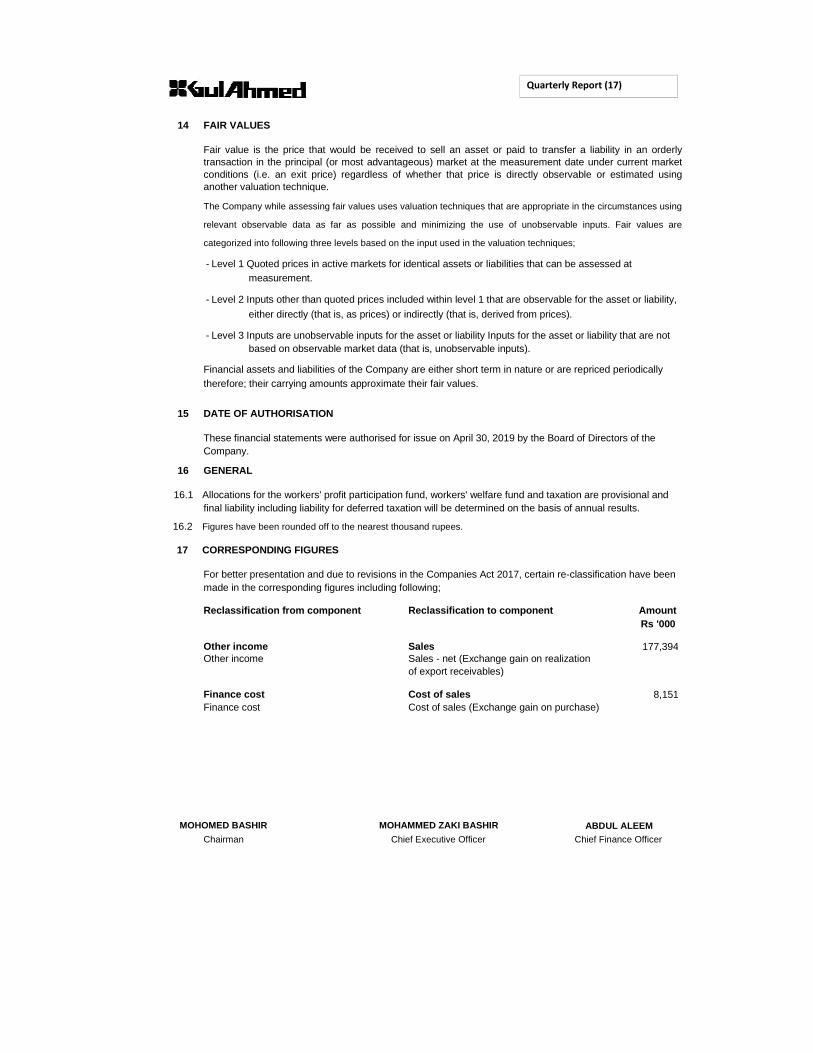
17 CORRESPONDING FIGURES
For better presentation and due to revisions in the Companies Act 2017, certain re-classification have been
made in the corresponding figures including following;
Reclassification from component Reclassification to component Amount
Rs '000
Other income Sales 177,394
Other income Sales - net (Exchange gain on realization
of export receivables)
Finance cost Cost of sales 8,151
Finance cost Cost of sales (Exchange gain on purchase)
MOHOMED BASHIR
MOHAMMED ZAKI BASHIR
ABDUL ALEEM
Chairman Chief Executive Officer
Chief Finance Officer
T e x t i l e M i l l s L i m i t e d
Consolidated Accounts
Consolidated Condensed Interim Financial Information
For The 3rd
Quarter Ended March 31, 2019
Quarterly Report (18)
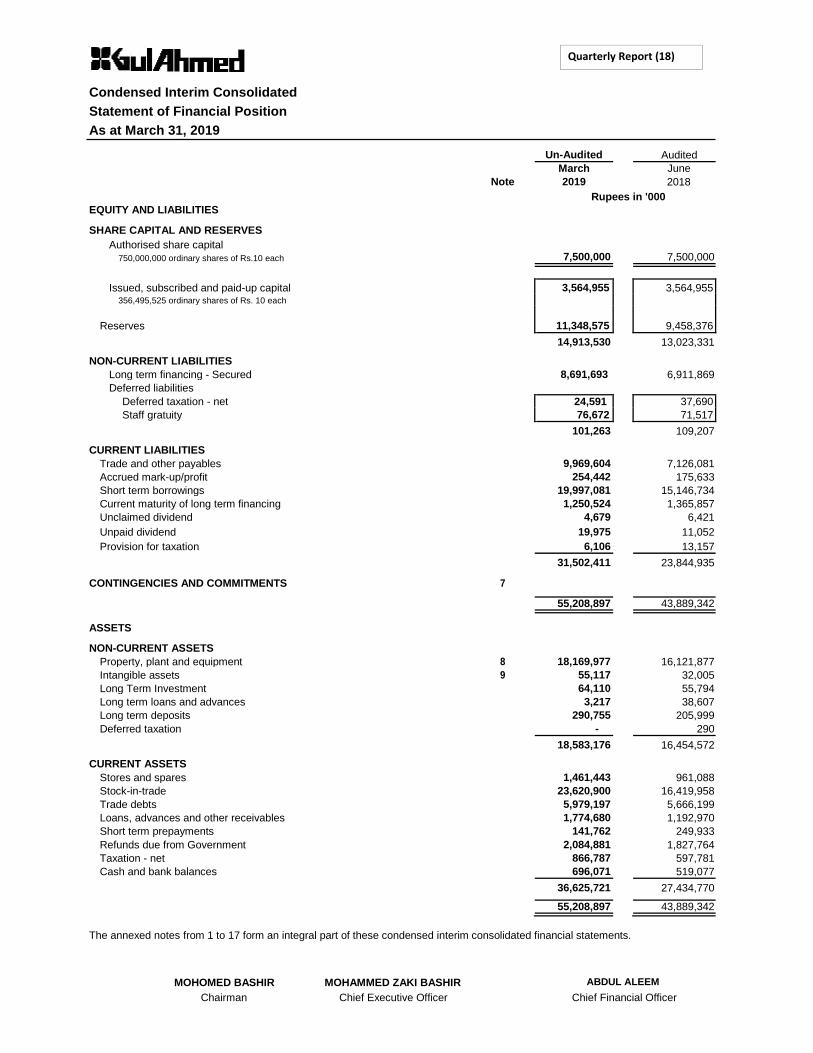
Condensed Interim Consolidated Statement of Financial Position As at March 31, 2019 Un-Audited Audited
March June
Note 2019 2018
EQUITY AND LIABILITIES
Rupees in '000
SHARE CAPITAL AND RESERVES Authorised share capital
7,500,000 7,500,000 750,000,000 ordinary shares of Rs.10 each
Issued, subscribed and paid-up capital
3,564,955 3,564,955 356,495,525 ordinary shares of Rs. 10 each
Reserves 11,348,575 9,458,376
14,913,530 13,023,331
NON-CURRENT LIABILITIES Long term financing - Secured 8,691,693 6,911,869
Deferred liabilities
Deferred taxation - net 24,591 37,690
Staff gratuity 76,672 71,517
101,263 109,207
CURRENT LIABILITIES Trade and other payables 9,969,604 7,126,081
Accrued mark-up/profit 254,442 175,633
Short term borrowings 19,997,081 15,146,734
Current maturity of long term financing 1,250,524 1,365,857
Unclaimed dividend 4,679 6,421
Unpaid dividend 19,975 11,052
Provision for taxation 6,106 13,157
31,502,411 23,844,935
CONTINGENCIES AND COMMITMENTS 7
55,208,897 43,889,342
ASSETS
NON-CURRENT ASSETS Property, plant and equipment 8 18,169,977 16,121,877
Intangible assets 9 55,117 32,005
Long Term Investment 64,110 55,794
Long term loans and advances 3,217 38,607
Long term deposits 290,755 205,999
Deferred taxation - 290
18,583,176 16,454,572
CURRENT ASSETS Stores and spares 1,461,443 961,088
Stock-in-trade 23,620,900 16,419,958
Trade debts 5,979,197 5,666,199
Loans, advances and other receivables 1,774,680 1,192,970
Short term prepayments 141,762 249,933
Refunds due from Government 2,084,881 1,827,764
Taxation - net 866,787 597,781
Cash and bank balances 696,071 519,077
36,625,721 27,434,770
55,208,897 43,889,342
The annexed notes from 1 to 17 form an integral part of these condensed interim consolidated financial statements.
MOHOMED BASHIR
MOHAMMED ZAKI BASHIR
ABDUL ALEEM
Chairman Chief Executive Officer
Chief Financial Officer

Quarterly Report (19)
Condensed Interim Consolidated Statement of Profit or Loss For The Nine Months Ended March 31, 2019
Note
Sales - net
Cost of sales Gross profit
Distribution cost Administrative cost Other operating cost
Other income
Operating profit
Finance cost
Profit before taxation
Taxation - Current 11 - Deferred
Profit after taxation
Un-Audited
Nine Months Ended Quarter Ended
July to July to January to January to
March March March March 2019 2018 2019 2018
----------------Rupees in '000----------------
41,952,086 33,400,924 14,124,829 11,823,713
31,880,772 26,279,470 10,793,086 9,106,367
10,071,314 7,121,454 3,331,743 2,717,346
3,587,937 2,889,540 1,285,428 1,218,310 2,303,699 2,006,830 816,265 544,750
234,514 122,709 51,702 66,391
6,126,150 5,019,079 2,153,395 1,829,451
3,945,164 2,102,375 1,178,348 887,895
125,953 82,794 76,268 96,865
4,071,117 2,185,169 1,254,616 984,760
995,403 691,999 395,539 232,797
3,075,714 1,493,170 859,077 751,963
296,379 177,781 200,951 55,036 (13,099) - 3,273 -
283,280 177,781 204,224 55,036
2,792,434 1,315,389 654,853 696,927
Earning per share - basic and diluted (Rs.) 7.83 3.69 1.84 1.95
The annexed notes from 1 to 17 form an integral part of these condensed interim consolidated financial statements.
MOHOMED BASHIR MOHAMMED ZAKI BASHIR ABDUL ALEEM
Chairman Chief Executive Officer Chief Financial Officer

Quarterly Report (20)
Condensed Interim Consolidated Statement of Comprehensive Income For The Nine Months Ended March 31, 2019
Un-Audited
Half Year Ended Quarter Ended
July to July to January to January to
March March March March
2019 2018 2019 2018
----------------Rupees in '000----------------
Profit after taxation 2,792,434 1,315,389 654,853 696,927
Other comprehensive income for the period
Items that will be reclassified to profit and loss account subsequently
Exchange difference on translation of foreign subsidiaries (10,996) 39,956 1,009 19,745
Total comprehensive income 2,781,438 1,355,345 655,862 716,672
The annexed notes from 1 to 17 form an integral part of these condensed interim consolidated financial statements.
MOHOMED BASHIR
MOHAMMED ZAKI BASHIR
ABDUL ALEEM
Chairman Chief Executive Officer
Chief Financial Officer

Quarterly Report (21)
Condensed Interim Consolidated Statement of Cash Flows For The Nine Months Ended March 31, 2019
Un-Audited
Half Year Ended
July to July to
Note March March
CASH FLOWS FROM OPERATING ACTIVITIES
2019 2018
-----------Rupees in '000-----------
Profit before taxation 3,075,714 1,493,170
Adjustments for: Depreciation 1,405,632 1,368,810
Amortisation 11,901 8,476
Provision for gratuity 28,387 36,702
Finance cost 995,403 691,999
Provision for slow moving/obsolete stores
spares and loose tools 22,476 17,052
Impairment allowance against doubtful trade debts 23,176 31,604
Gain on disposal of property, plant and equipment (25,290) (50,548)
Loss on disposal of property, plant and equipment 37,544 -
2,499,229 2,104,095
Cash flows from operating activities before adjustments of working capital 5,574,943 3,597,265
Changes in working capital: Increase in current assets
Stores and spares (522,831) (29,409)
Stock-in-trade (7,200,942) (3,982,152)
Trade debts (336,174) (1,200,227)
Loans, advances and other receivables (581,710) (910,257)
Short term prepayments 108,171 (123,792)
Refunds due from Government (257,117) 134,231
Increase in current liabilities (8,790,603) (6,111,606)
Trade and other payables 2,843,525 2,481,555
Cash used in operations before adjustment of following
(5,947,078) (3,630,051)
(372,135) (32,786)
Adjustment for: Gratuity paid (23,232) (36,795)
Finance cost paid (916,594) (717,804)
Income tax paid or deducted (572,146) (283,898)
Increase in long term loans and advances 35,390 1,241
(Increase)/ decrease in long term deposits (84,756) 1,022
Net cash used in operating activities
(1,561,338) (1,036,234)
(1,933,473) (1,069,020)
CASH FLOWS FROM INVESTING ACTIVITIES -
Addition to property, plant and equipment (3,598,341) (895,159)
Addition to intangible assets (35,014) (299)
Proceeds from sale of property, plant and equipment 132,354 211,242
Long term Investment (8,316) -
Net cash used in investing activities (3,509,317) (684,216)
Balance carried forward
(5,442,790) (1,753,236)

Quarterly Report (22)
Condensed Interim Consolidated Statement of Cash Flows For The Nine Months Ended March 31, 2019
Un-Audited
Half Year Ended
July to July to
Note March March
2019 2018
-----------Rupees in '000-----------
Balance brought forward (5,442,790) (1,753,236)
CASH FLOWS FROM FINANCING ACTIVITIES
Long term financing obtained 2,671,706 425,754
Long term financing repaid (1,007,215) (559,953)
Dividend paid (884,058) (353,084)
Net cash used in financing activities 780,433 (487,283)
Exchange difference on translation of foreign subsidiaries (10,996) 39,956
Net decrease in cash and cash equivalents (4,673,353) (2,200,563)
Cash and cash equivalents - at the beginning of the period (14,627,657) (11,648,168)
Cash and cash equivalents - at the end of the period 10
(19,301,010) (13,848,731)
The annexed notes from 1 to 17 form an integral part of these condensed interim consolidated financial
statements.
MOHOMED BASHIR
MOHAMMED ZAKI BASHIR
ABDUL ALEEM
Chairman Chief Executive Officer
Chief Financial Officer

Quarterly Report (23)
Condensed Interim Consolidated Statement of Changes in Equity For The Nine Months Ended March 31, 2019 Reserves
Revenue reserve
Capital Exchange Statutory Share capital reserve -
General difference on reserve
Unappropriated Subtotal Total
Share translation of created by Reserves
Reserve profit
Premium foreign foreign
subsidiaries subsidiary
-------------------------------------------------- Rupees '000--------------------------------------------------
Balance as at June 30, 2017 (Audited) 3,564,955 1,405,415 4,980,000 123,550 18,060 1,103,678 7,630,703 11,195,658
Transfer to General reserve - - 400,000 - - (400,000) - -
Statutory reserve - - - - 1,588 (1,588) - -
- - 400,000 - 1,588 (401,588) - -
Transactions with owners
Final dividend for the year ended June 30, (356,496) (356,496) (356,496)
2017
Total comprehensive income for the nine months ended March 31, 2018 (un-audited)
Profit after taxation - - - - - 1,315,389 1,315,389 1,315,389
Other comprehensive income - - - 39,956 - - 39,956 39,956
- - - 39,956 - 1,315,389 1,355,345 1,355,345
Balance as at March 31, 2018 (Un-Audited) 3,564,955 1,405,415 5,380,000 163,506 19,648 1,660,983 8,629,552 12,194,507
Total comprehensive income for the period January 01, 2018 to June 30,
2018
Profit after taxation - - - - - 844,992 844,992 844,992
Other comprehensive income - - - (4,501) - (11,667) (16,168) (16,168)
- - - (4,501) - 833,325 828,824 828,824
Balance as at June 30, 2018 3,564,955 1,405,415 5,380,000 159,005 19,648 2,494,308 9,458,376 13,023,331
Transfer to unappropriated profit - - (5,380,000) - - 5,380,000 - -
Final dividend for the year ended June 30, 2018 - - - - - (891,239) (891,239) (891,239)
Total comprehensive income for the nine months ended March 31, 2019 (un-audited)
Profit after taxation - - - - - 2,792,434 2,792,434 2,792,434
Other comprehensive loss - - - (10,996) - - (10,996) (10,996)
- - - (10,996) - 2,792,434 2,781,438 2,781,438
Balance as at March 31, 2019 (Un-Audited) 3,564,955 1,405,415 - 148,009 19,648 9,775,503 11,348,575 14,913,530
The annexed notes from 1 to 17 form an integral part of these condensed interim consolidated financial statements.
MOHOMED BASHIR
Chairman
MOHAMMED ZAKI BASHIR
Chief Executive
ABDUL ALEEM
Chief Financial Officer
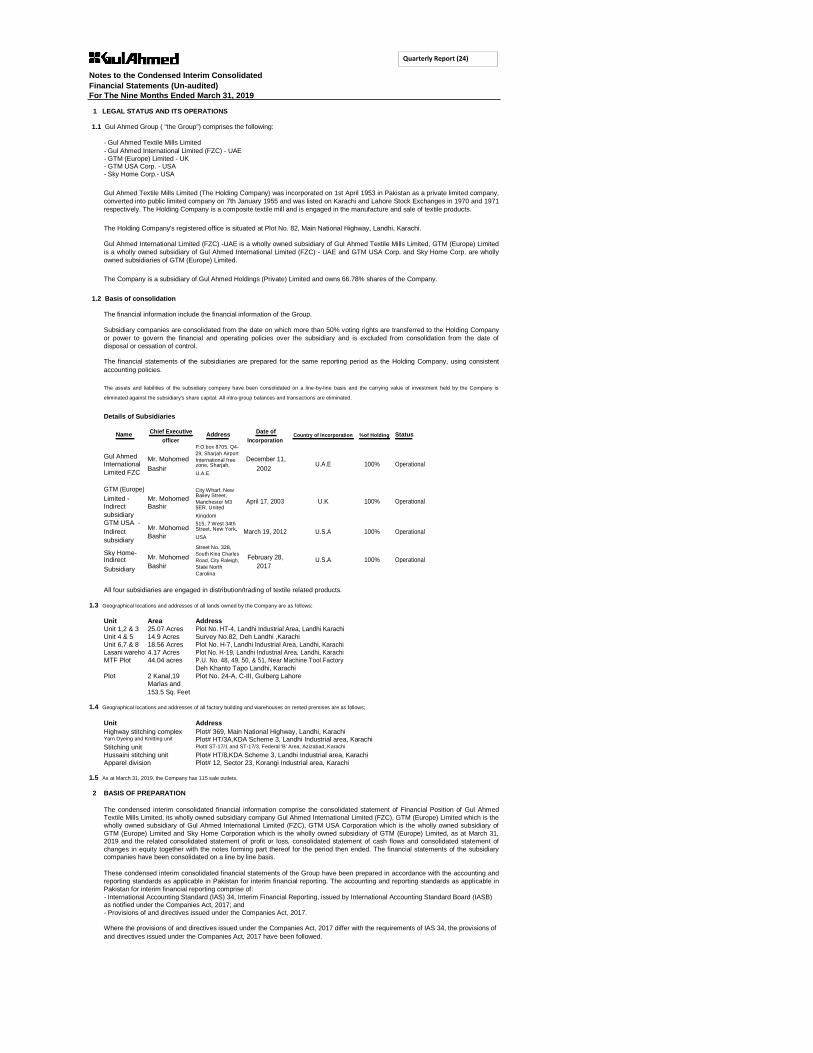
Quarterly Report (24) Notes to the Condensed Interim Consolidated Financial Statements (Un-audited) For The Nine Months Ended March 31, 2019
1 LEGAL STATUS AND ITS OPERATIONS
1.1 Gul Ahmed Group ( "the Group") comprises the following:
- Gul Ahmed Textile Mills Limited - Gul Ahmed International Limited (FZC) - UAE - GTM (Europe) Limited - UK - GTM USA Corp. - USA - Sky Home Corp.- USA
Gul Ahmed Textile Mills Limited (The Holding Company) was incorporated on 1st April 1953 in Pakistan as a private limited company,
converted into public limited company on 7th January 1955 and was listed on Karachi and Lahore Stock Exchanges in 1970 and 1971
respectively. The Holding Company is a composite textile mill and is engaged in the manufacture and sale of textile products.
The Holding Company's registered office is situated at Plot No. 82, Main National Highway, Landhi, Karachi.
Gul Ahmed International Limited (FZC) -UAE is a wholly owned subsidiary of Gul Ahmed Textile Mills Limited, GTM (Europe) Limited
is a wholly owned subsidiary of Gul Ahmed International Limited (FZC) - UAE and GTM USA Corp. and Sky Home Corp. are wholly
owned subsidiaries of GTM (Europe) Limited.
The Company is a subsidiary of Gul Ahmed Holdings (Private) Limited and owns 66.78% shares of the Company.
1.2 Basis of consolidation
The financial information include the financial information of the Group.
Subsidiary companies are consolidated from the date on which more than 50% voting rights are transferred to the Holding Company
or power to govern the financial and operating policies over the subsidiary and is excluded from consolidation from the date of
disposal or cessation of control.
The financial statements of the subsidiaries are prepared for the same reporting period as the Holding Company, using consistent
accounting policies.
The assets and liabilities of the subsidiary company have been consolidated on a line-by-line basis and the carrying value of investment held by the Company is
eliminated against the subsidiary's share capital. All intra-group balances and transactions are eliminated.
Details of Subsidiaries
Name Chief Executive
Address Date of
Country of Incorporation
%of Holding
Status
officer
Incorporation
P.O.box 8705, Q4-
Gul Ahmed Mr. Mohomed 29, Sharjah Airport
December 11,
International free
International U.A.E 100%
Operational Bashir
zone, Sharjah, 2002
Limited FZC U.A.E.
GTM (Europe) City Wharf, New Limited - Mr. Mohomed
Bailey Street,
Manchester M3 April 17, 2003 U.K 100% Operational Indirect Bashir
5ER, United
subsidiary Kingdom
GTM USA - Mr. Mohomed
515, 7 West 34th
Indirect Street, New York,
March 19, 2012 U.S.A 100%
Operational Bashir USA
subsidiary
Street No. 328,
Sky Home-
Mr. Mohomed South King Charles
February 28,
Indirect Road, City Raleigh, U.S.A 100% Operational Bashir 2017
Subsidiary State North
Carolina
All four subsidiaries are engaged in distribution/trading of textile related products.
1.3 Geographical locations and addresses of all lands owned by the Company are as follows;
Unit Area Address
Unit 1,2 & 3 25.07 Acres Plot No. HT-4, Landhi Industrial Area, Landhi Karachi Unit 4 & 5 14.9 Acres Survey No.82, Deh Landhi ,Karachi Unit 6,7 & 8 18.56 Acres Plot No. H-7, Landhi Industrial Area, Landhi, Karachi Lasani wareho 4.17 Acres Plot No. H-19, Landhi Industrial Area, Landhi, Karachi MTF Plot 44.04 acres P.U. No. 48, 49, 50, & 51, Near Machine Tool Factory Deh Khanto Tapo Landhi, Karachi Plot 2 Kanal,19 Plot No. 24-A, C-III, Gulberg Lahore Marlas and
153.5 Sq. Feet 1.4 Geographical locations and addresses of all factory building and warehouses on rented premises are as follows;
Unit Highway stitching complex Yarn Dyeing and Knitting unit Stitching unit Hussaini stitching unit Apparel division
Address Plot# 369, Main National Highway, Landhi, Karachi Plot# HT/3A,KDA Scheme 3, Landhi Industrial area, Karachi Plot# ST-17/1 and ST-17/3, Federal 'B' Area, Azizabad, Karachi Plot# HT/8,KDA Scheme 3, Landhi Industrial area, Karachi Plot# 12, Sector 23, Korangi Industrial area, Karachi
1.5 As at March 31, 2019, the Company has 115 sale outlets.
2 BASIS OF PREPARATION
The condensed interim consolidated financial information comprise the consolidated statement of Financial Position of Gul Ahmed
Textile Mills Limited, its wholly owned subsidiary company Gul Ahmed International Limited (FZC), GTM (Europe) Limited which is the wholly owned subsidiary of Gul Ahmed International Limited (FZC), GTM USA Corporation which is the wholly owned subsidiary of
GTM (Europe) Limited and Sky Home Corporation which is the wholly owned subsidiary of GTM (Europe) Limited, as at March 31, 2019 and the related consolidated statement of profit or loss, consolidated statement of cash flows and consolidated statement of
changes in equity together with the notes forming part thereof for the period then ended. The financial statements of the subsidiary companies have been consolidated on a line by line basis.
These condensed interim consolidated financial statements of the Group have been prepared in accordance with the accounting and
reporting standards as applicable in Pakistan for interim financial reporting. The accounting and reporting standards as applicable in
Pakistan for interim financial reporting comprise of:
- International Accounting Standard (IAS) 34, Interim Financial Reporting, issued by International Accounting Standard Board (IASB) as notified under the Companies Act, 2017; and - Provisions of and directives issued under the Companies Act, 2017.
Where the provisions of and directives issued under the Companies Act, 2017 differ with the requirements of IAS 34, the provisions of
and directives issued under the Companies Act, 2017 have been followed.

Quarterly Report (25)
These condensed interim consolidated financial statements comprise of the condensed interim consolidated statement of Financial
Position as at March 31, 2019 and the condensed interim consolidated statement of profit or loss, condensed interim consolidated
statement of comprehensive income, condensed interim consolidated statement of cash flows and condensed interim consolidated
statement of changes in equity for the nine months ended March 31, 2019.
The comparatives statement of Financial Position, presented in these condensed interim consolidated financial statements, as at June
30, 2018 has been extracted from the audited financial statements of the Group for the year ended June 30, 2018 whereas the
comparative condensed interim consolidated statement of profit or loss, condensed interim consolidated statement of comprehensive income, condensed interim consolidated statement of cash flows and condensed interim consolidated statement of changes in equity
for the nine months ended March 31, 2019 have been extracted from the condensed interim consolidated financial statements of the
Group for the nine months ended March 31, 2018.
These condensed interim consolidated financial statements do not include all the information required in annual financial statements
prepared in accordance with approved accounting standards as applicable in Pakistan, and should be read in conjunction with the
consolidated financial statements for the year ended June 30, 2018.
2.1 Change in accounting standards, interpretations and amendments to published approved accounting and reporting standards
(a) New standards, amendments and interpretation to published approved accounting and reporting standards which are
effective during the nine months ended March 31, 2019
There are certain amendments and an interpretation to approved accounting and reporting standards which are mandatory for the
Company's annual accounting period beginning on July 1, 2018; however, these do not have any significant impact on these
unconsolidated condensed interim financial statements hence not detailed. Further following new standards have become effective
during the period due to which certain changes in accounting policies have been made;
IFRS 15 'Revenue from contracts with customers' - IFRS 15 'Revenue from Contracts with customers' applies to all revenue arising from contracts with customers, unless those contracts are not in the scope of other
standards and it has superseded IAS 11 “Construction Contracts”, IAS 18 “Revenue” and related interpretations. The new standard establishes a five-step model to
account for revenue arising from contracts with customers based on the principle that an entity should recognize revenue representing the transfer of promised goods
or services to customers at an amount that reflects the consideration to which the entity expects to be entitled in exchange for those goods or services. The standard
requires entities to exercise judgement, taking into consideration all of the relevant facts and circumstances when applying each step of the model to contracts with their
customers.
The Company has concluded that this standard do have significant impact on these condensed interim financial statements as it is
already in compliance with the significant provisions of this standard.
(b) New standards and amendments to published approved accounting and reporting standards that are not yet effective There are new standards, certain amendments and interpretation to the approved accounting and reporting standards that will be mandatory for the Company's annual accounting periods beginning on or after July 1, 2019. However, these will not have any material impact except IFRS-16 "Leases" whose impact is being assessed.
Further the Securities and Exchange Commission of Pakistan through its notification SRO 229 dated Feburaray 14, 2019 and its press
release dated February 15, 2019 has also defferred the applicability of the standards for the periods ending on or after June 30, 2019.
The impact of the provisions of this standard including estimation of expected credit losses is being assessed.
3 ACCOUNTING POLICIES
Same accounting policies and methods of computation are adopted for the preparation of these condensed interim consolidated f inancial statements as those applied in
the preparation of consolidated financial statements for the year ended June 30, 2018 except for changes as stated above in note 2.1 which do not have significant
impact on these condensed interim consolidated financial statements.
4 ACCOUNTING ESTIMATES, JUDGEMENTS AND FINANCIAL RISK MANAGEMENT
The preparation of this condensed interim consolidated financial statements requires management to make estimates, assumptions
and use judgments that affect the application of policies and reported amounts of assets and liabilities and income and expenses.
Estimates, assumptions and judgments are continually evaluated and are based on historical experience and other factors, including
reasonable expectations of future events. Revisions to accounting estimates are recognised prospectively commencing from the
period of revision. Judgments and estimates made by the management in the preparation of this condensed interim financial
statements are the same as those that were applied to financial statements as at and for the year ended June 30, 2018.
The Group's financial risk objectives and policies are consistent with those disclosed in the annual audited financial statements as at
and for the year ended June 30, 2018. Un-Audited Audited
March June 2019 2018
5 Long term financing - Secured Rupees in '000
Opening balance 8,277,726 7,824,892
Add: Obtained during the period / year 2,671,706 1,270,701 Less: Repaid during the period / year (1,007,215) (817,867)
9,942,217 8,277,726
Less: Current portion shown under current liabilities (1,250,524) (1,365,857)
8,691,693 6,911,869
6 TRADE AND OTHER PAYABLES
Trade and other payables include provision in respect of;
a) Increase in gas tariff rates notified vide SRO No. (I) / 2015 dated 31 August, 2015, and Oil and Gas Regulatory
Authority (OGRA) notification dated 30 December, 2016 was challenged in Honorable Sindh Hight Court by the Group,
as was disclosed in note no. 10.1.2 of the consolidated financial statements for the year ended June 30, 2018. The Oil
and Gas Regulatory Authority (OGRA) issued another notification dated October 04, 2018, revising the tariff effective
from September 27, 2018, subsequent to this notification the Company paid the bills accordingly, hence after this
notification no subsequent provision has been made; However, upto the September 2018 the Group has provided
banker's verified various Cheques of Rs. 250.675 million (June-2018: 217.356 million) as security to Nazir of High
Court Sindh and also, as a matter of prudence, maintained full provision up to the September 2018 amounting to Rs.
410.601 million (June-2018: 377.283 million) in the consolidated financial statements.
b) The Group as mentioned in note 10.1.3 of the consolidated financial statements for the year ended June 30, 2018 had filed a s uit in the Honorable
Sindh High Court challenging the charging of captive power tariff instead of industry tariff. The OGRA has issued another notification dated October
04, 2018 revising the tariff effective September 27, 2018, subsequent to this notification the Group paid the bills accordingly, hence after this
notification no subsequent provision has been made; However, upto the September 2018 the Group has provided banker's verified var ious cheques
of Rs. 388.570 million (June-2018: Rs. 332.397 million) as security to Nazir of High Court of Sindh and also, as a matter of prudence, maintained full
provision up to September, 2018 amounting to Rs. 626.230 million (June-2018: Rs. 570.057 million) in the consolidated financial statements.

Quarterly Report (26)
7 CONTINGENCIES AND COMMITMENTS
Contingencies
The status of contingencies, as reported in the annual financial statements for the year ended June 30, 2018 remained unchanged during
the current period except following;
a) In the matter of Gas Infrastructure Development Cess (GIDC), wherein there is no change in its status as disclosed in note 14.4 of
the financial statements for the year ended June 30, 2018 except that the amount of provision of Rs. 2,174 million (June-2018:
Rs.1,725 million) commencing from May 22, 2015 to the balance sheet date.
Gurarantees
(a) Guarantee of Rs.1,106 million (June-2018: Rs. 839 million) against guarantees issued by banks which are secured by pari passu
hypothecation charge over stores and spares, stock-in-trade, trade debts and other receivables. These guarantees includes
guarantees issued by related party amounting to Rs. 892 million (June 2018: Rs. 771 million).
(b) Post dated cheques Rs. 3,493 million (June-2018: Rs. 3,440 million) are issued to Custom Authorities in respect of duties on imported
items availed on the basis of consumption and export plans.
(c) Bills discounted Rs. 4,326 million (June-2018: Rs. 1,292 million).
(d) Corporate guarantee of Rs. 124.947 million (June-2018: Rs. 110.450 million) has been issued to a bank in favor of indirect subsidiary
company - GTM (Europe) Limited - UK. This has been issued in accordance with the requirement of Companies Act, 2017.
Commitments
(a) Group is committed for certain expenditures which are stated as follows:
The Group is committed for capital expenditure as at March 31, 2019 of Rs.739 million (June 2018: Rs. 1,234 million).
(b) The Group is committed for minimum rental payments
for each of following period as follows:
Not more than one year More than one year but not more than five years
More than five years
8 PROPERTY, PLANT AND EQUIPMENT
Operating fixed assets Capital work in progress (CWIP)
8.1 Additions during the period
Buildings and structures on leasehold land Plant and machinery Furniture and fixtures Office equipment Vehicles
Un-Audited Audited
March June
2019 2018
Rupees in '000
819,353 800,204
2,806,231 2,276,407
625,238 815,837
4,250,822 3,892,448
8.1 & 8.2 15,441,761 14,926,272
8.4 2,728,216 1,195,605
18,169,977 16,121,877
Un-Audited
for the nine months ended for the nine months ended
March March
2019 2018
Rupees in '000
201,122 725,085
1,712,654 2,331,989
4,240 2,700
105,746 28,500
41,969 52,600
2,065,731 3,140,874
8.1.1 Additions to building and structure on leasehold land and plant and machinery include transfers from capital work-in-progress
amounting to Rs. 161.06 million (March 2018: Rs. 605 million) and Rs. 1,496 million (March 2018: Rs. 2,074 million) and 60.45 million
(March 2018: Rs.40 k) respectively.

Quarterly Report (27)
Un-Audited
for the nine months ended for the nine months ended
March March
2019 2018
8.2 Disposals - operating fixed assets (at net book value)
Rupees in '000
Plant and machinery 83,157 63,179
Vehicles 58,383 97,652
141,540 160,831
8.2.1 Disposals include assets scrapped at Net book value during the period of Rs. Nil (March-2018: Rs. 0.220 million).
Un-Audited
March March
2019 2018
Rupees in '000
8.3 Depreciation charge during the period 1,405,632 1,368,810
8.4 Additions - capital work in progress (at cost)
Machinery 2,660,950 402,108
Building 529,335 238,565
Others 60,452 -
3,250,737 640,673
Note Un-Audited Audited
March June
2019 2018
9 INTANGIBLE ASSETS
Rupees in '000
Intangible - net book value 9.1 & 9.2 55,117 32,005
55,117 32,005
Un-Audited
for the nine months ended for the nine months ended
March March
2019 2018
9.1 Additions - intangibles (at cost)
Rupees in '000
35,014
Computer Software 299
9.2 Amortisation charge during the period 11,901 8,476
Un-Audited
March March
2019 2018
10 CASH AND CASH EQUIVALENTS Rupees in '000
Cash and cash equivalents comprises of:
Cash and bank balances 696,071 553,996
Short term borrowings (19,997,081) (14,402,727)
(19,301,010) (13,848,731)
11 TAXATION
Provision for current taxation has been made on the basis of normal tax liability, final taxation, tax credit and
separate block income under the Income Tax Ordinance, 2001.
Quarterly Report (28)
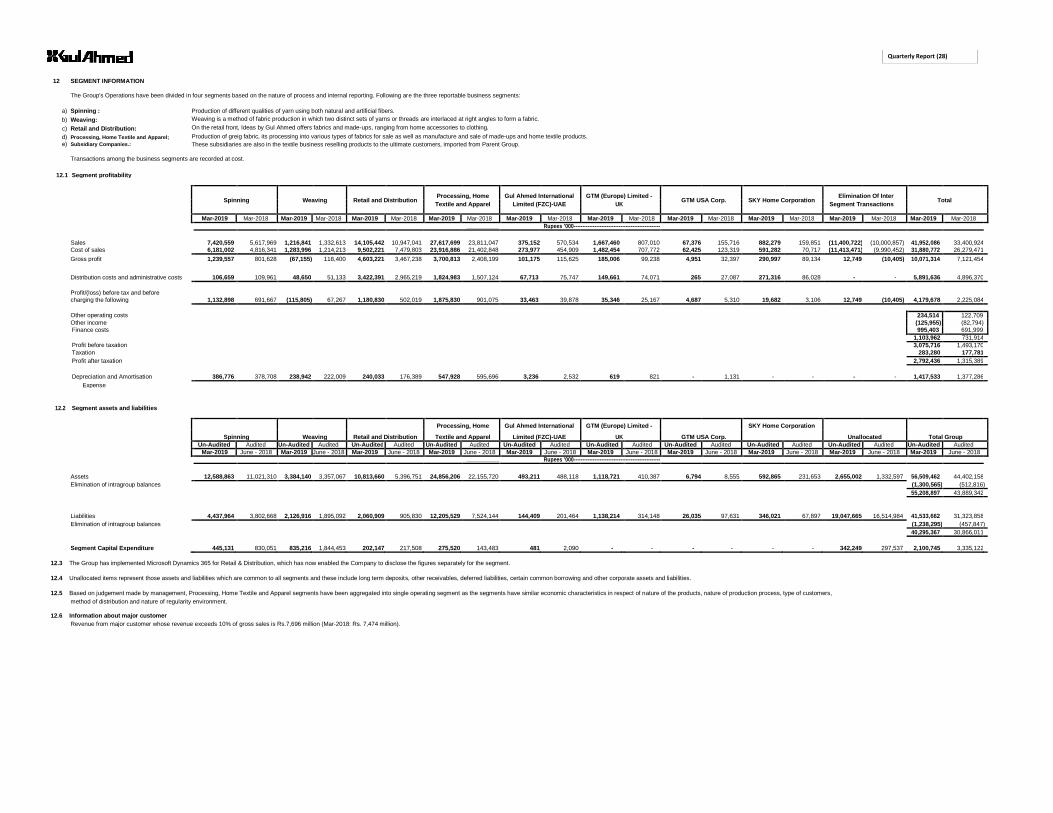
12 SEGMENT INFORMATION
The Group's Operations have been divided in four segments based on the nature of process and internal reporting. Following are the three reportable business segments:
a) Spinning :
b) Weaving:
c) Retail and Distribution: d) Processing, Home Textile and Apparel; e) Subsidiary Companies.:
Production of different qualities of yarn using both natural and artificial fibers. Weaving is a method of fabric production in which two distinct sets of yarns or threads are interlaced at right angles to form a fabric. On the retail front, Ideas by Gul Ahmed offers fabrics and made-ups, ranging from home accessories to clothing. Production of greig fabric, its processing into various types of fabrics for sale as well as manufacture and sale of made-ups and home textile products. These subsidiaries are also in the textile business reselling products to the ultimate customers, imported from Parent Group.
Transactions among the business segments are recorded at cost.
12.1 Segment profitability
Spinning Weaving Retail and Distribution
Processing, Home Gul Ahmed International GTM (Europe) Limited - GTM USA Corp. SKY Home Corporation
Elimination Of Inter Total
Textile and Apparel Limited (FZC)-UAE UK
Segment Transactions
Mar-2019 Mar-2018 Mar-2019 Mar-2018 Mar-2019 Mar-2018 Mar-2019 Mar-2018 Mar-2019 Mar-2018 Mar-2019 Mar-2018 Mar-2019 Mar-2018 Mar-2019 Mar-2018 Mar-2019 Mar-2018 Mar-2019 Mar-2018
-------------------------------------------------- Rupees '000--------------------------------------------------
Sales 7,420,559 5,617,969 1,216,841 1,332,613 14,105,442 10,947,041 27,617,699 23,811,047 375,152 570,534 1,667,460 807,010 67,376 155,716 882,279 159,851 (11,400,722) (10,000,857) 41,952,086 33,400,924 Cost of sales 6,181,002 4,816,341 1,283,996 1,214,213 9,502,221 7,479,803 23,916,886 21,402,848 273,977 454,909 1,482,454 707,772 62,425 123,319 591,282 70,717 (11,413,471) (9,990,452) 31,880,772 26,279,471
Gross profit 1,239,557 801,628 (67,155) 118,400 4,603,221 3,467,238 3,700,813 2,408,199 101,175 115,625 185,006 99,238 4,951 32,397 290,997 89,134 12,749 (10,405) 10,071,314 7,121,454
Distribution costs and administrative costs 106,659 109,961 48,650 51,133 3,422,391 2,965,219 1,824,983 1,507,124 67,713 75,747 149,661 74,071 265 27,087 271,316 86,028 - - 5,891,636 4,896,370 Profit/(loss) before tax and before charging the following 1,132,898 691,667 (115,805) 67,267 1,180,830 502,019 1,875,830 901,075 33,463 39,878 35,346 25,167 4,687 5,310 19,682 3,106 12,749 (10,405) 4,179,678 2,225,084
Other operating costs
234,514 122,709
Other income (125,955) (82,794)
Finance costs 995,403 691,999
Profit before taxation
1,103,962 731,914
3,075,716 1,493,170
Taxation 283,280 177,781
Profit after taxation 2,792,436 1,315,389
Depreciation and Amortisation 386,776 378,708 238,942 222,009 240,033 176,389 547,928 595,696 3,236 2,532 619 821 - 1,131 - - - - 1,417,533 1,377,286 Expense
12.2 Segment assets and liabilities
Spinning Weaving Retail and Distribution
Processing, Home Gul Ahmed International GTM (Europe) Limited -
GTM USA Corp.
SKY Home Corporation
Unallocated Total Group Textile and Apparel Limited (FZC)-UAE UK Un-Audited Audited Un-Audited Audited Un-Audited Audited Un-Audited Audited Un-Audited Audited Un-Audited Audited Un-Audited Audited Un-Audited Audited Un-Audited Audited Un-Audited Audited
Mar-2019 June - 2018 Mar-2019 June - 2018 Mar-2019 June - 2018 Mar-2019 June - 2018 Mar-2019 June - 2018 Mar-2019 June - 2018 Mar-2019 June - 2018 Mar-2019 June - 2018 Mar-2019 June - 2018 Mar-2019 June - 2018
-------------------------------------------------- Rupees '000--------------------------------------------------
Assets 12,588,863 11,021,310 3,384,140 3,357,067 10,813,660 5,396,751 24,856,206 22,155,720 493,211 488,118 1,118,721 410,387 6,794 8,555 592,865 231,653 2,655,002 1,332,597 56,509,462 44,402,158 Elimination of intragroup balances (1,300,565) (512,816)
55,208,897 43,889,342
Liabilities 4,437,964 3,802,668 2,126,916 1,895,092 2,060,909 905,830 12,205,529 7,524,144 144,409 201,464 1,138,214 314,148 26,035 97,631 346,021 67,897 19,047,665 16,514,984 41,533,662 31,323,858 Elimination of intragroup balances (1,238,295) (457,847)
40,295,367 30,866,011
Segment Capital Expenditure 445,131 830,051 835,216 1,844,453 202,147 217,508 275,520 143,483 481 2,090 - - - - - - 342,249 297,537 2,100,745 3,335,122 12.3 The Group has implemented Microsoft Dynamics 365 for Retail & Distribution, which has now enabled the Company to disclose the figures separately for the segment.
12.4 Unallocated items represent those assets and liabilities which are common to all segments and these include long term deposits, other receivables, deferred liabilities, certain common borrowing and other corporate assets and liabilities.
12.5 Based on judgement made by management, Processing, Home Textile and Apparel segments have been aggregated into single operating segment as the segments have similar economic characteristics in respect of nature of the products, nature of production process, type of customers,
method of distribution and nature of regularity environment.
12.6 Information about major customer
Revenue from major customer whose revenue exceeds 10% of gross sales is Rs.7,696 million (Mar-2018: Rs. 7,474 million).
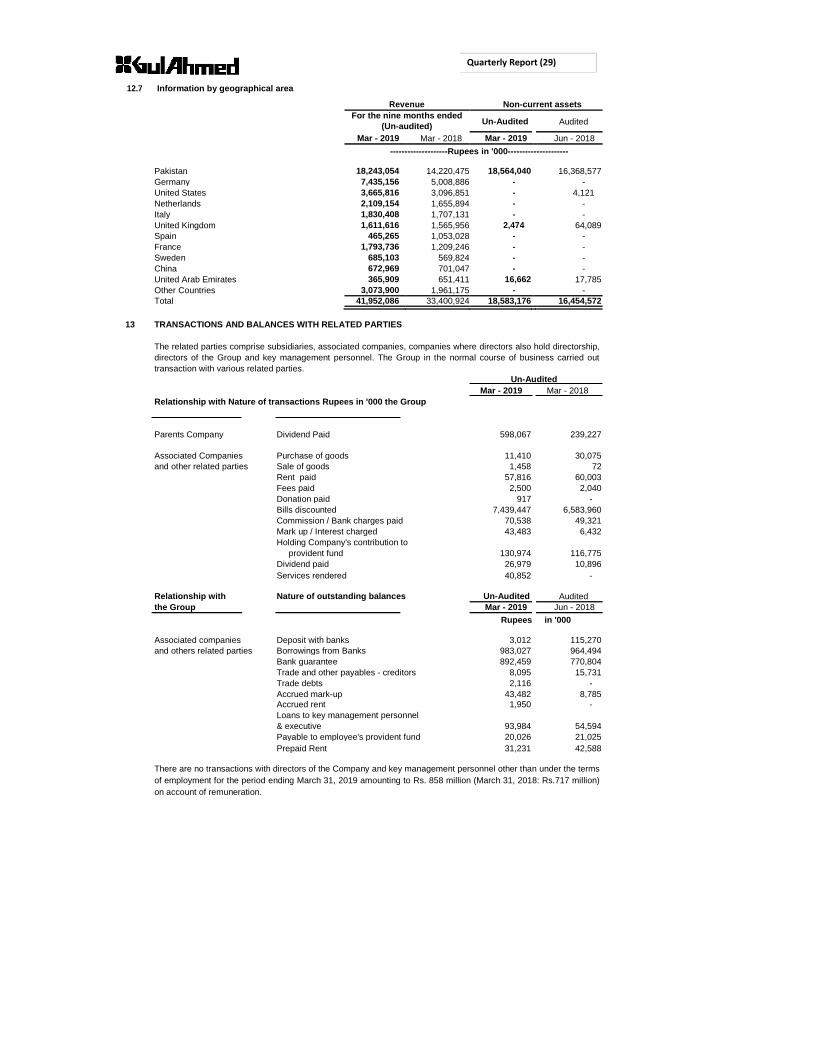
Quarterly Report (29)
12.7 Information by geographical area
Revenue Non-current assets
For the nine months ended Un-Audited
Audited (Un-audited)
Mar - 2019 Mar - 2018 Mar - 2019 Jun - 2018
--------------------Rupees in '000---------------------
Pakistan 18,243,054 14,220,475 18,564,040 16,368,577
Germany 7,435,156 5,008,886 - -
United States 3,665,816 3,096,851 - 4,121
Netherlands 2,109,154 1,655,894 - -
Italy 1,830,408 1,707,131 - -
United Kingdom 1,611,616 1,565,956 2,474 64,089
Spain 465,265 1,053,028 - -
France 1,793,736 1,209,246 - -
Sweden 685,103 569,824 - -
China 672,969 701,047 - -
United Arab Emirates 365,909 651,411 16,662 17,785
Other Countries 3,073,900 1,961,175 - -
Total 41,952,086 33,400,924 18,583,176 16,454,572
13 TRANSACTIONS AND BALANCES WITH RELATED PARTIES
The related parties comprise subsidiaries, associated companies, companies where directors also hold directorship,
directors of the Group and key management personnel. The Group in the normal course of business carried out
transaction with various related parties.
Un-Audited Mar - 2019 Mar - 2018
Relationship with Nature of transactions Rupees in '000 the Group
Parents Company Dividend Paid 598,067 239,227
Associated Companies Purchase of goods 11,410 30,075
and other related parties Sale of goods 1,458 72
Rent paid 57,816 60,003
Fees paid 2,500 2,040
Donation paid 917 -
Bills discounted 7,439,447 6,583,960
Commission / Bank charges paid 70,538 49,321
Mark up / Interest charged 43,483 6,432
Holding Company's contribution to
provident fund 130,974 116,775
Dividend paid 26,979 10,896
Services rendered 40,852 -
Relationship with Nature of outstanding balances Un-Audited Audited
the Group Mar - 2019 Jun - 2018
Rupees in '000
Associated companies Deposit with banks 3,012 115,270
and others related parties Borrowings from Banks 983,027 964,494
Bank guarantee 892,459 770,804
Trade and other payables - creditors 8,095 15,731
Trade debts 2,116 -
Accrued mark-up 43,482 8,785 Accrued rent 1,950 -
Loans to key management personnel
& executive 93,984 54,594
Payable to employee's provident fund 20,026 21,025
Prepaid Rent 31,231 42,588
There are no transactions with directors of the Company and key management personnel other than under the terms
of employment for the period ending March 31, 2019 amounting to Rs. 858 million (March 31, 2018: Rs.717 million)
on account of remuneration.
Quarterly Report (30)
14 FAIR VALUES
Fair value is the price that would be received to sell an asset or paid to transfer a liability in an orderly transaction in
the principal (or most advantageous) market at the measurement date under current market conditions (i.e. an exit
price) regardless of whether that price is directly observable or estimated using another valuation technique.
The Company while assessing fair values uses valuation techniques that are appropriate in the circumstances using
relevant observable data as far as possible and minimizing the use of unobservable inputs. Fair values are
categorized into following three levels based on the input used in the valuation techniques;
- Level 1
Quoted prices in active markets for identical assets or liabilities that can be assessed at
measurement.
- Level 2
Inputs other than quoted prices included within level 1 that are observable for the asset or
liability, either directly (that is, as prices) or indirectly (that is, derived from prices).
- Level 3
Inputs are unobservable inputs for the asset or liability Inputs for the asset or liability that are
not based on observable market data (that is, unobservable inputs).
Financial assets and liabilities of the Company are either short term in nature or are repriced periodically therefore;
their carrying amounts approximate their fair values.
15 DATE OF AUTHORISATION
These financial statements were authorised for issue on 30 April, 2019 by the Board of Directors of the Group.
16 GENERAL
16.1 Allocations for the workers' profit participation fund, workers' welfare fund and taxation are provisional and final
liability including liability for deferred taxation will be determined on the basis of annual results.
16.2 Figures have been rounded off to the nearest thousand rupees.
17 CORRESPONDING FIGURES
For better presentation and due to revisions in the Companies Act 2017, certain re-classification have been made
in the corresponding figures including following;
Reclassification from component Reclassification to component Amount
Rs '000
Other income Sales Other income Sales - net (Exchange gain on realization 177,394
of export receivables)
Finance cost Cost of sales 8,151
Finance cost Cost of sales (Exchange gain on purchase)
MOHOMED BASHIR MOHAMMED ZAKI BASHIR ABDUL ALEEM
Chairman Chief Executive Officer Chief Financial Officer