
University of Milan – Bicocca
Department of Materials Science
RRoollee ooff tthhee ssiilliiccaa nnaannooppaarrttiiccllee aanniissoottrrooppyy oonn
mmoorrpphhoollooggiiccaall aanndd mmeecchhaanniiccaall pprrooppeerrttiieess ooff
SSttyyrreennee BBuuttaaddiieennee RRuubbbbeerr nnaannooccoommppoossiitteess
Doctoral dissertation in Materials Science (XVII cycle) - Industrial Curriculum
Luciano Tadiello
Supervisor: Prof. Roberto Scotti
Industrial tutor: Dott. Luca Giannini
Dean of the doctorate: Prof. Gian Paolo Brivio
0
100
200
300
400
500
600
700
0 20 40 60 80 100
Sto
rage
mo
du
lus
G',
KP
a
Strain %
overlapping rubber layers
separated rubber layers

i
University of Milan – Bicocca
Department of Materials Science
Role of the silica nanoparticle anisotropy on
morphological and mechanical properties of
Styrene Butadiene Rubber nanocomposites
Doctoral dissertation in Materials Science (XVII cycle) - Industrial Curriculum, of
Luciano Tadiello
Supervisor: Prof. Roberto Scotti
Industrial tutor: Dott. Luca Giannini
Dean of the doctorate: Prof. Gian Paolo Brivio
March 2, 2015, Milan

ii

iii
Table of contents:
1. Introduction and aim of the thesis
1.1 Introduction......................................................................................................2
1.2 Aims of the thesis.............................................................................................4
1.3 Structure of the thesis.......................................................................................5
2. General introduction
2.1 Nanocomposites and hybrid materials.............................................................8
2.2 Characteristic features of rubber nanocomposites
2.2.1 Nanofillers for rubber reinforcement................................................9
2.2.2 Nancomposites morphology and filler networking..........................11
2.2.3 Nanocomposites mechanical properties...........................................14
2.3 Interesting properties of rubber nanocomposites for tire formulations...........21
3. Preparation of rod-like shape-controlled silica (SCS) nanoparticles and related
Styrene Butadiene Rubber (SBR) nanocomposites
3.1 Methods for obtaining silica nanoparticles......................................................26
3.2 Synthesis of shape-controlled silica nanoparticles...........................................28
3.3 Shape-controlled silica nanoparticles preparation……………………………29
3.4 Shape-controlled silica nanoparticles characterization....................................30
3.5 Shape controlled silica/SBR nanocomposites preparation and curing.............35
4. Morphology and physico-chemical properties of SCS/SBR nanocomposites
4.1 Morphology of silica/SBR composites by TEM..............................................40
4.2 Heterogeneities detection in silica/SBR composites by AFM.........................45
4.3 Physico-chemical properties of rubber nanocomposites
4.3.1 Thermogravimentric analysis: effective filler introduction..............49
4.3.2 Swelling experiments........................................................................49
4.4 Time domain (TD) NMR: mobility regimes of polymer chains
4.4.1 MSE (Magic Sandwich Echo) experiments......................................51

iv
4.4.2 HE (Hahn echo) experiments...........................................................55
4.4.3 MQ (Multiple Quantum) experiments.............................................57
5. Dynamo-mechanical properties of SCS/SBR nanocomposites
5.1 Rheological properties by ODR (Oscillating Disk Rheometry).....................62
5.2 Rheological behavior by the Einstein-Guth-Smallwood equation.................67
5.3 Compression dynamics experiments..............................................................69
5.4 Temperature dependent dynamo-mechanical studies (DMTA).....................70
5.5 Tensile tests and Mullins effect......................................................................74
6. Conclusions..................................................................................................................79
7. Appendix: characterization techniques....................................................................83

v
dedicata ad Antonio e Maria

vi

1
Chapter 1
INTRODUCTION AND AIM OF THE THESIS
2
Introduction
Rubber compounds are largely employed in the manufacturing of plastic goods, especially for the
production of tires. Since the mechanical properties of rubber are poor, their improvement is
guaranteed through two main processes: the addiction of particulate reinforcing fillers and the
vulcanization reaction. Reinforcing fillers are mixed with the rubber to improve the rigidity of the
obtained compound, preserving the processability of unfilled rubber. Vulcanization is a process to
improve the rubber elasticity via a polymeric network made of sulfur crosslinks. Both of them are
consolidated process used by all the major tire producers.
As regards the addition of reinforcing fillers, the tire industry extensively employs carbon black and
silica particles as reinforcing fillers1.
Silica in particular allows to enhance the tear strength of the material, to increase abrasion
resistance and to reduce rolling resistance of the tires.
The reinforcement effect of silica in rubber compounds depends on different contributions. It
involves either the hydrodynamic effect, due to volume fraction and shape factor of the filler2, and
the most important filler-rubber and filler-filler interactions. These determine the formation of an
interconnected filler network in the rubber matrix, that is essential for providing effective
reinforcement3. In particular, the filler-rubber interaction has been recognized to control the filler
dispersion and networking through the polymer matrix4, depending on the filler particle size and
shape, on the surface characteristics of the filler and on the chemical nature of the polymer5. It
increases with the filler dispersion and with the extent of the organic/inorganic interface. Many
studies have also demonstrated that the filler rubber interaction induces the formation of a polymer
layer around filler particles with consequent slowdown of the dynamics of the rubber chains
interacting with the particle surface6.
Nevertheless, the knowledge of the exact mechanism at the microscopic scale by which the filler
rubber interaction affects the mechanical reinforcement is still one of the main topics of current
investigation7 and the effect of the inorganic/organic interface on the mechanical behavior still
remains a challenge.
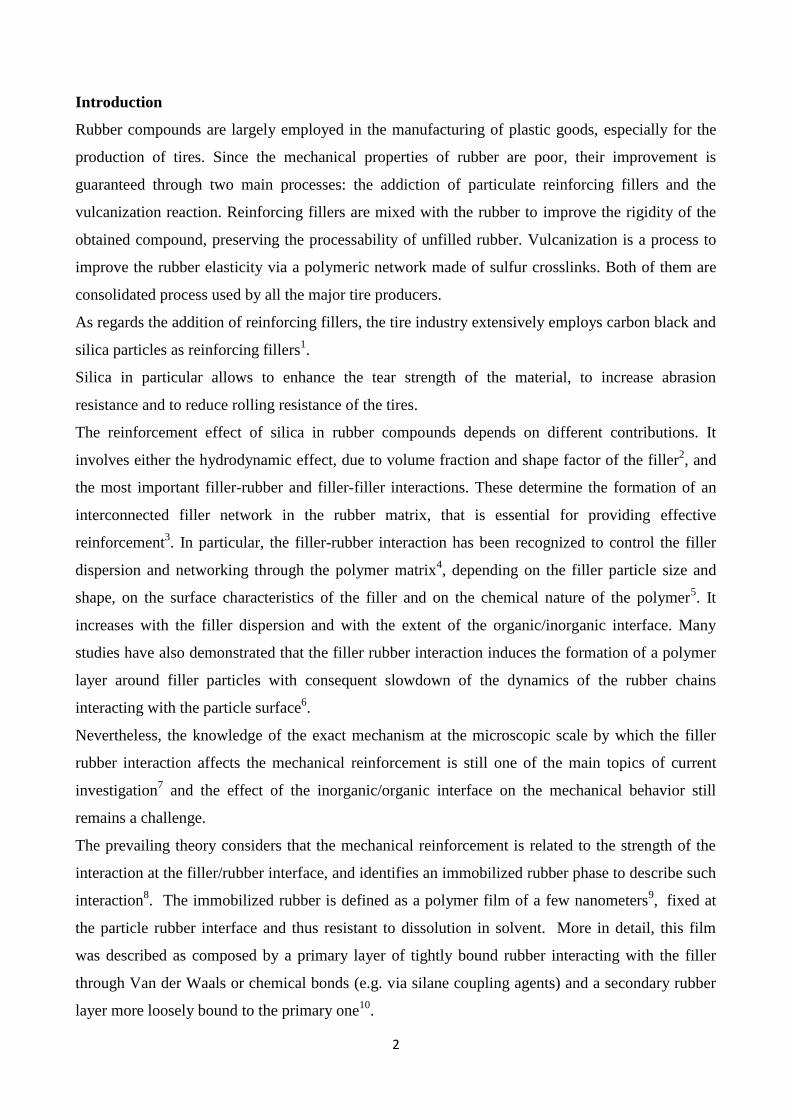
The prevailing theory considers that the mechanical reinforcement is related to the strength of the
interaction at the filler/rubber interface, and identifies an immobilized rubber phase to describe such
interaction8. The immobilized rubber is defined as a polymer film of a few nanometers
9,
fixed at
the particle rubber interface and thus resistant to dissolution in solvent. More in detail, this film
was described as composed by a primary layer of tightly bound rubber interacting with the filler
through Van der Waals or chemical bonds (e.g. via silane coupling agents) and a secondary rubber
layer more loosely bound to the primary one10
.

3
Within these layers the motion of polymer chains is restricted, the rubber stiffness increasing in
comparison with the free rubber far from the particles. Rubber occluded inside the particle
aggregateshas also been considered as a component of the immobilized rubber other than that due to
direct filler rubber interaction11,12
. This rubber contributes to the modulus at low strain since it is
constrained in the voids of particle aggregates and is released by increasing the rubber deformation.
The existence of immobilized rubber has been already revealed in carbon black9, layered silicates
13
and silica14
filled elastomers, and it has been studied by different analytical approaches. Low field
1H Nuclear Magnetic Resonance (NMR) spectroscopy has been used to measure the T2 relaxation
time of immobilized chains6, 8
; Atomic Force Microscopy (AFM) images evidenced the topography
and thickness of the immobilized rubber9, and torsional harmonic AFM has been successively
applied to locally determine the stiffness15
.
The amount of immobilized rubber depends on the area and the nature of the filler rubber interface,
and on the presence of physical constraints16
. However, the influence of the particle morphology
and/or of their anisotropy has not been systematically considered, particularly in the case of silica.
In fact, the beneficial reinforcing effect of anisotropic nanofillers in rubber nanocomposites was
already proved in other systems. Specifically, layered17
and fibrillar18
silicates, carbon nanotubes
and nanofibers19
, halloysite nanotubes20
have been investigated. However, in spite of the large
number of research studies on the role of the particle size and of the filler-polymer interface in
determining the mechanical properties of silica-rubber nanocomposites, only few studies have
regarded different shapes of the same filler and in particular, of anisotropic silica particles.
Recently, our group reported on the in-situ sol-gel synthesis of silica-rubber nanocomposites
obtained by using trialkoxysilanes with different functional groups selected as precursors to
modulate the filler-filler and the filler rubber interactions5,7
. Silane substituents were also able to
induce the formation of slightly anisotropic shaped silica particles. This highlighted that also the
particle shape affected both filler-filler and filler-rubber interactions as well as the filler networking.
To the best of our knowledge, no work has reported a systematic discussion of the behavior of
rubber composites in relation to the different shapes of silica NPs. In particular, no studies have
focused on the design and synthesis of nanocomposites based on shape-controlled anisotropic NPs
with increasing aspect ratios (length/width ratios). These are expected to tune the mechanical
properties of the nanocomposites, depending on the different morphology of the silica particles.
The lack of a systematic study on the role of the silica particle shape in rubber reinforcement
depends on the intrinsic difficulty of tuning the silica nanoparticle shape. In fact, the synthesis of
silica NPs with a controlled aspect ratio (length/width) > 1 is not an easy task. The widespread
preparation methods of the oxide (e.g. hydrothermal, sol-gel, precipitation etc) generally yield

4
spherical or slightly irregular NPs. Elongated silica particles have been obtained as the core-shell of
other oxides (e.g. Fe2O3)21
. Besides, silica nanofibers were produced by electrospinning22
or by
CVD23
. In the end, the only route to produce pure shape controlled anisotropic silica NPs is the sol-
gel reaction in the presence of a surfactant as structure directing agent. Although the method has
been generally applied to produce silica with helical mesostructure it also allows to control the
particle shape24
. In fact, the precursors of silica, tetraethoxysilane, TEOS, and an
organotrialkoxysilane (e.g. (3-mercapto propyl)trimethoxy silane, MPTMS), arrange around the
self-assembled surfactant (e.g. cetyltrimethylammonium bromide CTAB) micelles during the
hydrolysis and condensation reactions. Depending on the trialkoxysilane/TEOS ratio, particles
ranging from spherical (0D) to rod-like (1D) with different shape factors, are produced25
.
Aim of the thesis
The aim of the present work is to investigate the influence of the anisotropic silica particles on the
dynamic-mechanical behavior of the SBR nanocomposites, based on the design and synthesis of
filler nanoparticles with specific and defined morphology, and considering the formation of the
nanoscale rigid rubber at the interface with the filler.
In particular, we focused on the synthesis of shape controlled silica nanoparticles with aspect ratio
ranging from 1 to 10 obtained by a sol-gel route assisted by CTAB as structure directing agent.
Such NPs were used to prepare silica/SBR nanocomposites by ex-situ blending method. In order to
separate the effect of the particle shape from that of the oxide surface chemistry, the same coupling
agent and graft density were used for all the prepared compounds. The purpose was to consider the
aspect ratio as the only geometrical variance in the silica- rubber systems.
The size, the shape and the assembling of silica NPs were investigated by transmission electron
microscopy (TEM) to correlate the filler morphology with the extent of the network in the rubber
matrix. The efficacy of the filler network to bind rubber was assessed by swelling measurements.
The morphology of the nanocomposites and the topography of the immobilized rubber were
investigated by the integrated approach of Transmission Electron Microscopy (TEM) with AFM, to
visualize the stiffest elastomer zone at the interface. Low field 1H NMR measurements were
performed using Magic Sandwich Echo (MSE) to investigate the mobility of rubber chains close to
the filler particles, distinguishing between the motional regimes of tightly immobilized and more
loosely interacting and free rubber. To better characterize the less immobilized fractions of the
rubber matrix Hahn-Echo (HE) and Multiple Quantum (MQ) techniques were also used.

5
Dynamic Mechanical Thermal Analysis (DMTA) assessed the fraction of rubber with reduced
mobility which affects the stress/strain behavior of cured silica/SBR nanocomposites, and tensile
stress-strain tests allowed to study the behavior under high deformation.
Finally, the dynamic-mechanical properties of uncured and vulcanized silica/SBR nanocomposites
were investigated and discussed, allowing to suggest a connection between the shape of the silica
particles and the functional properties.
Structure of the thesis
The research described hereby employs filler/rubber model systems to understand the reinforcing
mechanism operated by by silica nanofillers, having spherical and/or rod-like particle shape:
In Chapter 2 of this thesis the background of hybrid materials and nanocomposites is reviewed, in
order to point out the materials class of filler/rubber systems. The main part of the chapter is
dedicated to the morphology-properties relation typical for this kind of materials, and the properties
of interest for the tire manufacturer.
In Chapter 3 the preparation of shape-defined silica nanoparticles and related nanocomposites is
described, in order to optimize the characteristics of a model system in which the only variable is
represented by the nanoparticle shape.
In Chapter 4 the morphology of nanocomposites containing silica with different particle shape is
described, in particular related to self-assembly of nanofillers with different aspect ratios and the
formation of an interfacial layer of rubber, stabilized at the particle interphase. The properties of
these materials, in relationship with the morphological features, will be the subject of Chapter 5.
Finally, Chapter 6 sums up the main results and reports the conclusions of the investigation.
References
(1) Hall E., Moreland J.C., Rubber Chem Technol 2001 74, pp. 525–539.
(2) J.Frolich, W.Niedermeier and H.D.Luginsland, Compos. Part A-Appl.S., 2005, 36, 449-460
(3) Zhenhua W., Jun L., Sizhu W., Wenchuan W. and Liqun Z., Phys. Chem. Chem. Phys., 2010,
12, 3014-3030
(4) Leblanc J. L. Prog. Polym. Sci. 2002, 27, 627–687
(5) Scotti R., Wahba L., Crippa M., D’Arienzo M., Donetti R., Santo N., Morazzoni F. Soft Matter
2012, 8, 2131–2143.
(6) J Berriot, F Lequeux, L Monnerie, H Montes and Paul Sotta, Journal Non-Crys. Solids, 2002,
719-724

6
(7) Wahba L., D’Arienzo M., Donetti R., Hanel T., Scotti R., Tadiello L., Morazzoni F. RSC
Advances 2013, 3, 5832.
(8) Papon A., Saalwachter K., Schaler K., Guy L., Lequeux F., Montes H. Macromolecules 2011,
44, 913–922.
(9) Qu M., Deng F., Kalkhoran S. M., Gouldstone A., Robisson A., Van Vliet K. J. Soft Matter
2011, 7, 1066–1077
(10) Choi S. S., Ko E., Polymer Testing 2014 40, 170-177
(11) Medalia, A. I.; Laube, S. G. Rubber Chemistry And Technology 1978, 51, 89-109.
(12) Medalia, AI, Rubber Chemistry And Technology 1978, 51, 437-523.
(13) Schon F., Thomann R., Gronski W., Macromol. Symp. 2002 189, 105–110
(14) Montes H., Chaussee T., Papon A., Lequeux F., Guy L., Eur. Phys. J. E 2010 31, 263–268
(15) Schön P., Dutta S., Shirazi M., Noordermeer J., Vancso G. J. J Mater Sci 2011, 46, 3507–
3516.
(16) Fragiadakis D., Bokobza L., Pissis P., Polymer 2011, 52, 3175-3182
(17) M. Galimberti, A. Lostritto, A. Spatola, G. Guerra, Chem. Mater. 2007, 19, 2495-2499
(18) M. Tian, L. Cheng, W. Liang, L. Zhang, Macromol. Mater. Eng. 2005, 290, 681–687.
(19) L. Bokobza, Polymer , 2007, 48, 4907-4920.
(20) R. Kamble, M. Ghag, S. Gaikawad, B. K. Panda, J Adv Scient Res, 2012, 3, 25-29.
(21) A Sánchez-Ferrer, M Reufer, R Mezzenga, P Schurtenberger and H Dietsch, Nanotechnology,
2010, 21 185603
(22) GH An, SY Jeong, HJ Ahn, Materials letters, 2011, 65, 2377–2380
(23) CS Choi, JH Yoon, Applied physics A, 2012, 108, 509–513
(24) Du X., He J. Dalton Trans. 2010, 39, 9063-9072
(25) Scotti R., Conzatti L., D’Arienzo M., Di Credico B., Giannini L., Hanel T., Stagnaro P.,
Susanna A., Tadiello L., Morazzoni F., Polymer 2014, 55, 1497-1506

7
Chapter 2
SILICA-RUBBER NANOCOMPOSITES

8
The chapter is aimed to describe rubber nanocomposites as a class of materials with tunable
properties. The driving concepts useful to understand nanocomposites dynamic behavior will be
described, in close relationship with their morphology up to the nanoscale. Particular attention will
be dedicated to rubber nanocomposites of reinforcing nanoparticles that can be spherical or
anisotropic. The properties of interest for the tire manufacturer will also be reported in order to
discuss the necessary strategies for improving the desired performances, which are related to the
reinforcement effect.
2.1 Nanocomposites and hybrid materials
A composite material is defined as a formulate obtained by the combination of two or more
materials; the composite is phase-separated, meaning that one or more components constitute the
continuous phase (also called matrix) while one or more components constitute the dispersed phase
(also called filler or extender). Other molecular components (that are miscible in one or more
phases) can be present in the formulation, as coupling agents (acting at the interface between filler
and matrix) and additives of different kind (for example oxygen scavengers with antidegradative
effect).
A nanocomposite material is a composite in which one of the phase-separated constituent (typically
the filler) is present in nanometric form at least along one dimension1. Since the exposed surface of
a particulate material goes with the power of three with respect to the size of the single particles2, a
big interfacial area between filler and matrix is expected to be formed, which results in an extended
additional phase (interphase) with properties that differ from the bulk materials. Since the tuning of
properties at the interphase can change dramatically the macroscopic properties of the whole
material, nanocomposites are an attractive field of research for application in many field ranging
from biomedical, catalytic processes, separation science, chemical sensing, fuel cell, solar energy
accumulation, hydrogen storage, capacitors, micro/nano electronic devices, tribology, etc.
Hybrid materials are defined as a combination of an organic constituent with an inorganic
counterpart; they are characterized by phase separation between organic and inorganic constituents,
and an intimate contact at the interface4.
Hybrid materials are classified according to the nature of bond that exists at the inorganic/organic
(I/O) interface, which is highly predictive of the final material properties. Hence, class 1 hybrids
feature weak interactions at the interface like hydrogen bonding, ionic or Van Der Waals
interactions, while class 2 hybrids are characterized by covalent bonding between the organic and
inorganic constituents4.

9
In both cases, the hybrid material is expected to combine the good properties of the organic phase
(low cost, processability, damping…) together with the good properties of the inorganic phase
(electrical conductivity, elastic modulus…).
Silica/rubber nanocomposites for tires are an example of class 2 hybrids, since a covalent bond exist
between organic part (the rubber) and the inorganic part (silica). This is provided by a third
component, the coupling agent, that determines the silica-rubber interaction at the molecular level.
In this thesis, silica/rubber systems will be regarded more as nanocomposites than as hybrid
materials, in order to remark the importance of the size of the dispersed phase. Anyways, some
characteristics related to their I/O interface will highlight their nature of hybrid material.
2.2 Characteristic features of rubber nanocomposites
2.2.1 Nanofillers for rubber reinforcement
Natural and synthetic rubbers, even after vulcanization, cannot be employed as a finite material for
common applications (tyres, engine transmissions, conveyor belts, floor insulators, shoe soles, ecc.)
without improving their hardness, toughness and wear resistance5. As a result reinforcing fillers
figure as the second most abundant ingredients in rubber formulations after the rubber itself; this is
testified by their presence in relatively high amount if compared to other rubber additives6. The
main features of the filler that impact on the nanocomoposite properties are:
_Filler particle size: particles produced for tire application must be nanometric in size (at least along
one dimension) to exert reinforcement on rubber, as represented in figure 2.1. Bulky particulate
materials like calcium carbonate can be employed just to reduce the cost of the final material
without any improvement of properties. In this case they can be simply called extenders or non-
reinforcing fillers; these will be not considered in the thesis, so the term ‘filler’ or ‘nanofiller’ will
be always referred to reinforcing nanofillers.
_Filler particle surface chemistry: the nature of the filler surface determines the type of bonding
with the matrix (covalent, Van Der Walls, H-bond, etc.) and as a consequence controls the
nanocomposite homogeneity and the mechanical properties related (wear/abrasion resistance,
properties at break). While carbon black surface chemistry can be controlled by simply its degree of
oxidation, silica can be surface-modified with chemical compounds, in order to reduce the high
hydrophilicity and to creat a covalent bond with the matrix. This is the case of sulfurated silanes
that are able to react both with silica and rubber7; these are the benchmark coupling agents for tire
applications. A schematic of the sulfurated silica-silane reaction is reported in figure 2.2

10
Figure 2.1: Classifications of filler reinforcing effect according to the particle size.
Figure 2.2: Schematic of the reaction of a benchmark silane (bis-(triethoxysilylpropyl) tetrasulfide)
with silica surface and rubber double bonds.
In a first step, the silane is anchored to the silica particle surface during mixing; in such a way, the
change of particle surface chemistry enhance the particle dispersion by reducing the surface tension
at the interface. During vulcanization, the polysulfide chain of the silane reacts with the rubber
insaturations to form a covalent bond between filler and matrix.
_ Filler particle shape: filler geometry plays also an importan role on the final nanocomposite
textural and physical properties. In particular, an anisotropic nanoparticle is defined as an object

11
having at least one dimension smaller than 100 nm8. This means that both bidimensional (platelet-
like) and monodimesional (fiber-like) nanoparticles fall inside this classification. Monodimensional
anisotropic particles with high aspect ratio (AR 100-200) are called nanofibers, with medium (AR
10-20) are defined nanowhiskers, nanowires or short nanofibers, with low (1≤AR≤10-20) simply
nanorods9.
_ Filler aggregation and agglomeration: filler nanoparticles might not be homogeneously distributed
inside the matrix, according to the mutual affinity of the particles and the type of bonding that exist
at the filler/matrix interface. By definition the term aggregate is related to undispersible clusters of
nanoparticles, while the term agglomerate refers to particles clusters that can be redispersed by
shearing forces10
. As regards nanofillers like silica and carbon black, they are produced spherical
nanoparticles fused in fractal aggregates.
The effect of the filler characteristics on final properties is studied in the nanocomposite
morphological and mechanical properties.
2.2.2 Nanocomposite morphology and filler networking
The combination of a particulate filler and matrix should result, in the simplest case, in an
homogeneous distribution of filler particles in the matrix, provided that the filler particles have no
tendency to agglomerate.
The formation of agglomerates generally takes place when the filler volume fraction in a
nanocomposite is relatively high (>> 0.05), because the total interfacial area A is large while the
interparticle distance is short, as shown in Figure 2.3a . At increasing filler content, a percolative
threshold is attained and all the isolated, aggregated and agglomerated nanoparticles become part of
a network extended through the whole matrix (2.3b). The percolation threshold can be hence
defined as the filler volume fraction at
which all the particles are
interconnected. In a wide sense, the
‘dispersed’ phase becomes the actual
continuous phase, where the matrix
just fills the void spaces11
.
From geometrical observations,
Ostwald reported that a collection of
spheres of equal radius closely packed
fills 74% of the volume10
, the
remaining 26% is empty or
Figure 2.3: Sketch of the morphology of a rubber
nanocomposite below (a) and above (b) filler percolation.

12
corresponds the outer phase. This value is the theoretical maximum filling volume in a polymer
matrix, acting as outer phase. Actual percolation threshold values are much lower than the
theoretical maximum filling volume as a consequence of the interactions occurring between
particles (filler-filler interactions), between particle and matrix (filler-rubber interactions), and the
formation of an interphase, which allow a continuous network to form even without close packing
of particles. The approaches to separate and quantify these interactions will be discussed hereafter.
Nanocomposite properties (such as electrical or mechanical) undergo dramatic change upon filler
percolation as reported in figure 2.4
Figure 2.4: Schematic of nanocomposite morphology and properties at different levels of filler
content. fc is the filler percolation threshold.
Where f is the filler volume fraction and fc is the filler percolation threshold12
. For example, when
an electrically conductive particulate (graphite, carbon nanotube, metal nanoparticles) is dispersed
in a non-conductive matrix (like most of the polymers), the resulting composite is not significantly
conductive below fc, while becomes a good conductor above fc12
. The same occurs for the elastic
modulus with reinforcing particulates: below fc the material exhibit mainly viscous character
(similarly to the unfilled polymer), while above fc the elastic modulus suddenly improve and the
dissipation factor (also called tanδ, related to the viscous dissipation operated by the polymer)
decrease. The implications of filler morphology on dynamic properties are described more in depth
in the following section.

13
In this context, anisotropic nanofillers can play an important role thanks to their particular
morphological features, that in the case of monodimensional anisotropic nanoparticles can be
defined simply by their aspect ratio (AR), e.g. the length/diameter ratio. Figure 2.5 represent a
typical trend of percolation threshold with nanofiller aspect ratio
Figure 2.4: Percolation treshold fc as a function of filler nanoparticles aspect ratio.
Where fc, the filler percolation threshold, decrease at increasing filler aspect ratio13
. Since the
formation of a network is related to a dramatic improvement of mechanical properties, anisotropic
nanofillers allow to obtain higher reinforcement at lower filler loading with respect to spherical
nanofillers. As an example, spherical silica and carbon black based nanocompositesfeature
percolation treshold at 0,17 volume fraction14
. Nanoclays represent a class of naturally anisotropic
nanoparticles with wide range of aspect ratios (5-100), featuring lower percolation threshold than
spherical particles, even at 0,02 volume fraction15
. Finally, carbon nanotubes that can have aspect
ratios in the order of 100-200 are able to form a percolative network in a rubber matrix even at a
volume fraction of 0,00215
.
Additionally, spherical and anisotropic nanoparticles can be also formulated together in a matrix, to
obtain a nanocomposite material featuring a dual filler network: little is known about this combined
reinforcing effect, but great potential is expected to come out from these mixed-filler system, as
witnessed by some recent research15,16
.

14
2.2.3 Nanocomposite mechanical properties
The choice of filler and matrix depend on the properties desired in the nanocomposite, but the
combination of the two normally diverge from the results expected from a classical rule-of-mixture,
that can be represented by the equation 1:
(1)
being P(NC) a property of the nanocomposite, P(f) and P(f) the same property of the filler and the
matrix, φ the filler volume fraction and (1-φ) the matrix volume fraction. This oversimplified
picture does not take into account additional synergic factors originating from the combination of
filler and matrix, which involves the formation of the interphase and the filler interparticle
interactions. As regards the reinforcement of rubber by fillers, it is represented by the cyclic applied
stress-deformation ratio, the complex modulus (G*) that can be decomposed in a in-phase elastic
component (G’, storage modulus) and a out-of-phase dissipative component (G’’, loss modulus)
according to equation 2:
(2)
The ratio G’’/G’ is called tanδ, and it indicates the ratio of energy lost to energy stored in a cyclic
deformation17
. The effective reinforcement operated by the filler is represented by the G’. It is not
due to the simple combination of the moduli of inorganic filler and organic matrix weighted by their
volume fractions. Most of published work deal with the study of the compositional and structural
contributions in rubber nanocomposites to the mechanical reinforcement in terms of storage
modulus G’, G’’ and tanδ. In the following, the main models employed to evaluate the contributions
to reinforcements in filler/rubber nanocomposites are reported.
The Einstein-Guth-Smallwood equation
The widely applied Einstein equation dating 1932, later modified by Guth and Smallwood was a
first example of this approach. The starting point was the basic Einstein equation, η = η0 * (1 + 2.5
φ), which calculate the viscosity η of a suspension from the viscosity of the neat liquid η0 and the
volume fraction of suspended material φ multiplied by a constant. The equation was derived
considering that the effect of presence of an hard particulate material is merely hydrodynamic (e.g.
it does not deform upon flow)18
. This is a valid approximation for diluted systems, but not for
concentrated system, which deviate from the model behavior at increasing concentrations and
aspect ratio of the particulate material (figure 2.5), because of the stronger interparticle interactions.

15
Figure 2.5: Deviations of the viscosity of particulate suspensions in water from the Einstein
equation (dotted line) for different fillers at different concentrations.
After Guth and Smallwood, the equation was applied to filled polymers, substituting viscosity with
elastic modulus, and introducing different terms which takes into account for the filler interparticle
interactions and filler particle shape19,20
. The most general equation for filler/polymer
nanocomposites is reported below.
(3)
Where G’0 and G’0 unfilled correspond to the storage modulus at small strain values of the
nanocomposite and the unfilled matrix, respectively, while AR stands for the nanoparticle aspect
ratio. The equation demonstrated to be highly predictive of the final materials modulus considering
nanocomposites containing a relatively low amount of filler, while at high values of filler volume
fraction the formation of a percolative network provokes a dramatic deviation from the model
equation21, 22
.
The Payne Effect
The pioneeristic work of Payne23
introduced a viscoelasticity-based differentiation of the
components of macroscopic reinforcement of particle-filled rubber vulcanizates. Under relatively
small oscillatory strain a viscoelastic material undergo a drop in the value of the initial G’ modulus
(G’0) until a plateau is reached (corresponding to G’∞). In this way it is possible to separate
distinctly two component of the elastic modulus G’, namely a strain-dependent and a strain-

16
independent one. In fact, above the percolation threshold, a network of interacting particles is
diffuse throughout the whole matrix. As a deformation is applied, the filler network breaks down at
relatively small strain if compared to the strain necessary for the polymer chain rupture. The filler
network is held together by relatively weak forces like H-bons and Van der Waals interactions,
while covalent bonds exist at the polymer-particle interface (trough coupling agents), and in the in-
rubber structure (sulfur crosslinks). This strain softening phenomenon is known as Payne effect, and
the components of reinforcement are readily separated as reported in figure 2.6
Figure 2.6: Schematic of stress-strain curve of a nanocomposite. The strain-dependent and strain-
independent contributions to the Payne effect are differently coloured.
where the strain-dependent component (in yellow) is associated with reinforcement brought by
filler-filler interactions of the filler network and the strain-independent component (other colours)
is associated mainly to filler-rubber interactions. In detail, in-rubber structure and polymer network
are related to the crosslink density of the matrix and the nature of the polymer23
.
The extent of network breakdown can be quantified as a difference ΔG’ between G’0 and at high
deformation G’∞23
, and is associated with an energy-dissipative event (hysteresis) according to
equation 3.
(4)

17
A nanocomposite characterized by an high low-strain modulus (high G’0) and by a low strain-
dependent component (low ΔG’) would demonstrate high reinforcement and also low hysteresis;
these technological requirements are of deep interest for the tire manufacturer.
The immobilized rubber layer model
The concept that rubber segmental motions can be influenced by the constraint imposed by a solid
particulate was suggested by microscopic studies of Medalia24
. The fractal structure of carbon black
aggregates was correlated with the amount of DBP oil (dibutylphthalate) that can be absorbed by
the carbon black particulate. For the first time, a differentiation was made between bound rubber, or
firmly adsorbed on the particles surface, and occluded rubber, physically costrained in the carbon
blacks irregularities, as represented in figure 2.7. Both of them were expected to have different
properties from the bulk rubber, thanks to their different motional regimes.
Figure 2.7: Scheme of the bound and
occluded rubber around a carbon black
aggregate, according to Medalia.
Figure 2.8: Temperature dependence of tanδ. The
first peak from the left is associated with the main
glass transition, while the second peak from the left
corresponds to the secondary relaxation, attributed
to the fraction of rubber constrained by the filler.

18
The first relevant evidence of the confinement effect of polymer chains entering in contact with the
filler surface was brought by Tsagaropulos and Eisenberg in 199225
; they observed the presence of a
well-defined fraction of rubber with increased glass transition temperature with respect to the bulk
rubber. This was detected by DMTA, which is able to separate temperature dependent dynamo-
mechanical events, in particular related to energy dissipation (figure 2.8).
This observation was validated for different filler/rubber systems, and the amount of the rigid
fraction increased with filler amount and exposed filler surface area26
. In 2003, Arrighi also
proposed a numerical method to calculate the exact amount of immobilized rubber27
from DMTA
curves after appropriate deconvolution routines and integration. The interpretation of this
preliminary observation found later opposition in literature28
, hence further investigations were
necessary to clarify the issue. For this reasons, later approaches were aimed to study in detail the
interactions at the interface.
NMR measurements on nanocomposites have shown the existence of polymer chains with lower
mobility than the pure elastomer; in particular, were identified three regions with different mobility:
a mobile region far from the particles, an outer shell with less mobility and an inner shell with very
little mobility29
(figure 2.9) The surrounding polymer layer is therefore divided into two parts: a
firmly anchored portion (close to the surface) and a weakly bound outermost portion composed of
chains interacting with the strongly bonded area. Other investigations, suggested the existence of a
glass transition temperature gradient from the inner immobilized layer to the bulk rubber 30
.
After considering a well-defined polymeric
layer surrounding each particle in the
nanocomposite, the concept of filler-filler
interaction requires some update. From the
traditional mechanicistic interpretation of the
Payne effect, the network breakdown consist
in the detachment of particles one from the
other by rupture of reversible bonds, for
example Van der Waals interactions between
neighboring particles. Taking into account
that the filler-filler contact must be mediated
by the interfacial rubber, the Payne effect can
be explained by the disentaglement of
polymer chains that constitute the actual
filler-filler connections. The polymer layers
Figure 2.9: The rubber layer surrounding a
filler nanoparticle (in white) is composed by a
firmly anchored portion (dark blue) and a
weakly bound outermost portion (light blue).

19
surrounding each single nanoparticle overlap, connecting them in a percolative network diffuse
throughout the whole nanocomposite31
. Some author showed evidence that this connection is made
by polymer chains actually in a glassy state, and described them as ‘glassy bridges’32
.
From the macroscopic point, the interface stability (associated to filler-rubber interactions) can be
also evaluated by mechanical measurements that explore higher strain regimes than the Payne
effect. These are tensile tests and Mullins effect. In tensile tests, the material is stretched at strain
values 20-50 times higher than for the Payne effect according to the procedure in (Appendix A),
and the high-strain effects can be attributed to filler-rubber interactions, that play a complex but
important role on tuning the breakage mechanism. The Mullins effect refers to a particular aspect of
the mechanical response in filled rubbers in which the stress–strain curve depends on the maximum
loading previously encountered. In fact the Mullins effect can be evaluated by a series of tensile
traction and retraction tests until break, in which a lag time between cycles allows to restore
reversible deformations, while pseudo-permanent deformations cannot be restored. In addition to
the simple tensile test, it is possible to evaluate the energy losses localized in different strain
intervals, allowing the material to restore between one cycle and the other separating permanent
(purely viscous) losses from reversible (viscoelastic) losses33
. The hysteresis measured in each
cycle can be considered as an indicator of these losses, as indicated in Appendix A.
The dissipative effect at different strain levels has been related with different physical phenomena,
reviewed by Diani34
, schematized in figure 2.10.
All these mechanism have been explained in comparison with the derivations of the theory of
rubber elasticity, and are adapted for different filler-rubber systems34
. The double-layer model is a
more recent implication, that is particularly useful for systems in which there is direct evidence of a
well-defined interfacial rubber layer. This aspect is discussed in a paper of Fukahori35
, in which the
evolution of bridging interfacial rubber of the secondary layer during Mullins test is schematized as
follows:
_ Upon sample stretching, rubber immobilized on the surface is not moving, while bridging layers
are stretching (figure 2.11a).
_ When the strain is released, the bridging rubber layers are withdrawing dissipating the stored
energy and without coming back to the starting position (figure 2.11b). Hence, in the next
stretching, these ‘buckled’ layers will not contribute in giving any modulus improvement.

20
Figure 2.10: Different dissipative mechanisms associated to the Mullins effect.
Figure 2.11: Model of the
double-layer evolution upon
strain during the stretching and
after the pseudo-permanent
deformation.

21
This means that even if at low strain the contribution of interparticle rubber layers to reinforcement
is markedly high, upon high deformations they will lose irreversibly their reinforcing action35
.
As a final remark, no direct relationship between the particle shape and the filler-rubber interface
has been proposed in literature up to now for silica/rubber nanocomposites. Even if it is well
understood that the use of anisotropic in spite of spherical nanofillers imparts beneficial properties
to rubber nanocomposites, the reinforcing mechanism at the nanoscale is still to be investigated for
these systems and will be the main topic of this thesis.
2.3 Interesting properties of rubber nanocomposites for tire formulations
A tire is built up from different crude rubber formulates, shaped into single components (tread,
innerliner, etc.). These crude components are assembled together with the non-rubber components
(steel carcass, cords, etc.) and eventually the tire is cured in a press. The main steps of tire
manufactory are summarized in figure 2.12, with highlighted the part related to rubber formulates.
Figure 2.12: Scheme of the industrial processing of a tire from the raw materials
Without going into details into non-tread
components, the tread formulation is the most
important one, first for its presence36
and second
because is the part in direct contact with the asphalt,
where the main energy dissipation occurs.
A commonly used representation for the tire tread
performance is the magic triangle graph, where three Figure 2.13: The magic triangle graph

22
main properties can be compared and related to the tread formulations examined.
These main indicators are:
_ Rolling resistance: the resistance opposed by the asphalt to the tire movement. It is not just
dependent on the kinetic friction coefficient, but also on the deformation of the tire, which is an
energy dissipating event. Highly elastic tires feature a reduced rolling resistance. From the dynamo-
mechanical point of view, the tanδ value in the tire marching conditions is a strong indicator of the
rolling resistance.
_Abrasion resistance: the ability of the tread to resist wear, which is a complex phenomenon,
dependent among all on the properties at high deformation (for example: elongation at break).
_Wet traction: the ability of the tread to guarantee good grip with the asphalt even in wet
conditions. A good indicator of wet traction can be the high material hysteresis at low temperature.
Unfortunately it is rarely possible to elaborate a tread formulation improving all of these three
indicators together. A compromise has to be reached for having a good balance of final material
performance: for example, a stiff tread formulation (high storage modulus and low tanδ) would
reduce rolling resistance, but also decrease abrasion resistance of the tire37
. In this context, the
availability of new raw and modified nanomaterials is a promising starting point for rubber
technologists that aim to improve the tire performance.
References
[1] P. M. Ajayan, L. S. Schadler, P. V. Braun, Nanocomposites Science and Technology, Wiley,
2003
[2] S. Lowell, Joan E. Shields, Martin A. Thomas, Matthias Thommes, Characterization of Porous
Solids and Powders: Surface Area, Pore Size and Density, Kluwer Academic Publishers, 2004
[3] Patrick Judeinstein and Clément Sanchez J. Mater. Chem., 1996,6, 511-525
[4] Clément Sanchez, Beatriz Julián, Philippe Belleville and Michael Popall J. Mater. Chem.,
2005,15, 3559-3592
[5] Alan N. Gent, Engineering with rubber, Hanser Publications, 2012
[6] http://www.indiarubberdirectory.com/engineering/standard_rubber_formulations.asp
[7] Annemieke ten Brinke, Silica Reinforced Tyre Rubbers, PhD thesis, Twente University Press,
2002
[8] MacNaught, Alan D. and Wilkinson, Andrew R., ed. Compendium of Chemical Terminology:
IUPAC Recommendations (2nd ed.). Blackwell Science, 1997.
[9] Anil K. Bhowmick, Current Topics in Elastomer Research, Taylor & Francis Group, 2008

23
[10] H. Mollet, A. Grubenrnann, Formulation Technology, Wiley, 2001
[11] D. Stauer and A. Aharony, Introduction to Percolation Theory, Taylor & Francis, 1994
[12] C. W. Nan, Y. Shen, J. Ma, Annu. Rev. Mater. Res. 2010, 40, 131–51
[13] V. Favier, Etude de Nouveaux Materiaux Composites Obtenus a Partire de Latexes
Filmogenes et de Whiskers de Cellulose, PhD thesis, Institut Politechnique de Grenoble, 1996
[14] K. Yurekli, R. Krishnamoorti, M. F. Tse, K. O. Mcelrath, A. H. Tsou, H. C. Wang, Journal of
Polymer Science: Part B: Polymer Physics, 2001, 39, 256–275
[15] L. Giannini, M. Galimberti, V. Cipolletti, M. Coombs, L. Conzatti, M. Mauro, G. Guerra, A
Rubber Vision Of High Aspect Ratio Nanofillers, International Rubber Conference, Paris, 2013
[16] L. Bokobza, E. Leroy, V. Lalanne, European Polymer Journal, 2009, 45 996–1001
[17] G. Heinrich, M. Kluppel, T. A. Vilgis, Current Opinion in Solid State Materials Science, 2002,
6, 195-203
[18] Shang W, Williams JW, Soderholm KJM. J Mater Sci 1994, 29, 2406-16.
[19] Nan CW, Shen Y, Ma J. Annu Rev Mater Res 2010, 40, 131-51;
[20] Xu J, Florkowski W, Gerhardt R, Moon K, Wong CP. J Phys Chem B 2006, 110, 12289-92.
[21] R. Scotti, L. Conzatti, M. D'Arienzo, B. Di Credico, L. Giannini, T. Hanel, P. Stagnaro, A.
Susanna, L. Tadiello, F. Morazzoni, Polymer 2014, 55, 1497-1506
[22] K. W. Stockelhuber, A. S. Svistkov, A. G. Pelevin, and G. Heinrich Macromolecules 2011, 44,
4366–4381
[23] H.-D. Luginsland, J. Flohlich and A. Wehmeier, Rubber Chem. Technol., 2002, 75, 563–579
[24] A. I. Medalia, Rubber Chemistry and Technology 1978, 51, 437-523
[25] Tsagaropoulos G., Eisenberg A., Macromolecules 1994, 28, 6067-6077
[26] Tsagaropoulos G., Eisenberg A, Macromolecules 1996, 28, 396-398
[27] Arrighi V., McEwen I.J., Qian H., Serrano Prieto M.B., Polymer 2003, 44, 6259–6266
[28] C. G. Robertson, C. J. Lin, M. Rackaitis, C. M. Roland, Macromolecules 2008, 41, 2727-2731
[29] Berriot J., Montes H., Lequeux F., Long D., Sotta P. Macromolecules 2002, 35 (26), 9756–
9762
[30] Papon A., Saalwachter K., Schaler K., Guy L., Lequeux F., Montes H. Macromolecules 2011,
44, 913–922
[31] L. Wahba, M. D’Arienzo, S. Dirè, R. Donetti, T. Hanel, F. Morazzoni, M. Niederberger, N.
Santo, L. Tadiello, R. Scotti Soft Matter 2014, 10, 2234-2244
[32] Montes H., Chaussee T., Papon A., Lequeux F., Guy L., Eur. Phys. J. E 2010 31, 263–268
[33] Schmoller K. M., Bausch A. R., Nature Materials 2013, 278-281
[34] Diani J., Fayolle B., Gilormini P., European Polymer Journal 2009, 601-612

24
[35] Fukahori Y., J. Appl. Polym. Sci. 2005, 95, 60–67
[36] http://www.wrap.org.uk
[37] B. Heissing, M. Ersoy, Chassis Handbook, Springer, 2011

25
Chapter 3
PREPARATION OF ROD-LIKE SHAPE-CONTROLLED
SILICA (SCS) NANOPARTICLES AND RELATED
STYRENE BUTADIENE RUBBER (SBR)
NANOCOMPOSITES

26
The chapter reports the preparation of spherical and rod-like anisotropic silica nanopaticles and the
preparation of corresponding Styrene Butadiene Rubber (SBR) nanocomposites. First, the different
methods for obtaining silica nanoparticles are described. Then, the synthetic methodology used for
obtaining shape-controlled anisotropic silica nanoparticles having different aspect ratios is reported,
as well as the preparation of nanocomposites of rubber filled with anisotropic silica nanoparticles.
3.1 Methods for obtaining silica nanoparticles
Precipitated silica
Precipitated silica is the most commonly used nanofiller in rubber industry, and it is prepared by
acidification of an aqueous solution of sodium metasilicate.
A typical production plant for precipitated silica is schematically represented in figure 3.1
Figure 3.1: Industrial plant for the preparation of precipitated silica nanoparticles.
Sodium metasilicate Na2SiO3 which is first produced from sand in a voltaic arc furnace; it is
dissolved in highly basic solution (pH > 14). When diluted in water, a white colloidal powder
forms; after further addition of acid (most employed is diluted H2SO4) the powder precipitates and
can be filtered out from the reaction medium and dried. By controlling the reaction conditions, it is
possible to tune the size of spherical particles, generally from 10 nm to microns, but not the shape,
except for some patent that reports also the possibility of obtaining slightly ellipsoidal particles.
Sol-Gel silica
Sol-gel synthesis is the most versatile method to obtain metal oxide nanoparticles with defined
properties. As regards silica, sol-gel synthesis is particularly useful for tailoring nanoparticle size,
surface chemistry and shape just by controlling the reactions condition. The molecular precursors
employed are generally alkoxysilanes with general formula Si(OR)4, where R can be methyl, ethyl,
ecc., of which the most common is tetraethylorthosilicate (TEOS). The reaction is catalyzed by

27
acids or bases and can be carried out in water, in an organic solvent or in hydroalcolic solution1. A
typical reaction pathway is presented in figure 3.2:
Figure 3.2: Schematic of the sol-gel process: hydrolysis (1), water condensation (2a), silanol
condensation (2b).
Where the alkoxysilane undergo hydrolysis first (1) and condensation later (2). The obtained silica
material is chemically similar to the silica obtained by precipitation, but thanks to the much higher
possibility of controlling the reaction kinetics the control of the nanoparticle properties is more
favorable.
Sol-gel silica production for rubber compounds allows also for preparing the filler nanoparticles
directly inside the rubber matrix, via an in-situ approach. Many research groups studied this
possibility2,3
, obtaining nanocomposites with improved mechanical properties and a tailored growth
of silica nanoparticles in the matrix. In a previous investigation in my research group, it was
possible to tune the particle surface chemistry and also to slightly modulate the nanoparticle shape,
obtaining a direct correlation between the in-situ sol-gel reaction conditions and the morphological
and dynamo-mechanical properties of silica/rubber nanocomposites4,5
. These studies were useful as
model systems, in which the preparation conditions could be precisely controlled and gave
straightforward indications for improving conventional silica/rubber nanocomposites.
Despite the great potential of sol-gel technique over silica precipitation, the industrial production of
silica by this methodology is confined to high added value goods, like antireflective Amiran glasses,
silica-microencapsulated avobenzone for sunscreen creams and different supports for catalysis and
chromatography6. As regards the in-situ sol-gel synthesis, the topic is still an hot topic of academic
research for understanding the reinforcement mechanism in real nanocomposites.

28
3.2 Synthesis of shape-controlled anisotropic silica nanoparticles
To obtain shape-controlled amorphous silica NPs with a controlled aspect ratio is not an easy task.
The preparation methods of the oxide (e.g. hydrothermal, sol-gel, precipitation) yield spherical or
slightly irregular NPs. Few preparation methods to obtained shape-controlled silica nanoparticles
are reported here.
_ Elongated silica particles have been obtained as the core-shell of other oxides, exploiting the
shape of the native oxide (e.g. Fe2O37) and coating the particles with a layer of few nanometers of
silica.
_ Silica nanofibers were produced by electrospinning8 from a solution of TEOS; as a result, curly
nanofibers were deposited on the target of the electrospinning device.
_ Silica nanofibers were also produced by Chemical Vapor Deposition (CVD9) from silica
precursors deposited in a vacuum chamber. Fibers with high aspect ratio (>20) were obtained by
this procedure.
At the end, the most promising procedure for obtaining shape-controlled silica nanoparticles is the
sol-gel synthesis assisted by a templating agent, which consists in a component of the reaction
mixture that is intrinsically anisotropic, generally thanks to a process of self-assembling of the
templating system in the reaction conditions.
Generally a templating or structure-directing agent (SDA) system exploits the formation of
liquid/liquid interfaces that constrains the silica particle growth, which occurs just in the acqueous
phase. Different examples can be anisotropic micellar systems, or immiscible two-solvents systems,
in which the particle forms parallel10
or orthogonal11
to the interface between the two solvents.
The most versatile templating systems consists in cylindrical micelles of cetyl trimethyl ammonium
bromide (CTAB). This system was formerly employed for the preparation of MCM-41 silica
nanoparticles for catalysis, as a scaffold for obtaining silica nanostructure with high surface area,
leading to the formation of mesoporous channels due to the presence of the CTAB cylindrical
micelle. Later, the system was studied more in depth and the different shapes of CTAB micelles
were used to tune the morphology of the mesoporous channels. The reaction conditions
(concentration, temperature) in which the CTAB molecule forms micelles in water having different
shapes is reported in figure 3.2b. Furthermore, the reaction was carried out in the presence of a co-
structure directing agent (co-SDA) able to act as a reaction starting point in proximity of the
water/CTAB interface. In this way, combining the cylindrical shape of CTAB micelles and the
nature and amount of co-SDA, not only the pore structure but also the nanoparticle shape could be
controlled (figure 3.2a)12,13
.

29
This last method13
was chosen in the thesis for the preparation of shape-controlled silica
nanoparticles with different aspect ratios.
Figure 3.3: Schematic of the arrangement of anions around CTAB cylindrical micelle (section) (a);
phase diagram of the shape of CTAB micelles
3.3 Shape-controlled silica nanoparticles preparation
Shape controlled silica nanoparticles have been prepared by sol-gel reaction in an aqueous basic
medium using TEOS as molecular precursor. In a typical procedure, 4 g of CTAB were dissolved at
70°C in a solution of 14 mL of NaOH 2 M and 1920 mL of Milli-Q water. After 5 min of vigorous
stirring, 24.0 mL of TEOS and a suitable amount of MPTMS (3-mercaptopropyl)trimethoxysilane
(0, 1.0, 2.0, 2.5, 3.0 mL) were added. In this system, MPTMS is deprotonated and as an anion it
replaces the bromide ions surrounding CTAB micelles: this interaction is crucial to obtain a
structural control. The reaction was carried out for 2 hours for all the silica specimens13
.
The reaction mixture work-up procedure consists in the following steps: the mixture was filtered
and the powder was dispersed in a washing solution of 40 mL of HCl (37 wt%) and 300 mL of
ethanol. By stirring the sample for 24 h at 60°C it was possible to remove up to 98% of the CTAB.
Then, silica nanoparticles were suspended in water (5.0 wt %) and the slurry was equilibrated to pH
7.0 ± 0.2 by small amounts of ammonium hydroxide. Finally, silica powder was filtered and dried
in an oven at 120°C for 48 h. This protocol affords about 7 g of mesoporous silica nanoparticles
ready for compounding. The obtained shape-controlled silica nanoparticles were labeled SiO2-X,
where X stands for the aspect ratio of the filler nanoparticles.
Anions (Br-, co-SDA)
CTA+

30
Spherical and anisotropic silica nanoparticles have been synthesized by using
tetraethylorthosilicate, TEOS, (99%) as the main silica precursor. It was employed a surfactant,
cetyltrimethyl-ammonium bromide, CTAB, (98%), acting as a SDA. The control of the shape
anisometry was possible by varying the amount of (3-mercaptopropyl)trimethoxysilane, TMSPM
(95 %) in the reaction medium as a co-SDA. Milli-Q water with a resistivity > 18.2 M •cm was
used in order to avoid impurities that may disturb the sol-gel reaction.
3.4 Shape-controlled silica nanoparticles characterization
Microscopy techniques operating on different scales give complementary information about the
morphology of sol-gel obtained anisotropic silica nanoparticles.
Figure 3.4: SEM images of a) SiO2-1; b) SiO2-2; c) SiO2-5; d) SiO2-7 e) SiO2-10 samples. Scales
bar are 1 μm
SEM images (figure 3.4) allows to evaluate qualitatively the shape distribution in a wide range of
nanoparticles examined. In detail, SiO2-1 consist in spherical silica nanoparticles, with diameter
always around 100nm. SiO2-2 particles are all nonshperical, while in SiO2-5 and SiO2-7 particles
are clearly rod-like. As regards SiO2-10, the sample is constituted mainly by spherical particles and
just by a small amount of rod-like particle.

31
Figure 3.5: TEM images of a) SiO2-1; b) SiO2-2; c) SiO2-5; d) SiO2-7 e) SiO2-10 samples.
Images at higher resolution than SEM were obtained by Transmission Electron Microscopy on
silica nanoparticles. TEM images of SiO2-X (Fig. 3.5) show that silica NPs are spherical or rod-like
shaped, and that their aspect ratio depends on MPTSM/TEOS molar ratio. TEM microscopy also
allows to precisely determine the nanoparticle aspect ratio, averaging the image analysis on a
selected number of particles in a certain sample. From TEM images in figure 3.5, SiO2-1 particles
are mainly spherical with 80 nm diameter or slightly elongated with cross section 80 nm and
120 20 nm length (Figure 3.5 a). SiO2-2 samples (Figure 3.5 b) exhibit elongated particles. The
cross section of the rods is 80 10 nm, equal to SiO2-1, while the longest dimension is 200 40
nm (aspect ratio, AR, 2.5). Accordingly, SiO2-5 particles (Figure 3.5 c) and SiO2-7 (Figure 3.5
d) are rod-like shaped with 70 10 nm cross section, 380 80 nm (AR 5) and 480 100 nm
(AR 7) length, respectively.
As regards SiO2-10 the TEM image (Figure 3.5 e) shows a mixture of spherical particles with
larger diameter (100 - 150 nm) and a minor amount of rod-like particles with AR 10. This
particular morphology already evidenced in SEM investigations is due to the fact that when the
MPTSM/TEOS ratio becomes > 0.15, the shape control is lost.

32
Figure 3.6: HR TEM images of SiO2-2 (a), SiO2-5 (b), SiO2-7 (c) SiO2-10 (d).
Finally, HRTEM in figure 3.6 images show the internal structure of the anisotropic silica
nanoparticles, which is the witness of the silica growth mechanism in this micellar system. As
shown by HRTEM images, samples SiO2-2 (a), SiO2-5 (b), SiO2-7 (c) show ordered mesoporous
channel structure of few nanometers diameter, generated by the self assembled CTAB, around
which silica particles grow assisted by TMSPM. The appearance of periodical lattice fringes (inset
of fig. c) along the rods indicates the presence of helical channels inside the rods13
. Conversely,
spherical nanoparticles formed by TMSPM excess in SiO2-7 and particularly SiO2-10 (d) does not
possess any periodicity.
Actually, the formation of spherical nanoparticles without orientation of the mesoporous channel
was already observed at high concentrations of MPTMS as a co-SDA, and it was interpreted as a
result of an increase of electrostatic repulsive force, as the CTAB micelles are increasingly

33
surrounded by MPTMS. This would trigger a random disposition of the tubular micelles, which
results in a complete loss of the shape control.
Figure 3.7: N2 adsorption-desorption analysis of SiO2-5. The inset represent the pore size
distribution
The N2 adsorption-desorption isotherm of SiO2-X confirmed that all powders are mesoporous, with
a type IV isotherm. The adsorption-desorption curve and the pore distribution is reported for SiO2-5
as an example in Figure 3.7.
The mesopores have an average diameter of 2 nm and the specific surface area (SSA) is very
large due to high mesoporosity of silica samples. Nonetheless, external surface area values (Sext) are
much lower and similar between different powders. They were estimated from the values of density
, Specific Surface Area (SSA) and Desorption Cumulative Pore Volume DCPV, modeling the
shapes of SiO2-X as perfect spheres or cylinders with dimensions (main cross section and length)
obtained by TEM observations. These values are reported in table 3.1
SSA [m2/g] DCPV [cm
3/g] Sext [m
2/g] Density [g/cm
3]
SiO2-1 1107 1.54 159 1.74
SiO2-2 949 1.21 140 1.72
SiO2-5 1336 2.52 170 1.70
SiO2-7 1434 3.61 224 1.70
SiO2-10 1571 3.43 n.d. 1.70
Table 3.1: Characteristics of silica nanoparticles
34
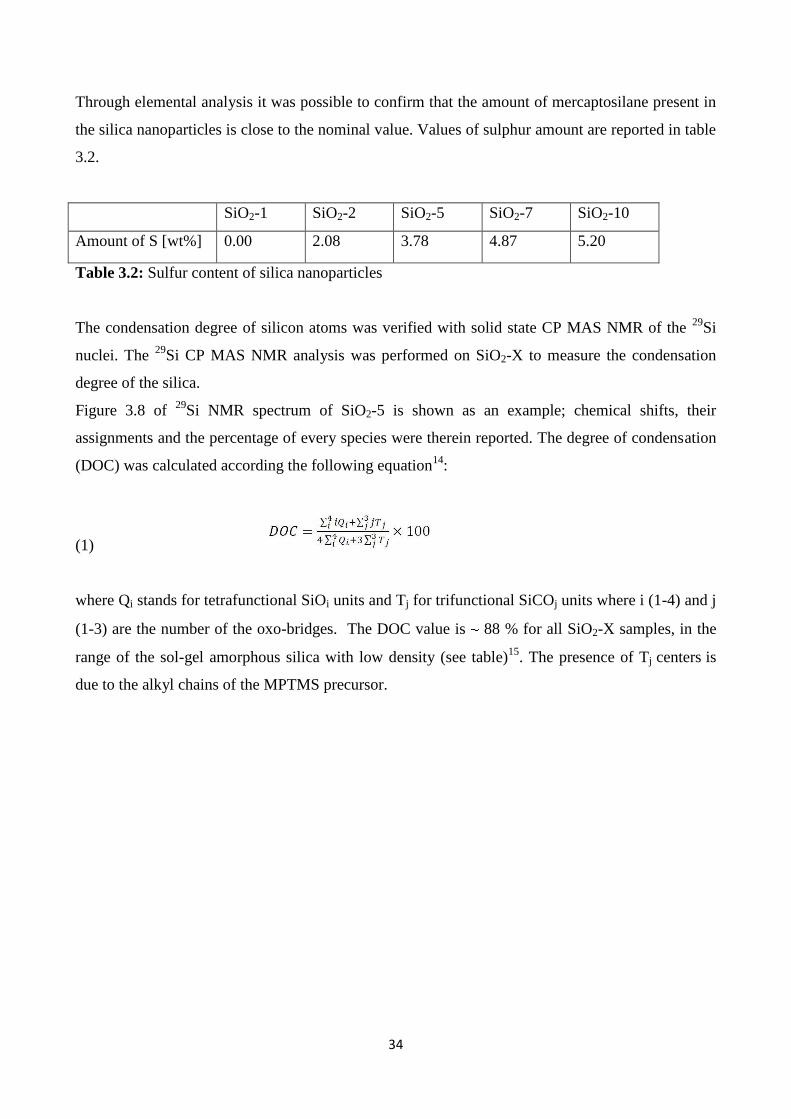
Through elemental analysis it was possible to confirm that the amount of mercaptosilane present in
the silica nanoparticles is close to the nominal value. Values of sulphur amount are reported in table
3.2.
SiO2-1 SiO2-2 SiO2-5 SiO2-7 SiO2-10
Amount of S [wt%] 0.00 2.08 3.78 4.87 5.20
Table 3.2: Sulfur content of silica nanoparticles
The condensation degree of silicon atoms was verified with solid state CP MAS NMR of the 29
Si
nuclei. The 29
Si CP MAS NMR analysis was performed on SiO2-X to measure the condensation
degree of the silica.
Figure 3.8 of 29
Si NMR spectrum of SiO2-5 is shown as an example; chemical shifts, their
assignments and the percentage of every species were therein reported. The degree of condensation
(DOC) was calculated according the following equation14
:
(1)
where Qi stands for tetrafunctional SiOi units and Tj for trifunctional SiCOj units where i (1-4) and j
(1-3) are the number of the oxo-bridges. The DOC value is 88 % for all SiO2-X samples, in the
range of the sol-gel amorphous silica with low density (see table)15
. The presence of Tj centers is
due to the alkyl chains of the MPTMS precursor.

35
Figure 3.8: 29
Si NMR spectrum of SiO2-5 sample. The chemical shifts, the assignments and the
percentage of every species calculated by the signal deconvolution are reported in the table.
3.5 Shape controlled silica/SBR nanocomposites preparation and curing
Nanocomposites of SBR and shape-controlled anisotropic silica particles
were obtained by mechanical mixing. In the tire industry, internal mixers and
two-rolling mills are the preferred solutions according to the mixing
requirements, see figure 3.9.
In internal mixers, two twins screws rotate counterwise inside an enclose
chamber, which on the top has a ram that apply a certain pressure on the
mixing formulate. The addition of ingredients is executed by raising the ram,
and effective mixing occurs just when the ram is applying pressure; some
advantage of the internal mixer are the possibility of applying a broad range
of temperatures and to achieve good mixing in a shorter time and with a lower
amount of volatile organic compounds (VOCs) released in atmosphere than
two-rolling mill. Conversely, two-rolling mill is more indicated for low-
temperature mixing stages (for example the introduction of curatives) and
allows to obtain good homogeneity of the final material.
Particularly for nanofillers, mixing conditions are crucial for obtaining the
desired materials properties: first, shearing forces should be enough to break
Figure 3.9:
Mixers used in
rubber industry

36
down the particle agglomerates. In the case of silica, the control of temperature and time allows for
a complete compatibilization with silane coupling agents of the hydrophilic oxide surface; in fact,
silica is typically added in an internal mixer step.
In the compounding recipes we used: styrene butadiene
rubber, SLR 4630 from Styron Europe GmbH. Bis (3-
triethoxysilylpropyl) disulfide, TESPD, was purchased
from Aldrich; this coupling agent is able to react with
silica surface during compounding, thus favouring
nanoparticle distribution troughout the matrix.
Furthermore, it can react with rubber double bonds
during vulcanization creating sulphur-carbon bonds and improving the filler-rubber interaction.
N,phenyl-N’-alkyl-p-phenylendiamine, 6 PPD, used as an antidegradant was Santoflex-6 PPD
from Flexsys; stearic acid was Stearina TP8 from Undesa; sulphur was S8 (soluble sulphur) from
Zolfoindustria; zinc oxide was from Zincol Ossidi; N-cycloesil-2-benzothiazole sulfenamide, CBS,
was Vulkacit CZ/C from Lanxess.
Ex-situ synthesis of nanocomposites was performed by blending technique in an internal twin-screw
mixer for incorporating the shape-controlled silica nanoparticles in styrene-butadiene rubber matrix.
The technique is well-known in the tire industry and described in various ASTM standards for
preparation of rubber nanocomposites for tire application (for example, D 3188, D 3185 1A, ecc.).
The whole procedure is separated in three mixing steps at different temperature, according to the
thermal stability of the ingredient: for example, silane coupling agents and silica are mixed in the
high temperature step, in order to obtain complete silica surface functionalization, while curatives
must be added in the low temperature step to avoid premature vulcanization.
In the first step, rubber is masticated at 140°C and 60 rpm twin screw speed, then silica
nanoparticles are included in three subsequent aliquots together with the silane. The same was for
preparations of composites containing a mixture of fillers of different shape. The liquid silane
coupling agent TESPD was deposited on the first fraction of silica prior to addition in rubber. Two
minutes after the last silica addition 6PPD, Zinc oxide and stearic acid are added; this lag time
avoids secondary reaction between ZnO with silica silanols16
. The amounts of compounding
ingredients are listed in table 3.3a and expressed in phr (parts per hundred rubber).
Table 3.4 compounding method of
SBR-SX-W nanocomposites

37
In the second step, the material obtained in stage 1 is reloaded in the internal mixer operating at
90°C at 60 rpm. CBS and sulfur are then added and mixed for 2 minutes (table 3.3b). The obtained
material is finally processed in a two-rolling mill as a third step at 50°C for 3’ to improve filler
distribution in the sample.
The amounts of ingredients are listed in tab. 3.4 for
nanocomposites containing 12, 25, 35 and 45 phr of silica;
the silane amount depends on the amounts of silica, while
the amount of all the other ingredients is relative to
rubber, so it is the same for all the silica concentrations
explored. Composites were further molded in a two-roll
mill for 2 min to produce sheets of about 2 cm thick,
suitable for the vulcanization process. Hereafter uncured
nanocomposites are labeled SBR-SX-W.
Cured composites were vulcanized in mould in a
hydraulic press at 170°C, under the pressure of 200 bar at
their optimum vulcanization time (see curing kinetics in
appendix A). The shape of the mould depends on the
dynamo mechanical analysis requested as reported in table 3.6.
Analysis DMA Compression
Dynamics
Tensile/Mullins
Shape
Size 2,5 x 54 x 91 mm 1,8 mm x 1,2 mm Ø ISO 4 - Dumbbell
Table 3.6: Shape of vulcanized V-SBR-SX-W samples for dynamo-mechanical tests
In the following cured nanocomposites are called V-SBR-SX-W.
Table 3.5 compounding receipt of
SBR-SX-W nanocomposites

38
References
[1] J. Brinker, G. W. Scherer, Sol-gel Science: The Physics and Chemistry of Sol-gel Processing,
Gulf Professional Publishing, 1990
[2] M. Messori and M. Fiorini, J. Appl. Polym. Sci., 2011, 119, 3422–3428
[3] S. Kohjiya and Y. Ikeda, Rubber Chem. Technol., 2000, 73, 534–550
[4] R. Scotti, L. Wahba, M. Crippa, M. D'Arienzo, R. Donetti, N. Santo and F. Morazzoni, Soft
Matter, 2012, 8, 2131–2143
[5] L. Wahba, M. D'Arienzo, R. Donetti, T. Hanel, R. Scotti, L. Tadiello and F. Morazzoni, RSC
Advances, 2013, 3, 5832
, L. M. Ilharco, M. Pagliaro, Chem. Rev. 2013,
113, 6592−6620
[7] Sanchez-Ferrer AS, Reufer M, Mezzenga R, Schurtenberger P, Dietsch H. Nanotechnology
2010, 21, 185603
[8] An GH, Jeong SY, Ahn HJ. Mater Lett 2011, 65, 2377-80
[9] Choi CS, Yoon JH. Appl Phys A, 2012, 108, 509-13
[10] J Zhang, M Liu, A Zhang, K Lin, C Song, X Guo, Solid State Sciences 2010, 12, 267–273
[11] J. Wang, J. Zhang, B. Y. Asoo, G. D. Stucky, JACS 2003, 125, 13966-13967
[12] S. Sadasivan, D. Khushalani, S. Mann, J. Mater. Chem., 2003, 13, 1023–1029
[13] X Du, J He Dalton Trans., 2010, 39, 9063-9072
[14] S.Dirè, V.Tagliazucca, E.Callone, A.Quaranta, Mater.Chem.Phys. 2011, 126, 909-917
[15] V.Gualandris, F.Babonneau, M.Janicke, B.Chmelka, J.Sol-Gel Sci.Technol., 1998, 12, 75-80
[16] N. Hewitt, P.Ciullo, Compounding precipitated silica in elastomers, William Andrew
publishing, Norwick, NY

39
Chapter 4
MORPHOLOGY AND PHYSICO-CHEMICAL
PROPERTIES OF SCS/SBR NANOCOMPOSITES
40
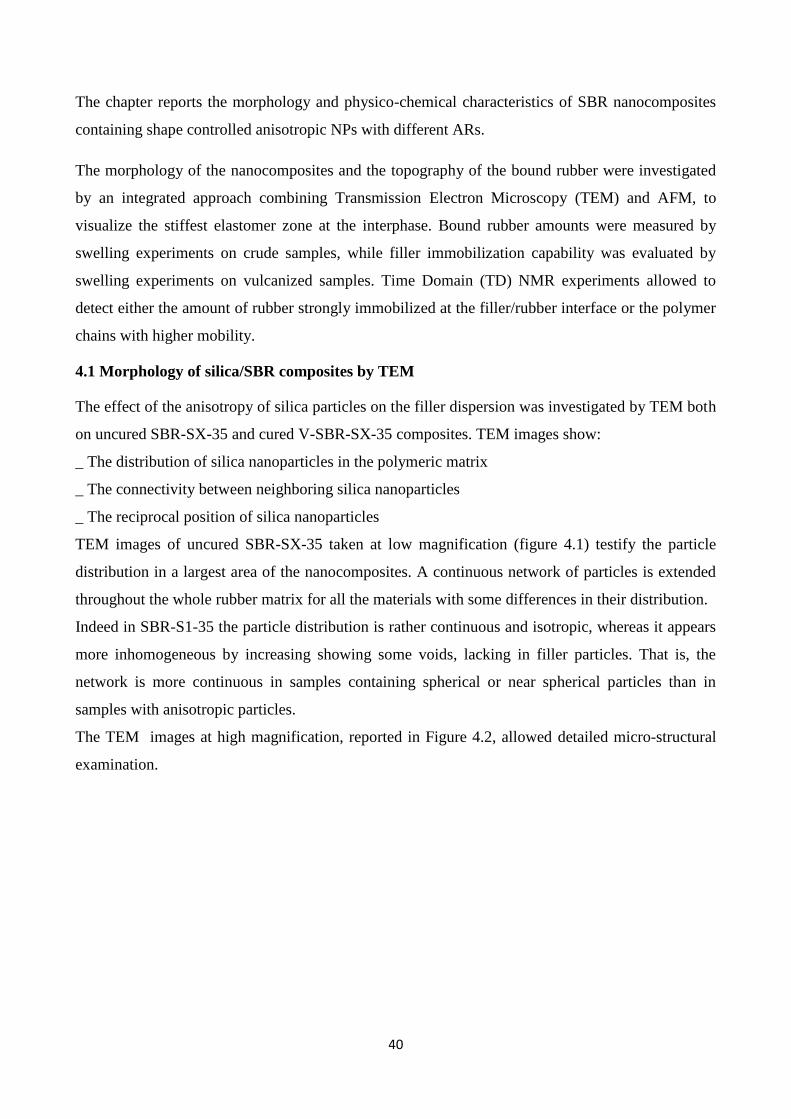
The chapter reports the morphology and physico-chemical characteristics of SBR nanocomposites
containing shape controlled anisotropic NPs with different ARs.
The morphology of the nanocomposites and the topography of the bound rubber were investigated
by an integrated approach combining Transmission Electron Microscopy (TEM) and AFM, to
visualize the stiffest elastomer zone at the interphase. Bound rubber amounts were measured by
swelling experiments on crude samples, while filler immobilization capability was evaluated by
swelling experiments on vulcanized samples. Time Domain (TD) NMR experiments allowed to
detect either the amount of rubber strongly immobilized at the filler/rubber interface or the polymer
chains with higher mobility.
4.1 Morphology of silica/SBR composites by TEM
The effect of the anisotropy of silica particles on the filler dispersion was investigated by TEM both
on uncured SBR-SX-35 and cured V-SBR-SX-35 composites. TEM images show:
_ The distribution of silica nanoparticles in the polymeric matrix
_ The connectivity between neighboring silica nanoparticles
_ The reciprocal position of silica nanoparticles
TEM images of uncured SBR-SX-35 taken at low magnification (figure 4.1) testify the particle
distribution in a largest area of the nanocomposites. A continuous network of particles is extended
throughout the whole rubber matrix for all the materials with some differences in their distribution.
Indeed in SBR-S1-35 the particle distribution is rather continuous and isotropic, whereas it appears
more inhomogeneous by increasing showing some voids, lacking in filler particles. That is, the
network is more continuous in samples containing spherical or near spherical particles than in
samples with anisotropic particles.
The TEM images at high magnification, reported in Figure 4.2, allowed detailed micro-structural
examination.

41
Figure 4.1: TEM images at low magnifications of crude SBR-SX-35 composites: a) SBR-S1-35; b)
SBR-S2-35; c) SBR-S5-35; d) SBR-S7-35; e) SBR-S10-35

42
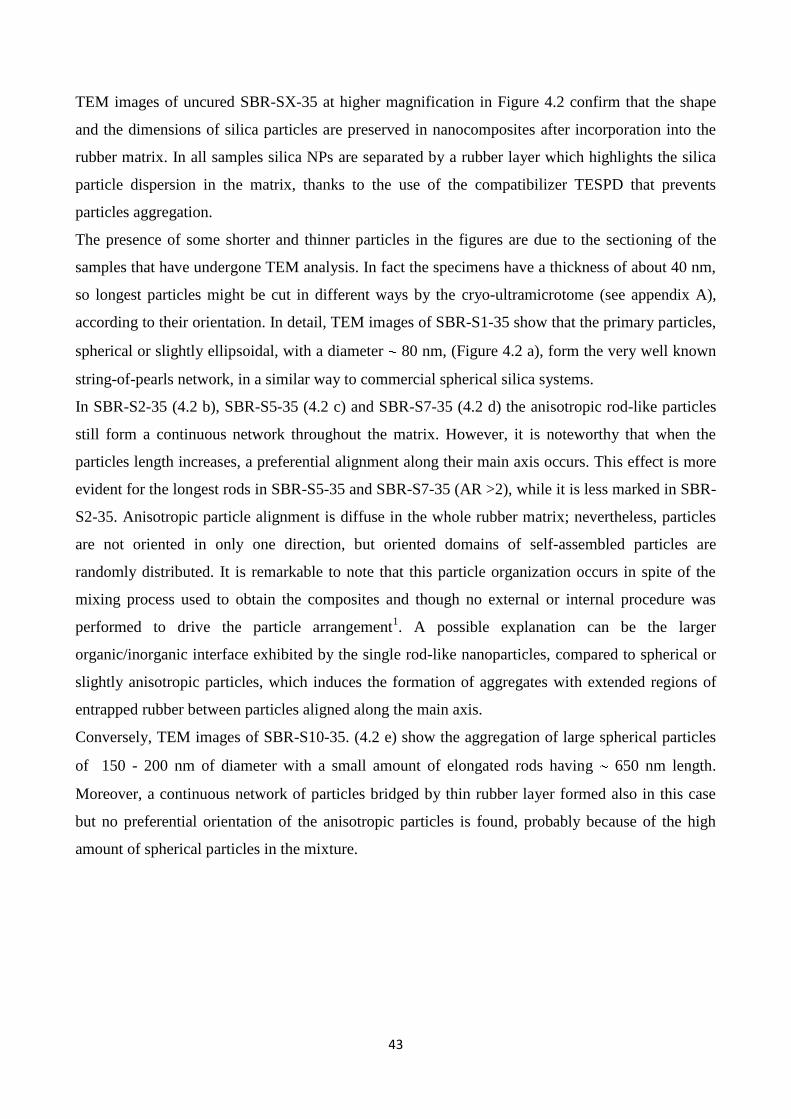
Figure 4.2: TEM images at high magnifications of crude SBR-SX-35 composites: a) SBR-S1-35;
b) SBR-S2-35; c) SBR-S5-35; d) SBR-S7-35; e) SBR-S10-35.
43
TEM images of uncured SBR-SX-35 at higher magnification in Figure 4.2 confirm that the shape
and the dimensions of silica particles are preserved in nanocomposites after incorporation into the
rubber matrix. In all samples silica NPs are separated by a rubber layer which highlights the silica
particle dispersion in the matrix, thanks to the use of the compatibilizer TESPD that prevents
particles aggregation.
The presence of some shorter and thinner particles in the figures are due to the sectioning of the
samples that have undergone TEM analysis. In fact the specimens have a thickness of about 40 nm,
so longest particles might be cut in different ways by the cryo-ultramicrotome (see appendix A),
according to their orientation. In detail, TEM images of SBR-S1-35 show that the primary particles,
spherical or slightly ellipsoidal, with a diameter 80 nm, (Figure 4.2 a), form the very well known
string-of-pearls network, in a similar way to commercial spherical silica systems.
In SBR-S2-35 (4.2 b), SBR-S5-35 (4.2 c) and SBR-S7-35 (4.2 d) the anisotropic rod-like particles
still form a continuous network throughout the matrix. However, it is noteworthy that when the
particles length increases, a preferential alignment along their main axis occurs. This effect is more
evident for the longest rods in SBR-S5-35 and SBR-S7-35 (AR >2), while it is less marked in SBR-
S2-35. Anisotropic particle alignment is diffuse in the whole rubber matrix; nevertheless, particles
are not oriented in only one direction, but oriented domains of self-assembled particles are
randomly distributed. It is remarkable to note that this particle organization occurs in spite of the
mixing process used to obtain the composites and though no external or internal procedure was
performed to drive the particle arrangement1. A possible explanation can be the larger
organic/inorganic interface exhibited by the single rod-like nanoparticles, compared to spherical or
slightly anisotropic particles, which induces the formation of aggregates with extended regions of
entrapped rubber between particles aligned along the main axis.
Conversely, TEM images of SBR-S10-35. (4.2 e) show the aggregation of large spherical particles
of 150 - 200 nm of diameter with a small amount of elongated rods having 650 nm length.
Moreover, a continuous network of particles bridged by thin rubber layer formed also in this case
but no preferential orientation of the anisotropic particles is found, probably because of the high
amount of spherical particles in the mixture.
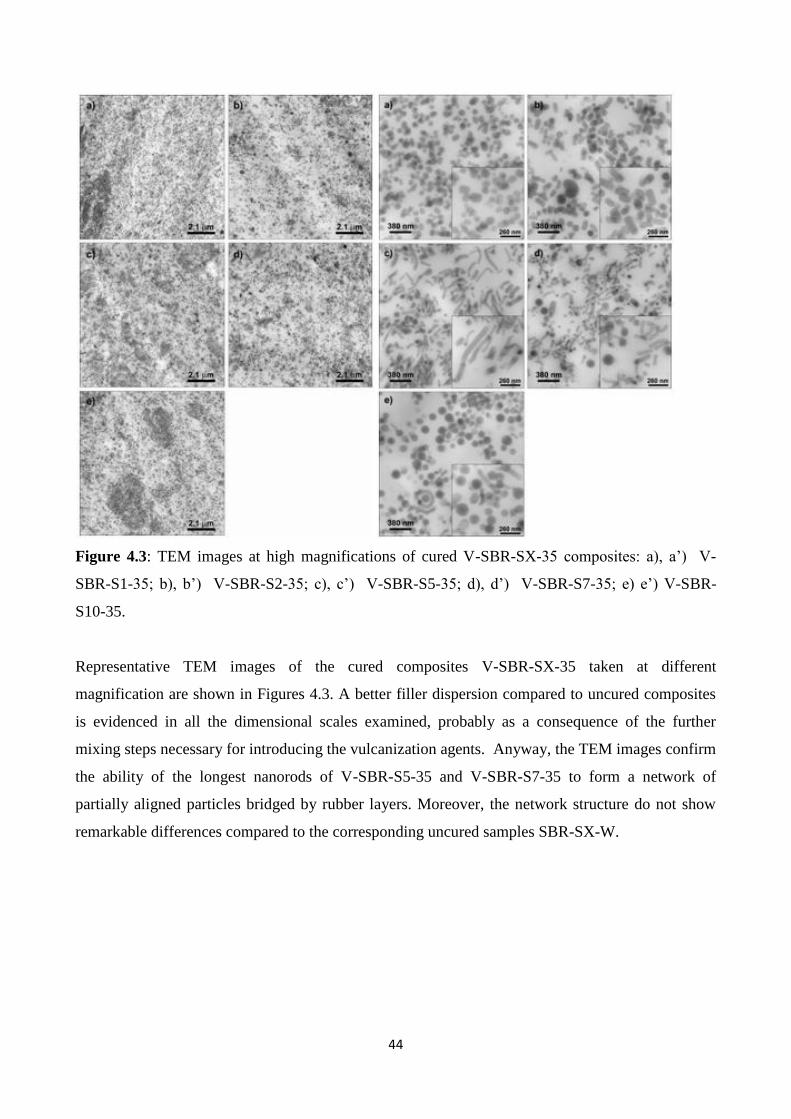
44
Figure 4.3: TEM images at high magnifications of cured V-SBR-SX-35 composites: a), a’) V-
SBR-S1-35; b), b’) V-SBR-S2-35; c), c’) V-SBR-S5-35; d), d’) V-SBR-S7-35; e) e’) V-SBR-
S10-35.
Representative TEM images of the cured composites V-SBR-SX-35 taken at different
magnification are shown in Figures 4.3. A better filler dispersion compared to uncured composites
is evidenced in all the dimensional scales examined, probably as a consequence of the further
mixing steps necessary for introducing the vulcanization agents. Anyway, the TEM images confirm
the ability of the longest nanorods of V-SBR-S5-35 and V-SBR-S7-35 to form a network of
partially aligned particles bridged by rubber layers. Moreover, the network structure do not show
remarkable differences compared to the corresponding uncured samples SBR-SX-W.

45
Figure 4.4: TEM images at different magnifications of cured V-SBR-MA-35 (a, b, c) and V-SBR-
MD-35 composites (d, e, f).
TEM images at low magnification of cured V-SBR-MA-35 (a) and V-SBR-MD-35 (d) testify the
continuous particles network extended throughout the whole rubber matrix, in both cases evenly
distributed. TEM images at higher magnification of V-SBR-MA-35 (b, c) and V-SBR-MD-35 (e, f)
confirm that the shape and the dimensions of silica particles are preserved in nanocomposites after
incorporation into the rubber matrix. As in pure-shape nanocomposites, silica NPs are separated by
a rubber layer which highlights the silica particle dispersion in the matrix, thanks to the TESPD that
prevents particles aggregation. Anisotropic SiO2-S5 silica nanoparticle alignment is much reduced
for both samples, with respect to V-SBR-S5-35. Both with dominant presence of SiO2-S1 (V-SBR-
MA-35) and of SiO2-S5 (V-SBR-MD-35) in the filler mixture, anisotropic particle alignment is
hindered by the presence of spherical particles, that are often separating anisotropic particles
domains. It can be concluded that the presence of a dual-shape filler system (SiO2-S1 and SiO2-S5)
results in the formation of an hybrid network regardless the ratio between the differently shaped
nanoparticles, which is expected to further enhance the rubber immobilization.
4.2 Heterogeneities detection in silica/SBR composites by AFM
The nanocomposite morphology related to the rubber/particle interphase were investigated by AFM

46
operating in tapping mode in air. The analysis was performed on fresh surfaces after freeze-
fracturing the materials. First, AFM imaging is a surface technique and the freeze-fractured
specimen preparation causes the longest silica particles to be cut, lowering the probability that high
AR silica particles completely lie on the fractured surface. This actually represents a useful tool to
evidence morphological characteristics not accessible by TEM on cryo-cut nanocomposites. Not
only conventional height images but also amplitude error images were used, because the amplitude
error originates from the vertical deflection of the AFM tip, that shows sharper contrast at the edges
of materials heterogeneities than heigth signal.
V-SBR-S1-35 3D image (Figure 4.5 a) shows homogeneous dispersion of particles, with small
contact zone between the neighbor particles. This distribution is similar to that reported in the
literature for spherical silica particles in rubber nanocomposites and described as string-of-pearls2.
2D amplitude error image (Figure 4.5 a’) evidences well distinguishable rubber layers around
particles, slightly overlapping at the particle contact points.
Figure 4.5. 3D height (up) and 2D amplitude error (down) AFM images of a, a’) V-SBR-S1-35;
b, b’) V-SBR-S2-35; c, c’) V-SBR-S5-35 nanocomposites.
In the case of V-SBR-S2-35 and, mainly, V-SBR-S5-35, 3D images show less homogeneous
particle dispersion (Figure 4.5b and 4.5c). Most silica particles are aggregated, showing rubber
lacking zones. The aggregates are differently shaped and their image corresponds to the cross-
section of the aligned anisotropic particle domains previously described by TEM, as shown in the
schematic model of Figure 4.6.

47
Figure 4.6. Model representing the self-assembly of differently shaped particles and the
corresponding fractured surfaces in (a) V-SBR-S1-35 loaded with spherical particles and (b) V-
SBR-S5-35 loaded with rod-like particles (AR=5). The models are compared with significant TEM
(left) and 2D AFM (right) images of the same samples.
Amplitude error images of V-SBR-S2-35 and V-SBR-S5-35 (Figure 4.5 b’ and c’) show rubber
layers completely surrounding both the particle aggregates and the residual single particles in the
matrix. Moreover, the aligned anisotropic particles share the rubber layers and in addition entrap a
larger amount of rubber in the particle domains than the spherical ones do (Figure 4.6). From these
observations, it seems that the particle alignment favors an enlargement of the immobilized rubber
region.
In order to evaluate the thickness of the rubber layer surrounding silica particles, AFM phase
images of nanocomposites were recorded. The phase signal is related to the energy dissipated by the
tapping tip while scanning the surface, and gives information at the nanometric scale about the size
and the shape of local rubber heterogeneities, identifying regions with different stiffness3.
According to recent studies4, the thickness of the rubber layer surrounding isolated silica particles
can be measured by the difference between the particle section detected in the phase images and
that which is measured in the height images.
Height and phase images of V-SBR-SX-35 are reported in figure 4.7. For isolated nanoparticles the
rubber heterogeneous layer thickness (Tr ) can be calculated by the expression4:
(1)
where WPh and WHe are the particle section widths from phase and height image, respectively, as

48
indicated by the insets in Figure 4.6 (Values are reported in Table 4.1 ). For all samples the layer
thickness resulted 15 ± 5 nm, irrespective of the different SX particle shapes.
The volume of heterogeneous rubber in the layers surrounding isolated silica particles can be
roughly estimated by modeling the shapes of SiO2-X as perfect spheres or cylinders having
dimensions (main cross section and length) obtained by TEM observations. The volume resulted
32 12% of the total rubber for S1, 28 11% for S2 and 25 9% for S5, slightly dependent on the
particle shape. This suggests that the larger amount of rubber immobilized in the domains of the
anisotropic silica NPs, evidenced by the AFM images (Figures 4.5 and 4.6), cannot be related to the
shape of the isolated particles, but it results from the alignment of the rod-like particles. No direct
indications about the different mobility of the rubber chains and, consequently, about the nature of
the rubber interactions can be directly obtained by AFM images. They will be investigated and
discussed in Time Domain NMR paragraph (4.4).
V-SBR-S1-35 V-SBR-S2-35 V-SBR-S5-35
149 180 15 63 94 15 125 157 16
143 173 15 63 99 18 134 162 14
127 155 16 64 90 13 174 215 20
Table 4.1: Particles widths from height WHe and phase WPh images and calculated rubber layer
thickness Tr.
Figure 4.7. Height and phase images of a, a’) V-SBR-S1-35, b, b’) V-SBR-S2-35 and c, c’) V-
SBR-S5-35 freeze-broken surfaces. The insets represent the image analysis of isolated NPs. Particle
width from phase (WPh) and height (WHe) images are indicated.

49
4.3 Physico-chemical properties of rubber nanocomposites
4.3.1 Thermogravimentric analysis: effective filler introduction
TGA analysis were conducted on uncured SBR-SX-35 nanocomposites to verify the effective filler
insertion in rubber, hence confirming the comparison of nanocomposites with same silica loading
differing only by nanoparticle shape. An oxidative gas flow was used as reported in appendix A.
Weight losses in the high temperature range (200-1000°C) are in accordance with the complete
oxidation of the organic components of the nanocomposites. The residual at 1000°C accounts for
the 22.1%, 22.5% and 23.2% of the dry weight respectively in V-SBR-S1-35, V-SBR-S2-35 and V-
SBR-S5-35, in good accordance with the original silica loading (35 phr), considering also the
degradation of filler surface functionalities (silanols, TESPD, ecc.).
4.3.2 Swelling experiments
Solvent extraction experiments were performed on uncured SBR-SX-35 samples to estimate the
amount of rubber immobilized inside and around the nanoparticles domains. Extractable fractions
(f%) and bound rubber (Br%) calculated according to method described in appendix A are reported
in Table 4.2 for SBR-SX-35 samples. The results demonstrate that in all uncured composites a large
amount of rubber is significantly immobilized. Furthermore, this amount increases by increasing the
shape factor of the silica particles and is highly marked in composites containing elongated NPs, as
evidenced by the decrease of the f value and the increase of Br%. The high percentage of bound
rubber is indicative of a high interaction with silica and is related to a high degree of reinforcement
by the filler5. Measurements were not possible on nanocomposites with lower filler amounts (SBR-
SX-25 and SBR-SX-12) because they disgregate in the presence of solvent: this is related to the
lack of a filler network diffuse throughout the whole material5.

50
Swelling experiments were performed also on cured V-SBR-W-SX samples to obtain indications
about the filler capability of immobilized rubber. The absolute swelling ratios ( ) and the
equilibrium swelling ratios of the rubber phase ( ) of V-SBR-SX-W nanocomposites were
calculated according to equations in appendix A and are reported in Table 4.3.
SBR-S1-35 SBR-S2-35 SBR-S5-35
f % 62.6 55.7 56.0
Br% 15.5 24.8 24.4
Table 4.2: Extractable and bound rubber fractions of SBR-SX-35 from swelling measurements on
crude composites
The f % values are much lower than for uncured samples because of the crosslinking provided by
the vulcanization process, that hinders rubber dissolution in toluene. In fact, swelling data on cured
nanocomposite do not allow direct calculation of the bound rubber amount, but allow to estimate
the filler immobilization capability according to the swelling ratios. In fact, according to the Kraus
methodology for treating swelling measurement of nanocomposites containing different nanofillers,
at increasing filler amount the restriction imposed by the filler to rubber increase6. The extent to
which this increase takes place can be related to a parameter c that depends only on the nature of
filler. Parameter can be calculated by the slope of the straight line obtained from the plot of Qr/Qr0
against .
Table 4.3: Extractable fraction, absolute and relative swelling ratios of V-SBR-SX-W
nanocomposites.
V-SBR-
S1-12
V-SBR-
S2-12
V-SBR-
S5-12
V-SBR-
S1-25
V-SBR-
S2-25
V-SBR-
S5-25
V-SBR-
S1-35
V-SBR-
S2-35
V-SBR-
S5-35
Q 5,08 5,97 8,83 4,90 4,46 6,78 4,12 4,12 3,88
Qr 5,32 6,28 9,33 5,43 4,93 7,57 4,75 4,76 4,46
Qr/Qr0 0,547 0,643 0,951 0,528 0,481 0,730 0,443 0,444 0,418
f % 22 21 23 19 17 13 8 7 8

51
Figure 4.8: Reduced values of swelling ratios Qr/Qr0 plotted against reduced filler volume fraction
Ф/(1-Ф), for V-SBR-S1-W (), V-SBR-S2-W () and ) V-SBR-S5-W () nanocomposites.
The values of c for V-SBR-SX-W composites calculated by the slopes of the plots reported in
Figure are 0,123 for V-SBR-S1-W; 0,176 for V-SBR-S2-W and 0,532 for V-SBR-S5-W. The
values of c increase with the AR of the nanofillers showing that the swelling restriction is more
extended in the presence of nanorods in comparison with the spherical particles. This result is
consistent with an increasing immobilization capability at the highest ARs.
The high values of Qr/Qr0 in V-SBR-S5-W at low silica loading compared to V-SBR-S2-W and V-
SBR-S1-W, are related to its higher swelling degree due to the easier penetration of the solvent into
the crosslinked composites. We suggest that this effect may be due to higher free volume due to a
decrease of the packing density of the unbound rubber matrix induced by the formation of domains
of aligned particles. This makes the composite more accessible to the solvent and more swellable.
At the highest silica loading, the swelling restriction due to immobilized rubber prevails, and Qr/Qr0
of V-SBR-S5-W strongly decrease.
4.4 Time domain (TD) NMR: mobility regimes of polymer chains
Low field 1H NMR measurements were performed using Magic Sandwich Echo (MSE) to
investigate the mobility of rubber chains close to the filler particles, distinguishing between the
motional regimes of tightly immobilized and more loosely interacting and free rubber. To better
characterize these less immobilized fractions of rubber matrix, excluding possible contributions
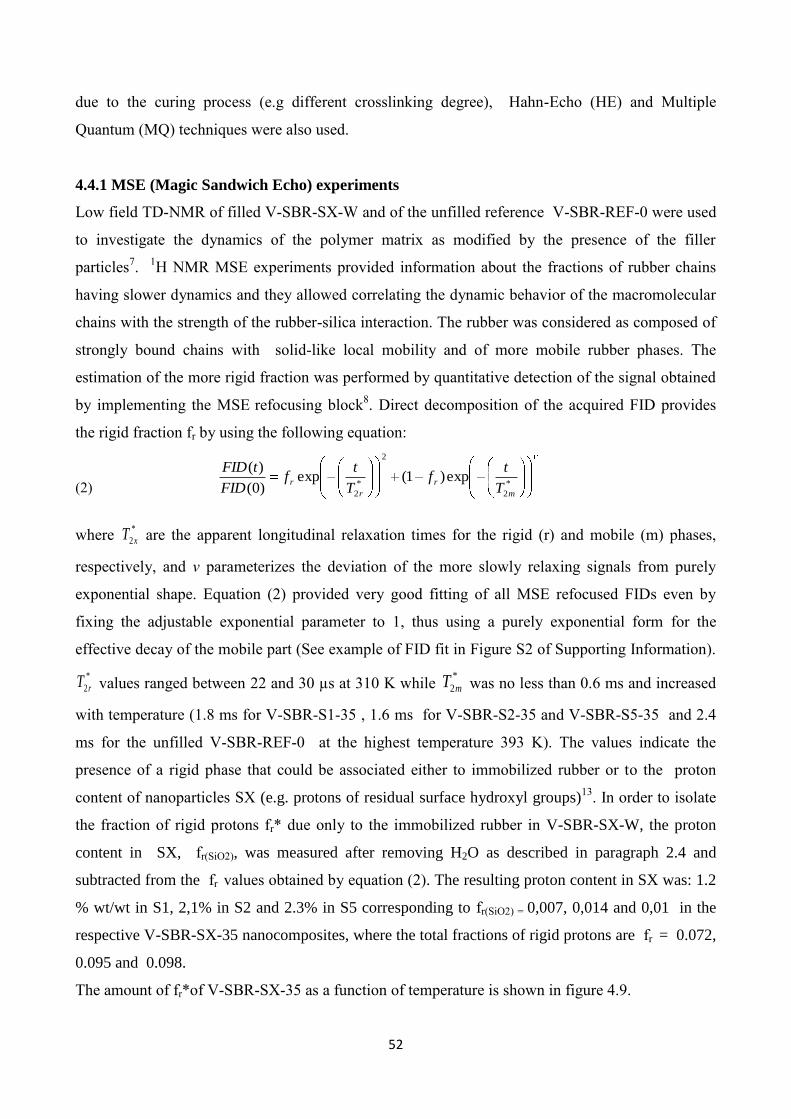
52
due to the curing process (e.g different crosslinking degree), Hahn-Echo (HE) and Multiple
Quantum (MQ) techniques were also used.
4.4.1 MSE (Magic Sandwich Echo) experiments
Low field TD-NMR of filled V-SBR-SX-W and of the unfilled reference V-SBR-REF-0 were used
to investigate the dynamics of the polymer matrix as modified by the presence of the filler
particles7.
1H NMR MSE experiments provided information about the fractions of rubber chains
having slower dynamics and they allowed correlating the dynamic behavior of the macromolecular
chains with the strength of the rubber-silica interaction. The rubber was considered as composed of
strongly bound chains with solid-like local mobility and of more mobile rubber phases. The
estimation of the more rigid fraction was performed by quantitative detection of the signal obtained
by implementing the MSE refocusing block
8. Direct decomposition of the acquired FID provides
the rigid fraction fr by using the following equation:
(2)
*
2
2
*
2
exp)1(exp)0(
)(
m
r
r
rT
tf
T
tf
FID
tFID
where *
2xT are the apparent longitudinal relaxation times for the rigid (r) and mobile (m) phases,
respectively, and v parameterizes the deviation of the more slowly relaxing signals from purely
exponential shape. Equation (2) provided very good fitting of all MSE refocused FIDs even by
fixing the adjustable exponential parameter to 1, thus using a purely exponential form for the
effective decay of the mobile part (See example of FID fit in Figure S2 of Supporting Information).
*
2rT values ranged between 22 and 30 µs at 310 K while *
2mT was no less than 0.6 ms and increased
with temperature (1.8 ms for V-SBR-S1-35 , 1.6 ms for V-SBR-S2-35 and V-SBR-S5-35 and 2.4
ms for the unfilled V-SBR-REF-0 at the highest temperature 393 K). The values indicate the
presence of a rigid phase that could be associated either to immobilized rubber or to the proton
content of nanoparticles SX (e.g. protons of residual surface hydroxyl groups)13
. In order to isolate
the fraction of rigid protons fr* due only to the immobilized rubber in V-SBR-SX-W, the proton
content in SX, fr(SiO2), was measured after removing H2O as described in paragraph 2.4 and
subtracted from the fr values obtained by equation (2). The resulting proton content in SX was: 1.2
% wt/wt in S1, 2,1% in S2 and 2.3% in S5 corresponding to fr(SiO2) = 0,007, 0,014 and 0,01 in the
respective V-SBR-SX-35 nanocomposites, where the total fractions of rigid protons are fr = 0.072,
0.095 and 0.098.
The amount of fr*of V-SBR-SX-35 as a function of temperature is shown in figure 4.9.

53
Figure 4.9: immobilized polymer fraction fr* as a function of temperature of cured V-SBR-SX-35
(black symbols) and uncured SBR-SX-35 (white symbols) nanocomposites loaded with S1
(,), S2 (,) and S5 (, ) silica particles compared to fr of unfilled compound V-SBR-
REF-0 () and SBR-REF-0 ( ). Lines are guides for the eye. Error bars of the rigid fraction
(omitted) are ±0.01.
The data strongly evidence that the quantity of rigid protons in the rubber surrounding silica NPs
varies with the particle AR. The large amount of the rigid fraction even at T > Tg + 100 K, indicates
a strong interaction between rubber chains and the fillers.
Considering the error 0.01 for the calculated rigid fraction, there is no significant difference
between V-SBR-S2-35 and V-SBR-S5-35 having the highest amounts of rigid proton (respectively
8,1 % and 8.3 % of the total rubber at 313 K), while V-SBR-S1-35 loaded with spherical particles
shows a lower amount of it (6,5 %). The rigid component of rubber is substantially absent in
unfilled V-SBR-REF-0.
Modeling the shapes of SiO2-X as perfect spheres or cylinders, the thickness of rubber immobilized
as homogeneous layer around isolated silica particles can be roughly estimated. It resulted 3-5.5
nm, in agreement with similar systems reported in the literature9. This thickness is associated with a
primary layer of tightly bound rubber, strongly interacting with the silica particles through TESPD
grafted on the silica surface10
.
The difference in the rigid fraction between spherical and rod-like particles is in principle
attributable to the formation of an interparticle domain which, in the presence of anisotropic
particles, immobilizes larger amounts of rubber. This result was supported by the MSE NMR

54
experiments performed at different silica loading. In figure 4.10, the values of fr*
vs the filler
loading (expressed as volume fraction of silica in the nanocomposite) of SBR-SX-12, SBR-SX-20,
SBR-SX-25 and SBR-SX-35 measured at 313 K are reported. In the composites with the lowest
silica content, 12 phr, where filler particles are highly dispersed in the rubber without any
alignment34
, fr* values are similar for both isotropic and anisotropic particles. Instead increasing the
amount of filler (20, 25 and 35 phr) the difference in fr* value between spherical and rod-like shape
increases.
The non-linearity of the rigid fraction against the silica loading, may possibly be explained by the
overlap of the rubber layers of neighboring particles (both spherical and anisotropic), observed
also in AFM and TEM images. The larger rubber confinement in the rod domains
compared to that in the presence of spherical particles is confirmed by the different slopes of the fr*
trends of V-SBR-S1-W ,V-SBR-S2-W and V-SBR-S5-W.
The difference between the fraction of the immobilized rubber evaluated by the MSE NMR,
compared to that by AFM, suggests that the latter technique, which shows the size and the shape of
local heterogeneous rubber zones surrounding the particles, reveals a layer constituted by both
tightly immobilized and outermost rubber chains, cross-linked or entangled with the primary layer17,
18.
Figure 4.10. Immobilized polymer fraction fr* at 313 K as a function of filler volume of V-SBR-
S1-W(),V-SBR-S2-W () and V-SBR-S5-W () nanocomposites at different filler loading
0
0.01
0.02
0.03
0.04
0.05
0.06
0.07
0.08
0.09
0.1
0 0.02 0.04 0.06 0.08 0.1 0.12 0.14 0.16 0.18
Rig
id f
ract
ion
at
31
3K
Filler volume fraction

55
(W=12, 20, 25, 35) and of unfilled cured rubber V-SBR-REF-0 (). Error bars of the rigid fraction
(omitted) are ±0.01. Dotted lines are guides for the eye.
The absence of significant difference in the rigid rubber fraction between S2 and S5 (Figure 4.10),
indicates that the total amount of rigid rubber in the primary layers around these anisotropic fillers
is about the same.
MSE experiments were performed also on the compounds SBR-SX-35 and SBR-REF-0 before
vulcanization. Interestingly, the amount of rigid rubber is very similar to that calculated for V-SBR-
SX-35 (Figure 4.9). This confirms that the effect on the relaxation time is not due to a diffuse
hardening of the rubber, but it is a local effect active even before the curing, relatable to the
immobilization of the polymer chains interacting with the silica particle.
4.4.2 HE (Hahn echo) experiments
In order to better investigate both the outermost rubber chains more loosely interacting with the
primary layer of tightly immobilized rubber and the other less immobilized rubber fractions, the
dynamics of the rubber chains were studied by Hahn echo NMR25
measurements performed on V-
SBR-SX-35 and on the uncured compound SBR-SX-3525, 26
. The fitting of Hahn echo decay allows
evidencing the protons with relaxation rates slower than those of the extremely rigid fractions
detected by MSE. The decay curves were fitted with a multi parameter function51
which describes
the rubber as composed by three rubber populations A, B and C (expressed as fraction of (A+B+C)
rubber) with increasing mobility :
(3)
A is the fraction usually attributed to less mobile chains that are part of a network, whose
relaxation is mostly due to residual dipolar interactions Dres; B is the fraction constituted by chains
with a dangling end, with relaxation time T2B; C is due to free chains (sol) with high
conformational freedom and to extender oil, with relaxation time T2C51
.
Detailed analysis of V-SBR-SX-35 was performed at T= 313 K and 393K, far above the Tg, in order
to exclude localized dynamic inhomogeneities that can be present even several tens of degrees
above the Tg itself52
. Instead, experiments for uncured SBR-SX-35 were performed only at T= 313
K in order to avoid the sample vulcanization at the highest temperatures.
The fitting of the Hahn Echo decay was satisfactory for all samples (an example is given in figure
4.11) and the fitting parameters of all samples are reported in Errore. L'origine riferimento non è stata
trovata.4.

56
Figure 4.11: MSE fitting relative to sample V-SBR-S5-35.
All V-SBR-SX-35 samples present a mainly exponential decay, with a prevalence of the rubber
populations B and C, due to a curing degree of V-SBR-SX-35 much lower than highly cured SBR
systems reported in the literature11
. Besides, unfilled V-SBR-REF-0 shows a higher curing
degree, possibly due to the adsorption of curing agents on the mesoporous particles in V-SBR-SX-
35.
This is confirmed also by the slight increase of A population upon vulcanization compared to
uncured SBR-SX-35 in the experiments performed at 313 K. This suggests that the less mobile
fraction A, also present in uncured samples, may be constituted not only by the cross-linked chains
due to the curing process and by entangled chains of rubber but also by rubber chains interacting
with the primary layer of the tightly immobilized polymer detected by MSE. The amount of the
different contributions cannot be separated. Moreover the amount of A as fraction of (A+B+C) is
underestimated due to the presence of the extender oil in the fraction C.

57
Table 4: Hanh Echo NMR decay fitting parameters.
In conclusions, HE-NMR analysis evidenced the presence of rubber chains interacting with the
primary rubber immobilized at the filler surface but the amount of this fraction cannot be evaluated.
Thus it is not possible to trace a direct relationship between the A population and the layers detected
by AFM. The rubber chains in the outermost rubber zone observed by AFM around the filler
particle may include chains with relaxation times higher than those of the less mobile fraction A and
probably part of B population, thus explaining the larger layer detected by AFM.
4.4.3 MQ (Multiple Quantum) experiments
Further analysis of the polymer network was performed by MQ-NMR41
on V-SBR-SX-35 in
comparison with the unfilled V-SBR-REF. MQ-NMR is a recent method for studying networks in
polymeric materials, more reliable than Hahn Echo, since it avoids fitting artifacts associated to
transverse relaxometry experiments.
The experimental raw Double Quantum (DQ) function IDQ and the sum MQ decay I MQ = (IDQ+ Iref),
where Iref is the raw experimental reference decay function, are reported as a function of the pulse
sequence duration DQ in Figure 4.12 a. The build-up normalized DQ function InDQ= (IDQ/ I M) for
the same samples V-SBR-SX-35 and V-SBR-SX-REF are reported in Figure 4.12 b.
Sample Temperature
K A% B% C%
Dres
ms
T2B
ms
T2C
ms
V-SBR-S1-35
393
13.0 58.4 28.6 1.0 2.5 50.9
V-SBR-S2-35 11.8 60.0 28.2 1.0 2.6 43.4
V-SBR-S5-35 11.8 59.5 28.7 0.9 2.5 40.8
V-SBR-REF-0 19.4 46.4 34.2 1.2 1.8 55.7
V-SBR-S1-35
313
9.6 75.8 14.6 0.7 0.7 9.4
V-SBR-S2-35 9.7 74.0 16.3 0.8 0.7 8.7
V-SBR-S5-35 10.1 74.6 15.3 0.8 0.7 8.9
V-SBR-REF-0 9.6 71.2 19.2 7.1 0.9 8.2
SBR-S1-35
313
7.7 73.4 18.9 6.3 1.0 10.1
SBR-S2-35 7.2 75.4 17.4 7.1 0.9 8.4
SBR-S5-35 8.5 74.8 16.7 5.9 0.9 9.5
SBR-REF-0 6.1 73.5 20.4 5.0 1.0 11.8

58
Figure 4.12: (a) MQ functions vs. DQ evolution time of (,) V-SBR-S1-35; (,) V-SBR-S2-
35 and (, ) V-SBR-S5-35 nanocomposites compared to unfilled V-SBR-REF-0 (, ). Black
symbols indicate IDQ, white symbols I MQ. The inset magnifies IDQ plots. (b) Normalized MQ
functions InDQ of ()V-SBR-S1-35; ()V-SBR-S2-35 and () V-SBR-S5-35 compared to V-
SBR-REF-0 (). Lines are guides for the eye.
It was demonstrated that InDQ intensity increases up to 0.5 in fully crosslinked rubber. The InDQ
intensity of all V-SBR-S5-35 samples increase up to value of about 0.2 (Figure 4.12), indicating a
low cross-linking degree. This hinders the possibility of properly fitting the curve using Tichonov
regularization12
or other simplified models in order to differentiate between the less immobilized
rubber population of the system.
InDQ values of V-SBR-SX-35 presents a slightly lower maximum than unfilled V-SBR-REF-0
indicating a lower crosslinking degree, possibly due to the adsorption of curing agents on the’
mesoporous particles. On the other side, the curves of V-SBR-SX-35 samples display negligible
differences, thus indicating a very similar efficiency of vulcanization in the presence of fillers with
different shapes. This results are in agreement with the conclusions of Hahn Echo investigation and
point out that the differences in the mechanical reinforcement of V-SBR-SX-35 samples (see
chapter 5, Dynamic Mechanical Analysis) are not significantly related to the modifications of the
rubber matrix induced by curing.

59
References
[1] R. A. Vaia and J. F. Maguire Chem. Mater. 2007, 19, 2736-2751
[2] Brewer A. K., Striegel A. M. Analytical chemistry 2011, 83, 3068–3075
[3] Di Nardo N. J., Nanoscale Characterization of Surfaces and Interfaces, VCH, 1994
[4] Qu M., Deng F., Kalkhoran S. M., Gouldstone A., Robisson A., Van Vliet K. J. Soft Matter
2011, 7, 1066–1077
[5] B. Meissner, Rubber Chem Technol, 1995, 68, 297-310
[6] L. Bokobza, A.L. Diop, eXPRESS Polymer Letters 2010, 4, 355–363
[7] Papon A., Saalwachter K., Schaler K., Guy L., Lequeux F., Montes H. Macromolecules 2011,
44(4), 913-922
[8] Mauri M., Thomann Y., Schneider H., Saalwächter K. Solid State Nuclear Magnetic Resonance
2008, 34, 125-141
[9] Mujtaba A., Keller M., Ilisch S., Radusch H. J., Beiner M., Thurn-Albrecht T., Saalwachter K.,
ACS Macro Lett. 2014, 3, 481
[10] Valentín J. L., Mora-Barrantes I., Carretero-González J., López-Manchado M. A., Sotta P.,
Long D. R., Saalwächter K., Macromolecules 2010, 43, 334
[11] Saalwachter K., Progress in Nuclear Magnetic Resonance Spectroscopy 2007, 51, 1-35
[12] Chassé W, Valentín JL, Genesky GD, Cohen C, Saalwächter K, The Journal of Chemical
Physics 2011;134

60

61
Chapter 5
DYNAMO-MECHANICAL PROPERTIES OF SCS/SBR
NANOCOMPOSITES

62
The chapter is dedicated to the discussion of dynamo-mechanical properties of nanocomposites
whose preparation, morphology and chemical properties were described in the previous chapters.
Here, both uncured and cured nanocomposites were characterized first with an Oscillating Disk
Rheometer (ODR) operating in shear mode. Dynamo-mechanical thermal analysis (DMTA) gave
quantitative information about the rubber immobilization operated by differently shaped
nanoparticles and mixed-filler systems. Selected cured samples were more deeply investigated, in
particular trough tensile analysis, Mullins effect and compression dynamics, in order to describe the
implications on rubber reinforcement given by anisotropic rather than spherical silica nanoparticles.
5.1 Rheological properties by ODR (Oscillating Disk Rheometry)
Rheological measurement were first conducted on uncured SBR-SX-35 nanocomposites (figure
5.1) in order to assess the reinforcement effect provided by the differently shaped nanofillers SiO2-
SX on uncured nanocompositeswithout considering the vulcanization reaction. The addition of
silica NPs to the SBR matrix provide composites with viscoelastic behavior, characterized by a non
linear dependence of the storage modulus G' on the applied strain (Payne effect, see chapter 2). In
fact, the storage modulus G' at low strain (G'0 o at 2%) decreases rapidly by increasing the strain
amplitude, and at large strain amplitude (G'∞ at 100%) approaches the lowest value. The breakdown
of the filler inter-aggregate network is responsible to this stress softening.
Figure 5.1: Storage modulus G’ vs strain of uncured SBR-SX-35 composites: a) SBR-S1-35(• • •);
b) SBR-35-S2(---); c) SBR-35-S5(- - -); d) SBR-35-S7(― ― ―); e) SBR-35-S10(― • •).
According to the widely accepted mechanistic interpretation that the Payne effect is related to the

63
destruction of filler network upon oscillatory shear, the higher G'0 values obtained in the presence of
anisotropic particles point out a stronger reinforcing effect. In fact, SBR-S2-35, SBR-S5-35 and
SBR-S7-35 show G'0 values higher than those of SBR-S1-35 and SBR-S10-35 whose fillers are
totally or mostly spherical. The modulus values at the highest deformation (G'∞) are very similar for
all SBR-SX-35 composites. This means that differences in reinforcement are less effective once the
network is broken down. In fact, the filler synthesis has been targeted to obtain NPs homogeneous
in surface chemistry and only different in their shapes.
The trend of the elastic modulus G'0 of the composites can be correlated to the shape of silica
particles.
The reinforcing effect of SBR-SX-W increases with the AR of the rod-like particles. This behavior
can be associated both to the self assembling properties of the particles, which are aligned along the
major axis and to the very large contact area between anisotropic filler and polymer. As regards the
alignment, this effect becomes more evident for the longest rods in SBR-S5-35 and SBR-S7-35 than
for the slightly anisotropic SBR-S2-35.
It is well known that the oriented arrangements of particles in a polymer matrix enhance the
composite modulus compared to a random distribution, hence in the case of 1D rods the
reinforcement is more effective along their main dimension1.
This effect can be evaluated by simple geometrical observation, comparing the effective surface
area Y=A/V of the spherical particles with that of the cylindrical rods with high AR2. V is the
volume of the filler and A is the surface area normal to the direction of the major axis, which is the
portion of the total particle surface interacting with the other aligned particles. The values of Y are
3/2d and 4/d, respectively2, where d is the diameter of the sphere or the cross section of the rods. As
d is quite the same for spheres and rods in all SBR-SX-W nanocomposites (70-80 nm), the
reinforcement efficiency due to orientation is higher for the rods.
The modulus improvement in SBR-SX-W can also be associated to the polymer layer arrangement
around particles. In all samples the thin layers surrounding the filler particles, evidenced by TEM
images and provided by the bifunctional coupling agent TESPT, cause immobilization of the
polymer chains near the particle surface in comparison with those in the rubber matrix. When the
rubber layers of different particles overlap, the reinforcement effect increases with the extent of
rubber overlapping area. In SBR-SX-35 the distances between particles are small for both spherical
and rod-like fillers. Thus, the thin layers around filler particles overlap and build bridges between
the fillers, enhancing the reinforcement of rubber3. In addition, the anisotropic shape and the
alignment of the rod-like particles provide a larger interface between the silica and the rubber,
further enhancing the amount of overlapping rubber layers and thus improving the mechanical
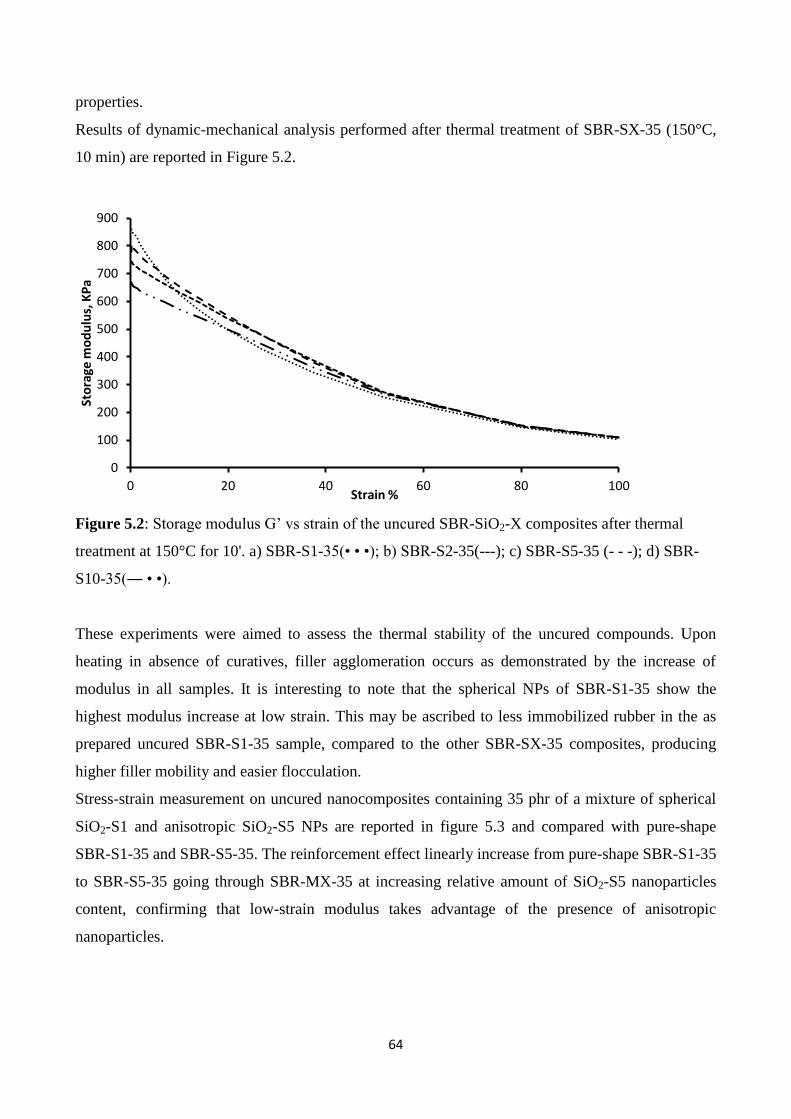
64
properties.
Results of dynamic-mechanical analysis performed after thermal treatment of SBR-SX-35 (150°C,
10 min) are reported in Figure 5.2.
Figure 5.2: Storage modulus G’ vs strain of the uncured SBR-SiO2-X composites after thermal
treatment at 150°C for 10'. a) SBR-S1-35(• • •); b) SBR-S2-35(---); c) SBR-S5-35 (- - -); d) SBR-
S10-35(― • •).
These experiments were aimed to assess the thermal stability of the uncured compounds. Upon
heating in absence of curatives, filler agglomeration occurs as demonstrated by the increase of
modulus in all samples. It is interesting to note that the spherical NPs of SBR-S1-35 show the
highest modulus increase at low strain. This may be ascribed to less immobilized rubber in the as
prepared uncured SBR-S1-35 sample, compared to the other SBR-SX-35 composites, producing
higher filler mobility and easier flocculation.
Stress-strain measurement on uncured nanocomposites containing 35 phr of a mixture of spherical
SiO2-S1 and anisotropic SiO2-S5 NPs are reported in figure 5.3 and compared with pure-shape
SBR-S1-35 and SBR-S5-35. The reinforcement effect linearly increase from pure-shape SBR-S1-35
to SBR-S5-35 going through SBR-MX-35 at increasing relative amount of SiO2-S5 nanoparticles
content, confirming that low-strain modulus takes advantage of the presence of anisotropic
nanoparticles.
0
100
200
300
400
500
600
700
800
900
0 20 40 60 80 100
Sto
rage
mo
du
lus,
KP
a
Strain %

65
Figure 5.3: Storage modulus G’ vs strain of the uncured mixed-shape SBR-MZ-35 composites compared
with pure-shape SBR-S1-35 (• • •) and SBR-S5-35 (- - -). a) SBR-MA-35(- - • •); b) SBR-MB-35(- - • •);
c) SBR-MC-35 (- - •); d) SBR-MD-35(- - •).
The strain dependence of the loss modulus G’’ obtained for of SBR-SX-35 is reported in Figure
5.4. The trend of G’’ indicates a strong impact of the particle shape on G'' maximum. In fact, SBR-
S2-35, SBR-S5-35 and SBR-S7-35 show a broad maximum at strain between 50 - 60% , while the
maximum for SBR-S1-35 is at strain <10%. SBR-S10-35, containing both elongated and spherical
particles, has an intermediate behaviour with a maximum at high strain but with a value lower than
SBR-SiO2-2, SBR-SiO2-5 and SBR-SiO2-7 where all NPs are anisotropic. The result can be
rationalized as follows.
The loss modulus G’’ depends on the rates of network breakdown and reformation, due to the strain
amplitudes. Loss modulus curves identify the maximum strain at which the composite is able to
withstand to the dynamic-mechanical solicitation without breakage of the filler network. At lower
strain the network is still able to reform after each deformation, thus showing an elastic behaviour 4.
At higher strain, the strain amplitude is high enough to destroy the filler network, which cannot
reforms in the time scale of the dynamic strain, and the effect of filler network on G’’ disappears4.
In the investigated silica-rubber composites, the higher the G’’ values and the strain at which G’’ is
maximum, the stronger the network. The highest G’’ values of SBR-S7-35, SBR-S5-35 and SBR-
S2-35 confirm that the anisotropic particles form a strong network entrapping a large amount of
rubber which enhances the reinforcing effect.
0
100
200
300
400
500
600
700
0 10 20 30 40 50 60 70 80 90 100
Sto
rage
mo
du
lus,
KP
a
Strain %
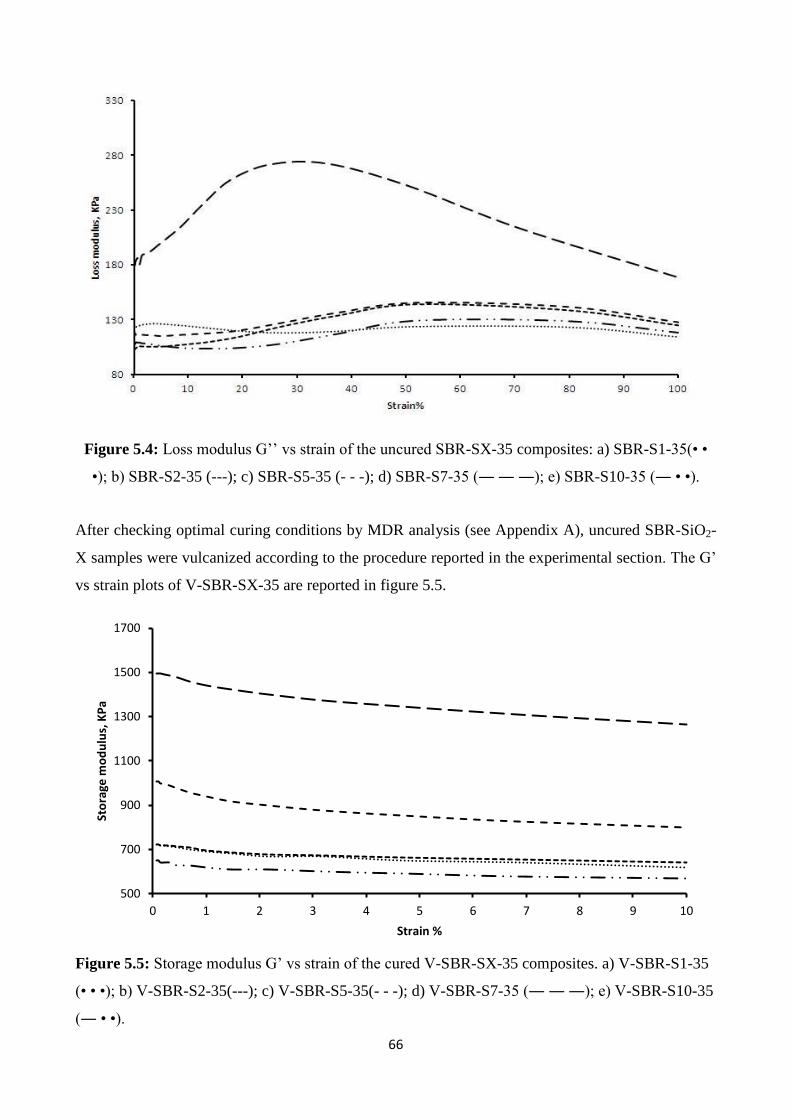
66
Figure 5.4: Loss modulus G’’ vs strain of the uncured SBR-SX-35 composites: a) SBR-S1-35(• •
•); b) SBR-S2-35 (---); c) SBR-S5-35 (- - -); d) SBR-S7-35 (― ― ―); e) SBR-S10-35 (― • •).
After checking optimal curing conditions by MDR analysis (see Appendix A), uncured SBR-SiO2-
X samples were vulcanized according to the procedure reported in the experimental section. The G’
vs strain plots of V-SBR-SX-35 are reported in figure 5.5.
Figure 5.5: Storage modulus G’ vs strain of the cured V-SBR-SX-35 composites. a) V-SBR-S1-35
(• • •); b) V-SBR-S2-35(---); c) V-SBR-S5-35(- - -); d) V-SBR-S7-35 (― ― ―); e) V-SBR-S10-35
(― • •).
500
700
900
1100
1300
1500
1700
0 1 2 3 4 5 6 7 8 9 10
Sto
rage
mo
du
lus,
KP
a
Strain %

67
G' values have similar trends with respect to SBR-SX-35 as demonstrated by the G’0 at low strain
reported in Figure. This demonstrates that after vulcanization, which strongly improves the
mechanical properties of the rubber, the effect of the filler anisotropy remains significant.
5.2 Rheological behaviour rationalization by the Einstein-Guth-Smallwood equation
The reinforcement effect can be rationalized by considering the reinforcing particulate as a modifier
of the regular flow properties of a viscoelastic material such as rubber. This is the concept of the
rheological equations employed for the prediction of final material properties, which consider
different filler properties as a contributors to reinforcement. The effect of the shape factor can be
predicted by the Einstein equation modified by Guth-Smallwood
(1)
where φ is the filler volume fraction, G’0( ) the modulus of the composite and G’0 (0) the modulus
of the rubber. The filler volume fraction (φ) is kept constant to study the low strain dependence of
G'0 on the AR.
Figure 5.6 Plot of G'0 values vs filler volume fraction (φ) of composites SBR-S1-W (), SBR-S2-
W (), SBR-S5-W (), SBR-S7-W ( ). Dashed lines helps the reader.
The plot of measured G'0 vs filler volume fraction (φ) of silica particles is reported in figure 6 for
SBR-SX-W nanocomposites.
0
200
400
600
800
1000
1200
1400
0.06 0.08 0.1 0.12 0.14 0.16
G'0
mo
du
lus,
KP
a
Filler volume fraction φ

68
This graph highlights the modulus improvement that occurs at the filler volume fraction. The effect
is particularly marked in the case of nanocomposites of highest aspect ratios nanofiller, confirming
their high capability of forming a strong network and suggesting a lowered percolation threshold
with respect to spherical nanoparticles as reported in literature for similar systems.
Figure 5.7 Plot of G'0 values vs particle aspect ratio for SBR-SX-35 (), SBR-SX-25 (), SBR-
SX-12 () of silica NPs (dashed lines), compared with the trend of the Einstein-Guth-Smallwood
equation calculated for 35, 25 and 12 phr (straight lines).
The plot of measured G'0 vs AR of silica particles is reported for SBR-SX-35 (φ = 0.20) in figure
5.7, in comparison with the curve derived from equation (eq.1). The experimental values result
always higher than the theoretical ones, although G'0 values increase by increasing the AR value.
Since the Einstein-Guth-Smallwood equation for filled systems considers only the hydrodynamic
effects, and not aggregative or networking phenomena, the results confirm the formation of a
percolative filler network in SBR-SX-35.
In Figure 7 experimental and theoretical trends of G'0 vs AR for SBR-SX-12 (φ = 0.067) are also
reported. G'0 values are much lower and vary slightly with AR. In agreement with the lower
reinforcing effect, the values correspond to those calculated from the model equation, indicating
that at this loading, the particles are isolated and do not interact significantly within SBR matrix.
SBR-S10-35 as well as SBR-MX-35 samples were excluded from the comparison with the Einstein-
Guth-Smallwood model, since the filler shape is not uniform.
0
200
400
600
800
1000
1200
1 2 3 4 5 6 7
G'0
mo
du
lus,
KP
a
Aspect ratio

69
5.3 Compression dynamics experiments
Compression dynamic experiments were also performed at 70°C and 10 Hz on a selected number
of cured samples in order to verify the performances of the composite materials in conditions that
mimic the compressive forces sustained during usage. In Table 1 the storage and loss modulus E'
and E'' and the values of tan measured in the strain range 3.5 - 25% are reported for all V-SBR-
SX-35 samples. In Figure 5.8, E’ values obtained at the lowest strain (E'0) are reported for V-SBR-
SX-35 composites and compared with G'0 values obtained in shear mode.
Figure 5.8: Storage modulus at low strain of cured compounds V-SBR-SX-35 measured in
dynamic compressive (E'0) and static shear (G'0) mode.
The trend is similar in dynamic compression and static shear mode for all the investigated
materials, confirming that the effect of the anisotropic shapes on the mechanical properties is also
relevant for the final rubber material. A direct comparison of these results is given by the equation
(2)
Where is the materials’ Poisson ratio, which is about 0.35 for both rubber and rubber
nanocomposites (rif. Ferry). The equation is well-matching the results, because compressive moduli
are approximatively three times higher than corresponding shear moduli.
It must be noted that samples for compression dynamics experiments undergo applied strain in the
normal direction of the strain applied in shearing mode on the same samples. Since the compressive
moduli are consistent with the moduli in shearing mode, we have an indication the material is
mechanically isotropic. In other words, the same sample gives the same mechanical response if
strained at different orientations. This is consistent with TEM observation, in which anisotropic
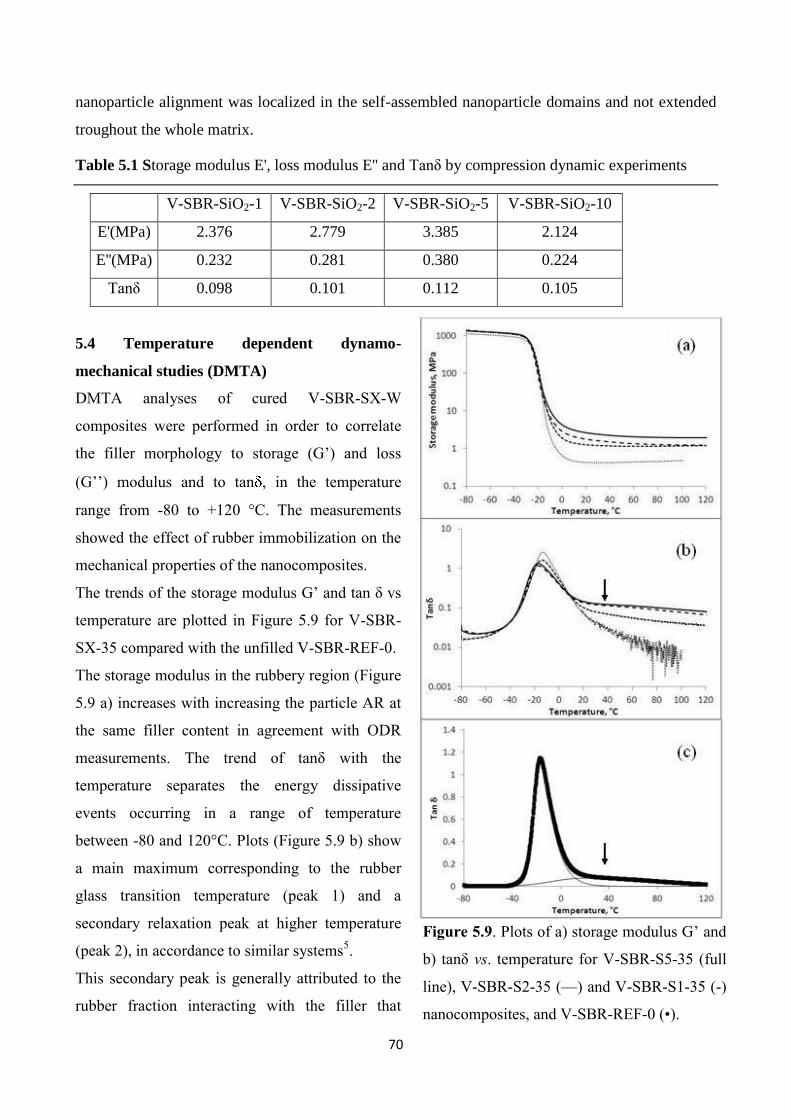
70
nanoparticle alignment was localized in the self-assembled nanoparticle domains and not extended
troughout the whole matrix.
Table 5.1 Storage modulus E', loss modulus E'' and Tanδ by compression dynamic experiments
V-SBR-SiO2-1 V-SBR-SiO2-2 V-SBR-SiO2-5 V-SBR-SiO2-10
E'(MPa) 2.376 2.779 3.385 2.124
E''(MPa) 0.232 0.281 0.380 0.224
Tanδ 0.098 0.101 0.112 0.105
5.4 Temperature dependent dynamo-
mechanical studies (DMTA)
DMTA analyses of cured V-SBR-SX-W
composites were performed in order to correlate
the filler morphology to storage (G’) and loss
(G’’) modulus and to tan , in the temperature
range from -80 to +120 °C. The measurements
showed the effect of rubber immobilization on the
mechanical properties of the nanocomposites.
The trends of the storage modulus G’ and tan δ vs
temperature are plotted in Figure 5.9 for V-SBR-
SX-35 compared with the unfilled V-SBR-REF-0.
The storage modulus in the rubbery region (Figure
5.9 a) increases with increasing the particle AR at
the same filler content in agreement with ODR
measurements. The trend of tanδ with the
temperature separates the energy dissipative
events occurring in a range of temperature
between -80 and 120°C. Plots (Figure 5.9 b) show
a main maximum corresponding to the rubber
glass transition temperature (peak 1) and a
secondary relaxation peak at higher temperature
(peak 2), in accordance to similar systems5.
This secondary peak is generally attributed to the
rubber fraction interacting with the filler that
Figure 5.9. Plots of a) storage modulus G’ and
b) tanδ vs. temperature for V-SBR-S5-35 (full
line), V-SBR-S2-35 (—) and V-SBR-S1-35 (-)
nanocomposites, and V-SBR-REF-0 (•).

71
causes a greater slowdown of polymer dynamics at the filler/rubber interface, compared to the
rubber chains far from the particle interface. Increasing the nanoparticle AR, the intensity of the
secondary relaxation peak in the region above the main glass transition increases. The trend is
confirmed also for the less loaded nanocomposites V-SBR-SX-25 and V-SBR-SX-12 (plots not
reported in the figure). The values of tanδ are generally influenced by the values of the elastic
modulus G’. However, as the two relaxation peaks belong to the same system, their relative area
can be considered independent of G’ and approximately corresponding to the relative fraction of the
free and immobilized rubber components.
Figure 5.10. Plots of tanδ vs. temperature for V-SBR-MX-35 composites compared with pure-
shape V-SBR-S1-35 (• • •) and V-SBR-S5-35 (- - -). a) V-SBR-MA-35(- - • •); b) V-SBR-MB-35(-
- • •); c) V-SBR-MC-35 (- - •); d) V-SBR-MD-35(- - •).
The trends of tan δ vs temperature are plotted in Figure 5.10 for V-SBR-MX-35 compared with the
pure-shape V-SBR-S1-35 and V-SBR-S5-35. While the first and third arrow from the left indicate
relaxation events already discussed for pure-shape nanocomposites, the second arrow from the left
indicate a shoulder of the secondary relaxation peak that is present just for V-SBR-MX-35
nanocomposites. Even if the position of the maximum is different from pure-shape V-SBR-SX-35
nanocomposites, it contributes to the dissipation event not related to the main glass transition;
furthermore, rubber immobilized in V-SBR-MX-35 has lower relaxation temperature, indicating an
higher mobility. It can be considered as a first evidence of the formation of a dual-filler network,
different from the pure-shape materials.
In order to evaluate the amount of the immobilized rubber, tan δ curves were deconvoluted into two
asymmetric double sigmoid curves according to the approach of Arrighi et al.6. The immobilized
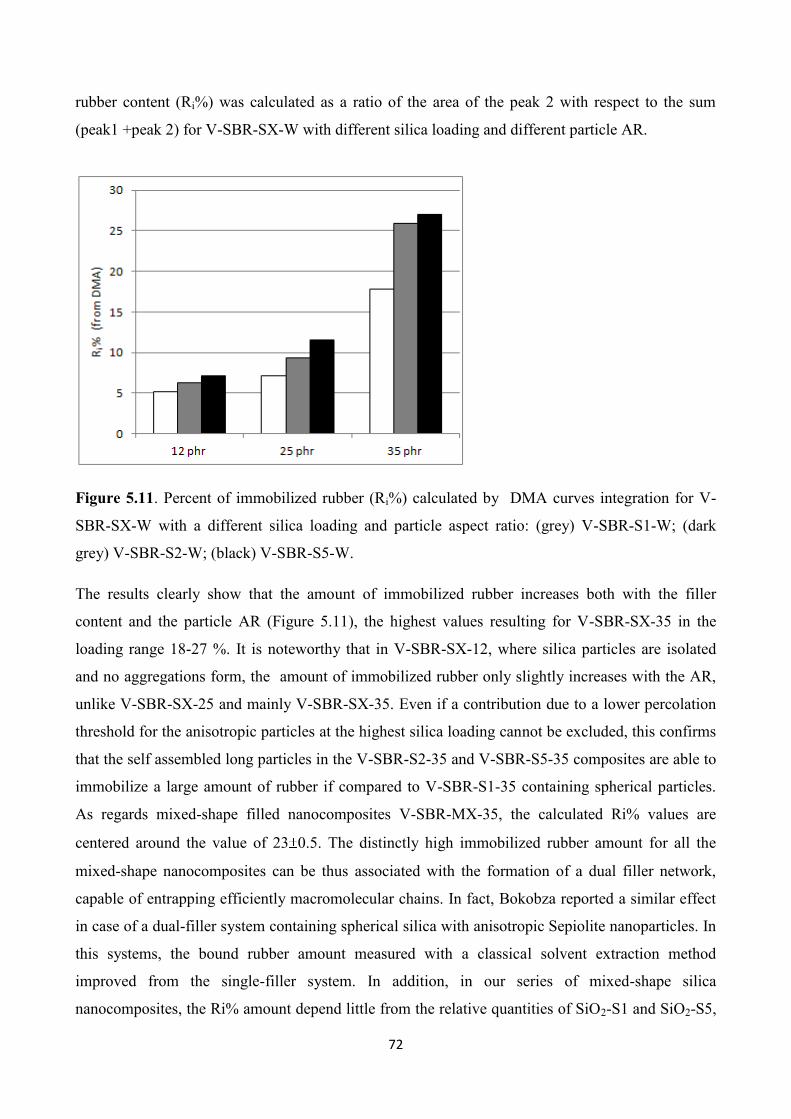
72
rubber content (Ri%) was calculated as a ratio of the area of the peak 2 with respect to the sum
(peak1 +peak 2) for V-SBR-SX-W with different silica loading and different particle AR.
Figure 5.11. Percent of immobilized rubber (Ri%) calculated by DMA curves integration for V-
SBR-SX-W with a different silica loading and particle aspect ratio: (grey) V-SBR-S1-W; (dark
grey) V-SBR-S2-W; (black) V-SBR-S5-W.
The results clearly show that the amount of immobilized rubber increases both with the filler
content and the particle AR (Figure 5.11), the highest values resulting for V-SBR-SX-35 in the
loading range 18-27 %. It is noteworthy that in V-SBR-SX-12, where silica particles are isolated
and no aggregations form, the amount of immobilized rubber only slightly increases with the AR,
unlike V-SBR-SX-25 and mainly V-SBR-SX-35. Even if a contribution due to a lower percolation
threshold for the anisotropic particles at the highest silica loading cannot be excluded, this confirms
that the self assembled long particles in the V-SBR-S2-35 and V-SBR-S5-35 composites are able to
immobilize a large amount of rubber if compared to V-SBR-S1-35 containing spherical particles.
As regards mixed-shape filled nanocomposites V-SBR-MX-35, the calculated Ri% values are
centered around the value of 23 0.5. The distinctly high immobilized rubber amount for all the
mixed-shape nanocomposites can be thus associated with the formation of a dual filler network,
capable of entrapping efficiently macromolecular chains. In fact, Bokobza reported a similar effect
in case of a dual-filler system containing spherical silica with anisotropic Sepiolite nanoparticles. In
this systems, the bound rubber amount measured with a classical solvent extraction method
improved from the single-filler system. In addition, in our series of mixed-shape silica
nanocomposites, the Ri% amount depend little from the relative quantities of SiO2-S1 and SiO2-S5,

73
since the curves are almost super imposable (figure 5.10); this again confirm that the result of
combining SiO2-S1 and SiO2-S5 nanoparticles is cooperative and non-additive.
Figure 5.12. Plot of loss modulus against temperature for V-SBR-S5-35 (full line), V-SBR-S2-35
(—) and V-SBR-S1-35 (-) nanocomposites, and V-SBR-REF-0 (•); in the inset, a zoom on the main
glass transition peak to highlight the curves maxima.
The temperature dependence of the loss modulus G’’ is reported in Figure for V-SBR-SX-35
nanocomposites. G’’ plots allow to compare the glass transition of rubber in the composites more
reliably than the tanδ plot does, since in this case the maximum of the curve is not influenced by the
value of G’. The main glass transition gradually shifts to a lower temperature by increasing AR
(inset in Figure 12). SBR-S1-35 has a Tg = -23.3 °C, quite similar to that of unfilled reference V-
SBR-REF-0 ( Tg = -23.0 °C) while V-SBR-S2-35 and V-SBR-S5-35 have Tg of -24,3 and -25,3
°C, respectively. These results are consistent with the so called “plasticization” effect of the bulky
rubber already proposed by the literature7
to explain the different dynamics of the rubber layers
remote from those close to the constrain. According to this effect, increasing the amount of
immobilized rubber at the polymer filler interface, a decrease of the packing density of the unbound
bulk polymer is observed. The increase of the free volume within the rubber matrix improves the
chain freedom degree and, consequently, reduces the glass transition temperature. In our case, the
presence of an increased fraction of low molecular weight products has been excluded in
nanocomposites with high ARs NPs. Therefore, the extent of these effects in V-SBR-S5-35 may be
related to the formation of domains of aligned anisotropic NPs which immobilize higher rubber
amount by increasing their ARs.

74
Figure 5.13: Loss modulus G’’ vs Temperature of the cured mixed-shape V-SBR-MZ-35
composites compared with pure-shape V-SBR-S1-35 (• • •) and V-SBR-S5-35 (- - -). a) V-SBR-
MA-35(- - • •); b) V-SBR-MB-35(- - • •); c) V-SBR-MC-35 (- - •); d) V-SBR-MD-35(- - •).
The temperature dependence of the loss modulus G’’ is reported in Figure 13 for V-SBR-SX-35
mixed-shape nanocomposites, and compared with with pure-shape V-SBR-S1-35 and V-SBR-S5-
35. The Tg results in all cases to lay in between the values for pure-shape nanoparticles with a sligth
tendency to increased with increasing amount of spherical nanoparticles (table 5.2).
Compound V-SBR-MA-35 V-SBR-MB-35 V-SBR-MC-35 V-SBR-MD-35
Measured Tg -23,5 - 23,8 - 24.0 -24.3
Table 5.2: Main glass transition temperature of V-SBR-MZ-35 nanocomposites.
Nevertheless, the values are quite similar, indicating a specific plasticization effect that can be
ascribed just to the formation of a dual shape network, with characteristics different from the
network formed by its pure constituents, with just little dependency on the relative amount of SiO2-
S1 and SiO2-S5 in the mixture.
5.5 Tensile tests and Mullins effect
Tensile stress-strain tests of V-SBR-SX-35 were performed to study the material’s behavior under
high deformation. Stress strain profiles and the values of elongation/stress at break are reported in
Figure 14 and Table 3.

75
Figure 5.14: Tensile stress-strain profile for V-SBR-S5-35 (full line), V-SBR-S2-35 (—) and V-
SBR-S1-35 (-) nanocomposites
V-SBR-S1-35 V-SBR-S2-35 V-SBR-S5-35
Stress at
break[MPa] 9.45 6.46 7.19
Elongation at
break[%] 551 403 328
Table 5.3: Stress and elongation at break from tensile stress-strain measurements for V-SBR-SX-35
nanocomposites.
V-SBR-S5-35 showed the highest stress value for the whole strain range, confirming the higher
reinforcement when increasing the particle anisotropy. On the other hand, the values of elongation
at break decreased by increasing the particle AR. Therefore, in order to further investigate the
tensile properties of the nanocomposites, the strain induced topological changes in the composites
were studied by testing the pre-strained specimens. The so called Mullins effect describes the pre-
strain induced softening. This test consists in a set of elongation-retraction cycles providing
information on the changes of structure with increasing strain. The cycles of stress/strain
measurements at increasing strain (from 5% to 45 %) for V-SBR-S1-35 and V-SBR-S5-35 are
shown in Figure 15 a and b. The stress values of V-SBR-S5-35 samples are always higher than
those of V-SBR-S1-35 at every strain value. By stepwise increasing deformation up to 25 % strain,
both samples exhibit viscoelastic behavior, and the next stress-strain elongation curves (full lines in
Figure 15) are superimposable with the previous ones. After the pre-strain of V-SBR-S5-35 at 30
%, the next curve shows strain softening and a lower stress value in the strain region up to 30 % due
to non-Gaussian effects. This softening is the result of the filler-filler break-down and the filler-
0
2
4
6
8
10
1 2 3 4 5 6 7
Stre
ss, M
Pa
Extension ratio l/l0

76
polymer contact sliding at the critical strain of 30 %. The Mullins softening is more significant in
the further elongation steps at increasing strain. The area between the curves of the two subsequent
elongation steps corresponds to the energy loss per volume unit at the Mullins softening. For
example, V-SBR-S5-35 pre-strained at 40% results in a stress decrease (Δ ) with respect to the next
elongation, 45%, of 40 kPa (i.e. 6 % of the stress value measured at the same strain, 35%) (see Fig.
15 d). This effect is much smaller in the case of V-SBR-S1-35 where the pre-strain at 40% leads to
the stress softening by 15 kPa, i.e. 2.4% (see Fig. 15 c).
Figure 5.15. Loading (full line)/unloading (—) cycles for (a) V-SBR-S1-35 and (b) V-SBR-S5-35.
The stress decrease ( ) measured at 35 % strain of (c) V-SBR-S1-35 and (d) V-SBR-S5-35 pre-
strained at 40% and 45%.
The higher extent of strain softening in V-SBR-S5-35 implies a greater amount of reinforcing
physical interactions. Moreover, both samples display a quasi-permanent deformation (tension set)
of 1-3 %, even after relaxation at rest, being higher in the case of V-SBR-S5-35. These results
confirm that V-SBR-S5-35 filled with anisotropic particles and having a network with a higher

77
amount of immobilized rubber, presents higher stress value compared to V-SBR-S1-35. This more
efficient reinforcement was proved to be brought about by stronger physical interaction broken
down at the critical strain. In fact, the observed Mullins effect in the region of small strains (35-
45%) is mainly a result of breaking the filler aggregates and, to a smaller extent, of an interface
sliding mechanism which is dominant at higher strains8. The Mullins curve for V-SBR-MA-35 (not
reported) is almost super imposable on the curve of V-SBR-S5-35, even if the composition of V-
SBR-MA-35 is much closer to V-SBR-S1-35 than to V-SBR-S5-35. The pronounced hysteretical
loss together with the high reinforcement are similar in V-SBR-S5-35 and V-SBR-MA-35,
which possess an higher amount of bound rubber in comparison to V-SBR-S1-35 nanocomposite.
This result endorse the hypothesis that the Mullins effect observed is a result of an interphase
breaking mechanism that involve the presence of a certain amount of immobilized rubber.
References
(1) R. A. Vaia and J. F. Maguire Chem. Mater. 2007, 19
(2) H. Hua, L. Onyebuekea, A. Abatan, Journal of Minerals & Materials Characterization &
Engineering, 2010, 9, 275-319
(3) H. Montes, T. Chaussée, A. Papon, F. Lequeux, and L. Guy, Eur. Phys. J. E, 2010, 31, 263–268
(4) A. P. Meera, J. Phys. Chem. C 2009, 113, 17997–18002
(5) Varghese S., Karger-Kocsis J., Gatos K.G., Polymer 2003, 44, 3977–3983
(6) Arrighi V., McEwen I.J., Qian H., Serrano Prieto M.B., Polymer 2003, 44, 6259–6266
(7) Barut G., Pissis P., Pelster R., Nimtz G., Phys Rev Lett 1998, 80, 3543
(8) Bokobza L. Rubber Chemistry And Technology 2013, 86, 423–448

78

79
Chapter 6
CONCLUSIONS

80
Conclusions
Shape controlled spherical and rod-like silica NPs with different aspect ratios (1-10) were
synthesized by a sol-gel method using TEOS and MPTSM as silica precursors and the surfactant
CTAB as structure directing agent. NPs were used to prepare silica/SBR composites by blending
method. In all nanocomposites SBR-SX-W both spherical and anisotropic rod-like NPs formed a
network of particles bridged by thin rubber layers throughout the whole SBR matrix. The network is
more homogeneous in samples containing spherical or near spherical particles than in samples with
rod shape particles due to the anisotropic interactions between the elongated particles. In fact
differently oriented domains of rods preferentially aligned along the main axis occurred when the
length of the particles increases (AR >2). Dynamic-mechanical properties of SBR-SX-W
composites indicate that the anisotropic rod-like particles provide stronger reinforcement of the
rubber if compared to the spherical ones and that the effect increases by increasing the particle
aspect ratio, up to 35 phr of silica content.
The morphology influence on the reinforcement was preserved also in V-SBR-SX-W after the
vulcanization process. The mechanical reinforcing effect is basically related to the formation of a
continuous percolative network of silica nanoparticles, connected by thin polymer films, throughout
the rubber matrix. In detail, the increase of the reinforcing effect of the rod-like particles by
increasing their aspect ratio is related to both the self-alignment of anisotropic particles along the
major axis direction and to their very large filler/polymer interface, compared to that of spherical
particles. This strong interaction originates a significant reinforcement even if the anisotropic
particle form a network less continuous than in samples containing spherical or near spherical
particles. The combined use of TEM and AFM tapping mode analyses revealed that in all the V-
SBR-SX-W nanocomposites, spherical and anisotropic NPs are surrounded by a layer of
immobilized rubber, stabilized at the particle interface. Spherical or nearly spherical particles show
small contact zones sharing thin rubber layers. Rod shaped particles (AR >2) show instead oriented
domains of rods preferentially aligned along the main axis, where an increase of rubber fraction
trapped between the aligned particles is evident.
Low field 1H NMR measurements evidence that polymer chain dynamics of the rubber layers
tightly bound to the silica particles are restricted by the interaction with the filler, increasing the
stiffness with respect to that of polymer far from the particles. The thickness of this layer, named
primary one, is smaller than that detected by AFM which includes also the outermost rubber chains
crosslinked or entangled with the primary layer. The highest values of the rubber rigid fractions
were observed in the case of anisotropic filler particles.

81
From DMTA data resulted that this is related to the self-alignment of anisotropic particles which
immobilize larger amounts of rubber in the interparticle region than spherical particles. DMTA
measurements evidence also that the presence of the rod-like silica domains induces a decrease of
the packing density of the unbound polymer chains compared to the spherical particles, increasing
the free volume in the rubber matrix and, consequently, reducing its glass transition temperature.
The strong correlation between the results of the integrated multi-technique approach allows to
visualize at the nanoscale level the immobilized rubber at the silica-rubber interface, and evidences
the modulating role of the immobilized rubber on the macroscopic mechanical properties.
The control of the silica shapes proposed in this thesis allowed to study the influence of the particle
shape on the reinforcing effect independent of the surface chemistry and considering the aspect ratio
as the only geometrical variance. The study confirmed that the filler particle anisotropy is crucial to
vary the amount of immobilized rubber at the filler/rubber interface and the reinforcing effect, and
that beyond maximizing the nanoparticle dispersion in the rubber matrix, the control of filler
morphology is mandatory to obtain the desired modulation of the mechanical properties.

82

83
Appendix A
CHARACTERIZATION METHODS

84
The aim of this appendix is to resume the analytical techniques employed in order to understand the
structure-properties relationship of our materials. It will be divided into two main sections: first,
characterization of bare nanofiller (3.1), prior to rubber compounding, and second characterization
of the obtained nanocomposites (3.2). The techniques are grouped, for both cases, by morphological
(3.1.1, 3.2.1) and materials properties (3.1.2, 3.2.2).
A.1 Fller characterization
A.1.1 Morphological analysis
A.1.1.1 Scanning Electron Microscopy (SEM)
SEM is based on the emission of electrons from the surface of a sample to generate signals, and an
image is formed. The apparatus consists in a column in which the electron beam is accelerated, a
sample chamber in UHV condition to avoid collision of the beam with air molecules, a secondary
electron detector (SED), and a computer connected with the instrument. A CCD camera is used to
verify the sample Z position of the sample. In particular, a focused high-energy electron beam is
pointed to the sample, in a repeated rectangular array. Secondary electrons with much lower energy
(at least 10 thousand times less energetic than the originary beam) are then back emitted by the
interference of the surface atom of the sample with the incident beam. These are collected using a
SED, which consists in a faraday cage with a 300 volts positive charge connected to a collection
target. The digital signal is converted in a grayscale image and shown in a monitor. The resolution
depends mainly on the scanned area and allows to visualize objects as little as a hundred of
nanometers. Measurements of the powders were done by a Vega TS5136 XM Tescan microscope in
a high-vacuum configuration. The electron beam excitation was 30 kV with a beam current of 25
pA. Prior to SEM analysis, samples were sticked to a metallic target trough a tape and gold-
sputtered in order to improve the conductivity of the electrons trough the material.

85
A.1.1.2 High-Resolution Transmission Electron Microscopy (HRTEM)
HRTEM is a technique that allows to obtain images of a nanostructured material at a much higher
resolution than SEM. The apparatus is made of an electron beam source, a series of electromagnetic
lenses (at least 5) to accelerate the electron beam at very high speed (up to 100KeV), and an
imaging system of the electrons going through the sample, which converts the diffraction pattern
into a 2D image. Going into detail, the technique makes use of both transmitted electrons
and electrons generated by interaction of the beam with the sample, that are elastically scattered in
the direction of the imaging system.

86
This means that the imaging system receives a diffraction pattern, that is reconstructed by the
projection lens into a 2D image of the sample. Finally, the imaging plate on the bottom converts the
incident electrons into visible light by fluorescence, and the visible image is detected by a CCD
camera. The resolution depends mainly on the speed of the electron beam used, and modern
HRTEM apparatus are able to resolve features as small as few nanometers. Morphological
characterization of powders was performed on a Jeol 3010 High Resolution Transmission Electron
Microscope (HRTEM) operating at 300 kV with a high-resolution pole piece (0.17 nm point to

87
point resolution) and equipped with a Gatan slow-scan 794 CCD camera. The powders were
suspended in isopropanol, and a 5 mL drop of this suspension was deposited on a holey carbon film
supported on 3 mm copper grid for HRTEM investigation.
A.1.1.3 Nitrogen adsorption (BET)
Morphology of nanostructured materials can also be described by surface area and pore structure,
and the technique of choice is nitrogen physisorption analysis according to the method described by
Brunauer, Elmet and Teller (BET analysis). The apparatus consists in a main chamber (manifold)
which is connected to a p0 tube at the saturation pressure of nitrogen, a tube containing the sample
at pressure p and at the temperature of liquid nitrogen (77K), a vacuum pump, a gaseous nitrogen
reservoir, pressure and temperature measurement systems. The analysis consists in the addition to
the sample tube (previously evacuated and initially in high vacuum) of increasing amount of
gaseous nitrogen from the manifold. The volume of input gas in order to reach a certain pressure in
the sample tube and manifold is checked at every pressure step until saturation (p = p0), and an
isothermal curve of volume against pressure at constant temperature (77K) is obtained. On the basis
of the profile six kinds of curves and four kinds of hysteresis can be depicted for materials with
different pore structure and surface morphology, as reported by the UPAC classification.
Considering the space occupied by the adsorbate molecule on the surface, different geometrical
models can be used to obtain values of specific surface area (SSA), pore volume (DCPV) and pore
size distribution (PSD).

88
The external surface area can also be calculated by subtracting the surface area of the pores
(obtained by DCPV) from the SSA. SSA and DCPV and pore size distribution of powders were
measured by nitrogen physisorption using a Quantachrome Autosorb-1 apparatus according to BET
and BJH methods. Powder samples were evacuated at 200°C for 16 h before the analysis.

89
A.1.2 Bulk and surface properties
A.1.2.1 Pycnometry
A gas pycnometer measures the difference of pressure
between an empty sample cell and the cell with sample. The
increase in pressure is related to the volume of gas displaced.
When He is used as the analysis gas, all open voids are filled,
thus He density is termed true density. The true density of
powders was measured by a Micromeritics Accupyc 1330
gas pycnometer and the result utilized was the average of
five measurements.
A.1.2.2 Attenuated Total Reflectance Fourier Transform Infrafed Spectroscopy (ATR-FTIR)
The surface chemistry of examined materials can be determined qualitatively by vibrational
spectroscopy. The absorption of infrared radiation at different wavelengths is associated with the
vibrational modes of different bonds, so different chemical species have characteristics infrared
absorption spectra. Because of the difficulties of infrared light penetration in solid samples, the
ATR device is used, and the radiation that comes to the detector is not transmitted through a bulky
sample, but is many times reflected on it thanks to the ATR crystal. This contact is sufficient to
allow absorption of IR radiation. The apparatus is made of: a sample holder that is pressurized by a
steel piston (in order to maximize the contact area with the radiation), the ATR crystal, a source of
IR radiation, and a detector. Since the radiation is passing through an interferometer before reaching
the sample, Fourier Transform is applied to the detected signal in order to obtain a transmittance
against wavelength spectrum from the interferogram. The measurements were performed by a
Perkin Elmer Spectrum 100 instrument (1 cm-1
resolution, 650-4000 cm-1
range, 16 scans).

90
A.1.2.3 Thermogravimetric Analysis (TGA)
TGA allows to determine the amounts of physisorbed species and functionalizing organic molecules
on an inorganic powder, by measuring the weight loss of the material as a consequence of a thermal
treatment in a controlled atmosphere. Furthermore, unfunctionalized silica gels have a rich silanol
surface chemistry that can be described by the weight losses that occur in different temperature
ranges. In this way it is in fact possible to classify the two families of silanol groups, vicinal and
isolated by the easier chemical desorption of the first group with respect to the second. The
experimental setup comprises a quartz microbalance on which the sample is accommodated in a
crucible, a heating oven, a gas pipeline and a computer. The instrument works in differential mode
with a reference crucible placed on the balance arm, aside the sample crucible. The determination of
weight loss profile was carried out by a Mettler Toledo TGA/DSC1 Star-e System. In order to
calculate the silanol group present on the silica surface from the weight loss, the following formula
was used, which takes into account the presence of functionalizing species inside the mesopores.
where nOH is the total number of hydroxy groups, nf is the number of mercaptosilane groups
calculated from the sulphur elemental analyses (see later) MWH2O and MWf are the molecular
weights of the water and the organic residual, respectively, while W150-1000 is the sample weight
loss in the temperature range between 150 and 1000°C.

91
The density of silanol groups dOH was calculated by TGA and SSA data, according the following
equation, where NA is the Avogadro number:
A.1.2.4 Tlemental Analysis (EA)
EA coupled with TGA allowed to isolate the component of weight loss associated with silanol
species from the component due to sulfurated organic species. The apparatus consists in a furnace
where the sample is allowed to decompose at high temperature in oxidative environment, and
evolving species are detected by an atomic absorption analyzer. EA of sulfur content in SiO2-X
were performed by using a Thermo Flash EA1112.
A.1.2.5 X-Ray Fluorescence (XRF)
X-Ray Fluorescence is a non-destruptive spectroscopic technique that allows for the determination
of the characteristic lines of emitted fluorescence from the atoms constituting a solution or a solid
finely particulate sample. All the nuclei with atomic mass higher than the sodium are in principle
detectable with this methodology. In particular, using an internal standardization it is possible to
obtain quantitative data if the analyzed nucleus is present in a concentration lower than 10% by
weight (avoiding matrix effect). As an internal standard, it is possible to employ some ready-to-use
reference materials prepared with atomic layer deposition techniques or similar, having an
extremely reliable composition; on the other hand, it is possible to prepare solid mixtures or
solutions at the correct element dilution by weighting precisely the constituents, of which the
atomic composition is already known. Using internal standard with different concentrations, it is
possible to build a calibration curve in which the emitted fluorescence intensity is correlated with
the nucleus concentration. Values of magnesium concentrations in powdered samples were obtained
by using a Bruker AXS S4 Pioneer XRF spectrometer operating at room temperature.
A.2 Nanocomposites characterization
A.2.1 Morphological analysis
A.2.1.1 Transmission Electron Microscopy (TEM)
Transmission electron microscopy principles are already described in A.1.1.2, with the difference
that an electron beam of lower energy has to be employed in order to avoid destruction of the
polymeric matrix, and the sample preparation is more complicated. In detail, the investigation of
both uncured and vulcanized composites was carried out by using a Zeiss EM 900 microscope.
Ultrathin sections (about 50 nm thick) of composites were obtained with a Leica EM FCS cryo-

92
ultramicrotome equipped with a diamond knife, by keeping the samples at -130 °C. The thickness
of the specimens (~40 nm) can cause the longest silica particles to be cut, depending on their
orientation. So the presence of some anomalous shorter and thinner particles in the TEM images
may be due to the sectioning of the samples.
A.2.1.2 Atomic Force Microscopy (AFM)
AFM is a microscopic technique from the family of Scanning Probe Microscopies (SPM), which
groups all the technique that use a probe to scan a surface in a raster pattern and to create an image.
In particular, AFM exploits the contact of an ultra sharp tip (having an apex just few nanometers
large) with an almost flat surface which is kept on an equilibrium distance of few nanometers from
the tip. The tip is mounted on a flexible cantilever. The equilibrium position corresponds to a
minimum of energy due to the compensation of the attractive Van Der Waals force with the
repulsive electrostatic force acting between the charged tip and the surface. The cantilever can have
a starting deflection in the equilibrium position. During the scan, as the tip encounters higher or
lower surface features, it further deflects to keep the equilibrium distance. The deflection is in the
range of nanometers or even angstroms, but can be measured with high accuracy by a laser beam
which is reflected by a cantilever into a diode detector. The piezoelectric tube is hence stimulated to
modify the z position as a consequence of the cantilever deflection detected by the laser-diode
system, in order to keep the equilibrium position. From the piezo tube z displacement it is possible
to obtain an height image of the material. This is the original operating mode, also referred to as
contact mode AFM.

93
Conversely, operating in tapping mode, the cantilever is oscillated at a constant frequency between
an alternating attractive and repulsive force, while the tip scans the surface. Two similar height
images are in this case obtained: since the oscillation amplitude change causes the piezo tube to
displace, one image is obtained by the change in amplitude (Amplitude Error Image) and another is
obtained from the z displacement (Height Image). Generally speaking, in contrast to height signal,
the amplitude error signal shows contrast only at the interface, where the height changes sharply.
During the oscillations, when the tip is in close contact to the surface, a repulsive force is exerted.
This can be divided into two component (in-phase and out-of-phase), that correspond to an elastic
repulsion rather than an inelastic one. The factors influencing the ratio between the two components
include adhesive forces between tip and sample, and the modulus of the surface feature examined.
The overall elastic vs inelastic component is summarized by a phase signal recorded at each point of
scanning, that can be transferred into an image (Phase Image), which gives qualitative information
about the local stiffness of the material, in other words, the materials heterogeneities.
To sum up, AFM measurement conducted in tapping mode gives three simultaneous images
(Height, Amplitude Error, Phase) of the materials surface that give a morpho-mechanical
description of his heterogeneities at the nanoscale. The bulk morphology was evaluated by imaging
the fracture area after previous freeze-fracturing of cured composites at the temperature of liquid
nitrogen. Investigation of the surface topography was done by an atomic force microscope
(MultiMode Digital Instruments NanoScope Dimension IIIa), equipped with the SSS-NCL probe,
Super Sharp Silicon SPM-Sensor (NanoSensor Switzerland; spring constant 35 N/m, resonant
frequency 170 kHz). Measurements were performed under ambient conditions using the tapping
mode AFM technique. Surface images were taken by scanning sizes from 1 to 50 um. Investigations
on crude materials was not possible because of their high stickiness.
A.2.2 Nanocomposites properties
A.2.2.1 Thermogravimetric Analysis (TGA)
Principles of TGA were already described in A.1.2.3. For silica/SBR nanocomposites, TGA
analysis in air environment allows to verify the filler insertion in the rubber matrix. Quantitative
determination of silica content in composites was carried out by Thermo Gravimetric Analysis
(TGA), a Mettler Toledo TGA/DSC1 STAR-e System, at constant air flow (50 cm3 min-1). The
sample (20 mg) was placed in an alumina pan and heated under flowing air up to 1000 °C at a
heating rate of 10 °C min-1. The silica content was calculated by the following expression:
where W1 is the weight of remaining ash, W2 is the composite weight.

94
A.2.2.2 Solvent extraction measurements
When a crude filler/rubber nanocomposite is contacted with a good solvent for rubber, the fraction
that is not constrained by the presence of the filler is free to dissolve, while the remaining part is
not. In this way it is possible to have a rough estimation of the bound rubber fraction. This last is
composed by two contributions: the tightly bound interfacial rubber layer surrounding and
interacting with the filler particle (by covalent or Wan Der Waals forces), and a more loosely bound
rubber component, also called occluded, which is not in direct contact with the filler particle but is
physically constrained by the filler particles organization (for example, inside agglomerates). The
bound rubber fraction can be calculated with the formula:
where md and m0 are the mass of dried and bare sample, respectively, and mf and mr are the
fractions of the filler and the rubber in the compound as determined by TGA on uncured materials.
A.2.2.3 Swelling measurements and Kraus approach
Vulcanized rubber does not dissolve as free crude rubber when in contact with a good solvent,
because of the presence of covalent sulfur bridges that keep the network interconnected. What
actually happens is that the solvent fills the spaces between macromolecular chains, expanding the
network until the crosslinking density makes it possible. The extent of this expansion is measured
as absolute swelling ratio, represented by the equation:

95
where is the weight of the swollen mass, and is the weight of the swollen mass after vacuum
removal of the solvent. This data is typically used for comparing vulcanizated with different
crosslinking densities, through the Flory-Rhener equation.
Further crosslinks can be due to the filler immobilization capability, a parameter that can be
calculated by the Kraus approach. In fact, assuming that the filler does not swell, it is possible to
calculate an immobilization constant c which reflects the capability of the filler to entrap
increasing amount of rubber at increasing filler content, that can be correlated with the amount of
rubber immobilized at the interface:
where is the swelling ratio of unfilled cured material, is obtained by the absolute swelling
ratio , and are the volume fraction of the unfilled and filled rubber, respectively and
The constant parameter corresponds to the slope of the straight line obtained from the plot of
against .
The swelling tests of the vulcanized compounds were performed using toluene as a solvent.
Samples of size 10 x 10 x 2 mm3 were immersed in 20 mL of toluene at room temperature for three
days in a closed vessel in dark (in order to avoid photodegradation reaction of the compounds).
Toluene was replaced daily to eliminate soluble additives (antidegradant, sulfur, CBS...). Finally,
the swollen mass was weighted and dried to constant mass in vacuum.
A.2.2.4 Nuclear Magnetic Resonance (NMR)
The nuclear magnetic resonance (NMR) is a special technique that allows to analyze the chemical
structure of a substance: it exploits the principle that the nuclei of the atoms of some elements,
when subjected to an external magnetic field, orient themselves in the direction of the field
imposed.
In general each nucleus is provided with a specific number of spin (I), for example, I = 0,1 / 2,1,3 /
2, which depends on the mass number and the atomic number. Nuclei that have non-integer spin,
originate an elementary magnetic field μ, which makes them similar to small magnets. The nuclei of
the common isotopes of carbon and oxygen (16
O and 12
C) are not magnetic (I = 0) and not
give rise to phenomena of nuclear magnetic resonance; the atoms most used for this type of

96
analysis, and which are commonly present in the polymers, are 1H and
13C, which are equipped with
number spin equal to 1/2.
When a magnetic nucleus is introduced in an external uniform magnetic field, the
said nucleus will be oriented in one of only two possible directions, corresponding to an energy
level of ± μH0 (where H0 is the intensity of the external magnetic field).
The orientation at low energy (- μH0) corresponds to nuclei with magnetic moment aligned parallel
to the external magnetic field, while the orientation of the high-energy (+ μH0) corresponds to
nuclei antiparallel to the external field. The shift from a possible orientation to another is the result
of absorption or emission a certain amount of energy, which equals E = h ν = 2μH0 where h is
Planck's constant and ν is the frequency of the electromagnetic radiation that is absorbed or emitted.
If the resonance frequency was the same for all the nuclei of the same type (for ex. 1H) of a given
sample, it would be observed in the resonance spectrum a single peak for each atomic species
present. Indeed it is not: it is possible to observe slight differences in the resonance frequency of the
NMR of the same atom accodring to its neighboring nuclei. The electrons surrounding, in fact,
shield the nucleus in different ways, depending on the chemical structure of the molecule examined.
To distinguish these subtle differences, the NMR spectrometer must be constituted by a very
powerful electromagnet establishing a stable and homogeneous magnetic field, then a radio waves
emitter, a receiver and an apparatus capable of varying the frequency of the radiation in a narrow
range.
The deviation of the resonance frequency of the nuclei with respect to a certain molecule taken as
standard takes the name of the chemical shift. This quantity is defined by
where νr is the resonance frequency of a particular reference group, and ν is the frequency of
resonance of the sample considered. Typically for the 1H nucleus, δ is the range 0-10ppm.
The NMR analysis on the nucleus 13
C is possible but quite difficult because of its natural abundance
(about 1%, the rest is 12
C) , then only a few carbon atoms will be oriented, consequently the
signal/noise ratio will decrease.
In a 1H-NMR spectrum can be seen that hydrogen atoms with "chemical environments" different
match different peaks; Moreover, by the area underlying each peak, we can determine the
relationship between the different types of hydrogen atoms present. The area of a peak in fact, is
independent of the structure to which it is linked the corresponding hydrogen, depends only on the
frequency with which the atom is repeated within the molecule. Then dividing the area of each peak
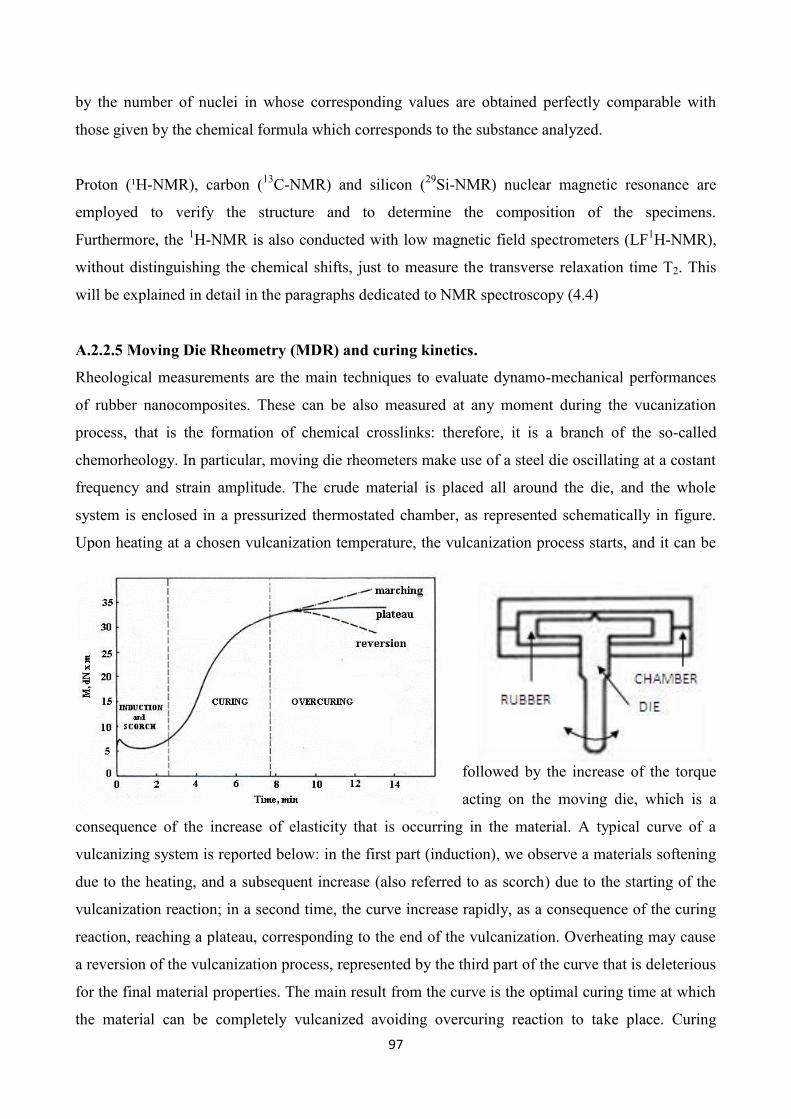
97
by the number of nuclei in whose corresponding values are obtained perfectly comparable with
those given by the chemical formula which corresponds to the substance analyzed.
Proton (¹H-NMR), carbon (13
C-NMR) and silicon (29
Si-NMR) nuclear magnetic resonance are
employed to verify the structure and to determine the composition of the specimens.
Furthermore, the 1H-NMR is also conducted with low magnetic field spectrometers (LF
1H-NMR),
without distinguishing the chemical shifts, just to measure the transverse relaxation time T2. This
will be explained in detail in the paragraphs dedicated to NMR spectroscopy (4.4)
A.2.2.5 Moving Die Rheometry (MDR) and curing kinetics.
Rheological measurements are the main techniques to evaluate dynamo-mechanical performances
of rubber nanocomposites. These can be also measured at any moment during the vucanization
process, that is the formation of chemical crosslinks: therefore, it is a branch of the so-called
chemorheology. In particular, moving die rheometers make use of a steel die oscillating at a costant
frequency and strain amplitude. The crude material is placed all around the die, and the whole
system is enclosed in a pressurized thermostated chamber, as represented schematically in figure.
Upon heating at a chosen vulcanization temperature, the vulcanization process starts, and it can be
followed by the increase of the torque
acting on the moving die, which is a
consequence of the increase of elasticity that is occurring in the material. A typical curve of a
vulcanizing system is reported below: in the first part (induction), we observe a materials softening
due to the heating, and a subsequent increase (also referred to as scorch) due to the starting of the
vulcanization reaction; in a second time, the curve increase rapidly, as a consequence of the curing
reaction, reaching a plateau, corresponding to the end of the vulcanization. Overheating may cause
a reversion of the vulcanization process, represented by the third part of the curve that is deleterious
for the final material properties. The main result from the curve is the optimal curing time at which
the material can be completely vulcanized avoiding overcuring reaction to take place. Curing

98
profiles of crude compounds were measured with a Moving Die Rheometer (RPA 2000, Alpha
Technological) under the following conditions: ± 1° oscillation angle, 170°C temperature, 4.3 bar
pressure and 30 min running time.
A.2.2.6 Oscillating Disk Rheometry (ODR) and stress-strain measurements
Filled rubbers are characterized by Payne effect, consisting
in a strain softening phenomenon, due to the destruption of
the filler network. Since the filler network the main cause of
the reinforcement, at some critical value of strain the
Storage Modulus G’ drops from a starting plateau position
(integer network) to a final plateau position (distrupted
network), see image below. The extent of the Payne effect is
related to the balance between filler-filler and filler-rubber
interaction: it has been demonstrated for many different
nanofiller shapes and nature of the interphase. The testing
chamber is composed by an upper moving part (rotor), with
cone geometry and a lower part (stator), with plate
geometry. The torque acting on the rotor during oscillation can be transformed into a value of
modulus and divided into a real and an imaginary part, giving the Storage Modulus G’, associated
with an elastic response, and the Loss Modulus G’’, associated with a viscous response. The ratio
between G’’ and G’ (tanδ) is a predictive number of the energy disipated from the tire during usage.
ODR measurements of crude
composites was performed by
Rubber Process Analyzer
(RPA2000, Alpha Technologies) by
applying a shear stress mode. The
strain sweep tests were carried out at
70°C and 1 Hz from 2 to 100 % of
elongation. Same measurements was
also performed on cured
composites, after vulcanizing the
crudes in the testing chamber at the
optimum temperature. In this case the strain sweep was carried out at 70 °C and 10 Hz, from 0,2 to
10% elongation. Specimens were cut by using a Constant Volume Rubber Sample Cutter (CUTTER
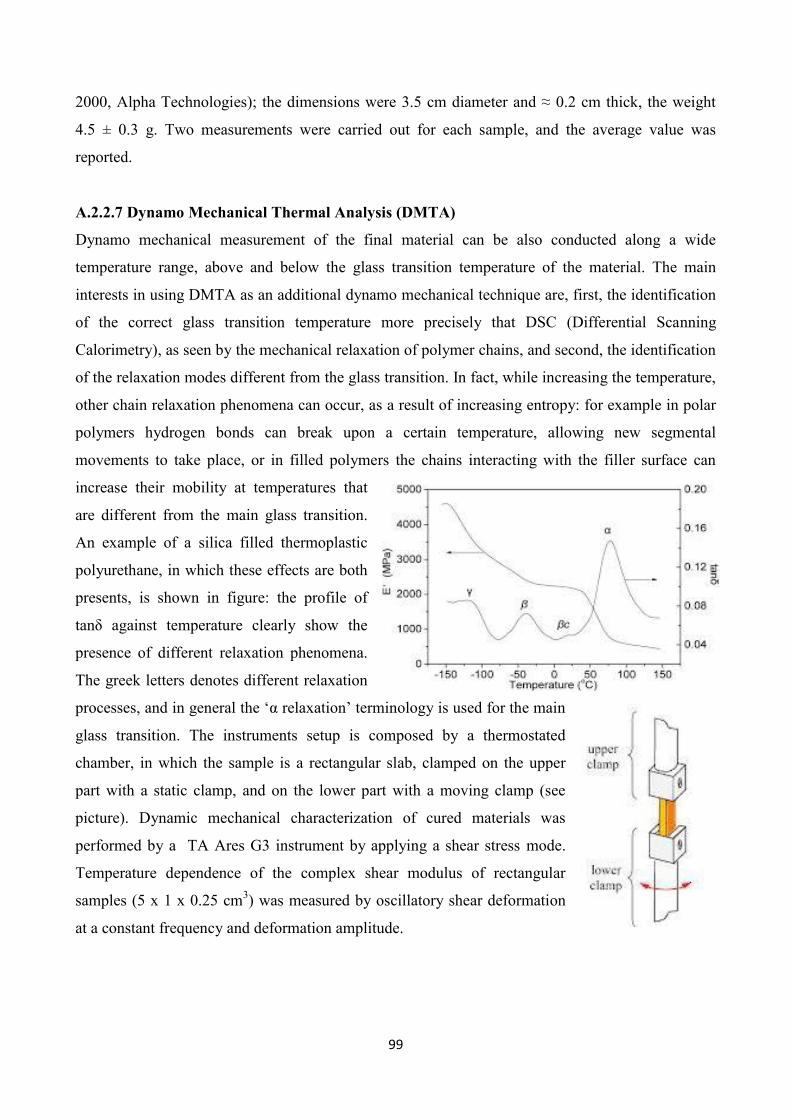
99
2000, Alpha Technologies); the dimensions were 3.5 cm diameter and ≈ 0.2 cm thick, the weight
4.5 ± 0.3 g. Two measurements were carried out for each sample, and the average value was
reported.
A.2.2.7 Dynamo Mechanical Thermal Analysis (DMTA)
Dynamo mechanical measurement of the final material can be also conducted along a wide
temperature range, above and below the glass transition temperature of the material. The main
interests in using DMTA as an additional dynamo mechanical technique are, first, the identification
of the correct glass transition temperature more precisely that DSC (Differential Scanning
Calorimetry), as seen by the mechanical relaxation of polymer chains, and second, the identification
of the relaxation modes different from the glass transition. In fact, while increasing the temperature,
other chain relaxation phenomena can occur, as a result of increasing entropy: for example in polar
polymers hydrogen bonds can break upon a certain temperature, allowing new segmental
movements to take place, or in filled polymers the chains interacting with the filler surface can
increase their mobility at temperatures that
are different from the main glass transition.
An example of a silica filled thermoplastic
polyurethane, in which these effects are both
presents, is shown in figure: the profile of
tanδ against temperature clearly show the
presence of different relaxation phenomena.
The greek letters denotes different relaxation
processes, and in general the ‘α relaxation’ terminology is used for the main
glass transition. The instruments setup is composed by a thermostated
chamber, in which the sample is a rectangular slab, clamped on the upper
part with a static clamp, and on the lower part with a moving clamp (see
picture). Dynamic mechanical characterization of cured materials was
performed by a TA Ares G3 instrument by applying a shear stress mode.
Temperature dependence of the complex shear modulus of rectangular
samples (5 x 1 x 0.25 cm3) was measured by oscillatory shear deformation
at a constant frequency and deformation amplitude.

100
A.2.2.8 Tensile tests and Mullins effect
Dynamo-Mechanical analysis in tensile mode can be
supportive of the data collected in shearing mode for
cured compounds, because they can explore a much
wider spectrum of deformation values, until failure.
A typical tensile curve for an unfilled vulcanized
rubber is reported in figure. Tensile properties at
high extensions can be predictive of stability and
ageing properties of the materials, that are related to
strain-induced crystallization phenomena, final
extensibility of polymer chains and to the mechanism of distruption of the interphase between filler
and rubber. In particular, cyclic loading/unloading tensile tests can more precisely reveal which part
of the input strain can be recovered and which cannot. This phenomenon of strain induced
permanent deformation (more precisely pseudo-permanent, since the recovery time is not infinite)
has been extensively studied by Mullins, hence it is referred to as Mullins effect. Two idealized
cycles are shown in figure. In the first loading cycle (ascending single arrow) the material is still
following the theoretical stress strain profile represented in figure, while the second loading cycle
(ascending double arrow) show an inflection which is due to the yielding of the material. The
instruments mainly consists in a couple of clamps (one fixed to the load cell and one movable
through the moving crosshead) in the middle of
which the a dumbbell-shaped (see chap. 3) specimen
is put. The extensometer is generally a video camera
which measure the actual strain value of the material
at each point, while the stress is recorded from the
moving crosshead. Tensile properties and Mullins
effect were measured on an Instron 5800 apparatus at
22 °C and a crosshead speed of 50 mm/min. The
equilibration time between each cycle was 30
minutes.

101
A.2.2.9 Dynamic compression experiments
Dynamic compression experiments on cured compounds simulate the real conditions of material
usage in a tire. As in tensile tests, it is possible to measure the Storage modulus, Loss modulus and
tanδ. The moduli obtained by compression experiments can be related to tensile moduli, by taking
into account the Poisson’s ratio of the material (for rubbery materials is about 0,35)
The instrument is composed by two plates (one static and one vibrating) that compress a cylindrical
sample until a starting value of compression figure (a). During the measurement, the vibrating up
and down to give a periodic compression to the sample centered in the initial value of compression,
see figure (b). The measurements were performed on an INSTRON Dynamic Dynamometer 1341 at
compression from 3 to 25% operating at 10 Hz and at 70°C, simulating the operating temperatures
of a tire in dry conditions.


