Download - RACIAL DIVERSITY IN MAINE'S SCHOOLS Jennifer Ayscue The Civil Rights Project, UCLA April 2, 2015

RACIAL DIVERSITY IN MAINE'S SCHOOLS
Jennifer Ayscue
The Civil Rights Project, UCLA
April 2, 2015

Overview
• Why does diversity matter?
• What are the enrollment and segregation trends in Maine’s public schools?
• What are the trends in Portland and Lewiston?
• How can Maine plan for increasing diversity in schools?

WHY DOES DIVERSITY MATTER?

Benefits of Diversity
• Academic
• Social
• Long-term

Harms of Segregation• Unequal opportunities
• Teachers• Classmates• Curriculum
• Unequal outcomes
• Academic performance• Drop-out rates• Success in college

Racial Transition• Portland
• 2000: 2.6% black• 2010: 7.1% black
•Lewiston• 2000: 1.1% black• 2010: 8.7% black
• Between 1980 and 2005, diverse areas in the nation’s 50 largest metros were more likely to become predominantly nonwhite than to remain diverse
• 1 out of 5 suburban school districts in the 25 largest metro areas are experiencing rapid racial change

WHAT ARE THE TRENDS IN MAINE'S PUBLIC SCHOOLS?

Enrollment Total
EnrollmentMaine 1989-1990 213,5141999-2000 209,0352010-2011 183,4272012-2013 179,323
Northeast 1989-1990 6,940,1351999-2000 8,007,8042010-2011 7,780,729
Nation 1989-1990 39,937,1351999-2000 46,737,3412010-2011 48,782,384

Enrollment by Race, Maine
97.6
0.70.8 0.4 0.5
92.5
1.81.1 1.5
3.1
White
Black
Asian
Latino
Other
1989-1990
2010-2011
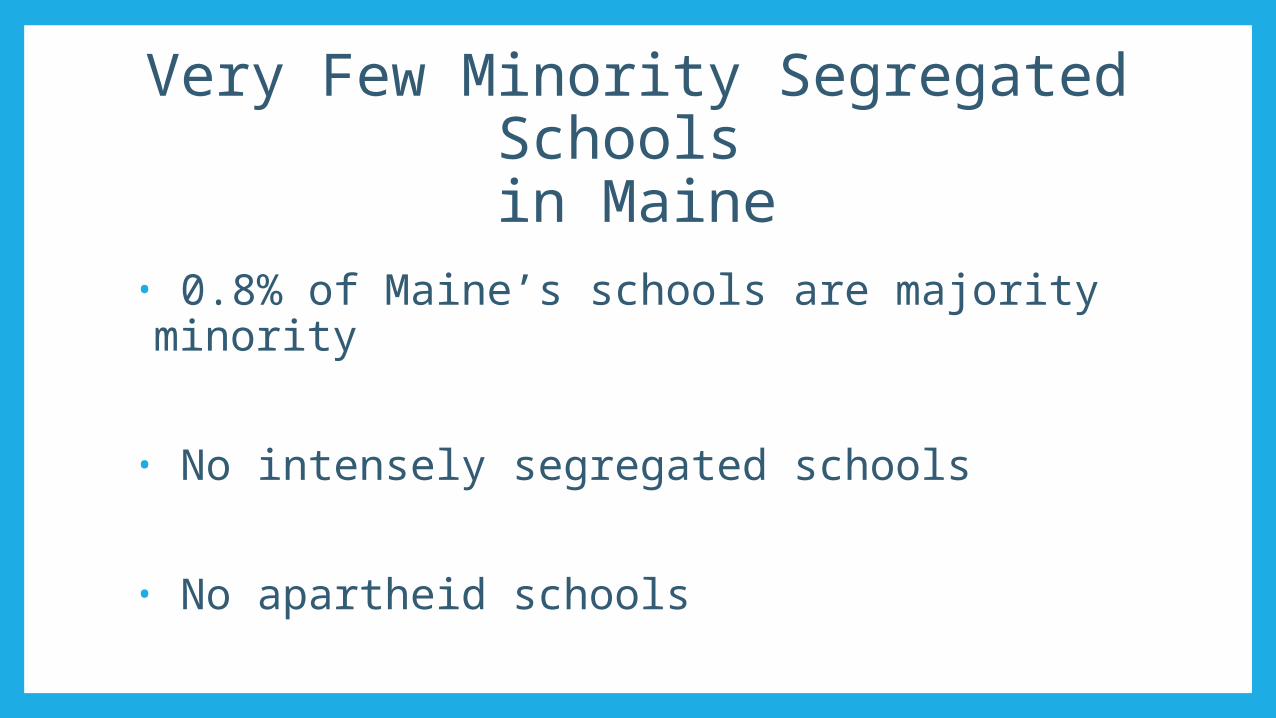
Very Few Minority Segregated Schools in Maine
• 0.8% of Maine’s schools are majority minority
• No intensely segregated schools
• No apartheid schools
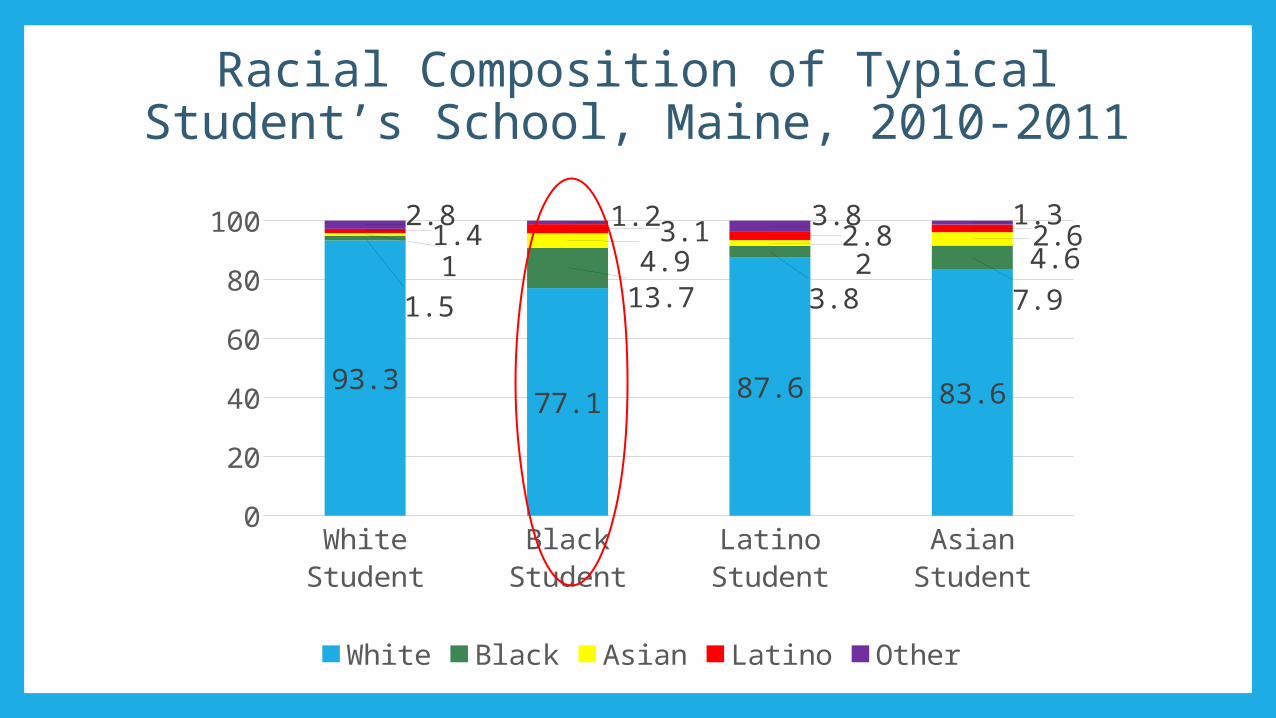
Racial Composition of Typical Student’s School, Maine, 2010-2011
White Student
Black Student
Latino Student
Asian Student
0
20
40
60
80
100
93.377.1 87.6 83.6
1.5 13.7 3.8 7.91 4.9 2 4.61.4 3.1 2.8 2.6
2.8 1.2 3.8 1.3
White Black Asian Latino Other
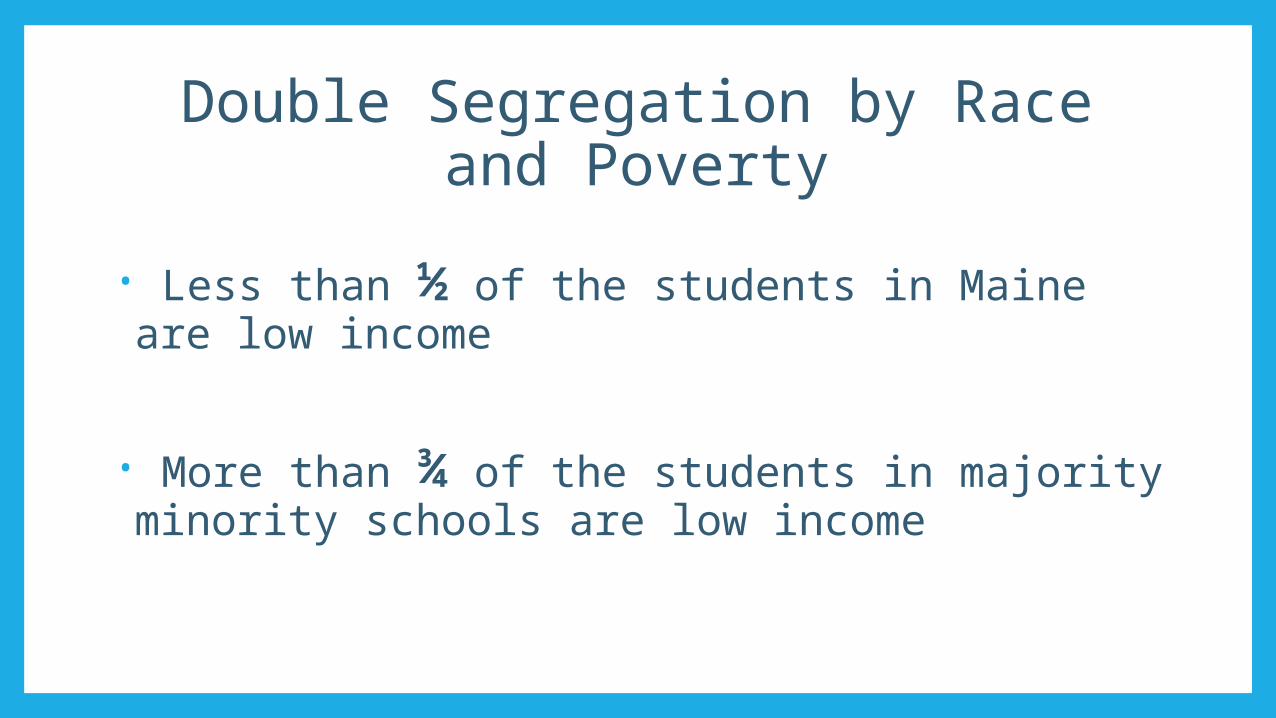
Double Segregation by Race and Poverty
• Less than ½ of the students in Maine are low income
• More than ¾ of the students in majority minority schools are low income

Socioeconomic Composition of Typical Student’s School, Maine,
2010-2011
Series10
10
20
30
40
50
60
45 42.6
50.546.2 45.7 % Low Income
White Exposure to Low IncomeBlack Exposure to Low IncomeLatino Exposure to Low IncomeAsian Exposure to Low Income

Key Findings, Maine
• Decreasing enrollment size
• Increasing racial diversity
• Very few segregated schools
• Black students are most segregated
• Double segregation by race and poverty

WHAT ABOUT PORTLAND
AND LEWISTON?

Enrollment by Race, Portland Metro, 2010-2011
90.8
3.31.7 1.9 2.3
White
Black
Latino
Asian
Other

White Proportion in Metro Districts
1989
1999
2010
YARMOUTH98.6
%98.3
%94.2
%
CAPE ELIZABETH
97.8%
98.1%
93.2%
RSU 15/ MSAD 15
99.0%
98.0%
94.8%
FALMOUTH 98.3%
97.8%
93.7%
WESTBROOK
97.4%
96.0%
86.2%
1989
1999
2010
GORHAM 98.7%
97.4%
96.3%
SOUTH PORTLAND
96.9%
95.3%
84.6%
SCARBOROUGH
99.5%
98.3%
94.7%
PORTLAND 90.5%
84.8%
64.8%

Enrollment by Race, Portland School District, 2012-
2013
61.2
22.7
5.66.8 3.7
White
Black
Latino
Asian
Other

Segregated Schools, Portland Public Schools
• 4 elementary schools are majority minority
• 3 elementary schools are more than 75% white

Key Findings, Portland
• Metro enrollment is increasing in size
• Metro is slightly more diverse than the state
• Portland Public Schools is substantially more diverse than the state and the metro
• 4 of the state’s 5 majority minority schools are in Portland Public Schools

Enrollment by Race, Lewiston Public Schools, 2012-
2013
64.5
29.2
2.8 1.1 2.5
White
Black
Latino
Asian
Other

Segregated Schools, Lewiston Public Schools
• 1 elementary school is majority minority
• 1 elementary school is almost majority minority
• 2 elementary schools are more than 75% white

Conclusions
• Racial diversity is increasing
• Current instances of segregation are modest and localized

HOW CAN MAINE PLAN FOR
INCREASING DIVERSITY IN SCHOOLS?

Recommendations• Include diversity goals in student assignment policies
• Work with housing agencies
• Adopt regional approaches
• Include civil rights standards with choice options
• Recruit, train, and hire diverse teaching staff
• Provide teacher training about diversity


