
1
Developing District-Wise Surface Area
of Himachal Pradesh
Centre for Geo-informatics, Research and Training
CSK Himachal Pradesh Agricultural University
Palampur -176 062, Himachal Pradesh, INDIA
R.M. Bhagat, PhDChitra Sood, PhD
Vaibhav Kalia, MCARanbir Singh Rana, PhD
2006

2
Contents Foreword
Acknowledgement Executive Summary Disclaimer
1. INTRODUCTION
1.1 Background
1.2 Rationale
1.3 Geographical Information of Himachal Pradesh
1.4 Mountain areas and Remote Sensing/Geo-information Technology
1.5 Surface area calculations using GIS
2. OBJECTIVES
3. MATERIALS AND METHODS
3.1 The Study Area
3.2 Inputs required for the calculation of 3-D surface area
3.2.1 Topographic Maps
3.2.2 Satellite imagery of Himachal Pradesh
3.2.3 Contour lines
3.2.4 Digital Elevation Model of Himachal Pradesh
3.2.5 Image Processing software
3.3 Calculations of 3-D surface area of Himachal Pradesh.
3.3.1 The TIN model
3.2.2 Creating TIN with DEM
3.3.3 Creating TIN with Contours
3.3.4 Finishing the TIN
3.4 Outputs
4. RESULTS AND DISCUSSION
5. CONCLUSION
6. REFERENCES

3
List of Figures
Fig. 1. Mountains, river, valleys- view of river beas at Manali, HP .
Fig. 2a Different type of land use in Himachal Pradesh
Fig. 2b Different type of land use in Himachal Pradesh
Fig. 3 XY ruled 3-D surface view of Himachal Pradesh.
Fig. 4 Diagrammatic representation of plain versus slope area
Fig. 5. Study area- A satellite image of Himachal Pradesh IRS1D LISS3
Fig. 6 Administrative map of Himachal Pradesh
Fig. 7 Land cover of Himachal Pradesh
Fig. 8 Index map for the 1:50,000 scale topographic maps of Himachal Pradesh
Fig. 9 Contour lines at 40 m interval for Himachal Pradesh
Fig. 10 Digital elevation model of Himachal Pradesh
Fig. 11 Triangular TIN surface.
Fig. 12 TIN model with contours displayed
Fig. 13 TIN surface for District Kangra.
Fig. 14 Three dimensional (3-D) surface area of district Bilaspur.
Fig. 15 Three dimensional (3-D) surface area of district Chamba.
Fig. 16 Three dimensional (3-D) surface area of district Hamirpur.
Fig. 17 Three dimensional (3-D) surface area of district Kangra.
Fig. 18 Three dimensional (3-D) surface area of district Kinnaur.
Fig. 19 Three dimensional (3-D) surface area of district Kullu.
Fig. 20 Three dimensional (3-D) surface area of district Lahaul-Spiti.
Fig. 21 Three dimensional (3-D) surface area of district Mandi.
Fig. 22 Three dimensional (3-D) surface area of district Shimla.
Fig. 23 Three dimensional (3-D) surface area of district Sirmaur.
Fig. 24 Three dimensional (3-D) surface area of district Solan.
Fig. 25 Three dimensional (3-D) surface area of district Una.
Fig. 26 General land cover of Himachal Pradesh
4
List of Tables
Table 1. IRS1D LISS3 satellite images of Himachal Pradesh
Table 2. IRS-1C/1D LISS3 Wavelength range.
Table 3. District-wise two dimensional (2-D) and three dimensional (3-D) surface area of Himachal Pradesh.
Table 4. Percent increase in calculated district-wise 3- D area.
Table 5. Spatial Distribution of Land Cover Classes of Himachal Pradesh

5
Acknowledgement
The support of Dr. D.S. Rathore, Vice Chancellor, CSK Himachal Pradesh Agriculture
University, Palampur, needs special thanks in completing this project. We would like to
extend our deepest gratitude to him.
Mr. D.K. Sharma, Principal Secretary & Director Planning, initially envisioned the idea of
measuring the three dimensional area of Himachal Pradesh and entrusted us for the
realization of this proposal. We sincerely thank him for providing financial support
through the Department of Planning, Himachal Pradesh and important suggestions
during the course of investigations. Valuable inputs provided by Dr. Jagmohan Singh
former Vice Chancellor of CSK HP Agricultural University is also thankfully
acknowledged.
Initiation of this project by Dr. Tej Partap, former Vice Chancellor, CSK Himachal
Pradesh Agriculture University, Palampur, and his valuable input & advice while
implementing the project is profoundly accredited.
Thanks are due to Dr. R.C. Thakur, former Director of Research for his personal
supervision and evaluation of the project at different development stages. We are also
thankful to Dr. S.C. Sharma, Director of Research for his continual support in the
finalization of the project report. The support extended by the staff of Geo-centre during
the execution of this project is thankfully acknowledged.
We would like to thank our global project partner i.e. International Centre for Integrated
Mountain Development (ICIMOD) for providing support for capacity building by way of
providing training to the research staff and technical support during the course of this
investigation.
Project Team:
R. M. Bhagat, Chitra Sood, Vaibhav Kalia, Ranbir Rana

6
Foreword
Planning for the mountain regions is difficult and it has been emphasized that the multidimensionality of hill features calls for basic changes in development goals. Unfortunately, the development interventions being implemented in mountain areas are based on approaches and models which are not basically conceived or designed for these areas. Owing to this reason they proved less effective in handling the problems of hilly areas and resulted in poor economic performance, over-exploitation of hill resources, disregard of equity issues, and environmental destabilization. The area of Himachal Pradesh that exists in the state revenue records is 55673 sq. km. This dimension again is a flatland estimate while the undulating topography, the slopes, the peaks perceptibly encompass more surface area than a flat horizontal land. The area locked up in slopes, must be substantial area which however, was never ever accounted for planning purpose. Due to this reason, there have been always discrepancies in the figures under various land use composed by different surveys/assessments as these estimates are made on government recorded area and not the surface area. Even the data available in Statistical Outline of HP have shown considerable variation with ground truth with latest indications from remote sensing studies. Recognizing the need of actual surface area estimation of Himachal Pradesh in order to ensure appropriate developmental planning and action, The Centre for Geo-informatics, Research and Training at CSK Himachal Pradesh Agriculture University attempted this first-of-its-kind activity, that of estimating the actual surface area using modern Geo-IT tools -remote sensing and GIS. The new area estimates, according to this report, are 86384.77 sq. km about 56 per cent more than the existing information. This, to my mind, is an achievement of special significance for planning that is intended for actual area. The state can be projected as a “Developmental Model” for the entire Hindu Kush Himalayas region.
Though the study may leave many unanswered questions that may crop up with this actual area estimation-that where is this addional area locked up? Will there be possibility of adding new area to crop lands or depleting forests? The answer to these may be a strong ‘yes’ but there may be many other factors working around that require further detailed effort. I complement and congratulate the study team and their associates for undertaking this venture and hope they will be able to answer these anticipated queries in their further studies. (S.C. Sharma) Director of Research CSK HPKV, Palampur

7
Disclaimer
The results of this report, the views expressed, information and analysis are solely the output of a
computer generated estimation of the three dimensional surface area of Himachal Pradesh. The
authors assume no responsibility for any predicament in this regard, nor for any actions taken in
reliance thereon, though criticism on approach and/or methodology is welcome. Further, the
authors also assume no responsibility of the additional area implications on boundaries and
frontiers of the state of Himachal Pradesh or any implication thereof on policies etc. The authors
strongly recommend that these three dimensional area estimates need to be thoroughly verified and
discussed with Survey of India (SOI) before implementation. Although, the authors have taken all
care to verify the procedure adopted to make the estimates, but would strongly recommend its
verification by an independent agency preferably the Survey of India and the report may not be
given for any public use unless exclusively approved by SOI. Some of the maps shown in the report
are only sample maps as the exact maps are withheld for the reasons of security.

8
Executive Summary
The overall development of any region depends upon precise definition of the area and
land use pattern. For making strategies for sustainable development in hills, planners
must take into account the amount of actual area available. In the plain areas, the
estimates of the actual area can be easily made as flatlands are easy to measure. In the
mountain areas where there is undulating topography, precise estimates of actual areas
can not be made by ordinary means as surface area is a derivative of elevation also.
The Government records estimate the area of Himachal Pradesh as 55673 sq. km. This
is however, a flat land estimate which is unrealistic and vague in the mountain context.
The existing estimates of surface area are highly irrational as they don’t consider the
spot heights. Therefore, an attempt was made to estimate the actual surface area of
Himachal Pradesh taking into account the topography of Himachal Pradesh by
employing area estimation technique ingrained in GIS. This functionality adds new
accurate dimensions to the realistic surface area estimation.
Triangulated Irregular Networks (TIN) approach using vector data sets and polygons
was adopted to generate surface area which is inherently more accurate and precise
than any raster data sets and area grids. A three dimensional TIN model was created
from contour lines. The contour lines were digitized from the Survey of India topographic
maps of the study area. The 50m interval contour lines thus provided a mechanism to
establish the heights of the region. The contours were utilized in the creation of
Triangulated Irregular Network surface (TIN surface). The TIN model represents a
surface as a set of contiguous, non-overlapping triangles. Within each triangle the
surface is represented by a plane.
The three dimensional surface area estimated for Himachal Pradesh is 88384.77 sq. km,
which is about 56 per cent more than the documented geographical area 55673 sq. km.
of Himachal Pradesh. An increase in area was observed in all the districts, however, it
was more evident in the districts which lie at the height of more than 1500 m with
maximum increase of more than 88 per cent in the districts with high hills e.g. district
Kinnaur, Lahaul Spiti, Shimla, Chamba, Kullu and Kangra. In the districts with relatively
flat lands e.g. Una, Hamirpur and Bilaspur the additional areas are comparatively less.

9
The results of the present study may answer the existing inconsistencies in the land use
records of the state which often spatially mismatch. It would facilitate the planners to
rethink and re-plan the development strategies for mountainous areas and start
developing an approach which could facilitate proper assessment of constraints and
potentialities of hill area as well as designing of policy and programme options suited to
the specific situations of the hill areas.

10
1. INTRODUCTION
1.1 Background
The planning on development strategies for agriculture in mountain areas depends upon
the precise definition of the area and land use pattern. However, in conceiving a
conceptual or operational approach for the development of hill areas, the key issue that
should be taken into account is to first understand that the hills are characterised by a
three dimensional spatiality unlike the plains that may have only a two dimensional
spatiality. This additional dimension obstructs the applicability of development
approaches of the plains to the hills. Because of this special factor i.e. undulating
topography, precise estimates of actual areas can not be made by ordinary means like
flatlands which are easy to measure. When hills are examined from the plains'
perspective, the measured area is less and hence a huge discrepancy exists between
actual area and the area for which planning/development measures must be taken.
Landscape area is almost always presented in terms of planimetric area hence square
kilometer in a mountainous area represents the same amount of land area as a square
kilometer in the plains. The multifaceted dimensions of hills can help in presenting an
array of positive and negative attributes of hill situations. The focus of development
interventions should be on protection and enhancement of positive attributes and
maximisation of their role in development interventions. Even when describing
mountains, the planning is generally based on only planimetric area although resources
exist, distributed or limited spatially, the assessment of these using surface area is must.
An understanding of these attributes can greatly help in determining developmental
goals and priorities and in designing operational programmes.
For making strategies for sustainable development in hills, planners must take into
account the amount of actual area available. Flatland estimates are unrealistic and
vague in the mountain context. The multidimensionality of hill features calls for basic
changes in developmental goals. The flat area of Himachal Pradesh in government
records (which is commonly used for all planning purposes) is 55673 sq. km, however,
due to extensive slopping valleys existing in most of the part, actual area may be much
higher. As mostly, the development strategies for hill areas are resource-centred, the

11
actual area calculation will act as constraints or indicators of resource base potentials of
the state. The conventional planning approach of flat lands is thus highly ruled out and
actual area calculation forms a compelling basis for an integrated approach to
development interventions in hilly areas.
If the area estimates of a region are not precise then all the planning process is
jeopardized. The time, effort and funds spent on the developmental process are either
under or over utilized. Mountains are the places where area estimation is a tedious task
by ordinary means; hence a geographical system based approach can be of help in such
areas, where remote sensing data using satellite imagery sets can be utilized to estimate
the precise area. Such approaches in Himachal Pradesh are very useful particularly in
the tribal districts, which are mostly mountainous and are underdeveloped in many
respects. For example, it has long been felt that there is a continuous increase in
cultivable area in Himachal Pradesh, while the total area is remaining the same. The
increase in area is not traceable, while it is always reported that the area under a
particular crop has increased. Further, It is also essential that the development of a
region depends upon the precise definition of the area and land use pattern.
Due consideration must be given to complexity of hill characteristics, their multiple
dimensionality and their interrelationships to provide contextual perspective to decisions
and actions in hilly areas. The additional area which may be locked up in five major
classes of land cover i.e. agriculture, forests, settlements, snow fields or non-vegetation
areas is certainly contributing and needs proper documentation, conservation and
harnessing of mountain potentialities. The additional area would certainly alter
development goals and needs in the state which should be described and defined in
broader terms with an explicit focus on issues such as equity, environmental stability,
and economic betterment. The present study is thus an attempt to calculate the surface
area (district-wise) of entire Himachal Pradesh. Also, it is felt that this study will be most
appropriate and desirable to help in the agricultural planning task as well as for farmer’s
development in Himachal Pradesh. An attempt has been made through this study to
remove the anomalies in the precise estimate of the surface areas, by using a GIS
platform.

12
1.2 Rationale
Area is a fundamental parameter derived from terrain analysis which is necessary for
numerous decision-making processes. There is a need to obtain an accurate
approximation of distance and area which are the fundamental terrain parameters
associated with spatial data context since these have a bearing on cost (Navigation,
cadastral applications). This problem has been addressed within the framework of a
given data scale and a suitable projection. In most elementary GIS models, distance and
area calculations are based on the vector data model which is a planar approximation of
data layers. This does not approximate distance or area on an undulating surface in
reality. Given the pre-conditions that the data layers are in the desired scale and
projection, a novel way to integrate a raster elevation model to retrieve the near true
area and distance (involving elevation data & slopes) is attempted in the present study.
1.3 Geographic Information of Himachal Pradesh
Himachal Pradesh is a mountain province in the Indian Himalayas, covering an area of
over fifty thousand sq. km. Inhabited by five million people, of which over 92 percent
rural population lives in over 16000 villages. It is located between 30"22' and 33"12'
north latitude and between 75"45' and 79"04' east longitude. The mountainous state has
altitudes ranging from 350 to 7000 meters (1050 ft. to 21000 ft.) above the sea level. As
is common in the Himalayan region, human settlements are scattered but largely
concentrated in the low and mid hill areas and highlands are sparsely populated.
Himachal Pradesh can be considered special as development model in the entire Hindu
Kush Himalayan region, as tremendous progress has taken place in the farm economy,
food security with adequate institutional and infrastructure support and well being of its
people (who enjoy reasonably better life styles than other mountainous states). The
state provides a rare example of the success story in handling socio economic
marginality of High Mountain communities, which are otherwise considered gifted with
fragile, marginal and inaccessible conditions- leading to perpetual poverty.
In addition to the physical difficulties already encountered by mountain dwellers, various
national policies adversely affect mountain areas. During recent year, the goal of macro-
economic policies in the mountain areas has been directed towards the extraction of
13
mountain resources, largely for use in the non-mountain hinterland (plains) or in urban
areas within the mountains. The developmental policies for the investment or resource
allocation pattern in Himachal Pradesh require additional specific information pertaining
to area and resources. The area of Himachal Pradesh as per state revenue records is
55673 sq km. This area does not include the area locked up in slopes due to undulating
topography of the state. Hence, a substantial amount of area is concealed and never
been accounted for planning purpose before. The spatial distribution of land cover
estimates for the state even through remote sensing has been made on government
recorded area and may not be the exact surface area and may not be detailed.
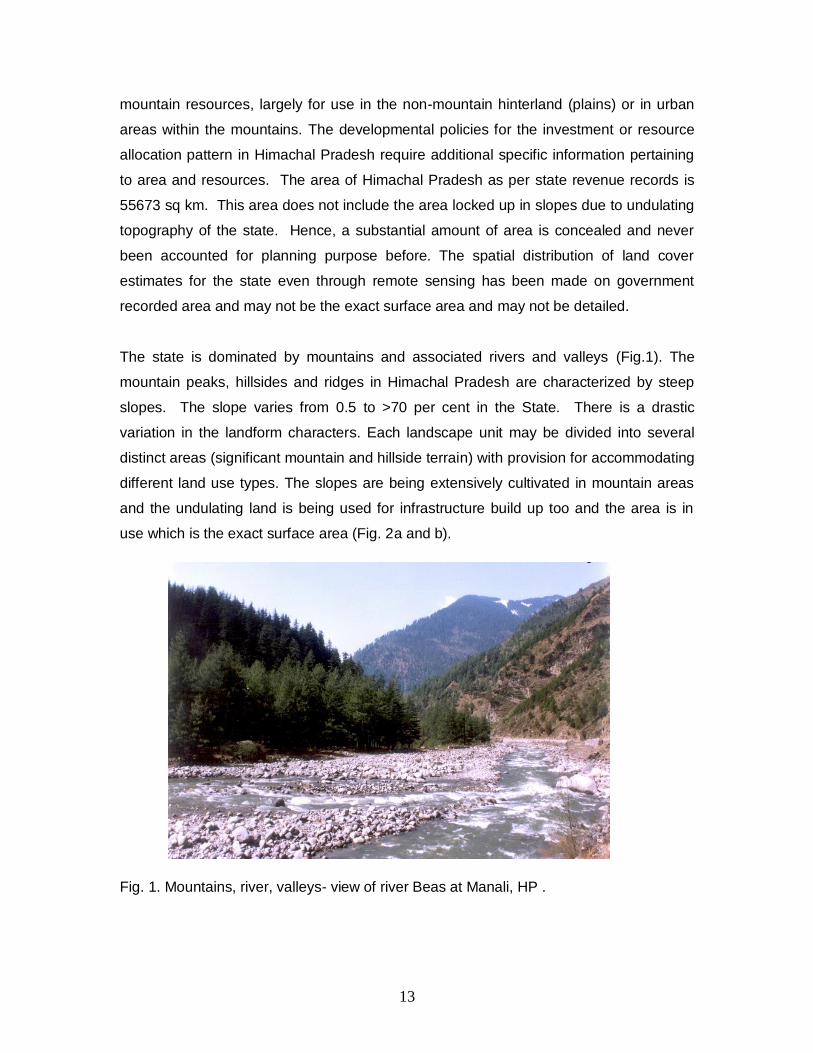
The state is dominated by mountains and associated rivers and valleys (Fig.1). The
mountain peaks, hillsides and ridges in Himachal Pradesh are characterized by steep
slopes. The slope varies from 0.5 to >70 per cent in the State. There is a drastic
variation in the landform characters. Each landscape unit may be divided into several
distinct areas (significant mountain and hillside terrain) with provision for accommodating
different land use types. The slopes are being extensively cultivated in mountain areas
and the undulating land is being used for infrastructure build up too and the area is in
use which is the exact surface area (Fig. 2a and b).
Fig. 1. Mountains, river, valleys- view of river Beas at Manali, HP .

14
Sloppy Pasture lands in Himachal Pradesh
Settlements on slopes
Hill- Farming
Horticulture (Orchards)
Fig. 2a Different type of land use in Himachal Pradesh

15
Forest
Infrastructure/industries/mining
Water bodies-glaciers
Tea plantation on slopes
Fig. 2b Different type of land use in Himachal Pradesh

16
The land use in Himachal Pradesh is not limited to specific relatively plain areas. The
areas with slopes too include agricultural/buildable lands, roadways, driveways, public
structures, buffers etc. Up to 40 per cent of the slope area is being harnessed effectively
in the state; however, in some parts with 60-70 percent slopes, agriculture is being made
feasible.
Fig. 3 XY ruled 3-D surface view of Himachal Pradesh.
Fig. 3 shows the XY ruled 3-D surface view of Himachal Pradesh. Area enclosed under
a sloppy surface is bound be higher than the area of a plain surface (Fig. 4).
Fig. 4 Diagrammatic representation of plain versus slope area

17
This anticipated area is, however, currently unreported and as a result planning may be
done for the less area. The present study is an attempt to calculate the surface area for
Himachal Pradesh using modern Geo-IT tools viz., remote sensing and geographical
information system.
1.4 Mountain areas and Remote Sensing/Geo-information Technology
Mountain areas present a great challenge for the application of Geo-Information
technology due to their diversity, marginality, and strategic importance, as well as their
different physical, biological, and societal systems. When compared with the plains in
the lowlands, the physical characteristics of the mountain environment are more
complex and need to be analysed using a three-dimensional approach/methodology to
arrive at an approximate representation of the aspect, slope, and topography of the
mountains (Heywood al. 1994). Digital Elevation Models (DEM) are used for different
types of applications in mountain environments, e.g., regional resource inventory;
planning and management, hazard assessment, modeling of the ecology, climate, or
hydrology; and geomorphology (sources quoted in Stocks and Heywood 1994).
A Geographic Information System (GIS) is a computer-based system capable of holding
and using data describing places on the earth’s surface. The strength of Geo-Information
technology is its ability to integrate data from various resource disciplines, using a
common geographical boundaries as a reference. The system is characterised by two
forms of data; i.e., attribute data, either statistical or textural, contained in tables, lists,
catalogues, etc and geographic information, either spatial or locational, contained in
various kinds of maps. Computer technology, for quite some time, has made it possible
to manipulate and analyse statistical information. Recent development has facilitated the
automation of maps into digital databases and allowed the manipulation to produce a
combination of maps and tables that show ‘where’ and what’, and to answer many
questions that remained open. This computerized system, known as GIS, can store,
manipulate, display, and produce geographic (spatial) information integrated with
statistical and textual data; it is becoming one of the most useful and powerful analytical
tools for resource planners and managers (Marble et al. 1984; Foote and Lynch 1996).

18
Application of remote sensing has a special place in Mountains as most of the areas are
inaccessible and multi-stage approach using remotely sensed data increases the ability
and accuracy of the work. Through remote sensing, new mechanisms for obtaining
information on remote and inaccessible areas have become available. Visual and digital
image analysis techniques have been very useful in studying mountain areas. Satellite
imagery IRS1D LISS3 of Himachal Pradesh has been used in the present study.
1.5 Surface area calculations using GIS
Mountains are areas of high relief having distinct changes in terrain slope and thus
require a three-dimensional representation for spatial modeling. Maps and GIS in
general treat the world as flat (plain land); this two-dimensional view leads to
incompatibility in appropriateness of GIS application between that for level land and
mountains. Mountains have some very specific features that need heterogeneity.
Unfortunately, it is not the practice, apart from few modifications made in GIS
applications for mountain areas (Ghosh, 2001). Maps represent geographical area on
the planar surface whereas due to slope differences in the mountains the actual surface
area is greater, the discrepancy in area calculation leads to over or under estimation.
Decision making can be improved by utilizing the surface area calculation functionality
with GIS. Such functionality does add a new dimension to the accuracy of the surface
area value, although the dependency of accuracy also depends on the elevation model
(TIN, DEM, DTED) in use, its information source (interpolated contours, stereo-imagery)
and the resolution (Kundu and Pradhan, 2002). Three dimensional - 3D analysts in GIS
software supports three primary data types for modeling features in three dimensions-
grids, TIN and three dimensional shape files. The most accurate measure of the surface
area within a polygon should include all the area within the polygon.
Surface area calculations have been attempted before (Strahler, 1952) and several
algorithms were developed for the purpose, all of which are based on slope. Surface
area, therefore is a second derivative of elevation data. Elghazali et al. (1986) described
the areal parameter, which essentially is a global function that produces a ratio between
the surface area and plan area. This parameter was used for terrain characterisation but

19
also has usefulness as a measure to estimate surface area.
The triangulated irregular network (TIN) is a surface representation based on randomly
or irregularly spaced data points that have x, y, and z coordinates. A typical example of
this coordinate system is longitude (x), latitude (y), and an elevation or concentration (z).
Non-overlapping, connecting triangles are drawn between all data points where the data
points (or control points) are the vertices. In its basic form, tin elevations are calculated
based on linear regression between control points; contours are then drawn across the
sides of the connected, tilting triangular plates.
A DEM can be preferred to a TIN because the latter is based on slope inflection points
and fail to capture the subtle difference in slope along a particular aspect. A DEM is
essentially, “a regular gridded matrix representation of the continuous variation of relief
over space” (Burrough & McDonnell, 1987). This in fact means that a DEM is a
continuous grid containing the elevation at its spatial location in each grid cell. Before the
80s, topographic contour maps and aerial photographs were the primary sources of
geomorphological information. The accuracy of these maps was highly questionable and
there were also discrepancies in information content for two maps for the same region
but from different sources. After the advent of DEM this discrepancy was reduced to a
large extent. Nevertheless, a DEM is also subject to error depending on the method of
its acquisition, as each method has its own advantages and limitations. Usually a DEM is
interpolated from digitising spot heights as recorded on field or from an existing contour
map. But a better DEM is extracted from stereo aerial photographs or stereo digital
remote sensing imagery.
Three dimensional TIN elevation model can be created from contour lines. The contour
produces results that range from smooth and relatively less accurate to less smooth and
more accurate. For purposes of generating a series of structured contours, a single
interpolation method is required that reflects semi-regional to regional geological trends,
yet accurately reflect the control data. Triangulated Irregular Networks (TINS) approach
to generate surface-area statistics is more accurate for calculating 3D area.

20
2. OBJECTIVE
To develop district-wise surface area files for Himachal Pradesh
2 D Surface of HP
3 D Surface of HP

21
3. MATERIALS AND METHODS
3.1 The Study Area
The state of Himachal Pradesh is a mountain province in the Indian Himalayas covering
an area of 55673 sq km where mountains and hills occupy most of the land. It extends
from the Shiwalik hills in the South to the Great Himalayan range including a slice of
Trans-Himalayas in the North. Geographically, the state of Himachal Pradesh is situated
between 300 22’ 44” and 330 12’ 40” N latitude and 750 45’ 55” to 790 04’ 20” E longitude
(Fig. 5).
Fig. 5. Study area- A satellite image of Himachal Pradesh IRS1D LISS3.
The state of Himachal Pradesh comprises of 12 districts and 109 tehsils (Fig 6). The
Tehsil and districts are the administrative units which are also repositories of all the data
about the respective units. These are derived from Survey of India (SOI) toposheets
(1:50,000 scale).

22
Fig. 6 Administrative map of Himachal Pradesh
The general land cover map of Himachal Pradesh is presented in Fig 7 which is
generated by ISODATA clustering of GeoCover Landsat TM (bands 7, 4, 2) of Himachal
Pradesh. The spatial distribution of land cover types indicates 14 % of the total area is
under agriculture with 32 percent area as forests.
Fig. 7 Land cover of Himachal Pradesh

23
3.2 Inputs required for the calculation of 3-D surface area.
3.2.1 Topographic Maps
The topographic maps covering entire state of Himachal Pradesh, published by survey
of India in the period from the 1960s-1970s on a scale of 1:50,000 have been acquired.
Himachal Pradesh is situated between 30º 15' to 33º 15º 0' E longitude and 75º 45’ to
79º 0’ N latitude. The coordinate system parameters for Himachal Pradesh are as
follows.
The coordinate system parameters for the maps of the Himachal are as follows:
• Projection: Albers Equal Area Conic
• Ellipsoid: WGS 84
• Datum: WGS 1984
• False easting: 0.0000000
• False northing: 0.0000000
• Central meridian: 82° 30’E
• Central parallel: 0° 0’ N
• Latitude of first parallel 20 N
• Latitude of second parallel 35 N
The minimum and maximum X and Y values required in the above geo-referencing
system in the Himachal area falling in Grid Zone II B are:
Min X,Y: -646838.500, 3298325.500
Max X,Y: -328038.500, 3623225.500
Altogether 110 topographic map sheets cover the whole of Himachal (Fig. 8). The digital
topographic map (ARC digitized Raster Graphics (ADRG) published in January 1996 by
the National Imagery and Mapping Agency (NIMA) and Defense Mapping Agency (DMA)
of the U.S. Government at the scale of 1:500,000 with same projection parameter as
mentioned above were procured to be used in the study.
24
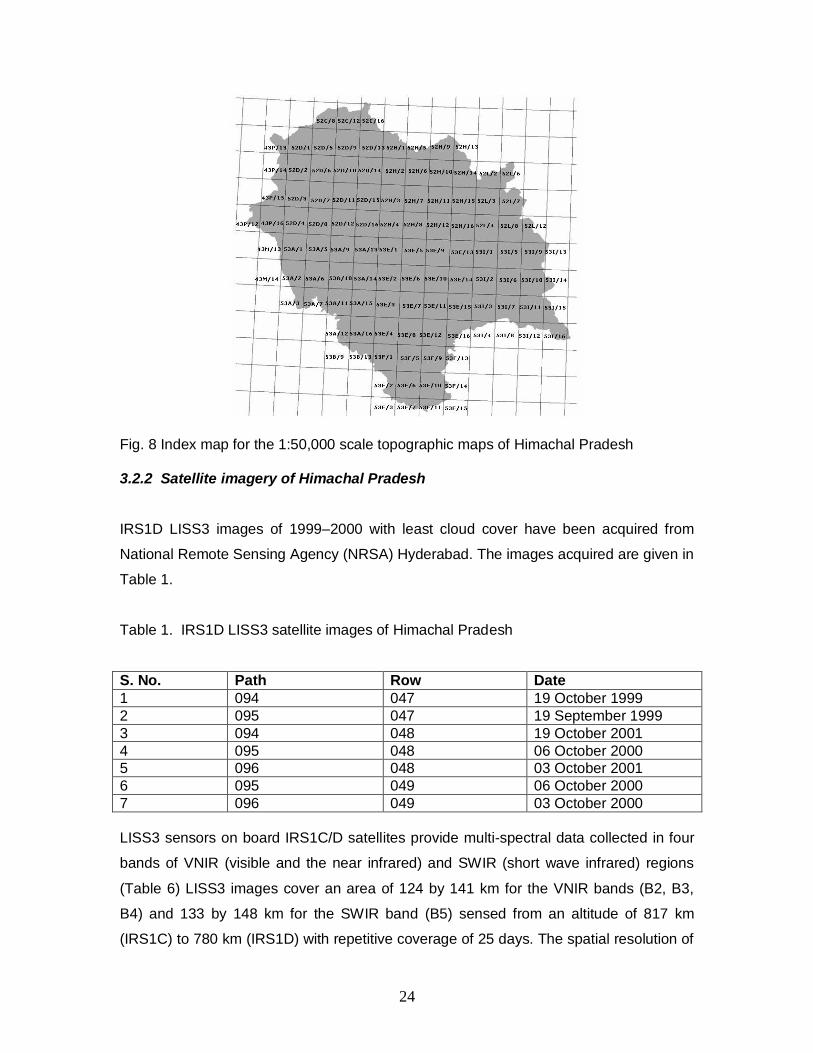
Fig. 8 Index map for the 1:50,000 scale topographic maps of Himachal Pradesh
3.2.2 Satellite imagery of Himachal Pradesh
IRS1D LISS3 images of 1999–2000 with least cloud cover have been acquired from
National Remote Sensing Agency (NRSA) Hyderabad. The images acquired are given in
Table 1.
Table 1. IRS1D LISS3 satellite images of Himachal Pradesh
S. No. Path Row Date
1 094 047 19 October 1999
2 095 047 19 September 1999
3 094 048 19 October 2001
4 095 048 06 October 2000
5 096 048 03 October 2001
6 095 049 06 October 2000
7 096 049 03 October 2000
LISS3 sensors on board IRS1C/D satellites provide multi-spectral data collected in four
bands of VNIR (visible and the near infrared) and SWIR (short wave infrared) regions
(Table 6) LISS3 images cover an area of 124 by 141 km for the VNIR bands (B2, B3,
B4) and 133 by 148 km for the SWIR band (B5) sensed from an altitude of 817 km
(IRS1C) to 780 km (IRS1D) with repetitive coverage of 25 days. The spatial resolution of

25
VNIR bands is 24m and that of SWIR is 71m. The mosaic of satellite images of different
bands of IRS1C LISS3 1D of Himachal Pradesh area is given in Figure 9.
Table 2. IRS-1C/1D LISS3 Wavelength range.
Band Wavelength
Green 0.52–0.59 µm (B2)
Red 0.62–0.68 µm (B3)
NIR 0.77–0.86 µm (B4)
IIR 1.55–1.75 µm (B5)
The satellite images have to be geometrically rectified based on the appropriate geo-
referencing system and cell sizes. The same geo-reference system is required for the
integration and analysis of the remote sensing satellite data in the GIS database. The
image resolutions and geo-reference system should be the same for better results.
3.2.3 Contour lines
These are digitized from 1:50,000 scale topographic map (Survey of India). Fig. 9 shows
a sample of organised contour map of Himachal Pradesh.
Fig. 9 A sample organized contour map of Himachal Pradesh

26
3.2.4 Digital Elevation Model of Himachal Pradesh
The Digital Elevation Model (DEM), as shown in Fig. 10, is derived from the interpolation
of contour lines (Fig. 6) and spot heights. The TOPOGRID method was used to
interpolate the DEM. The output resolution of the DEM is 50m.
Fig. 10 Digital elevation model of Himachal Pradesh
3.2.5 Image Processing software
ArcGIS 9, ArcView 3.2 and ERDAS Imagine software were used for image processing.
3.3 Calculations of 3-D surface area of Himachal Pradesh.
The contour lines were digitized (exact contour map not shown in the report) from the
Survey of India topographic maps of the study area. The contour lines thus provided a
mechanism to establish the heights of the region. The contours were utilized in the
creation of Triangulated Irregular Network Surface (TIN surface) which is a series of
connected triangles accurately representing a surface with less data points than other
data models.

27
3.3.1 The TIN model
The tin surface model is available through the 3-D Analyst extension of ArcView GIS..
The Triangulated Irregular Network (TIN) model is a significant alternative to the regular
raster surface of a DEM, and has been adopted in numerous GISs and automated
mapping and contouring packages. The TIN model was developed in the early 1970's as
a simple way to build a surface from a set of irregularly spaced points. The commercial
systems using TIN began to appear in the 1980's as contouring packages, some
embedded in GIS. The TIN model is attractive because of its simplicity and economy. In
addition, certain types of terrain are very effectively divided into triangles with plane
facets and this is particularly true with sloppy landscapes. It works best in areas with
sharp breaks in slope, where TIN edges can be aligned with breaks, e.g. along ridges or
channels. As compared to the DEM, it is simple to find slope and aspect at some
location using a TIN - the slope and aspect attributes of the containing triangle can be
easily observed.
In a TIN model irregularly spaced sample points can be adapted to the terrain, with more
points in areas of rough terrain and fewer in smooth terrain. An irregularly spaced
sample is therefore more efficient at representing a surface in a TIN model, the sample
points are connected by lines to form triangles within each triangle the surface is usually
represented by a plane by using triangles it is ensured that each piece of the mosaic
surface will fit with its neighboring pieces - the surface will be continuous - as each
triangle's surface would be defined by the elevations of the three corner points. It might
make sense to use more complex polygons as mosaic tiles in some cases, but they can
always be broken down into triangles for example, if a plateau is eroded by gullies, the
remaining plateau would be a flat (planar) area bound by an irregular, many-sided
polygon. In the TIN model it would be represented by a number of triangles, each at the
same elevation. For vector GISs, TINs can be seen as polygons having attributes of
slope, aspect and area, with three vertices having elevation attributes and three edges
with slope and direction attribute. The TINs were created using both DEM and Contours
as described here.

28
3.3.2 Creating TINS with DEM
Sample points were picked up from the DEM (normally, a TIN of 100 points will do as
well as a DEM of several hundred at representing a surface). Triangles were built
between all selected points. Then these points were connected into triangles and
surface was modeled within each triangle. Each contour surface is straight and
parellered within each triangle, but sharply kinked at triangle edges. Consequently, some
implementations of TIN represent the surface in each triangle using a mathematical
function chosen to ensure that slope changes continuously, not abruptly, at the edges of
the triangle (Fig. 11).
Fig. 11. Triangular TIN surface
3.3.3 Creating TINS with Contours
Contours are a common source of digital elevation data rather than convert from
contours to a grid (DEM) and then to a TIN, it is more direct to obtain the TIN from

29
contours directly. A TIN was created by selecting points from the digitized contour lines.
Each selection created a triangle with three vertices on the same contour (at the same
elevation) (Fig. 12).
Fig. 12 TIN model with contours displayed.
TIN creation errors were analyzed generating a descriptive listing about the TIN surface
followed by its graphic display. Invalid flat triangles occurring along streams and ridges
were eliminated adding new intermediate points along the ridges and streams between
the input contours. Additional sample points were entered between the contours in order
to increase the distance between vertices on each contour arc, resulting in removal of
invalid flat triangles. Weed tolerance and proximal tolerance were also adjusted to
remove excess vertices forming flat triangles. The created TIN surface was transformed
back to contour arc coverage
3.3.4 Finishing the TIN
The result of this process is a connected set of peaks, pits, passes, ridge lines and
channel lines. The number of points in each ridge and channel line can be reduced by
thinning using a standard thinning algorithm and it may be desirable to add additional
points from the DEM which are not on ridges or channels if we can significantly reduce
any substantial differences from the real surface. The resulting surface differed from the
original DEM, substantially in some areas with more dimensionality. The TINS were
stored in the form of triangles with a reference number for the triangle, the x,y,z-
coordinates of the three vertices and the reference numbers of the three neighboring
30
triangles.
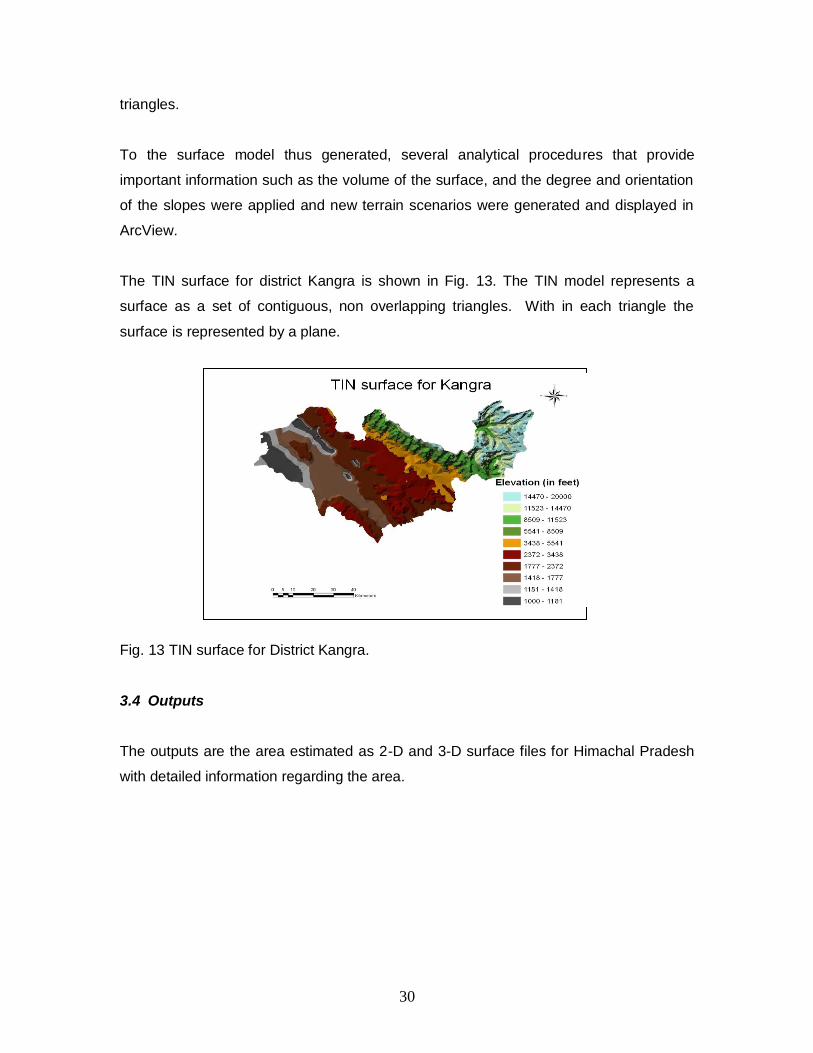
To the surface model thus generated, several analytical procedures that provide
important information such as the volume of the surface, and the degree and orientation
of the slopes were applied and new terrain scenarios were generated and displayed in
ArcView.
The TIN surface for district Kangra is shown in Fig. 13. The TIN model represents a
surface as a set of contiguous, non overlapping triangles. With in each triangle the
surface is represented by a plane.
Fig. 13 TIN surface for District Kangra.
3.4 Outputs
The outputs are the area estimated as 2-D and 3-D surface files for Himachal Pradesh
with detailed information regarding the area.
31
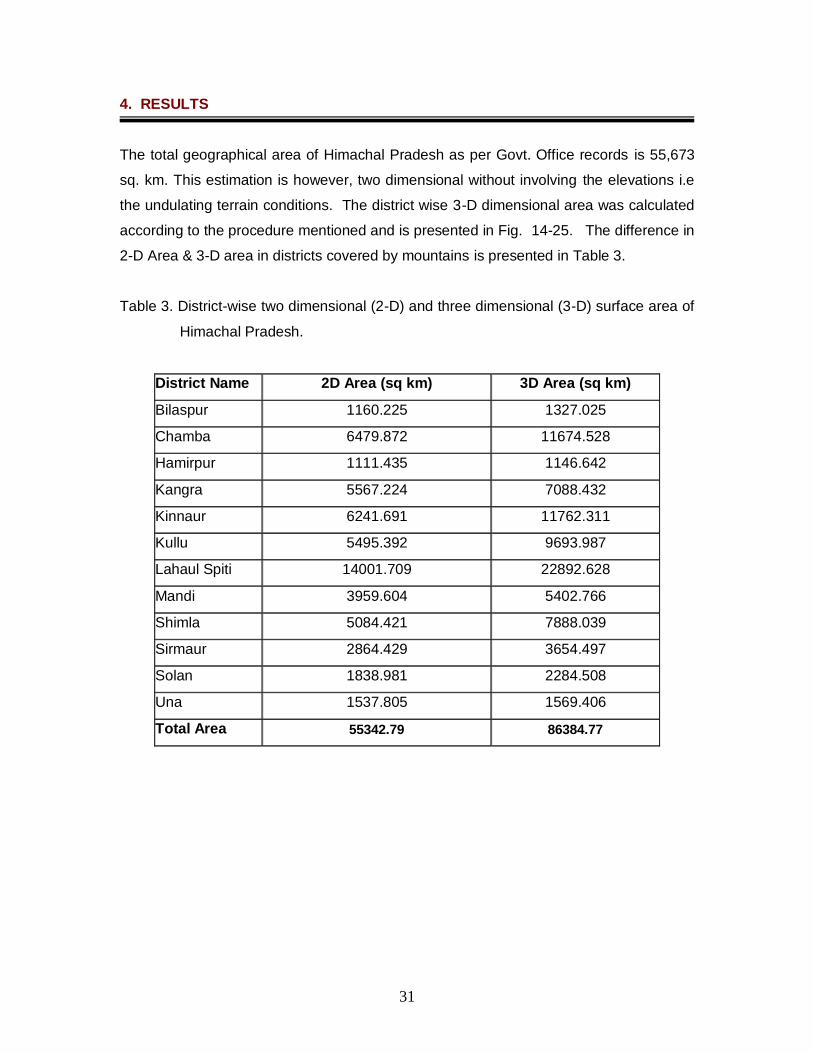
4. RESULTS
The total geographical area of Himachal Pradesh as per Govt. Office records is 55,673
sq. km. This estimation is however, two dimensional without involving the elevations i.e
the undulating terrain conditions. The district wise 3-D dimensional area was calculated
according to the procedure mentioned and is presented in Fig. 14-25. The difference in
2-D Area & 3-D area in districts covered by mountains is presented in Table 3.
Table 3. District-wise two dimensional (2-D) and three dimensional (3-D) surface area of
Himachal Pradesh.
District Name 2D Area (sq km) 3D Area (sq km)
Bilaspur 1160.225 1327.025
Chamba 6479.872 11674.528
Hamirpur 1111.435 1146.642
Kangra 5567.224 7088.432
Kinnaur 6241.691 11762.311
Kullu 5495.392 9693.987
Lahaul Spiti 14001.709 22892.628
Mandi 3959.604 5402.766
Shimla 5084.421 7888.039
Sirmaur 2864.429 3654.497
Solan 1838.981 2284.508
Una 1537.805 1569.406
Total Area 55342.79 86384.77

32
Sample Contour Maps Tin Surface
3-D Surface View Fig. 14 Three dimensional (3-D) surface area of district Bilaspur.

33
Sample Contour Maps Tin Surface
3-D Surface View
Fig. 15 Three dimensional (3-D) surface area of district Chamba.

34
Sample Contour Maps Tin Surface
3-D Surface View
Fig. 16 Three dimensional (3-D) surface area of district Hamirpur.

35
Sample Contour Maps Tin Surface
3-D Surface View

36
Fig. 17 Three dimensional (3-D) surface area of district Kangra.
Sample Contour Maps Tin Surface
3-D Surface View Fig. 18 Three dimensional (3-D) surface area of district Kinnaur.

37
Sample Contour Maps Tin Surface
3-D Surface View Fig. 19 Three dimensional (3-D) surface area of district Kullu.

38
Sample Contour Maps Tin Surface
3-D Surface View
Fig. 20 Three dimensional (3-D) surface area of district Lahaul-Spiti.

39
Sample Contour Maps Tin Surface
3-D Surface View
Fig. 21 Three dimensional (3-D) surface area of district Mandi.

40
Sample Contour Maps Tin Surface
3-D Surface View
Fig. 22 Three dimensional (3-D) surface area of district Shimla.

41
Sample Contour Maps Tin Surface
3-D Surface View
Fig. 23 Three dimensional (3-D) surface area of district Sirmaur.

42
Sample Contour Maps Tin Surface
3-D Surface View
Fig. 24 Three dimensional (3-D) surface area of district Solan.

43
Sample contour maps Tin Surface
3-D Surface View
Fig. 25 Three dimensional (3-D) surface area of district Una.

44
District Bilaspur
The Bilaspur district is situated in Satluj valley in the outer hills of Himachal Pradesh. A
3-D surface view of the area of district Bilaspur is presented in Fig. 14. The two
dimensional surface area of district Bilaspur is 1160.225 sq. km and calculated 3-D area
comes out to be 1327.025 sq km (Table 3). Therefore, an additional area of 166.8 sq.
km has been reported to be present in the district.
District Chamba
Chamba is the northwestern district of Himachal Pradesh. Chamba is one of the oldest
Native States in India. The two dimensional surface area of district Chamba is 6479.872
sq. km and calculated 3-D area is 11674.528 sq. km (Table 3). A supplementary area
of as high as 5194.656 sq. km has been observed to be occurring in the district. 3-D
surface view of the area of district Chamba is presented in Fig. 15.
District Hamirpur
It is situated at an altitude of 785 meters. District Hamirpur as visualized in a 3
dimensional mode is shown in Fig. 16. The 3-D area is just 35.207 sq. km more than 2-
D area of the district (Table 3), which are 1146.642 and 1111.435 sq.km respectively.
District Kangra
The district is in the western part of Himachal Pradesh, in the low foothills of the
Himalayas. The Dhauladhar range adjoins the district on one side. The Beas is one of
the larger rivers of this district, and contributes to the fertility of the land here. District
Kangra has geographical area (2-D) of 5567.224 sq. km which constitutes 10.31 per
cent of the total area of the state. The estimated 3-dimentional area of the district is
7088.432 sq. km which is 1521.208 sq. km more than the 2-D area (Table 3, Fig. 17).

45
District Kinnaur
District Kinnaur lies in the extreme west part of the state enclosing high hills. The two
dimensional area of the state is 6241.691 sq. km and three dimensional area is
11762.311 sq. km (Table 3). District Kinnaur has 5520.62 sq. km more area than the
actually reported. The contour lines, TIN surface and 3-D view of the district is
presented in Fig. 18.
District Kullu
A 3-D surface view of the area of district Kullu is presented in Fig. 19. The two
dimensional surface area of district is 5495.392 sq. km and calculated 3-D area comes
out to be 9693.987 sq km (Table 3). An additional area of 4198.595 sq. km has been
reported to be present in the district.
District Lahaul Spiti
It is the largest district in terms of area in the state with minimum population density 2/sq.
km. The 3-D surface area view of the state is shown in Fig. 20. The geographic area of
the district is 14001.709 sq. km and calculated three dimensional area is 22892.628 sq.
km. The district possesses about 8890.919 sq. km additional area.
District Mandi
District Mandi is situated between 31° 13’’ to 32° 04’ N and 76°37’ to 77°23’ E in the
centre of Himachal Pradesh having total area 3959.604 sq. km. The three dimensional
area of the district is 5402.766 sq.km (Table 3, Fig. 21). Hence an additional area of
1443.162 sq. km has been reported as veiled in the district.
District Shimla
A 3-D surface view, TIN surface and contours for district Shimla is presented in Fig. 22.
The two dimensional surface area of district is 5084.421 sq. km and calculated 3-D area

46
is 7888.039 sq km (Table 3). An additional area of 2803.618 sq. km . has been
reported to be present in the district.
District Sirmaur
The district occupies relatively plain areas in the southernmost part of the state. A 3-D
surface view, TIN surface and contours for district Sirmaur is presented in Fig. 23. The
calculated 3-D area of the district is 3654.497 sq. km that is about 790.068 sq. km more
than the reported 2-D area of 2864.429 sq. km.
District Solan
A 3-D surface view of the area of district Solan is presented in Fig. 24. The two
dimensional surface area of district is 1838.981 sq. km and calculated 3-D area comes
out to be 2284.508 sq km (Table 3). An additional area of 445.527 sq. km has been
reported to be present in the district.
District Una
Una is a district of Himachal Pradesh which lies in its south western part. District Una is
smallest district comprising of mainly the flat lands and geographical area of 1537.805
sq. km with not much difference of 31.601 sq. km than its three dimensional area which
is 1569.406 sq. km (Table 3, Fig. 25).

47
Table 4. Percent increase in calculated district-wise 3- D area.
District Name Percent increase in area
Bilaspur 14.38
Chamba 80.17
Hamirpur 3.17
Kangra 27.32
Kinnaur 88.45
Kullu 76.40
Lahaul Spiti 63.50
Mandi 36.45
Shimla 55.14
Sirmaur 27.58
Solan 24.23
Una 2.05
Himachal Pradesh 56.09
Table 4 represents the percent increase in calculated three dimensional areas for all the
twelve districts of Himachal Pradesh. The increase was observed to be more in the
districts which lie at the height of more than 1500 m with maximum increase of more
than 88 per cent in the district with high hills e.g. district Kinnaur, Lahaul Spiti, Shimla,
Chamba, Kullu and Kangra. In the districts with relatively flat lands e.g. Una, Hamirpur
and Bilaspur the additional areas are comparatively less.
The surface area estimations carried out using vector data sets and polygons in the
present study is inherently more accurate and precise than with raster data sets such as
DEMs and surface-area grids. As the most accurate measure of the surface area within
a polygon should include all the area within the polygon, raster data sets do not meet
this criterion because cells in a raster data set do not sit perfectly within polygon
boundaries. Further, the raster representations of polygons have a stair-stepped
appearance incorporating some areas outside the polygon and missing some areas
inside. Whereas the vector objects are not affected by the edge-effect problems that are

48
unavoidable with raster-based methods and are considerably more reliable and accurate
over areas with relatively low cell counts.
Present-day development efforts are a recent phenomenon in the hills. Generally these
efforts are inspired and conceived outside and implemented in the hills. Often they
involve pace, scale, priorities, and operating mechanisms not well known to the hilly
areas and people. Most importantly, the development interventions are based on
approaches and models which were not basically conceived or designed for hilly areas.
Owing to this reason they proved less effective in handling the problems of hilly areas.
Indicators of this ineffectiveness could be, poor economic performance, over-exploitation
of hill resources, disregard of equity issues, and environmental distabilisation (Sanwal,
1989). Discontinuities, between conventional development approaches and hill
conditions can be demonstrated at different levels of the developmental process
(Sanwal, 1989).
A whole of 55.673 sq km area of Himachal Pradesh is divided into classes viz., forests,
agriculture, grass/shrub, nonvegetation/rocks, glaciers and water bodies (Table 5, Fig.
26). According to recent remote sensing land cover estimates for the state indicate that
14 per cent of the total geographical area is cultivated land and the non-cultivated lands
under different land covers viz., grass/shrubs (17%), non-vegetation (26%), forests
(32%) and glaciers/snow and water bodies which collectively constitute the remaining 12
per cent (Bhagat et al. 2006).
Table 5. Spatial Distribution of Land Cover Classes of Himachal Pradesh
Class Area_SqKm Percent
Forest 17768.68 32
Agriculture 7828.28 14
Grass/Shrub 9293.94 17
Rocks/Non-vegetation 14364.99 26
Snow/Clouds 3807.15 7
Glaciers 1985.60 4
Water body 481.59 1
Total 55530.23 100.00

49
Fig. 26 General land cover of Himachal Pradesh.
These are the classes derived from 2001-2002 IRS 1D LISS3 data that indicate 32 per
cent area of the state is forests. However, the recorded forest cover is 35, 409 km2
which is 63.60 per cent of the geographical area (Anon, 1997). The glaciated area in
Himachal Pradesh is estimated to be about 4160.58 sq. km (Bhagat et al, 2004),
however, land cover estimates show it to be 1985.60 sq. km. Similarly there are
discrepancies between actual and documented data from revenue records in other
classes too. The fact that there is no substantial new found land, these additional areas
must be already in use, although misreported. There could be a possibility of adding
more land to crop land or any other economically sound ecosystem.
The role of land resources is most crucial, in both situations in upgrading the productivity
of all types of biomass systems. The present study clearly indicated that there are
additional areas observed in each district of the state and there is a need to know the
exact land cover class where these areas are currently locked up or can be further
added. This can be achieved however, by integrating the land cover map for the state
over the three dimensional surface area of Himachal Pradesh which is an intricated job
and requires lots of resources further. Once these areas are identified, an updated
landuse data base will thus be available with exact figures for lands under agriculture,

50
forests, cultivated and non cultivated class, a scientifically back-up land use plan thus
can be formulated.
With this, the scope for diversified activities, the presence of high potential areas and
activities also increases and their required resource management practices, could help
in designing appropriate strategies for sustainable development of hill areas. These
changes may include patterns of resource use as well as types of production,
consumption, and exchange activities, directly or indirectly conditioned by the above
objective circumstances in hilly areas.
Hilly areas demand due considerations to complexity of varying degrees of the hill
characteristics, their multiple dimensionality and their interrelatonships, would give a
contextual perspective to decisions and actions in hilly areas. A sensitivity to such a hill
perspective would determine the relevance and effectiveness of any development
activity in hilly areas. Hence, the conventional plain area development approach is not
applicable. The results obtained from the present study can be further projected under
hill perspective framework which is different from flat lands and can be harnessed for
demanding additional funding area wise from the centre for its sustainable development.

51
5. CONCLUSION
The study identifies that the actual surface area of entire Himachal Pradesh, calculated
using modern Geo-IT tools, remote sensing and Geographical Information System (GIS)
turns out to be 86384.77 sq. km which is about 56 per cent more than the documented
geographical area 55342.79 sq. km. This is because of the mountainous regions and
extensive slopping valleys in Himachal Pradesh. Agriculture, infrastructure like
industries, housing roads etc. are planned on these slopping lands and sometimes even
on steep slopes in various mountain districts for which actual surface land area should
be considered. Whereas generally the planning is done for the geographical area and
as a result of it surface area on slopes are not considered for any developmental plan.
The additional area so calculated might be included in different land cover classes that
might result into opening new potential niches and production domains for mountainous
crops, forests or pastures. Further, this may have a relevance of advancing
development in Himachal Pradesh through augmented natural resources per unit area,
demanding more finances from the Centre for general planning.
Appropriate analysis of the satellite imagery, digital elevation model, slopes and aspect
of the surface area is required to be carried out for the identification of these locked
additional areas. The land cover map derived from the satellite image can further
provide information where exactly the additional surface area is present, which however,
requires a further detailed study.

52
6. REFERENCES
Anonymous (1981) FAO, UNEP-Tropical Forest Resources Assessment Project,
Forest Resources of Tropical Asia. FAO, UNEP, 475 pp.
Bhagat, R.M., Vaibhav Kalia, Chitra Sood, Pradeep Mool and S.R Bajracharya,
2004. Himachal Pradesh Himalaya – Inventory of glaciers and glacial lake
outburst floods (GLOFs) affected by global warming in the mountains of
Himalayan region. Technical report submitted to APN-START/UNEP, Japan.
Bhagat, R. M., Singh, S., Kumar, V., Kalia, V., Sood, C., Pradhan, S., Immerzeel,
W., Shrestha, B. (2006): “Developing Himachal Pradesh Agricultural Systems
Information Files (HASIF) and Tools for Decision Support Systems for Niche
Based Hill Farming”, Project Report submitted to Department of Agriculture,
Govt. of Himachal Pradesh, India.
Burrough P.A. & McDonnell, R.A., 1998. Principles of geographical information
systems: Spatial Information Systems and Geostatistics. OUP. Elghazali, M. S.
& Hassan, M. M., 1986. A simplified terrain relief classification from DEM data
using finite differences, Geo-Processing, v3 n2, 167-178.
Foote, K. E. and Lynch,M. (1996). Geographic information systems as an
integrating technology: context, concepts and definition. Austin, University of
Texas.
Ghosh, S (2001) GIS application for mountain terrains: some considerations and
options. http://www.gisdevelopment.net/application/nrm/mountain/mount.pf.htm"
Heywood, D.I. "Mountain regions and geographic information systems: an
overview." Mountain Environments and Geographic Information Systems. Eds.
Martin F. Price and D. Ian Heywood. Bristol: Taylor & Francis, Inc., 1994. 1-24.
Kundu, S.N. and Pradhan, B. (2002) Surface area processing in GIS.
http://www.gisdevelopment.net/technology/gis/ma03191abs.htm
Marble, D. H., Calkins H. W. and Pequet D. J. (1984). Basic Readings in
Geographic Information Systems. Williamsville, NY., SPAD System Limited.
Sanwal, N. 1989. What We Know About Mountain Development: Common
Property, Investment Priorities, and Institutional Arrangements”. In Mountain
Research and Development, 9 (1). Boulder, Colorado.

53
Stocks, A.M., and D.I. Heywood. "Terrain modelling for mountains." Mountain
Environments and Geographic Information Systems. Eds. Martin F. Price and D.
Ian Heywood. Bristol: Taylor & Francis, Inc., 1994. 25-40.
Strahler, A. N., 1952. Hypsometric (area-altitude) analysis of erosional
topography, Geological Society American Bulletin, 63: 1117-1142.


