
RapidRide B Line One Year Post-Implementation
Survey Results
Prepared for King County Metro by Gilmore Research Group
King County Metro 201 S. Jackson St Seattle, WA 98104
Phone: 206-553-3000
December 2012
Metro RapidRide B Line One Year Post-Implementation Survey Results, December 2012 2
TABLE OF CONTENTS
EXECUTIVE SUMMARY ..................................................... 4
Background and Objectives................................................................................ 4
Method ................................................................................................................ 5
KEY FINDINGS..................................................................... 8
CONCLUSIONS....................................................................11
DETAILED FINDINGS...................................................... 12
Overall Satisfaction with Service........................................................................12
Satisfaction with Trip Time ...............................................................................13
Satisfaction with Personal Safety .......................................................................15
Satisfaction with the Waiting Area Where Boarded...........................................19
Physical Characteristics of the Buses ............................................................... 24
Satisfaction with Transfers................................................................................ 29
Satisfaction with Frequency and Reliability of Buses....................................... 33
NUMBER OF RIDES, PURPOSE AND TIMES OF USUAL TRIPS, TRANSFERS AND BUSES TAKEN PRIOR TO THE IMPLEMENTATION OF THE RAPIDRIDE B LINE........................................................... 37
Transit Trips Taken .......................................................................................... 37
Reason for Riding ............................................................................................. 38
Days and Times of Riding ................................................................................ 38
Transfers ........................................................................................................... 39
Metro RapidRide B Line One Year Post-Implementation Survey Results, December 2012 3
Use of Free Wi-Fi .............................................................................................. 40
Fares .................................................................................................................. 40
Transportation if RapidRide B Line Is Not Used ............................................ 42
Recommendations for RapidRide B Line Improvements ................................ 43
Respondent Profiles .......................................................................................... 44
APPENDIX........................................................................... 45
Metro RapidRide B Line One Year Post-Implementation Survey Results, December 2012 4
EXECUTIVE SUMMARY
Background and Objectives
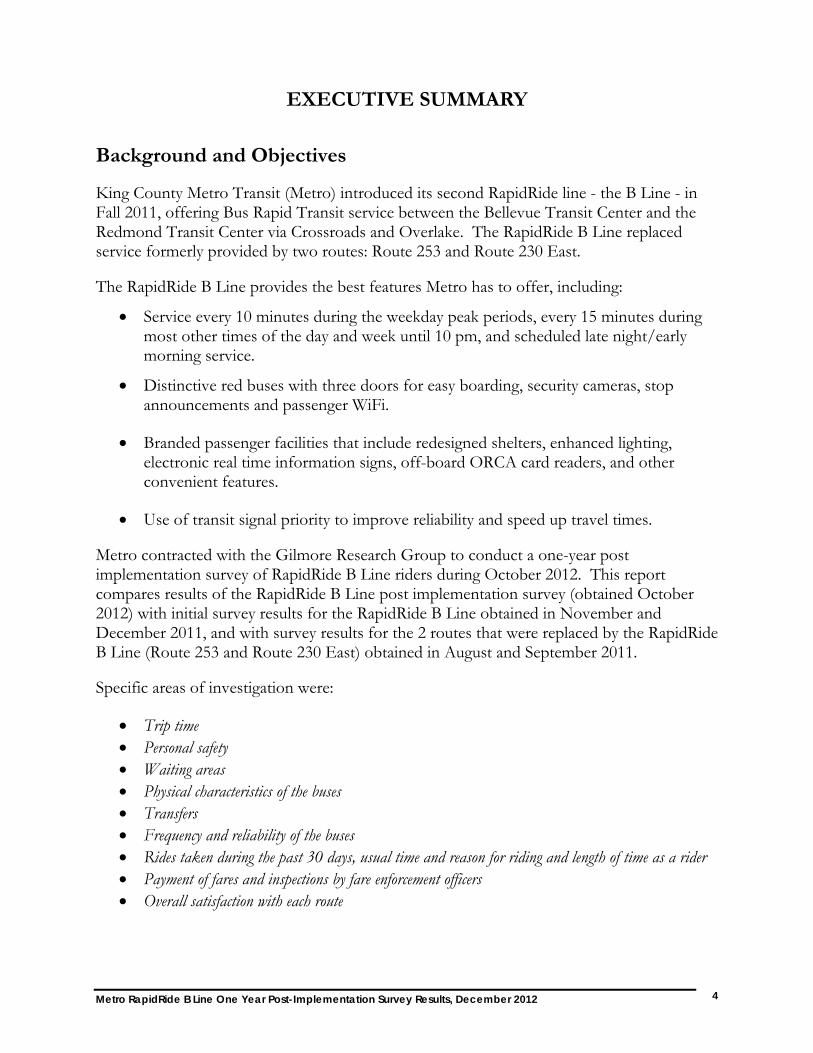
King County Metro Transit (Metro) introduced its second RapidRide line - the B Line - in Fall 2011, offering Bus Rapid Transit service between the Bellevue Transit Center and the Redmond Transit Center via Crossroads and Overlake. The RapidRide B Line replaced service formerly provided by two routes: Route 253 and Route 230 East.
The RapidRide B Line provides the best features Metro has to offer, including:
Service every 10 minutes during the weekday peak periods, every 15 minutes during most other times of the day and week until 10 pm, and scheduled late night/early morning service.
Distinctive red buses with three doors for easy boarding, security cameras, stop announcements and passenger WiFi.
Branded passenger facilities that include redesigned shelters, enhanced lighting, electronic real time information signs, off-board ORCA card readers, and other convenient features.
Use of transit signal priority to improve reliability and speed up travel times.
Metro contracted with the Gilmore Research Group to conduct a one-year post implementation survey of RapidRide B Line riders during October 2012. This report compares results of the RapidRide B Line post implementation survey (obtained October 2012) with initial survey results for the RapidRide B Line obtained in November and December 2011, and with survey results for the 2 routes that were replaced by the RapidRide B Line (Route 253 and Route 230 East) obtained in August and September 2011.
Specific areas of investigation were:
Trip time Personal safety Waiting areas Physical characteristics of the buses Transfers Frequency and reliability of the buses Rides taken during the past 30 days, usual time and reason for riding and length of time as a rider Payment of fares and inspections by fare enforcement officers Overall satisfaction with each route

Metro RapidRide B Line One Year Post-Implementation Survey Results, December 2012 5
Key findings from the October 2012 survey are provided in this Executive Summary. They are presented as a comparison with 2011 survey results for the RapidRide B Line and for the routes it replaced.
Method
The survey of all riders onboard selected trips took place on October 24th and 25th 2012, between the hours of 6:00 am and 7:30 pm. During these hours riders were invited to complete a questionnaire regarding their satisfaction with various service quality elements. Riders were also offered the option of completing the survey by mail and online.1 Trips to be surveyed were selected to provide a variety of peak and non-peak riders.
A total of 20 surveys were completed in one of the four languages offered in addition to English: Sixteen (16) respondents completed surveys in Spanish, 3 in Russian and 1 in Chinese. A Korean language survey was also available.
Reporting Conventions This report compares results of rider satisfaction ratings obtained at three points of time: during August/September 2011 (for Routes 230 East and 253), during November/December 2011 (for newly implemented RapidRide B Line) and in October 2012 (for the one-year post-implementation survey of RapidRide B Line riders).
Statistical tests were used to compare differences in mean scores as well as differences in the percentage of respondents who were “satisfied” (combined ratings of 4 and 5) or “dissatisfied” (combined ratings of 1 and 2). Response proportions presented in text and displayed in graphs and in tables exclude the number of respondents who did not answer the questions and also, the number of respondents who indicated not applicable.
Text summaries of respondent ratings are presented as the combined proportions of satisfied/very satisfied ratings. Combined proportions that are reported in Detailed Findings of the text reflect the proportions that are shown in the graphs. These numbers may vary slightly (no more than 1 percentage point) from numbers obtained from data tables due to rounding. A complete set of data tables is available under separate cover.
Response Rates Table 1 summarizes survey response for the RapidRide B Line in the current survey and for the RapidRide B Line and Routes 230 East and 253 in 2011.
1 Gilmore Research created a postcard for each route. Each postcard featured a unique PIN number to access the online survey. Each route had a set of PIN numbers assigned to it so that the online survey would recognize the route number, allowing the correct wording recall for each route. The postcard included the phone number for Gilmore Research for anyone who might have difficulty accessing the survey.
Metro RapidRide B Line One Year Post-Implementation Survey Results, December 2012 6
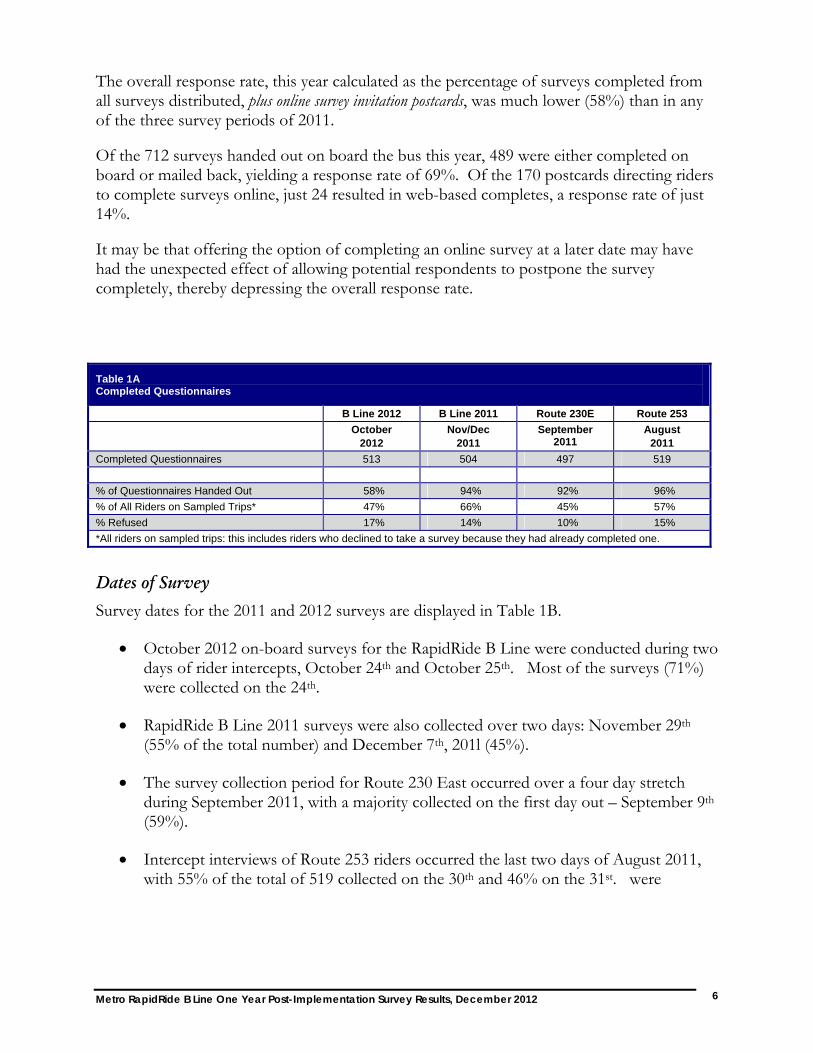
The overall response rate, this year calculated as the percentage of surveys completed from all surveys distributed, plus online survey invitation postcards, was much lower (58%) than in any of the three survey periods of 2011.
Of the 712 surveys handed out on board the bus this year, 489 were either completed on board or mailed back, yielding a response rate of 69%. Of the 170 postcards directing riders to complete surveys online, just 24 resulted in web-based completes, a response rate of just 14%.
It may be that offering the option of completing an online survey at a later date may have had the unexpected effect of allowing potential respondents to postpone the survey completely, thereby depressing the overall response rate.
Dates of Survey
Survey dates for the 2011 and 2012 surveys are displayed in Table 1B.
October 2012 on-board surveys for the RapidRide B Line were conducted during two days of rider intercepts, October 24th and October 25th. Most of the surveys (71%) were collected on the 24th.
RapidRide B Line 2011 surveys were also collected over two days: November 29th (55% of the total number) and December 7th, 201l (45%).
The survey collection period for Route 230 East occurred over a four day stretch during September 2011, with a majority collected on the first day out – September 9th (59%).
Intercept interviews of Route 253 riders occurred the last two days of August 2011, with 55% of the total of 519 collected on the 30th and 46% on the 31st. were
Table 1A Completed Questionnaires
B Line 2012 B Line 2011 Route 230E Route 253
October 2012
Nov/Dec 2011
September 2011
August 2011
Completed Questionnaires 513 504 497 519
% of Questionnaires Handed Out 58% 94% 92% 96%
% of All Riders on Sampled Trips* 47% 66% 45% 57%
% Refused 17% 14% 10% 15%
*All riders on sampled trips: this includes riders who declined to take a survey because they had already completed one.

Metro RapidRide B Line One Year Post-Implementation Survey Results, December 2012 7
Table 1B Survey Dates
B Line 2012 B Line 2011 Route 230 East Route 253
# of Surveys
% of Total
# of Surveys
% of Total
# of Surveys
% of Total
# of Surveys
% of Total
August 30, 2011 288 55% August 31, 2011 231 46%
September 8, 2011 250 59% September 13, 2011 95 19% September 20, 2011 80 16%
September 26, 2011 72 15%
November 29, 2011 275 55% December 7, 2011 229 45% October 24, 2012 362 71% October 25, 2012 151 29%
Total 513 100% 504 100% 497 100% 519 100%
Metro RapidRide B Line One Year Post-Implementation Survey Results, December 2012 8
KEY FINDINGS
Rider satisfaction ratings obtained in the current survey are very similar to ratings obtained just after the implementation of RapidRide B Line service. Nearly all remain well above ratings given for discontinued Routes 230 East and 253, and many remain significantly higher. One new aspect of service rated by riders in the current survey gathered large majorities of respondents who indicated they are satisfied: room to stand if no seats are available (91% satisfied/very satisfied).
The following information summarizes the significant differences between ratings given this year, ratings obtained just after implementation and ratings given for routes that were replaced by RapidRide B Line service. 2
RapidRide B Line Ratings This Year Compared to Last Year:
Four aspects of service gathered significantly larger proportions of satisfied/very satisfied ratings this year than last year:
Overall satisfaction with the route (93% in 2012 v. 86% in 2011) Behavior of other passengers on the bus (91% v. 85%) Convenience of the bus stop (82% v. 69%) Being able to sit down while waiting (64% v. 57%)
RapidRide B Line riders gave helpfulness of drivers in making connections significantly fewer satisfied/very satisfied ratings this year than last year (75% v. 82%). RapidRideB Line Ratings This Year Compared to Route 230 East: A comparison of service ratings this year with service ratings for Route 230 East prior to implementation found significantly higher proportions of satisfied/very satisfied ratings this year for 20 out of 33 service elements evaluated in both surveys. There were no significant decreases in satisfaction ratings in the current survey. Satisfaction ratings for the following aspects of service were significantly higher for RapidRide B Line this year than for Route 230 East:
Wide enough doors and aisles for loading and unloading (96% in 2012 v. 85% in 2011) Personal safety on the bus (96% v. 92%) Enough bars and straps to hang onto while standing (95% v. 84%) Having the bus free of graffiti (94% v. 84%) Cleanliness of the bus interior (94% v. 85%)
2 Please see the Appendix for a complete listing of all combined satisfaction ratings by route.

Metro RapidRide B Line One Year Post-Implementation Survey Results, December 2012 9
Being able to get a seat (93% v. 85%) Overall satisfaction with the route (93% v. 86%) Behavior of other passengers on the bus (91% v. 79%) Smoothness of the ride (87% v. 77%) How often the bus runs during peak hours (85% v. 67%) How early the bus runs during the morning (84% v. 70%) Behavior of other people at the waiting area (83% v. 77%) The bus getting me where I’m going on time (82% v. 74%) Cleanliness of the waiting area (82% v. 74%)
How long the bus trip takes (82% v. 76%) How often the bus runs during midday hours (80% v. 69%) Amount of lighting in the waiting area (77% v. 68%) How often the bus runs on weekends (72% v. 48%) Transfers: How often the bus runs in the evening/at night (72% v. 56%)
How often the bus runs in the evening/at night (69% v. 52%) RapidRide B Line Ratings This Year Compared to Route 253: Of the 33 service elements evaluated in both surveys 25 had significantly more satisfied/very satisfied ratings this year than Route 253. None of service ratings had significantly fewer satisfied/very satisfied ratings this year than Route 253. Satisfaction ratings for the following aspects of service were significantly higher for RapidRide B Line this year than for Route 253:
Wide enough doors and aisles for loading and unloading (96% in 2012 v. 88% in 2011) Personal safety on the bus (96% v. 90%) Enough bars and straps to hang onto while standing (95% v. 88%) Having the bus free of graffiti (94% v. 85%) Cleanliness of the bus interior (94% v. 88%) Being able to get a seat (93% v. 82%) Overall satisfaction with the route (93% v. 82%) Behavior of other passengers on the bus (91% v. 79%) Personal safety waiting for the bus during the daytime (91% v. 87%) Smoothness of the ride (87% v. 77%) How often the bus runs during peak hours (85% v. 65%) How early the bus runs during the morning (84% v. 69%) Behavior of other people at the waiting area (83% v. 76%) The bus getting me where I’m going on time (82% v. 75%)

Metro RapidRide B Line One Year Post-Implementation Survey Results, December 2012 10
Cleanliness of the waiting area (82% v. 75%)
How long the bus trip takes (82% v. 75%) How often the bus runs during midday hours (80% v. 68%) Personal safety waiting for the bus at night (77% v. 66%) Amount of lighting in the waiting area (77% v. 68%) The number of stops the bus makes (75% v. 67%) How often the bus runs on weekends (72% v. 44%) Transfers: How often the bus runs in the evening/at night (72% v. 58%)
The bus coming on time when transferring (71% v. 62%)
The way buses are scheduled to make transfer connections (71% v. 63%) How often the bus runs in the evening/at night (69% v. 50%)
Metro RapidRide B Line One Year Post-Implementation Survey Results, December 2012 11
CONCLUSIONS Results of this survey find continued high levels of satisfaction with nearly all aspects of service provided by the RapidRide B Line. Overall satisfaction with the route tracked significantly above the measure taken just after implementation, thus indicating increased rider approval of the switch to Bus Rapid Transit service. Several aspects of waiting areas are perceived to be better than before. Satisfaction ratings for convenience of the stop and being able to sit down while waiting increased significantly over ratings that fell one year ago when the RapidRide B Line began service. And rider satisfaction with cleanliness of the RapidRide B Line waiting areas and amount of lighting remains well above satisfaction with these elements of waiting areas offered by the discontinued routes. A one year look back shows sustained high levels of satisfaction with physical characteristics of the RapidRide buses, including the easy loading and unloading, the adequacy of sitting and standing space, smoothness of the ride, the cleanliness of the bus interiors and the lack of graffiti. Although satisfaction with service frequency has leveled off compared to one year before, all aspects of service frequency gathered significantly higher ratings in the current survey than they did in the surveys of discontinued Routes 230 East and 253. This demonstrates an overall preference among riders for the frequency of service that is provided by the RapidRide B Line.
Metro RapidRide B Line One Year Post-Implementation Survey Results, December 2012 12
DETAILED FINDINGS
Overall Satisfaction with Service
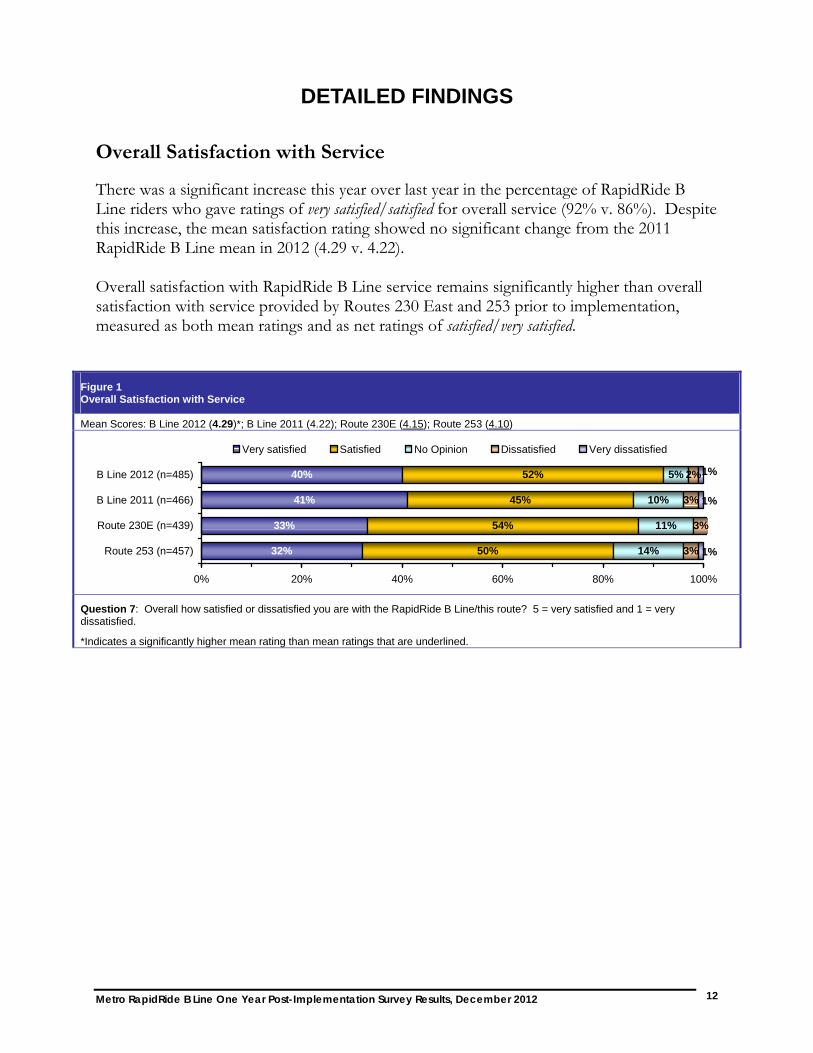
There was a significant increase this year over last year in the percentage of RapidRide B Line riders who gave ratings of very satisfied/satisfied for overall service (92% v. 86%). Despite this increase, the mean satisfaction rating showed no significant change from the 2011 RapidRide B Line mean in 2012 (4.29 v. 4.22). Overall satisfaction with RapidRide B Line service remains significantly higher than overall satisfaction with service provided by Routes 230 East and 253 prior to implementation, measured as both mean ratings and as net ratings of satisfied/very satisfied.
Figure 1 Overall Satisfaction with Service
Mean Scores: B Line 2012 (4.29)*; B Line 2011 (4.22); Route 230E (4.15); Route 253 (4.10)
40%
41%
33%
32%
52%
45%
54%
50%
5%
10%
11%
14%
2%
3%
3%
3%
1%
1%
1%
0% 20% 40% 60% 80% 100%
B Line 2012 (n=485)
B Line 2011 (n=466)
Route 230E (n=439)
Route 253 (n=457)
Very satisfied Satisfied No Opinion Dissatisfied Very dissatisfied
Question 7: Overall how satisfied or dissatisfied you are with the RapidRide B Line/this route? 5 = very satisfied and 1 = very dissatisfied.
*Indicates a significantly higher mean rating than mean ratings that are underlined.
Metro RapidRide B Line One Year Post-Implementation Survey Results, December 2012 13
Satisfaction with Trip Time
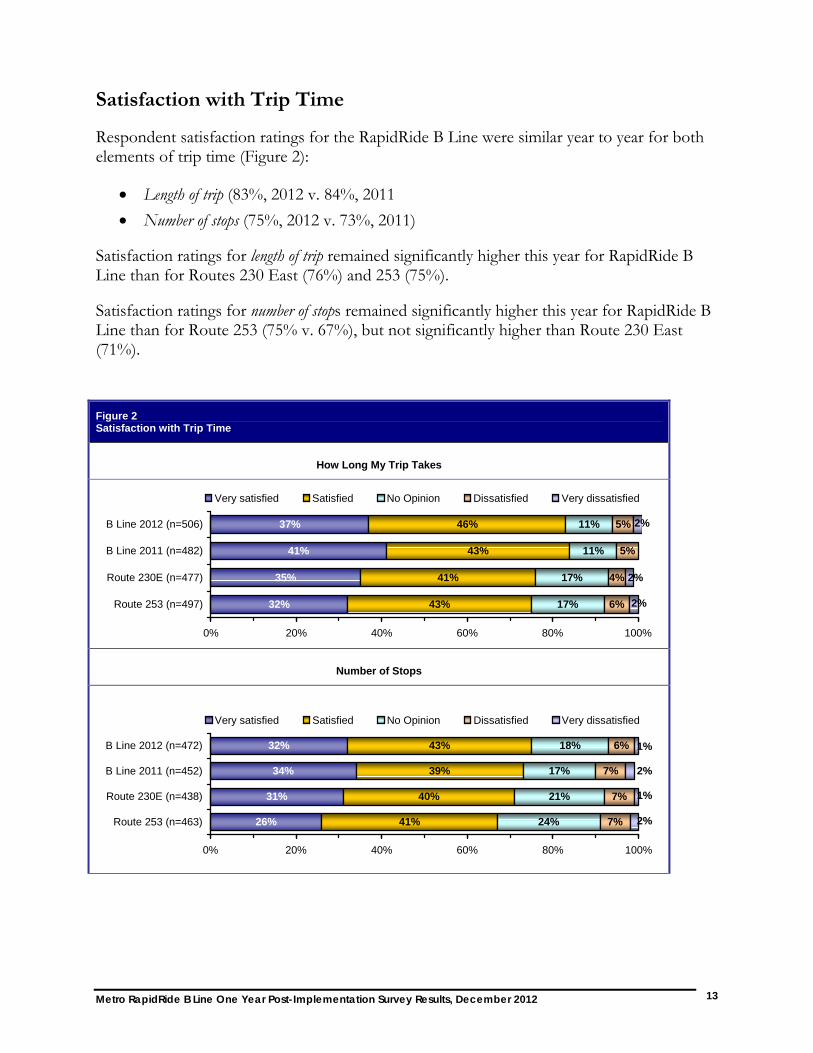
Respondent satisfaction ratings for the RapidRide B Line were similar year to year for both elements of trip time (Figure 2):
Length of trip (83%, 2012 v. 84%, 2011
Number of stops (75%, 2012 v. 73%, 2011)
Satisfaction ratings for length of trip remained significantly higher this year for RapidRide B Line than for Routes 230 East (76%) and 253 (75%).
Satisfaction ratings for number of stops remained significantly higher this year for RapidRide B Line than for Route 253 (75% v. 67%), but not significantly higher than Route 230 East (71%).
Figure 2 Satisfaction with Trip Time
How Long My Trip Takes
37%
41%
35%
32%
46%
43%
41%
43%
11%
11%
17%
17%
5%
5%
4%
6%
2%
2%
2%
0% 20% 40% 60% 80% 100%
B Line 2012 (n=506)
B Line 2011 (n=482)
Route 230E (n=477)
Route 253 (n=497)
Very satisfied Satisfied No Opinion Dissatisfied Very dissatisfied
Number of Stops
32%
34%
31%
26%
43%
39%
40%
41%
18%
17%
21%
24%
6%
7%
7%
7% 2%
1%
2%
1%
0% 20% 40% 60% 80% 100%
B Line 2012 (n=472)
B Line 2011 (n=452)
Route 230E (n=438)
Route 253 (n=463)
Very satisfied Satisfied No Opinion Dissatisfied Very dissatisfied
Metro RapidRide B Line One Year Post-Implementation Survey Results, December 2012 14
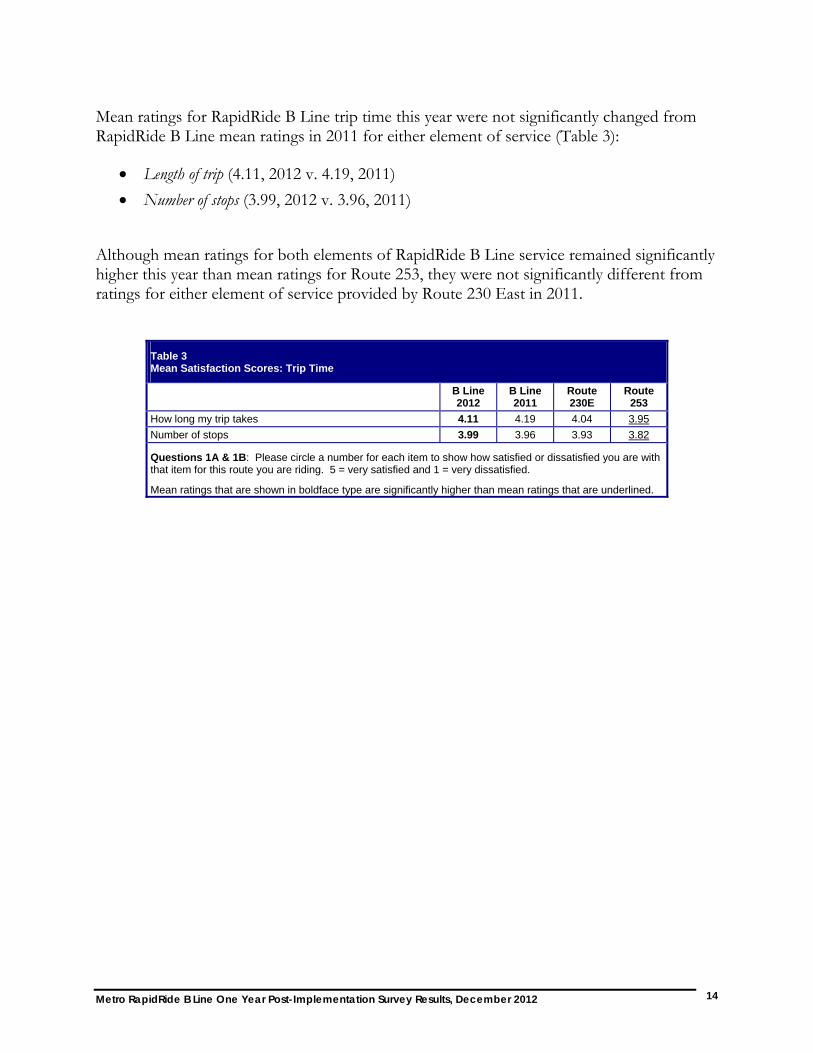
Mean ratings for RapidRide B Line trip time this year were not significantly changed from RapidRide B Line mean ratings in 2011 for either element of service (Table 3):
Length of trip (4.11, 2012 v. 4.19, 2011)
Number of stops (3.99, 2012 v. 3.96, 2011)
Although mean ratings for both elements of RapidRide B Line service remained significantly higher this year than mean ratings for Route 253, they were not significantly different from ratings for either element of service provided by Route 230 East in 2011.
Table 3 Mean Satisfaction Scores: Trip Time
B Line 2012
B Line 2011
Route 230E
Route 253
How long my trip takes 4.11 4.19 4.04 3.95
Number of stops 3.99 3.96 3.93 3.82
Questions 1A & 1B: Please circle a number for each item to show how satisfied or dissatisfied you are with that item for this route you are riding. 5 = very satisfied and 1 = very dissatisfied.
Mean ratings that are shown in boldface type are significantly higher than mean ratings that are underlined.
Metro RapidRide B Line One Year Post-Implementation Survey Results, December 2012 15
Satisfaction with Personal Safety
Behavior of other passengers on the bus gathered a significantly higher share of satisfaction ratings for RapidRide B Line in this survey than in the 3 comparison surveys (Figure 3):
Behavior of other passengers on the bus – B Line 2012 (91%), compared to B Line 2011 (85%), Route 230E (78%) and Route 253 (80%)
Satisfaction ratings for these for two elements of personal safety on the RapidRide B Line showed significant increases over pre-implementation ratings given for both Routes 230 East and Route 253:
Personal safety while on bus – B Line 2012 (97%) v. Route 230E (92%) and Route 253 (91%)
Behavior of other people at the waiting area – B Line 2012 (83%) v. Route 230E (77%) and Route 253 (77%)
Satisfaction ratings for personal safety at waiting areas also showed a significant increase for RapidRide B Line this year over Route 253:
Personal safety while waiting for the bus during the day – B Line 2012 (91%) v. Route 253 (87%)
Personal safety while waiting for the bus at night – B Line 2012 (77%) v. Route 253 (66%)

Metro RapidRide B Line One Year Post-Implementation Survey Results, December 2012 16
Figure 3 Satisfaction with Personal Safety
Personal Safety While on the Bus
61%
61%
55%
55%
36%
33%
37%
36%
3%
5%
6%
7%
2%
2%
1%
1%
1%
0% 20% 40% 60% 80% 100%
B Line 2012 (n=500)
B Line 2011 (n=479)
Route 230E (n=481)
Route 253 (n=501)
Very satisfied Satisfied No Opinion Dissatisfied Very dissatisfied
Behavior of Other Passengers
45%
49%
36%
39%
46%
36%
42%
41%
8%
13%
16%
15%
1%
4%
4%
1%
1%
1%
1%
0% 20% 40% 60% 80% 100%
B Line 2012 (n=494)
B Line 2011 (n=471)
Route 230E (n=475)
Route 253 (n=488)
Very satisfied Satisfied No Opinion Dissatisfied Very dissatisfied
Personal Safety While Waiting for the Bus During the Day
52%
52%
51%
50%
39%
39%
38%
37%
8%
8%
9%
10%
2%
2%
2%1%
0% 20% 40% 60% 80% 100%
B Line 2012 (n=490)
B Line 2011 (n=472)
Route 230E (n=468)
Route 253 (n=490)
Very satisfied Satisfied No Opinion Dissatisfied Very dissatisfied

Metro RapidRide B Line One Year Post-Implementation Survey Results, December 2012 17
Figure 3 (Continued) Satisfaction with Personal Safety
Personal Safety While Waiting for the Bus at Night
40%
39%
39%
31%
37%
33%
33%
35%
19%
21%
18%
24%
4%
5%
7%
7%
1%
3%
2%
0% 20% 40% 60% 80% 100%
B Line 2012 (n=425)
B Line 2011 (n=425)
Route 230E (n=396)
Route 253 (n=420)
Very satisfied Satisfied No Opinion Dissatisfied Very dissatisfied
Behavior of Other People at the Waiting Area
40%
41%
34%
37%
43%
39%
43%
40%
16%
16%
18%
19%
2%
3%
4%
4%
1%
1%
0% 20% 40% 60% 80% 100%
B Line 2012 (n=491)
B Line 2011 (n=469)
Route 230E (n=459)
Route 253 (n=484)
Very satisfied Satisfied No Opinion Dissatisfied Very dissatisfied

Metro RapidRide B Line One Year Post-Implementation Survey Results, December 2012 18
Mean scores for three elements of personal safety were significantly higher for RapidRide B Line 2012 than for Routes 230 East and 253 (Table 3):
Personal safety while on the bus – B Line 2012 (4.56) v. Route 230E (4.42) and Route 253 (4.42)
Behavior of other passengers on the bus – B Line 2012 (4.33) v. Route 230E (4.09) Route 253 (4.11)
Behavior of other people at the waiting area - B Line 2012 (4.20) v. Route 230E (4.04) Route 253 (4.07)
Mean scores for RapidRide B Line were higher than mean ratings for Route 253 for these aspects of bus waiting areas:
Waiting for the bus during the day – B Line 2012 (4.42) v. Route 253 (4.32) Waiting for the bus at night – B Line 2012 (4.12) v. Route 253 (3.86)
Table 3 Mean Satisfaction Scores: Personal Safety
B Line 2012
B Line 2011
Route 230E
Route 253
Personal safety while on bus 4.56 4.53 4.42 4.42
Personal safety while waiting for the bus during the day 4.42 4.39 4.37 4.32
Behavior of other passengers 4.33 4.32 4.09 4.11
Behavior of other people at the waiting area 4.20 4.18 4.04 4.07
Personal safety while waiting for the bus at night 4.12 4.04 3.99 3.86
Questions 2A-E: Please circle a number for each item to show how satisfied or dissatisfied you are with that item for this route you are riding. 5 = very satisfied and 1 = very dissatisfied.
Mean ratings that are shown in boldface type are significantly higher than mean ratings that are underlined.
Metro RapidRide B Line One Year Post-Implementation Survey Results, December 2012 19
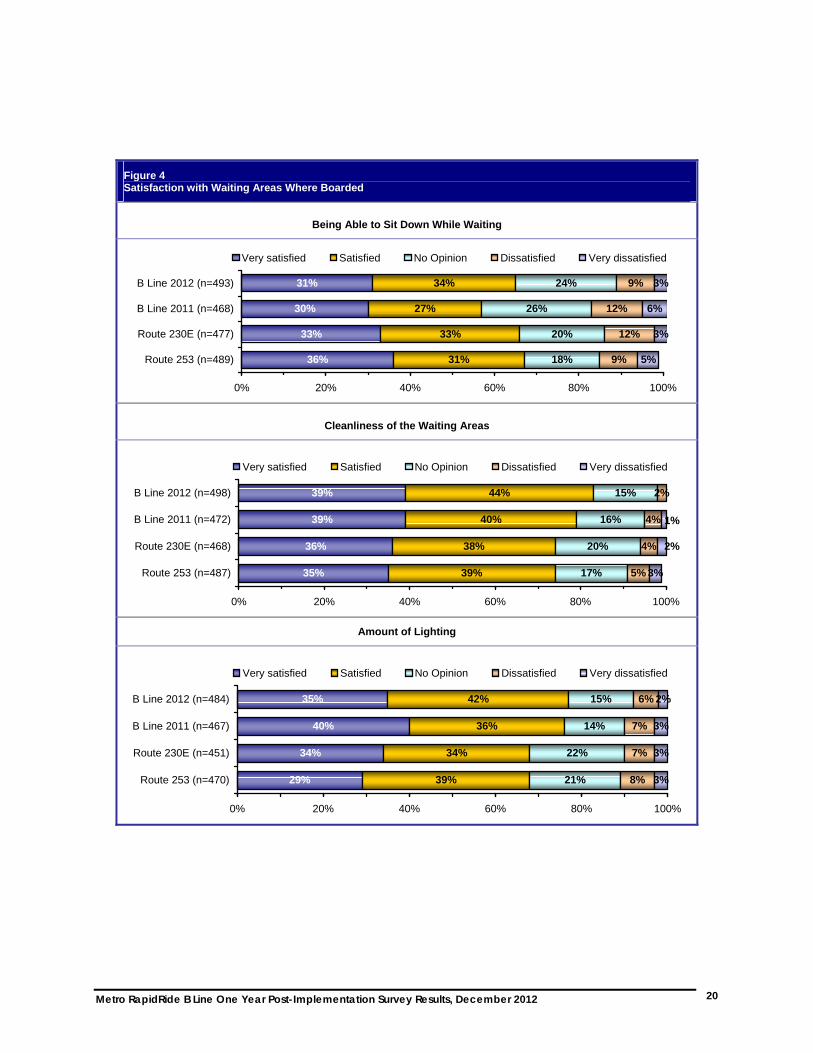
Satisfaction with the Waiting Area Where Boarded
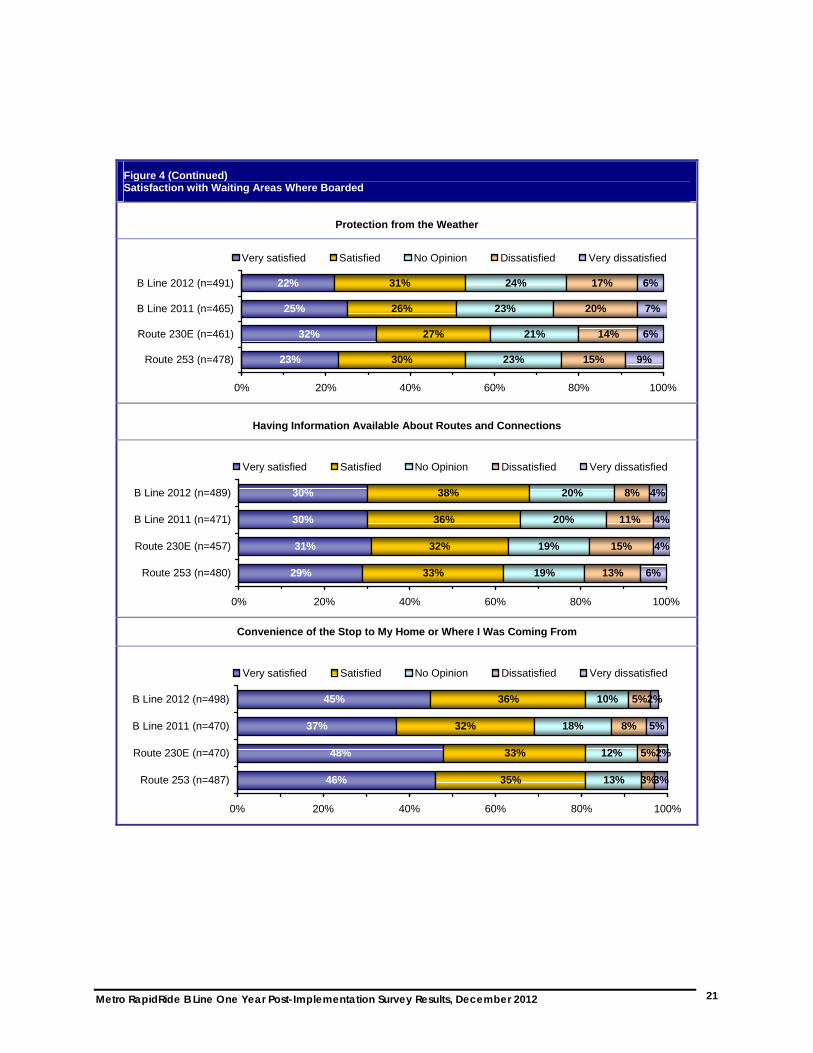
Two aspects of RapidRide B Line waiting areas showed significant improvement in satisfaction this year over 2011 RapidRide B Line results:
65% of B Line riders gave very satisfied/satisfied ratings to being able to sit down while waiting compared to 57% in 2011.
81% indicated they were satisfied with convenience of the stop to my home or where I was coming from versus 69% in 2011.
Satisfaction with cleanliness of waiting areas and amount of lighting remained significantly higher than satisfaction with these aspects waiting areas for Routes 230 East and 253:
Cleanliness of waiting areas – B Line 2012 (83%) v. Route 230E (74%) and Route 253 (74%)
Amount of lighting – B Line 2012 (77%) v. Route 230E (68%) Route 253 (68%)
Metro RapidRide B Line One Year Post-Implementation Survey Results, December 2012 20
Figure 4 Satisfaction with Waiting Areas Where Boarded
Being Able to Sit Down While Waiting
31%
30%
33%
36%
34%
27%
33%
31%
24%
26%
20%
18%
9%
12%
12%
9%
3%
6%
3%
5%
0% 20% 40% 60% 80% 100%
B Line 2012 (n=493)
B Line 2011 (n=468)
Route 230E (n=477)
Route 253 (n=489)
Very satisfied Satisfied No Opinion Dissatisfied Very dissatisfied
Cleanliness of the Waiting Areas
39%
39%
36%
35%
44%
40%
38%
39%
15%
16%
20%
17%
2%
4%
4%
5% 3%
2%
1%
0% 20% 40% 60% 80% 100%
B Line 2012 (n=498)
B Line 2011 (n=472)
Route 230E (n=468)
Route 253 (n=487)
Very satisfied Satisfied No Opinion Dissatisfied Very dissatisfied
Amount of Lighting
35%
40%
34%
29%
42%
36%
34%
39%
15%
14%
22%
21%
6%
7%
7%
8%
2%
3%
3%
3%
0% 20% 40% 60% 80% 100%
B Line 2012 (n=484)
B Line 2011 (n=467)
Route 230E (n=451)
Route 253 (n=470)
Very satisfied Satisfied No Opinion Dissatisfied Very dissatisfied
Metro RapidRide B Line One Year Post-Implementation Survey Results, December 2012 21
Figure 4 (Continued) Satisfaction with Waiting Areas Where Boarded
Protection from the Weather
22%
25%
32%
23%
31%
26%
27%
30%
24%
23%
21%
23%
17%
20%
14%
15%
6%
7%
6%
9%
0% 20% 40% 60% 80% 100%
B Line 2012 (n=491)
B Line 2011 (n=465)
Route 230E (n=461)
Route 253 (n=478)
Very satisfied Satisfied No Opinion Dissatisfied Very dissatisfied
Having Information Available About Routes and Connections
30%
30%
31%
29%
38%
36%
32%
33%
20%
20%
19%
19%
8%
11%
15%
13%
4%
4%
4%
6%
0% 20% 40% 60% 80% 100%
B Line 2012 (n=489)
B Line 2011 (n=471)
Route 230E (n=457)
Route 253 (n=480)
Very satisfied Satisfied No Opinion Dissatisfied Very dissatisfied
Convenience of the Stop to My Home or Where I Was Coming From
45%
37%
48%
46%
36%
32%
33%
35%
10%
18%
12%
13%
5%
8%
5%
3%
2%
5%
2%
3%
0% 20% 40% 60% 80% 100%
B Line 2012 (n=498)
B Line 2011 (n=470)
Route 230E (n=470)
Route 253 (n=487)
Very satisfied Satisfied No Opinion Dissatisfied Very dissatisfied

Metro RapidRide B Line One Year Post-Implementation Survey Results, December 2012 22
Figure 4 (Continued) Satisfaction with Waiting Areas Where Boarded
Being Able to See an Oncoming Bus
48%
46%
46%
40%
39%
40%
40%
42%
10%
10%
9%
13%
3%
4%
3%
3%
2%
1%
0% 20% 40% 60% 80% 100%
B Line 2012 (n=488)
B Line 2011 (n=474)
Route 230E (n=457)
Route 253 (n=490)
Very satisfied Satisfied No Opinion Dissatisfied Very dissatisfied
Electronic Real Time Information Sign – B Line Only
43%
42%
32%
32%
16%
17%
6%
7%
3%
3%
0% 20% 40% 60% 80% 100%
B Line 2012 (n=456)
B Line 2011 (n=454)
Very satisfied Satisfied No Opinion Dissatisfied Very dissatisfied

Metro RapidRide B Line One Year Post-Implementation Survey Results, December 2012 23
Mean satisfaction ratings for RapidRide B Line 2012 are displayed in Table 3. Results show several significant positive increases and one significant decrease:
Mean ratings for these three aspects of waiting areas were higher for the B Line this year than for Route 253:
o Being able to see an oncoming bus (4.31 v. 4.18) o Amount of lighting (4.02 v. 3.83) o Having information available about routes and connections (3.82 v. 3.67)
The mean rating for convenience of the bus stop was higher this year than the B Line rating last year (4.17 v. 3.89), and the rating for being able to sit down while waiting was also significantly higher than the B Line in 2011 (3.80 v. 3.64).
Cleanliness of B Line waiting areas had a mean rating of 4.17, a significantly higher rating than cleanliness of Route 230 E and Route 253 waiting areas (4.03 and 3.99).
The mean rating for protection from the weather (3.45) was significantly lower than the mean rating for Route 230E weather protection (3.64).
Table 3 Mean Satisfaction Scores: Waiting Areas for Boarding this Trip
B Line 2012
B Line 2011
Route 230E
Route 253
Being able to see an oncoming bus 4.31 4.27 4.26 4.18
Convenience of the stop to my home or where I was coming from 4.17 3.89 4.19 4.18
Cleanliness of waiting area 4.17 4.10 4.03 3.99
Electronic real time information sign* 4.06 4.03 - -
Amount of lighting 4.02 4.04 3.90 3.83
Having information available about routes and connections 3.82 3.77 3.69 3.67
Being able to sit down while waiting 3.80 3.64 3.82 3.85
Protection from weather 3.45 3.41 3.64 3.43
Questions 3A-H: : Please circle a number for each item to show how satisfied or dissatisfied you are with that item for this route you are riding. 5 = very satisfied and 1 = very dissatisfied.
Mean ratings that are shown in boldface type are significantly higher than mean ratings that are underlined.
*This item was not rated by Route 230 East and Route 253 respondents.

Metro RapidRide B Line One Year Post-Implementation Survey Results, December 2012 24
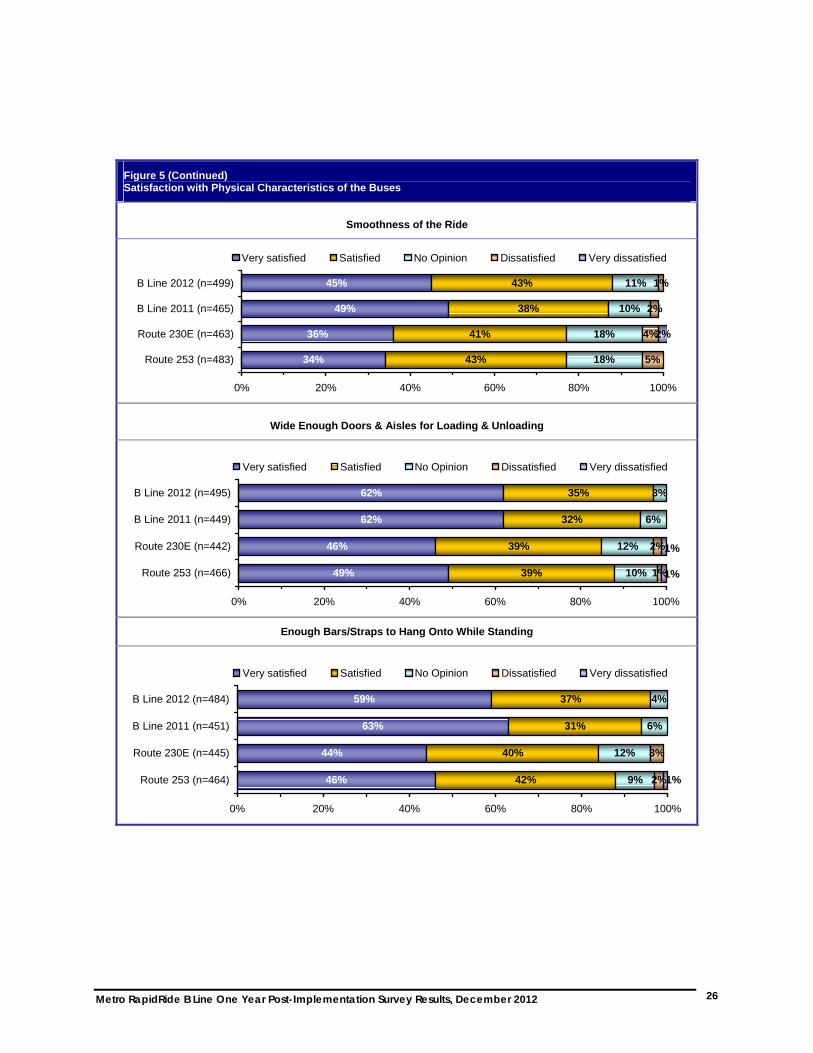
Physical Characteristics of the Buses Satisfaction ratings for physical characteristics of the RapidRide B Line buses were not significantly changed from 2011 RapidRide B Line ratings.
Satisfaction ratings for these six aspects of the RapidRide B Line buses remained significantly higher than ratings for Route 230 East and Route 253 buses:
Being able to get a seat – B Line 2012 (94%) v. Route 230E (85%) and Route 253 (83%) Cleanliness of the bus interior – B Line 2012 (94%) v. Route 230E (85%) Route 253
(89%)
Having the bus free of graffiti - B Line 2012 (94%) v. Route 230E (84%) and Route 253 (84%)
Smoothness of the ride – B Line 2012 (88%) v. Route 230E (77%) and Route 253 (77%) Wide enough doors and aisles for loading and unloading – B Line 2012 (97%) v. Route 230E
(85%) and Route 253 (88%) Enough bars and straps to hang onto while standing - B Line 2012 (96%) v. Route 230E
(84%) and Route 253 (88%)
Satisfaction ratings for two new aspects of RapidRide B Line buses asked about in this year’s survey were very high:
91% of respondents indicated very satisfied/satisfied for room to stand if no seats are available.
80% gave ratings of very satisfied/satisfied for being able to use the rear-facing (passive) wheelchair restraint.

Metro RapidRide B Line One Year Post-Implementation Survey Results, December 2012 25
Figure 5 Satisfaction with Physical Characteristics of the Buses
Being Able to Get a Seat
57%
58%
44%
42%
37%
35%
41%
41%
5%
6%
10%
12%
1%
3%
4%
1%
2%
1%
0% 20% 40% 60% 80% 100%
B Line 2012 (n=504)
B Line 2011 (n=481)
Route 230E (n=481)
Route 253 (n=499)
Very satisfied Satisfied No Opinion Dissatisfied Very dissatisfied
Cleanliness of the Bus Interior
54%
62%
43%
46%
40%
33%
42%
43%
5%
4%
12%
8%
1%
2%
2%
1%
1%
0% 20% 40% 60% 80% 100%
B Line 2012 (n=497)
B Line 2011 (n=469)
Route 230E (n=469)
Route 253 (n=492)
Very satisfied Satisfied No Opinion Dissatisfied Very dissatisfied
Having the Bus Free of Graffiti
60%
64%
48%
46%
34%
31%
36%
38%
5%
5%
13%
11%
1%
2%
3% 2%
1%
0% 20% 40% 60% 80% 100%
B Line 2012 (n=485)
B Line 2011 (n=468)
Route 230E (n=464)
Route 253 (n=476)
Very satisfied Satisfied No Opinion Dissatisfied Very dissatisfied
Metro RapidRide B Line One Year Post-Implementation Survey Results, December 2012 26
Figure 5 (Continued) Satisfaction with Physical Characteristics of the Buses
Smoothness of the Ride
45%
49%
36%
34%
43%
38%
41%
43%
11%
10%
18%
18%
1%
2%
4%
5%
2%
0% 20% 40% 60% 80% 100%
B Line 2012 (n=499)
B Line 2011 (n=465)
Route 230E (n=463)
Route 253 (n=483)
Very satisfied Satisfied No Opinion Dissatisfied Very dissatisfied
Wide Enough Doors & Aisles for Loading & Unloading
62%
62%
46%
49%
35%
32%
39%
39%
3%
6%
12%
10%
2%
1%1%
1%
0% 20% 40% 60% 80% 100%
B Line 2012 (n=495)
B Line 2011 (n=449)
Route 230E (n=442)
Route 253 (n=466)
Very satisfied Satisfied No Opinion Dissatisfied Very dissatisfied
Enough Bars/Straps to Hang Onto While Standing
59%
63%
44%
46%
37%
31%
40%
42%
4%
6%
12%
9%
3%
2%1%
0% 20% 40% 60% 80% 100%
B Line 2012 (n=484)
B Line 2011 (n=451)
Route 230E (n=445)
Route 253 (n=464)
Very satisfied Satisfied No Opinion Dissatisfied Very dissatisfied

Metro RapidRide B Line One Year Post-Implementation Survey Results, December 2012 27
Figure 5 (Continued) Satisfaction with Physical Characteristics of the Buses
Having Three Doors for Loading and Unloading
67%
68%
28%
28%
4%
4%
0% 20% 40% 60% 80% 100%
B Line 2012 (n=462)
B Line 2011 (n=462)
Very satisfied Satisfied No Opinion Dissatisfied Very dissatisfied
Having Free Wi-Fi
58%
57%
24%
25%
14%
14%
2%
3%1%
2%
0% 20% 40% 60% 80% 100%
B Line 2012 (n=423)
B Line 2011 (n=409)
Very satisfied Satisfied No Opinion Dissatisfied Very dissatisfied
Room to Stand if No Seats Are Available
50% 41% 7% 1%
0% 20% 40% 60% 80% 100%
B Line 2012 (n=475)
Very satisfied Satisfied No Opinion Dissatisfied Very dissatisfied
Being Able to Use the Rear Facing (Passive) Wheelchair Restraint
49% 31% 19% 1%
0% 20% 40% 60% 80% 100%
B Line 2012 (n=243)
Very satisfied Satisfied No Opinion Dissatisfied Very dissatisfied

Metro RapidRide B Line One Year Post-Implementation Survey Results, December 2012 28
A comparison of mean satisfaction scores for the six items rated in all four surveys showed significantly higher ratings for the RapidRide B Line than for Route 230 East and Route 253, but no significant differences between RapidRide B Line ratings this year and RapidRide B Line ratings last year.
The six items rated higher for the RapidRide B Line this year than for Routes 230E and 253 are:
Wide enough doors and aisles for loading and unloading – B Line 2012 (4.57) v. Route 230E (4.27) and Route 253 (4.33)
Enough bars and straps to hang onto while standing - B Line 2012 (4.53) v. Route 230E (4.24) and Route 253 (4.29)
Having the bus free of graffiti - B Line 2012 (4.53) v. Route 230E (4.28) and Route 253 (4.25)
Being able to get a seat – B Line 2012 (4.47) v. Route 230E (4.24) and Route 253 (4.17) Cleanliness of the bus interior – B Line 2012 (4.47) v. Route 230E (4.24) Route 253 (4.29)
Smoothness of the ride – B Line 2012 (4.28) v. Route 230E (4.05) and Route 253 (4.05)
Table 5 Mean Satisfaction Scores: Physical Characteristics of the Buses
B Line 2012
B Line 2011
Route 230E
Route 253
Having 3 doors for loading and unloading* 4.62 4.61 - -
Wide enough doors and aisles 4.57 4.57 4.27 4.33
Enough bars to hold onto while standing 4.53 4.56 4.24 4.29
Having the bus free of graffiti 4.53 4.58 4.28 4.25
Being able to get a seat 4.47 4.49 4.24 4.17
Cleanliness of the bus interior 4.47 4.57 4.24 4.29
Room to stand if no seats are available** 4.40 - - -
Free Wi-Fi* 4.35 4.34 - -
Smoothness of the ride 4.28 4.33 4.05 4.05
Being able to use the rear facing wheelchair restraint** 4.27 - - -
Questions 4A-J: Please circle a number for each item to show how satisfied or dissatisfied you are with that item for this route you are riding. 5 = very satisfied and 1 = very dissatisfied.
Mean ratings that are shown in boldface type are significantly higher than mean ratings that are underlined.
*These items were not rated by Route 230 East and Route 253 respondents. **This item was new in the 2012 survey.
Metro RapidRide B Line One Year Post-Implementation Survey Results, December 2012 29
Satisfaction with Transfers
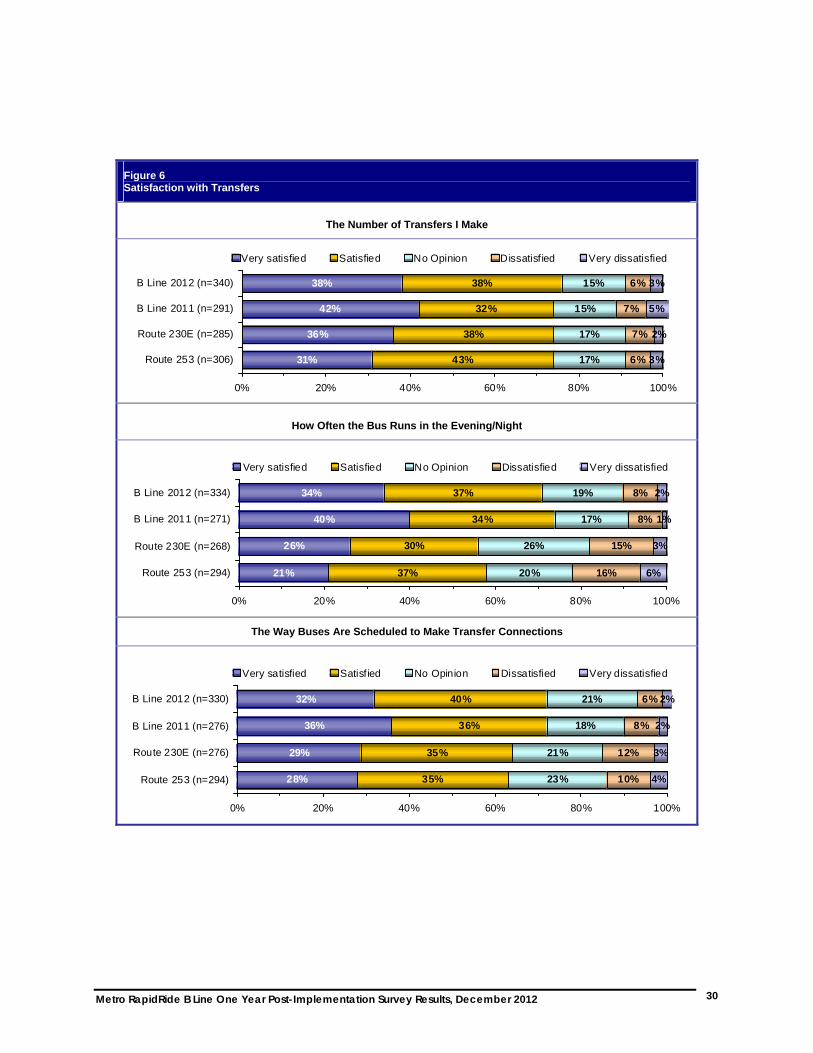
An average of about two-thirds of RapidRide B Line respondents (64%) answered questions about transfers in the current survey, more than in the 2011 survey of RapidRide B Line respondents (55%).3
Although satisfaction ratings for three aspects of transfers remained significantly higher than 2011 pre-implementation ratings, the percentage of very satisfied/satisfied ratings given for helpfulness of drivers in ensuring connections fell significantly below the 2011 result (75% currently v. 83% in 2011).
Elements of transfers that gathered significantly more very satisfied/satisfied ratings in the current survey than in surveys conducted prior to the RapidRide B Line implementation include:
How often the bus runs in the evening/at night - B Line 2012 (71%) v. Route 230E (56%) and Route 253 (58%)
The way the buses are scheduled to make transfer connections - B Line 2012 (72%) v. Route 253 (63%)
The bus coming on time when transferring - B Line 2012 (71%) v. Route 253 (62%)
3 Between 317 and 340 riders answered questions about transfers in this 2012 survey, an average of 329 riders for the question series, or 64% of n=513. In 2011 between 264 and 291 answered the same series, an average of 278 riders, or 55% of n=504.
Metro RapidRide B Line One Year Post-Implementation Survey Results, December 2012 30
Figure 6 Satisfaction with Transfers
The Number of Transfers I Make
38%
42%
36%
31%
38%
32%
38%
43%
15%
15%
17%
17%
6%
7%
7%
6%
3%
5%
2%
3%
0% 20% 40% 60% 80% 100%
B Line 2012 (n=340)
B Line 2011 (n=291)
Route 230E (n=285)
Route 253 (n=306)
Very satisfied Satisfied No Opinion Dissatisfied Very dissatisfied
How Often the Bus Runs in the Evening/Night
34%
40%
26%
21%
37%
34%
30%
37%
19%
17%
26%
20%
8%
8%
15%
16%
2%
1%
3%
6%
0% 20% 40% 60% 80% 100%
B Line 2012 (n=334)
B Line 2011 (n=271)
Route 230E (n=268)
Route 253 (n=294)
Very satisfied Satisfied No Opinion Dissatisfied Very dissatisfied
The Way Buses Are Scheduled to Make Transfer Connections
32%
36%
29%
28%
40%
36%
35%
35%
21%
18%
21%
23%
6%
8%
12%
10%
2%
2%
3%
4%
0% 20% 40% 60% 80% 100%
B Line 2012 (n=330)
B Line 2011 (n=276)
Route 230E (n=276)
Route 253 (n=294)
Very satisfied Satisfied No Opinion Dissatisfied Very dissatisfied

Metro RapidRide B Line One Year Post-Implementation Survey Results, December 2012 31
Figure 6 (Continued) Satisfaction with Transfers
Waiting Time Between Transfers
26%
36%
26%
19%
39%
34%
32%
39%
26%
20%
27%
26%
6%
9%
14%
11%
3%
1%
6%
3%
0% 20% 40% 60% 80% 100%
B Line 2012 (n=330)
B Line 2011 (n=280)
Route 230E (n=275)
Route 253 (n=301)
Very satisfied Satisfied No Opinion Dissatisfied Very dissatisfied
Helpfulness of Drivers in Ensuring Transfer Connections
38%
45%
40%
36%
37%
38%
31%
38%
20%
14%
25%
17%
3%
3%
3%
6%
2%
2%
2%
0% 20% 40% 60% 80% 100%
B Line 2012 (n=317)
B Line 2011 (n=264)
Route 230E (n=271)
Route 253 (n=297)
Very satisfied Satisfied No Opinion Dissatisfied Very dissatisfied
The Bus Coming on Time When Transferring
34%
37%
30%
26%
37%
37%
36%
36%
19%
18%
24%
25%
6%
6%
8%
9%
3%
3%
3%
5%
0% 20% 40% 60% 80% 100%
B Line 2012 (n=330)
B Line 2011 (n=277)
Route 230E (n=275)
Route 253 (n=306)
Very satisfied Satisfied No Opinion Dissatisfied Very dissatisfied
Transfer Information at the Waiting Area
32%
35%
29%
25%
34%
33%
31%
34%
23%
21%
28%
22%
10%
9%
9%
13%
2%
3%
3%
6%
0% 20% 40% 60% 80% 100%
B Line 2012 (n=324)
B Line 2011 (n=271)
Route 230E (n=272)
Route 253 (n=299)
Very satisfied Satisfied No Opinion Dissatisfied Very dissatisfied

Metro RapidRide B Line One Year Post-Implementation Survey Results, December 2012 32
Mean satisfaction ratings for 5 elements of transfers remained significantly higher this year than mean ratings obtained prior to implementation of the RapidRide B Line:
How often the bus runs in the evening/at night - B Line 2012 (3.95) v. Route 230E (3.60) and Route 253 (3.61)
The bus coming on time when transferring - B Line 2012 (3.93) v. Route 253 (3.70)
The way the buses are scheduled to make transfer connections - B Line 2012 (3.92) v. Route 253 (3.73)
Transfer information at the waiting area - B Line 2012 (3.83) v. Route 253 (3.61) Waiting time between transfers - B Line 2012 (3.78) v. Route 253 (3.54)
The mean rating for helpfulness of drivers in ensuring transfer connections fell significantly below the 2011 rating (4.06 v. 4.23).
Table 6 Mean Satisfaction Scores: Ease of Transfers
B Line 2012
B Line 2011
Route 230E
Route 253
Helpfulness of drivers in ensuring transfer connections 4.06 4.23 4.04 3.99
The number of transfers I make 4.01 4.00 3.98 3.93
How often the bus runs in the evening / at night 3.95 4.03 3.60 3.51
The bus coming on time when transferring 3.93 3.98 3.82 3.70
The way buses are scheduled to make transfer connections 3.92 3.95 3.76 3.73
Transfer information at the waiting area 3.83 3.90 3.74 3.61
Waiting time between transfers 3.78 3.93 3.63 3.54
Questions 5A-G: Please circle a number for each item to show how satisfied or dissatisfied you are with that item for this route you are riding. 5 = very satisfied and 1 = very dissatisfied.
Mean ratings that are shown in boldface type are significantly higher than mean ratings that are underlined.

Metro RapidRide B Line One Year Post-Implementation Survey Results, December 2012 33
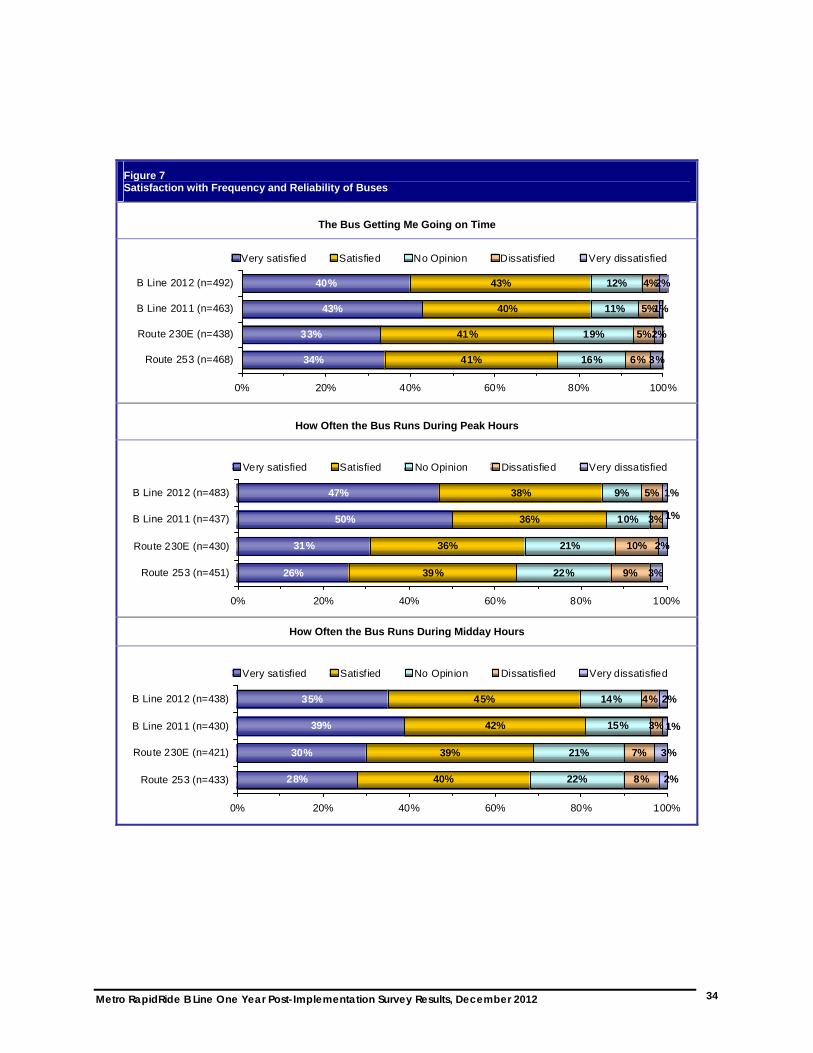
Satisfaction with Frequency and Reliability of Buses
Satisfaction ratings obtained in the current survey are not significantly different from satisfaction ratings obtained in the RapidRide B Line 2011 survey.
Satisfaction with all aspects of RapidRide B Line frequency and reliability remain significantly higher than satisfaction with service prior to B Line implementation.
How often the bus runs during peak hours - B Line 2012 (85%) v. Route 230E (67%) and Route 253 (65%)
How early the bus runs in the morning - B Line 2012 (84%) v. Route 230E (70%) and Route 253 (69%)
The bus getting me where I’m going on time - B Line 2012 (83%) v. Route 230E (74%) and Route 253 (75%)
How often the bus runs during midday hours - B Line 2012 (80%) v. Route 230E (69%) and Route 253 (68%)
How often the bus runs on weekends - B Line 2012 (72%) v. Route 230E (48%) and Route 253 (44%)
How often the bus runs in the evening/at night - B Line 2012 (69%) v. Route 230E (52%) and Route 253 (50%)
Metro RapidRide B Line One Year Post-Implementation Survey Results, December 2012 34
Figure 7 Satisfaction with Frequency and Reliability of Buses
The Bus Getting Me Going on Time
40%
43%
33%
34%
43%
40%
41%
41%
12%
11%
19%
16%
4%
5%
5%
6%
2%
1%
2%
3%
0% 20% 40% 60% 80% 100%
B Line 2012 (n=492)
B Line 2011 (n=463)
Route 230E (n=438)
Route 253 (n=468)
Very satisfied Satisfied No Opinion Dissatisfied Very dissatisfied
How Often the Bus Runs During Peak Hours
47%
50%
31%
26%
38%
36%
36%
39%
9%
10%
21%
22%
5%
3%
10%
9%
2%
3%
1%
1%
0% 20% 40% 60% 80% 100%
B Line 2012 (n=483)
B Line 2011 (n=437)
Route 230E (n=430)
Route 253 (n=451)
Very satisfied Satisfied No Opinion Dissatisfied Very dissatisfied
How Often the Bus Runs During Midday Hours
35%
39%
30%
28%
45%
42%
39%
40%
14%
15%
21%
22%
4%
3%
7%
8% 2%
3%
1%
2%
0% 20% 40% 60% 80% 100%
B Line 2012 (n=438)
B Line 2011 (n=430)
Route 230E (n=421)
Route 253 (n=433)
Very satisfied Satisfied No Opinion Dissatisfied Very dissatisfied

Metro RapidRide B Line One Year Post-Implementation Survey Results, December 2012 35
Figure 7 (Continued) Satisfaction with Frequency and Reliability of Buses
How Often the Bus Runs in the Evening/Night
28%
34%
23%
18%
41%
37%
29%
32%
22%
20%
28%
25%
6%
6%
16%
18%
4%
3%
4%
7%
0% 20% 40% 60% 80% 100%
B Line 2012 (n=428)
B Line 2011 (n=389)
Route 230E (n=388)
Route 253 (n=414)
Very satisfied Satisfied No Opinion Dissatisfied Very dissatisfied
How Often the Bus Runs on Weekends
31%
33%
20%
16%
41%
39%
28%
28%
18%
22%
28%
28%
7%
5%
19%
20%
3%
2%
5%
9%
0% 20% 40% 60% 80% 100%
B Line 2012 (n=393)
B Line 2011 (n=375)
Route 230E (n=386)
Route 253 (n=411)
Very satisfied Satisfied No Opinion Dissatisfied Very dissatisfied
How Early the Bus Runs in the Morning
46%
43%
33%
29%
38%
39%
37%
40%
11%
14%
22%
23%
3%
3%
5%
5% 3%
3%
1%
2%
0% 20% 40% 60% 80% 100%
B Line 2012 (n=425)
B Line 2011 (n=371)
Route 230E (n=396)
Route 253 (n=408)
Very satisfied Satisfied No Opinion Dissatisfied Very dissatisfied
Metro RapidRide B Line One Year Post-Implementation Survey Results, December 2012 36
Mean satisfaction ratings for frequency and reliability of RapidRide B Line this year this year are not significantly different from mean satisfaction ratings for RapidRide B Line service last year.
Mean satisfaction ratings for all aspects of RapidRide B Line remain significantly higher than mean ratings for service provided by Routes 230 East and 253 prior to B Line implementation.
How often the bus runs during peak hours - B Line 2012 (4.25) v. Route 230E (3.83) and Route 253 (3.75)
How early the bus runs in the morning - B Line 2012 (4.24) v. Route 230E (3.92) and Route 253 (3.87)
The bus getting me where I’m going on time - B Line 2012 (4.14) v. Route 230E (3.98) and Route 253 (3.99)
How often the bus runs during midday hours - B Line 2012 (4.07) v. Route 230E (3.86) and Route 253 (3.83)
How often the bus runs on weekends - B Line 2012 (3.89) v. Route 230E (3.39) and Route 253 (3.23)
How often the bus runs in the evening/at night - B Line 2012 (3.83) v. Route 230E (3.52) and Route 253 (3.36)

Metro RapidRide B Line One Year Post-Implementation Survey Results, December 2012 37
Number of Rides, Purpose and Times of Usual Trips, Transfers and Buses Taken Prior to the Implementation of the RapidRide B Line
Transit Trips Taken 2012 RapidRide B Line riders took an average of about 35 rides during the 30 days preceding the survey, significantly more than in any of the comparison surveys.
Table 7 Mean Satisfaction Scores: Frequency and Reliability of Buses
B Line 2012
B Line 2011
Route 230E
Route 253
How often the bus runs during peak hours 4.25 4.30 3.83 3.75
How early the bus runs in the morning 4.24 4.19 3.92 3.87
The bus getting me where I’m going on time 4.14 4.19 3.98 3.99
How often the bus runs during midday hours 4.07 4.14 3.86 3.83
How often the bus runs on weekends 3.89 3.95 3.39 3.23
How often the bus runs in the evening / at night 3.83 3.94 3.52 3.36
Questions 6A - I: Please circle a number for each item to show how satisfied or dissatisfied you are with that item for this route you are riding. 5 = very satisfied and 1 = very dissatisfied.
Mean ratings that are shown in boldface type are significantly higher than mean ratings that are underlined.
Table 8 Rides Taken in the Previous 30 Days
B Line 2012
B Line 2011
Route 230E
Route 253
(458) (444) (422) (454)
0 to 15 23% 35% 48% 39%
16 to 30 27 23 28 28
31 to 50 30 29 14 19
More than 50 21 14 10 14
Mean 34.7 29.1 22.4 26.6
Question 8: How many rides have you taken on RapidRide B Line/this route in the last 30 days?
Mean ratings that are shown in boldface type are significantly higher than mean ratings that are underlined.
May not add to 100% due to rounding
Metro RapidRide B Line One Year Post-Implementation Survey Results, December 2012 38
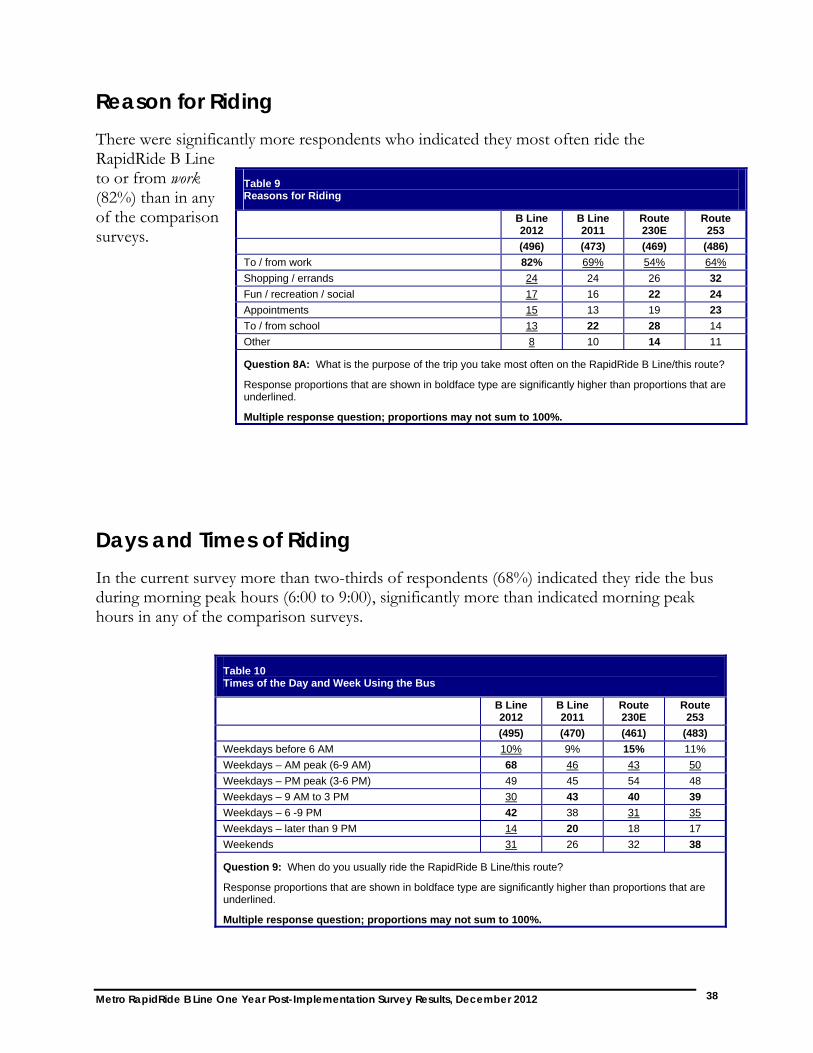
Reason for Riding There were significantly more respondents who indicated they most often ride the RapidRide B Line to or from work (82%) than in any of the comparison surveys.
Days and Times of Riding In the current survey more than two-thirds of respondents (68%) indicated they ride the bus during morning peak hours (6:00 to 9:00), significantly more than indicated morning peak hours in any of the comparison surveys.
Table 9 Reasons for Riding
B Line 2012
B Line 2011
Route 230E
Route 253
(496) (473) (469) (486)
To / from work 82% 69% 54% 64%
Shopping / errands 24 24 26 32
Fun / recreation / social 17 16 22 24
Appointments 15 13 19 23
To / from school 13 22 28 14
Other 8 10 14 11
Question 8A: What is the purpose of the trip you take most often on the RapidRide B Line/this route?
Response proportions that are shown in boldface type are significantly higher than proportions that are underlined.
Multiple response question; proportions may not sum to 100%.
Table 10 Times of the Day and Week Using the Bus
B Line 2012
B Line 2011
Route 230E
Route 253
(495) (470) (461) (483)
Weekdays before 6 AM 10% 9% 15% 11%
Weekdays – AM peak (6-9 AM) 68 46 43 50
Weekdays – PM peak (3-6 PM) 49 45 54 48
Weekdays – 9 AM to 3 PM 30 43 40 39
Weekdays – 6 -9 PM 42 38 31 35
Weekdays – later than 9 PM 14 20 18 17
Weekends 31 26 32 38
Question 9: When do you usually ride the RapidRide B Line/this route?
Response proportions that are shown in boldface type are significantly higher than proportions that are underlined.
Multiple response question; proportions may not sum to 100%.
Metro RapidRide B Line One Year Post-Implementation Survey Results, December 2012 39
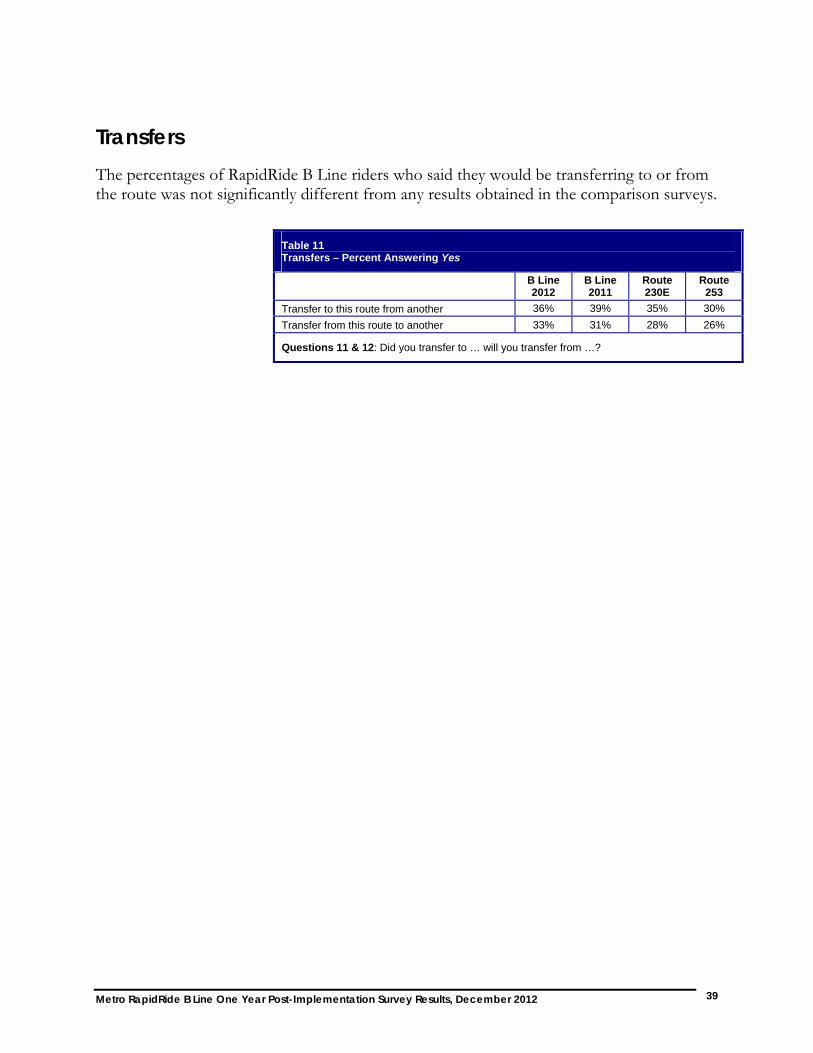
Transfers The percentages of RapidRide B Line riders who said they would be transferring to or from the route was not significantly different from any results obtained in the comparison surveys.
Table 11 Transfers – Percent Answering Yes
B Line 2012
B Line 2011
Route 230E
Route 253
Transfer to this route from another 36% 39% 35% 30%
Transfer from this route to another 33% 31% 28% 26%
Questions 11 & 12: Did you transfer to … will you transfer from …?

Metro RapidRide B Line One Year Post-Implementation Survey Results, December 2012 40
Use of Free Wi-Fi
Current use of RapidRide B Line free Wi-Fi is not significantly different from use last year. Nearly one-quarter of riders (24%) use the connection every time they ride
Fares The ORCA card continues to gain in popularity displacing cash as the most frequently used method for paying fares. In the current survey 56% of respondents said they pay their fares using an ORCA card compared to 46% in the 2011 RapidRide B Line survey, and nearly 40% in both surveys of the discontinued routes. Just 13% of respondents currently pay with cash.
Table 12 Use of Free Wi-Fi Service
B Line 2012
B Line 2011
(476) (436)
Every time I ride 24% 22%
About 1 to 2 times a week 17 18
About 1 to 2 times a month 12 9
Never 45 52
Other 3 -
Question 13: How often do you use the free Wi-Fi provided on this RapidRide bus?
Response proportions that are shown in boldface type are significantly higher than proportions that are underlined.
May not add to 100% due to rounding.
Table 13 Fares
B Line 2012
B Line 2011
Route 230E
Route 253
(495 ) (468) (455) (482)
ORCA (Total) 91% 73% 66% 68%
Card (Pass) 56 46 38 38
Unspecified ORCA 14 16 19 16
E-Purse 17 11 9 14
Pass/E-Purse comb. 4
Cash 13 22 30 32
Tickets 3 7 9 5
Other 1 3 4 1
Question 14: How do you currently pay your fare?
Response proportions that are shown in boldface type are significantly higher than proportions that are underlined.
May not add to 100% due to rounding.
Metro RapidRide B Line One Year Post-Implementation Survey Results, December 2012 41
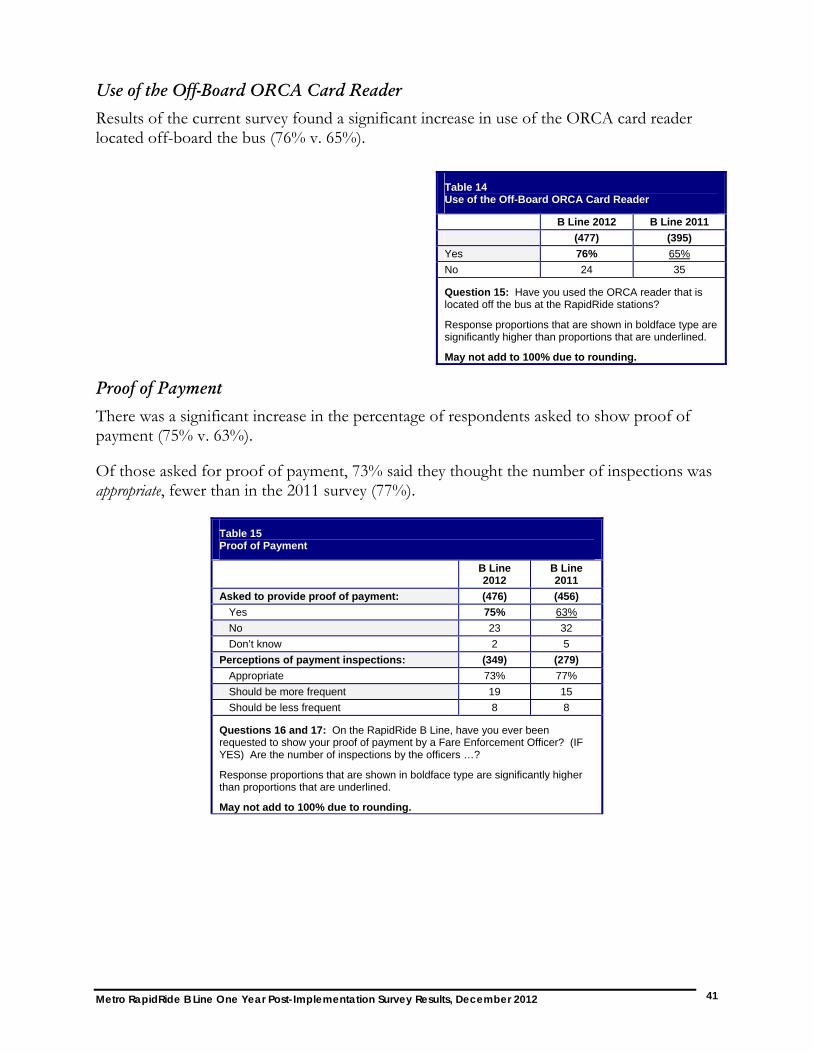
Use of the Off-Board ORCA Card Reader
Results of the current survey found a significant increase in use of the ORCA card reader located off-board the bus (76% v. 65%).
Proof of Payment
There was a significant increase in the percentage of respondents asked to show proof of payment (75% v. 63%).
Of those asked for proof of payment, 73% said they thought the number of inspections was appropriate, fewer than in the 2011 survey (77%).
Table 14 Use of the Off-Board ORCA Card Reader
B Line 2012 B Line 2011
(477) (395)
Yes 76% 65%
No 24 35
Question 15: Have you used the ORCA reader that is located off the bus at the RapidRide stations?
Response proportions that are shown in boldface type are significantly higher than proportions that are underlined.
May not add to 100% due to rounding.
Table 15 Proof of Payment
B Line 2012
B Line 2011
Asked to provide proof of payment: (476) (456)
Yes 75% 63%
No 23 32
Don’t know 2 5
Perceptions of payment inspections: (349) (279)
Appropriate 73% 77%
Should be more frequent 19 15
Should be less frequent 8 8
Questions 16 and 17: On the RapidRide B Line, have you ever been requested to show your proof of payment by a Fare Enforcement Officer? (IF YES) Are the number of inspections by the officers …?
Response proportions that are shown in boldface type are significantly higher than proportions that are underlined.
May not add to 100% due to rounding.
Metro RapidRide B Line One Year Post-Implementation Survey Results, December 2012 42
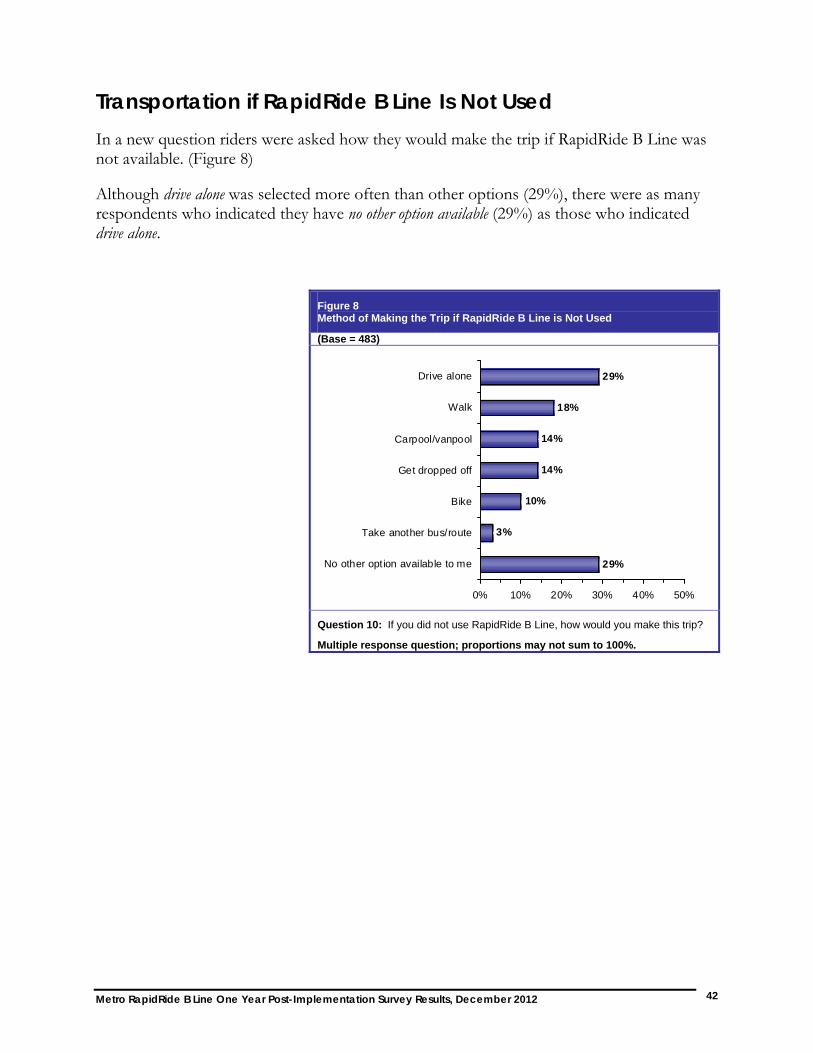
Transportation if RapidRide B Line Is Not Used In a new question riders were asked how they would make the trip if RapidRide B Line was not available. (Figure 8)
Although drive alone was selected more often than other options (29%), there were as many respondents who indicated they have no other option available (29%) as those who indicated drive alone.
Figure 8 Method of Making the Trip if RapidRide B Line is Not Used
(Base = 483)
29%
18%
14%
14%
10%
3%
29%
0% 10% 20% 30% 40% 50%
Drive alone
Walk
Carpool/vanpool
Get dropped off
Bike
Take another bus/route
No other option available to me
Question 10: If you did not use RapidRide B Line, how would you make this trip?
Multiple response question; proportions may not sum to 100%.
Metro RapidRide B Line One Year Post-Implementation Survey Results, December 2012 43
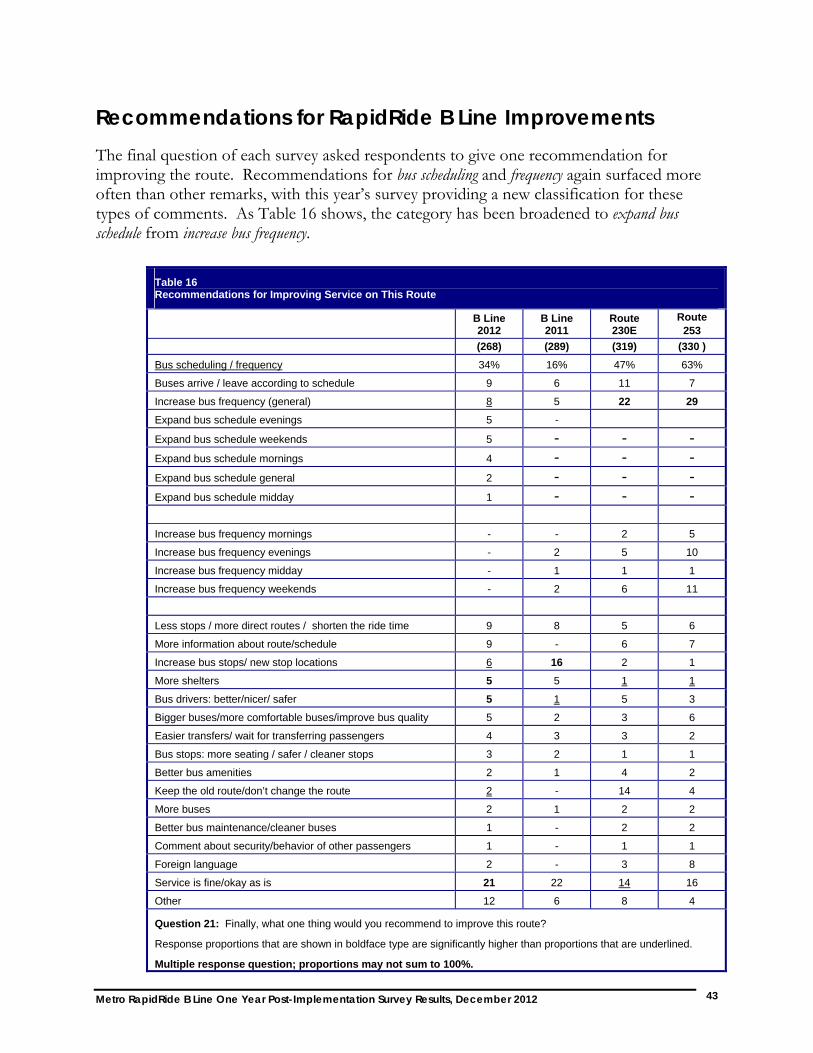
Recommendations for RapidRide B Line Improvements The final question of each survey asked respondents to give one recommendation for improving the route. Recommendations for bus scheduling and frequency again surfaced more often than other remarks, with this year’s survey providing a new classification for these types of comments. As Table 16 shows, the category has been broadened to expand bus schedule from increase bus frequency.
Table 16 Recommendations for Improving Service on This Route
B Line 2012
B Line 2011
Route 230E
Route 253
(268) (289) (319) (330 )
Bus scheduling / frequency 34% 16% 47% 63%
Buses arrive / leave according to schedule 9 6 11 7
Increase bus frequency (general) 8 5 22 29
Expand bus schedule evenings 5 -
Expand bus schedule weekends 5 - - - Expand bus schedule mornings 4 - - - Expand bus schedule general 2 - - - Expand bus schedule midday 1 - - -
Increase bus frequency mornings - - 2 5
Increase bus frequency evenings - 2 5 10
Increase bus frequency midday - 1 1 1
Increase bus frequency weekends - 2 6 11
Less stops / more direct routes / shorten the ride time 9 8 5 6
More information about route/schedule 9 - 6 7
Increase bus stops/ new stop locations 6 16 2 1
More shelters 5 5 1 1
Bus drivers: better/nicer/ safer 5 1 5 3
Bigger buses/more comfortable buses/improve bus quality 5 2 3 6
Easier transfers/ wait for transferring passengers 4 3 3 2
Bus stops: more seating / safer / cleaner stops 3 2 1 1
Better bus amenities 2 1 4 2
Keep the old route/don’t change the route 2 - 14 4
More buses 2 1 2 2
Better bus maintenance/cleaner buses 1 - 2 2
Comment about security/behavior of other passengers 1 - 1 1
Foreign language 2 - 3 8
Service is fine/okay as is 21 22 14 16
Other 12 6 8 4
Question 21: Finally, what one thing would you recommend to improve this route?
Response proportions that are shown in boldface type are significantly higher than proportions that are underlined.
Multiple response question; proportions may not sum to 100%.
Metro RapidRide B Line One Year Post-Implementation Survey Results, December 2012 44
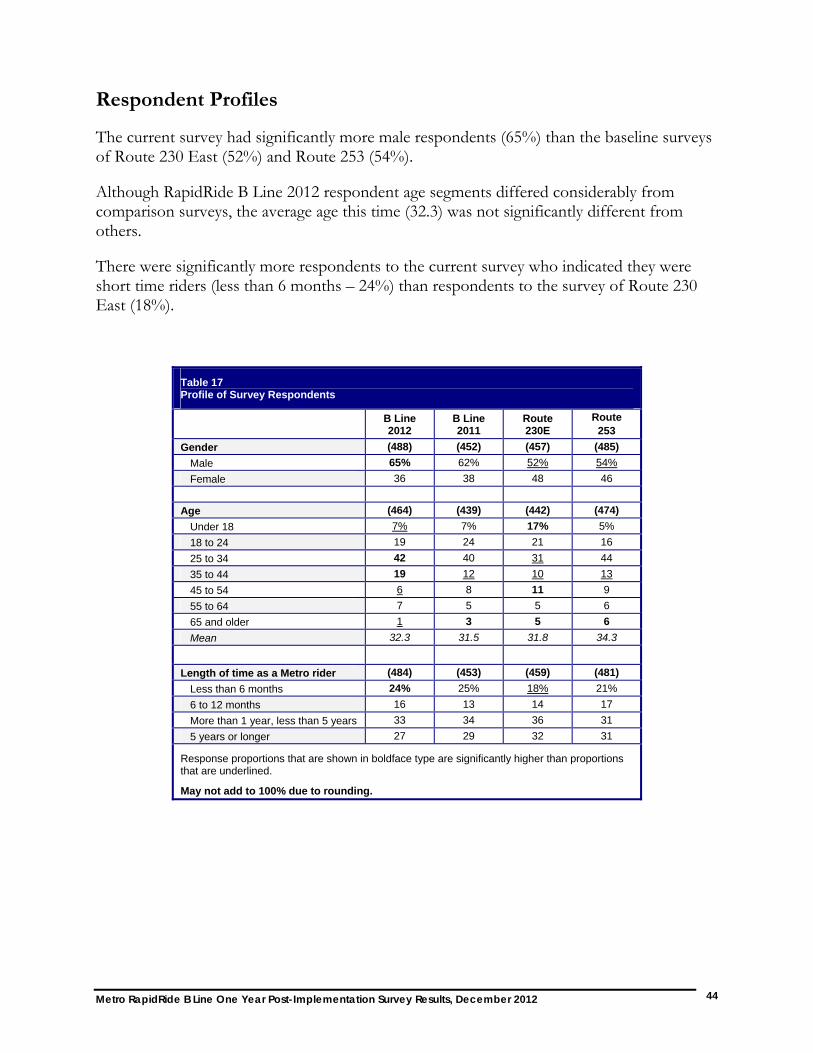
Respondent Profiles
The current survey had significantly more male respondents (65%) than the baseline surveys of Route 230 East (52%) and Route 253 (54%).
Although RapidRide B Line 2012 respondent age segments differed considerably from comparison surveys, the average age this time (32.3) was not significantly different from others.
There were significantly more respondents to the current survey who indicated they were short time riders (less than 6 months – 24%) than respondents to the survey of Route 230 East (18%).
Table 17 Profile of Survey Respondents
B Line 2012
B Line 2011
Route 230E
Route 253
Gender (488) (452) (457) (485)
Male 65% 62% 52% 54%
Female 36 38 48 46
Age (464) (439) (442) (474)
Under 18 7% 7% 17% 5%
18 to 24 19 24 21 16
25 to 34 42 40 31 44
35 to 44 19 12 10 13
45 to 54 6 8 11 9
55 to 64 7 5 5 6
65 and older 1 3 5 6
Mean 32.3 31.5 31.8 34.3
Length of time as a Metro rider (484) (453) (459) (481)
Less than 6 months 24% 25% 18% 21%
6 to 12 months 16 13 14 17
More than 1 year, less than 5 years 33 34 36 31
5 years or longer 27 29 32 31
Response proportions that are shown in boldface type are significantly higher than proportions that are underlined.
May not add to 100% due to rounding.

Metro RapidRide B Line One Year Post-Implementation Survey Results, December 2012 45
Appendix
Metro RapidRide B Line One Year Post-Implementation Survey Results, December 2012 46
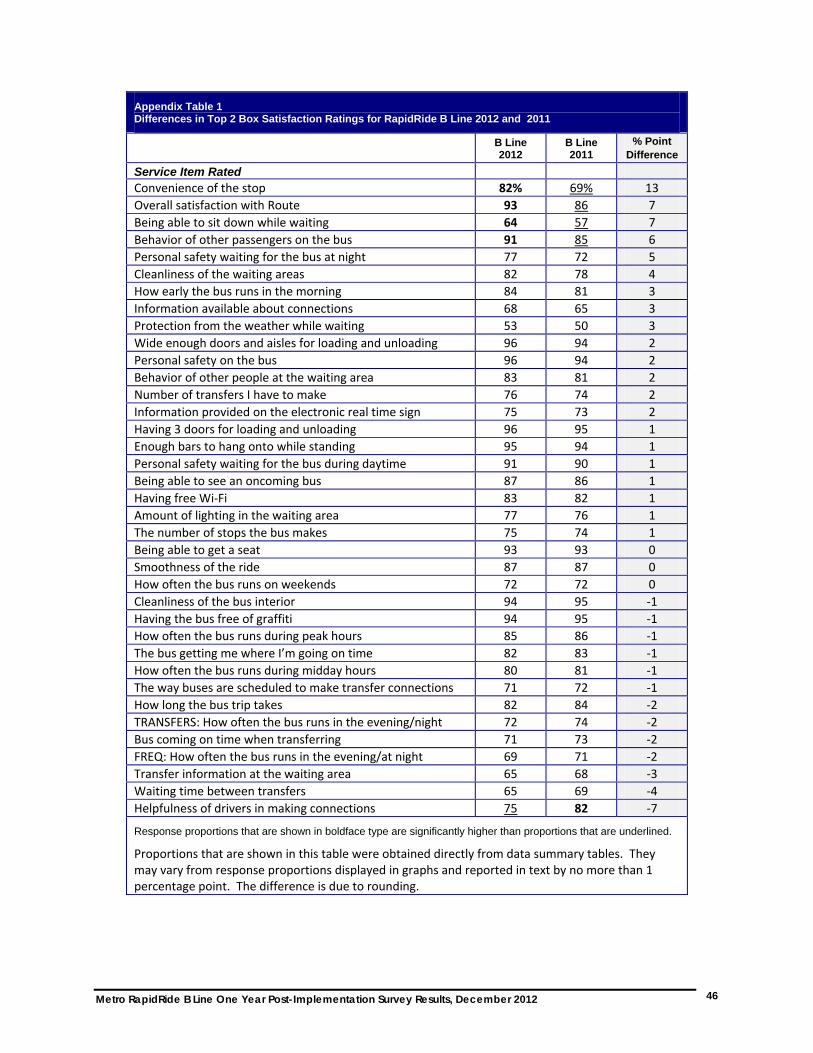
Appendix Table 1 Differences in Top 2 Box Satisfaction Ratings for RapidRide B Line 2012 and 2011
B Line 2012
B Line 2011
% Point Difference
Service Item Rated Convenience of the stop 82% 69% 13
Overall satisfaction with Route 93 86 7
Being able to sit down while waiting 64 57 7
Behavior of other passengers on the bus 91 85 6
Personal safety waiting for the bus at night 77 72 5
Cleanliness of the waiting areas 82 78 4
How early the bus runs in the morning 84 81 3
Information available about connections 68 65 3
Protection from the weather while waiting 53 50 3
Wide enough doors and aisles for loading and unloading 96 94 2
Personal safety on the bus 96 94 2
Behavior of other people at the waiting area 83 81 2
Number of transfers I have to make 76 74 2
Information provided on the electronic real time sign 75 73 2
Having 3 doors for loading and unloading 96 95 1
Enough bars to hang onto while standing 95 94 1
Personal safety waiting for the bus during daytime 91 90 1
Being able to see an oncoming bus 87 86 1
Having free Wi‐Fi 83 82 1
Amount of lighting in the waiting area 77 76 1
The number of stops the bus makes 75 74 1
Being able to get a seat 93 93 0
Smoothness of the ride 87 87 0
How often the bus runs on weekends 72 72 0
Cleanliness of the bus interior 94 95 ‐1
Having the bus free of graffiti 94 95 ‐1
How often the bus runs during peak hours 85 86 ‐1
The bus getting me where I’m going on time 82 83 ‐1
How often the bus runs during midday hours 80 81 ‐1
The way buses are scheduled to make transfer connections 71 72 ‐1
How long the bus trip takes 82 84 ‐2
TRANSFERS: How often the bus runs in the evening/night 72 74 ‐2
Bus coming on time when transferring 71 73 ‐2
FREQ: How often the bus runs in the evening/at night 69 71 ‐2
Transfer information at the waiting area 65 68 ‐3
Waiting time between transfers 65 69 ‐4
Helpfulness of drivers in making connections 75 82 ‐7
Response proportions that are shown in boldface type are significantly higher than proportions that are underlined.
Proportions that are shown in this table were obtained directly from data summary tables. They may vary from response proportions displayed in graphs and reported in text by no more than 1 percentage point. The difference is due to rounding.
Metro RapidRide B Line One Year Post-Implementation Survey Results, December 2012 47
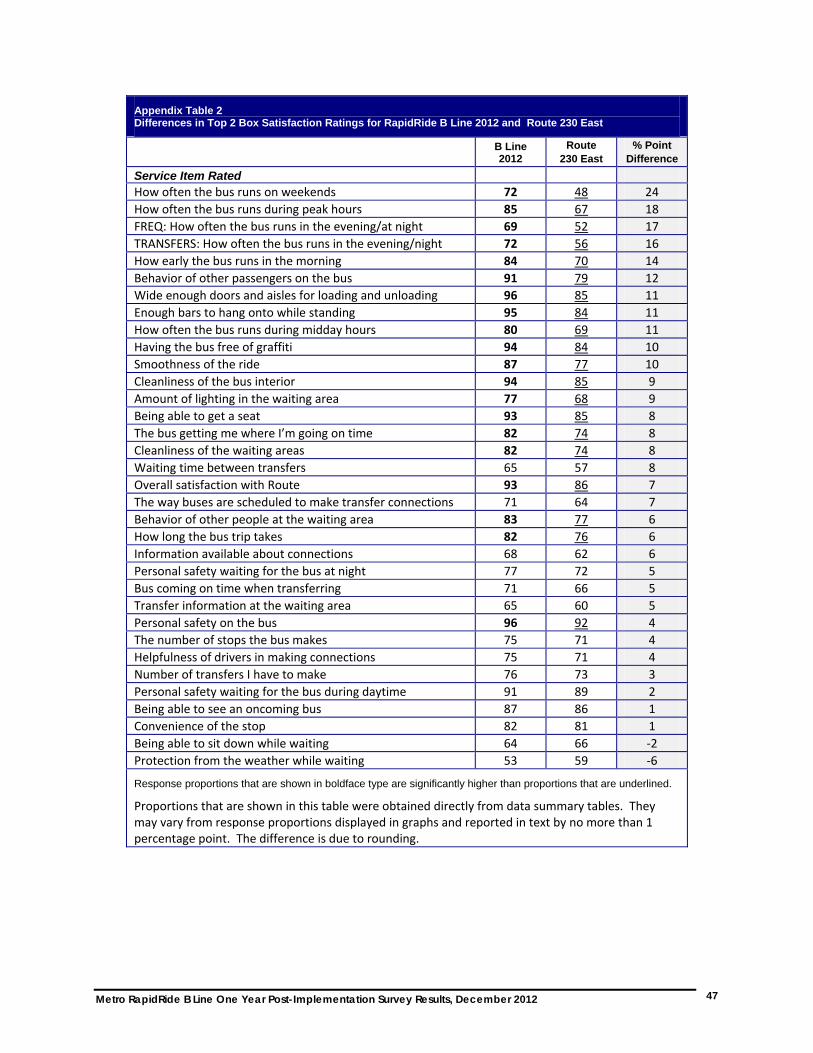
Appendix Table 2 Differences in Top 2 Box Satisfaction Ratings for RapidRide B Line 2012 and Route 230 East
B Line 2012
Route 230 East
% Point Difference
Service Item Rated How often the bus runs on weekends 72 48 24
How often the bus runs during peak hours 85 67 18
FREQ: How often the bus runs in the evening/at night 69 52 17
TRANSFERS: How often the bus runs in the evening/night 72 56 16
How early the bus runs in the morning 84 70 14
Behavior of other passengers on the bus 91 79 12
Wide enough doors and aisles for loading and unloading 96 85 11
Enough bars to hang onto while standing 95 84 11
How often the bus runs during midday hours 80 69 11
Having the bus free of graffiti 94 84 10
Smoothness of the ride 87 77 10
Cleanliness of the bus interior 94 85 9
Amount of lighting in the waiting area 77 68 9
Being able to get a seat 93 85 8
The bus getting me where I’m going on time 82 74 8
Cleanliness of the waiting areas 82 74 8
Waiting time between transfers 65 57 8
Overall satisfaction with Route 93 86 7
The way buses are scheduled to make transfer connections 71 64 7
Behavior of other people at the waiting area 83 77 6
How long the bus trip takes 82 76 6
Information available about connections 68 62 6
Personal safety waiting for the bus at night 77 72 5
Bus coming on time when transferring 71 66 5
Transfer information at the waiting area 65 60 5
Personal safety on the bus 96 92 4
The number of stops the bus makes 75 71 4
Helpfulness of drivers in making connections 75 71 4
Number of transfers I have to make 76 73 3
Personal safety waiting for the bus during daytime 91 89 2
Being able to see an oncoming bus 87 86 1
Convenience of the stop 82 81 1
Being able to sit down while waiting 64 66 ‐2
Protection from the weather while waiting 53 59 ‐6
Response proportions that are shown in boldface type are significantly higher than proportions that are underlined.
Proportions that are shown in this table were obtained directly from data summary tables. They may vary from response proportions displayed in graphs and reported in text by no more than 1 percentage point. The difference is due to rounding.
Metro RapidRide B Line One Year Post-Implementation Survey Results, December 2012 48
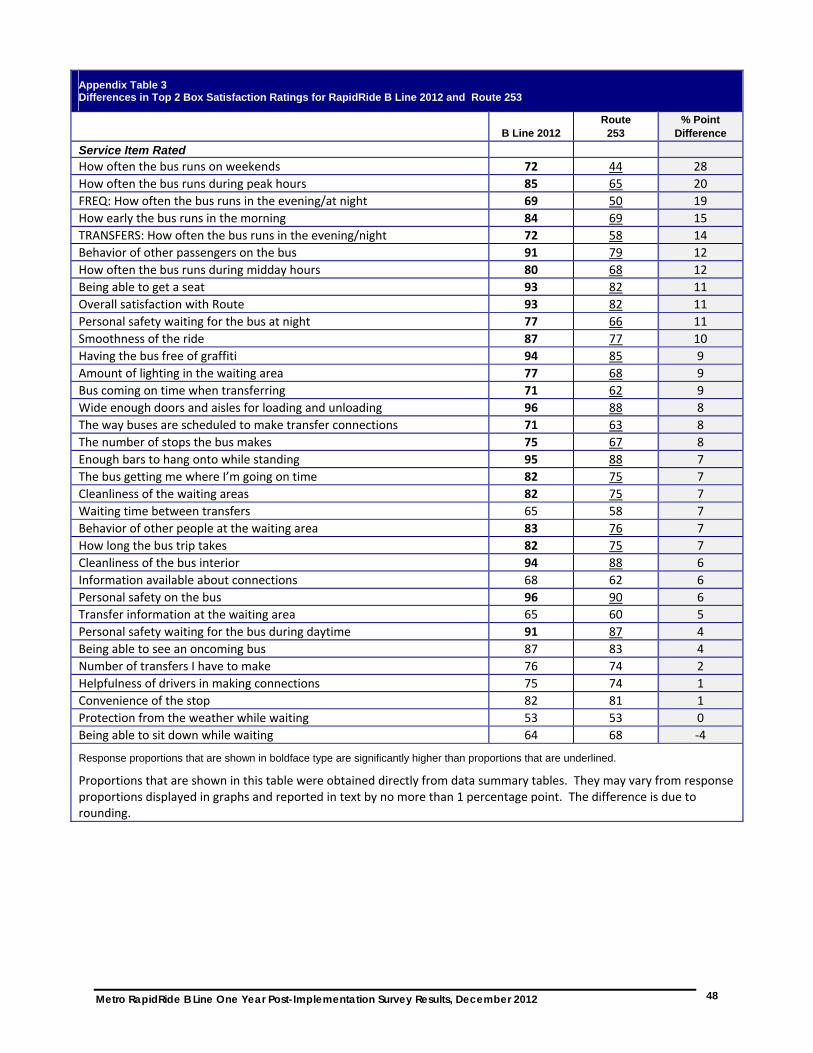
Appendix Table 3 Differences in Top 2 Box Satisfaction Ratings for RapidRide B Line 2012 and Route 253
B Line 2012 Route
253 % Point
Difference
Service Item Rated How often the bus runs on weekends 72 44 28
How often the bus runs during peak hours 85 65 20
FREQ: How often the bus runs in the evening/at night 69 50 19
How early the bus runs in the morning 84 69 15
TRANSFERS: How often the bus runs in the evening/night 72 58 14
Behavior of other passengers on the bus 91 79 12
How often the bus runs during midday hours 80 68 12
Being able to get a seat 93 82 11
Overall satisfaction with Route 93 82 11
Personal safety waiting for the bus at night 77 66 11
Smoothness of the ride 87 77 10
Having the bus free of graffiti 94 85 9
Amount of lighting in the waiting area 77 68 9
Bus coming on time when transferring 71 62 9
Wide enough doors and aisles for loading and unloading 96 88 8
The way buses are scheduled to make transfer connections 71 63 8
The number of stops the bus makes 75 67 8
Enough bars to hang onto while standing 95 88 7
The bus getting me where I’m going on time 82 75 7
Cleanliness of the waiting areas 82 75 7
Waiting time between transfers 65 58 7
Behavior of other people at the waiting area 83 76 7
How long the bus trip takes 82 75 7
Cleanliness of the bus interior 94 88 6
Information available about connections 68 62 6
Personal safety on the bus 96 90 6
Transfer information at the waiting area 65 60 5
Personal safety waiting for the bus during daytime 91 87 4
Being able to see an oncoming bus 87 83 4
Number of transfers I have to make 76 74 2
Helpfulness of drivers in making connections 75 74 1
Convenience of the stop 82 81 1
Protection from the weather while waiting 53 53 0
Being able to sit down while waiting 64 68 ‐4
Response proportions that are shown in boldface type are significantly higher than proportions that are underlined.
Proportions that are shown in this table were obtained directly from data summary tables. They may vary from response proportions displayed in graphs and reported in text by no more than 1 percentage point. The difference is due to rounding.

Metro RapidRide B Line One Year Post-Implementation Survey Results, December 2012 49
Appendix Table 4 Differences in Top 2 Box Satisfaction Ratings for RapidRide B Line 2012 and All Comparison Surveys
B Line 2012
B Line 2011
B Line Pt. Gap
Route 230E
R230E Pt.
Gap Route
253
R253
Pt. Gap
Service Item Rated Wide enough doors and aisles for loading and unloading 96% 94% 2 85 11 88 8
Personal safety on the bus 96 94 2 92 4 90 6
Having 3 doors for loading and unloading 96 95 1
Enough bars to hang onto while standing 95 94 1 84 11 88 7
Cleanliness of the bus interior 94 95 ‐1 85 9 88 6
Having the bus free of graffiti 94 95 ‐1 84 10 85 9
Overall satisfaction with Route 93 86 7 86 7 82 11
Being able to get a seat 93 93 0 85 8 82 11
Behavior of other passengers on the bus 91 85 6 79 12 79 12
Personal safety waiting for the bus during daytime 91 90 1 89 2 87 4
Room to stand if no seats are available 91
Smoothness of the ride 87 87 0 77 10 77 10
Being able to see an oncoming bus 87 86 1 86 1 83 4
How often the bus runs during peak hours 85 86 ‐1 67 18 65 20
How early the bus runs in the morning 84 81 3 70 14 69 15
Behavior of other people at the waiting area 83 81 2 77 6 76 7
Having free Wi‐Fi 83 82 1
The bus getting me where I’m going on time 82 83 ‐1 74 8 75 7
How long the bus trip takes 82 84 ‐2 76 6 75 7
Cleanliness of the waiting areas 82 78 4 74 8 75 7
Convenience of the stop 82 69 13 81 1 81 1
How often the bus runs during midday hours 80 81 ‐1 69 11 68 12
Being able to use the rear‐facing wheelchair restraint 80
Amount of lighting in the waiting area 77 76 1 68 9 68 9
Personal safety waiting for the bus at night 77 72 5 72 5 66 11
Number of transfers I have to make 76 74 2 73 3 74 2
The number of stops the bus makes 75 74 1 71 4 67 8
Helpfulness of drivers in making connections 75 82 ‐7 71 4 74 1
Information provided on the electronic real time sign 75 73 2
How often the bus runs on weekends 72 72 0 48 24 44 28
TRANSFERS: How often the bus runs in the evening/night 72 74 ‐2 56 16 58 14
Bus coming on time when transferring 71 73 ‐2 66 5 62 9
The way buses are scheduled to make transfer connections 71 72 ‐1 64 7 63 8
FREQ: How often the bus runs in the evening/at night 69 71 ‐2 52 17 50 19
Information available about connections 68 65 3 62 6 62 6
Waiting time between transfers 65 69 ‐4 57 8 58 7
Transfer information at the waiting area 65 68 ‐3 60 5 60 5
Being able to sit down while waiting 64 57 7 66 ‐2 68 ‐4
Protection from the weather while waiting 53 50 3 59 ‐6 53 0
Proportions that are shown in this table were obtained directly from data summary tables. They may vary from response proportions displayed in graphs and reported in text by no more than 1 percentage point. The difference is due to rounding.


