Re-shaping the online media industry The sh i f t f r om des t ina t i on to d i s t r i bu ted med ia
Jimmy Maymann
President, Content and Consumer ���
Brands, AOL
@maymann
2
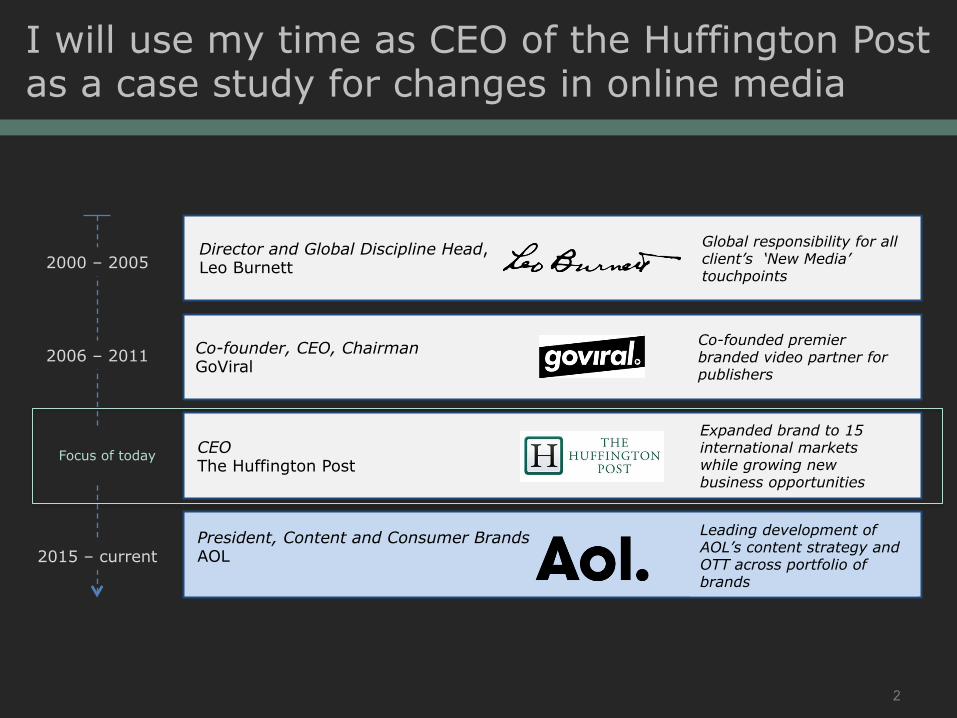
I will use my time as CEO of the Huffington Post as a case study for changes in online media
Director and Global Discipline Head, Leo Burnett
Global responsibility for all client’s ‘New Media’ touchpoints
Co-founder, CEO, Chairman GoViral
Co-founded premier branded video partner for publishers
CEO The Huffington Post
Expanded brand to 15 international markets while growing new business opportunities
President, Content and Consumer Brands AOL
Leading development of AOL’s content strategy and OTT across portfolio of brands
2000 – 2005
2006 – 2011
2012 - 2015
2015 – current
Focus of today
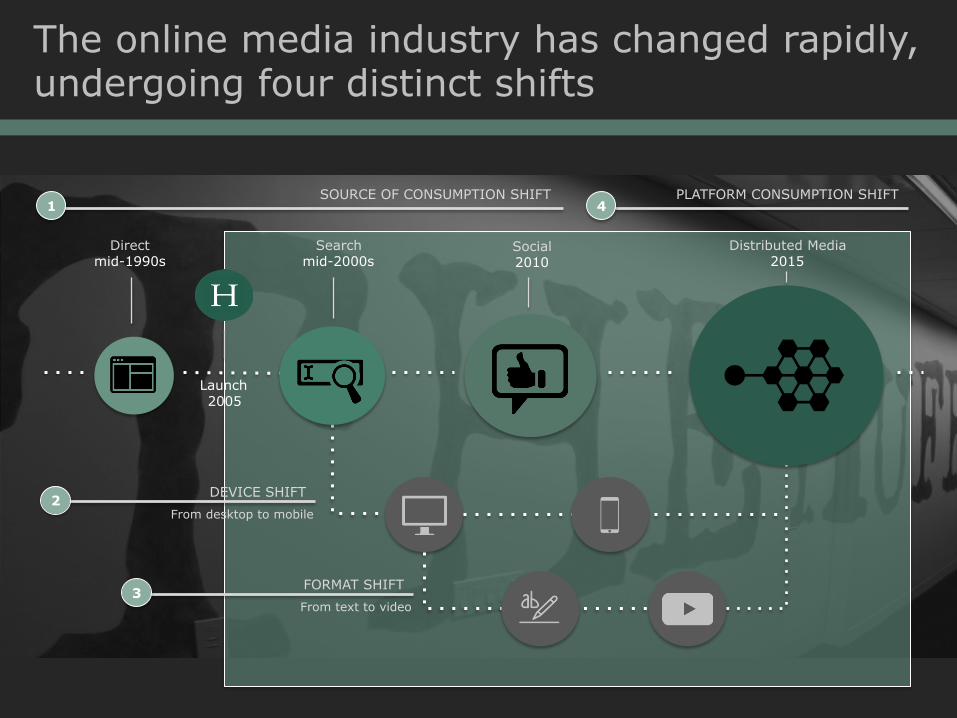
The online media industry has changed rapidly, undergoing four distinct shifts
Launch 2005
From desktop to mobile
DEVICE SHIFT 2
From text to video
FORMAT SHIFT 3
Direct mid-1990s
Social 2010
Search mid-2000s
SOURCE OF CONSUMPTION SHIFT 1
PLATFORM CONSUMPTION SHIFT 4
Distributed Media 2015

Source shift: Technological advances fundamentally changed content discovery
1
Direct mid-1990s
Social 2010
Search mid-2000s
SOURCE OF CONSUMPTION SHIFT 1
5
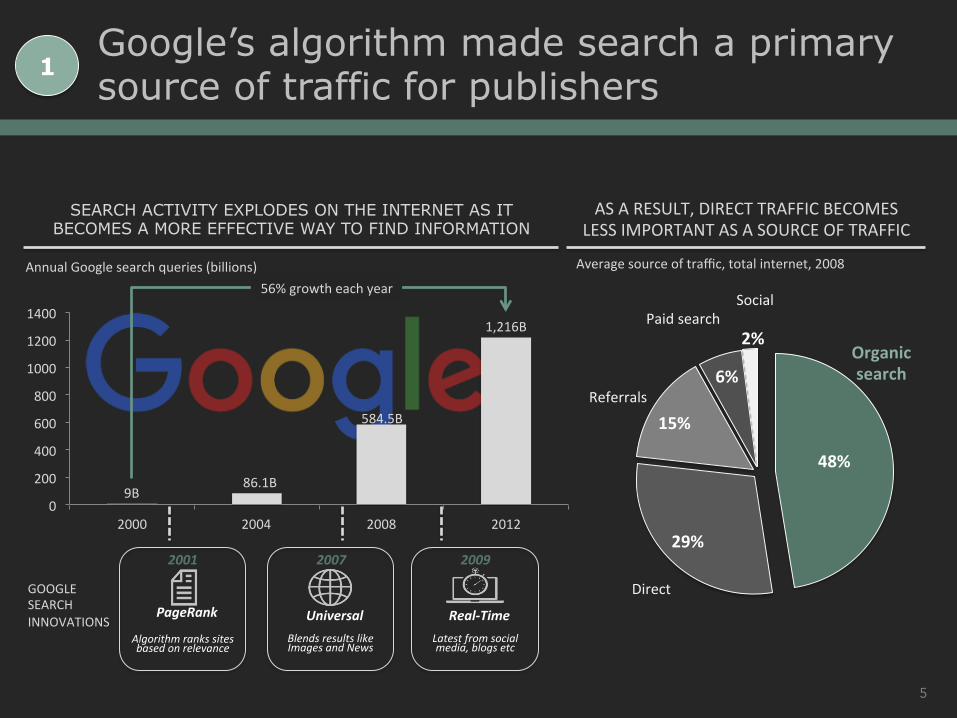
Annual Google search queries (billions)
0
200
400
600
800
1000
1200
1400
2000 2004 2008 2012
9B 86.1B
584.5B
1,216B
GOOGLE SEARCH INNOVATIONS
2001
PageRank
Algorithm ranks sites based on relevance
2007
Universal Blends results like Images and News
2009
Real-‐Time Latest from social media, blogs etc
56% growth each year
SEARCH ACTIVITY EXPLODES ON THE INTERNET AS IT BECOMES A MORE EFFECTIVE WAY TO FIND INFORMATION
48%
29%
15%
6%
2%
AS A RESULT, DIRECT TRAFFIC BECOMES LESS IMPORTANT AS A SOURCE OF TRAFFIC
Organic search
Direct
Referrals
Paid search Social
Average source of traffic, total internet, 2008
1 Google’s algorithm made search a primary source of traffic for publishers
6
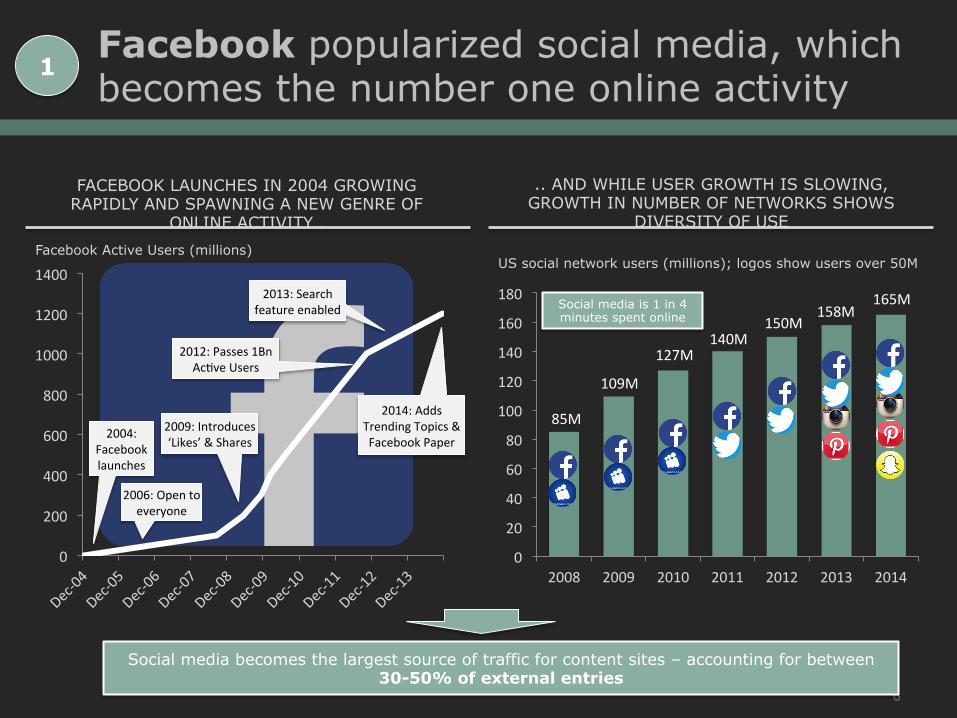
Facebook popularized social media, which becomes the number one online activity
1
Social media becomes the largest source of traffic for content sites – accounting for between 30-50% of external entries
FACEBOOK LAUNCHES IN 2004 GROWING RAPIDLY AND SPAWNING A NEW GENRE OF
ONLINE ACTIVITY…
0
200
400
600
800
1000
1200
1400
2004: Facebook launches
2006: Open to everyone
2009: Introduces ‘Likes’ & Shares
2013: Search feature enabled
2014: Adds Trending Topics & Facebook Paper
2012: Passes 1Bn Ac^ve Users
Facebook Active Users (millions)
.. AND WHILE USER GROWTH IS SLOWING, GROWTH IN NUMBER OF NETWORKS SHOWS
DIVERSITY OF USE
0
20
40
60
80
100
120
140
160
180
2008 2009 2010 2011 2012 2013 2014
US social network users (millions); logos show users over 50M
165M 158M
150M 140M
127M
109M
85M
Social media is 1 in 4 minutes spent online
7
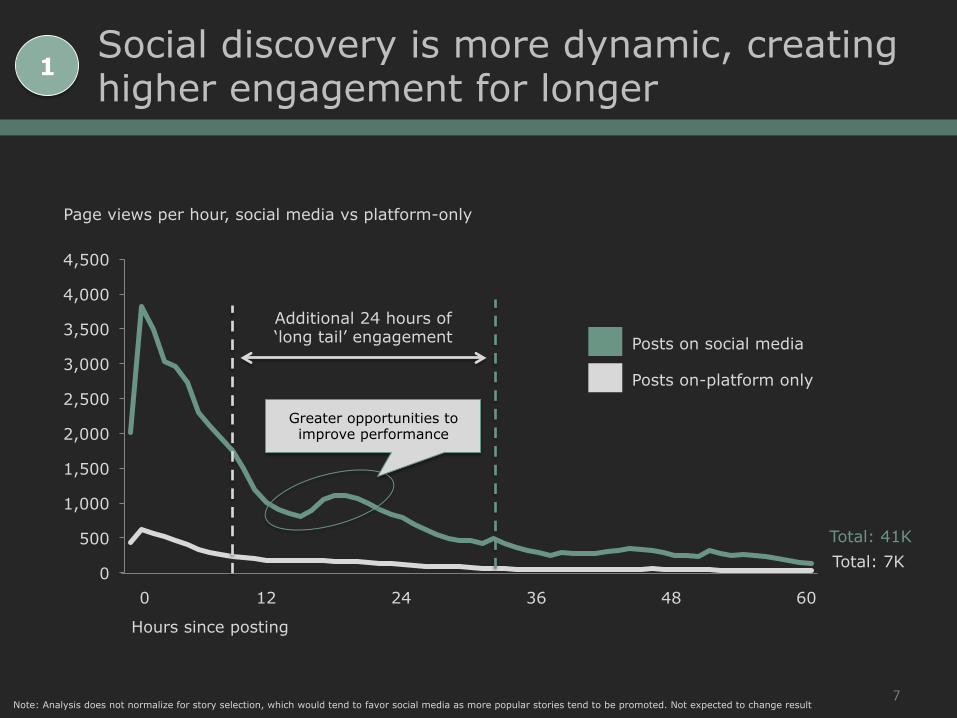
Social discovery is more dynamic, creating higher engagement for longer
1
0
500
1,000
1,500
2,000
2,500
3,000
3,500
4,000
4,500
Posts on-platform only
Posts on social media
Page views per hour, social media vs platform-only
12 60 48 36 24 0
Hours since posting
Additional 24 hours of ‘long tail’ engagement
Total: 41K Total: 7K
Greater opportunities to improve performance
Note: Analysis does not normalize for story selection, which would tend to favor social media as more popular stories tend to be promoted. Not expected to change result

HuffPost editors monitor post performance data in real-time
5:00 PM 7:00 PM 9:00 PM 11:00 PM 1:00 AM 3:00 AM 5:00 AM 7:00 AM 9:00 AM 11:00 AM 1:00 PM 3:00 PM 5:00 PM 7:00 PM 9:00 PM 11:00 PM 5:00 PM 7:00 PM 9:00 PM 11:00 PM 1:00 AM 3:00 AM 5:00 AM 7:00 AM 9:00 AM 11:00 AM 1:00 PM 3:00 PM 5:00 PM 7:00 PM 9:00 PM 11:00 PM
Headline revised and additional pictures added in listicle format9am
2,600,000 social actions in 24 hours
Story posted at 5pm with text and link to further information5pm
“At The Huffington Post, the process doesn’t end once you hit publish; that’s when it begins”
The New York Times Digital Innovation Report 2014
Increasingly dynamic engagement enhanced real-time data imperative
1
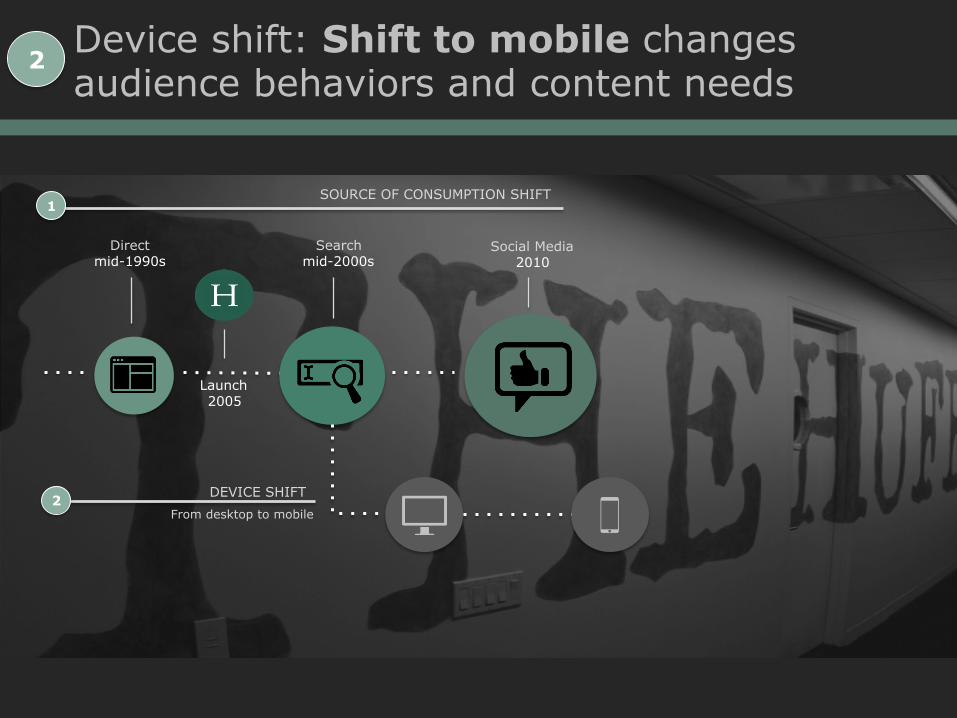
Device shift: Shift to mobile changes audience behaviors and content needs
Direct mid-1990s
Social Media 2010
Search mid-2000s
SOURCE OF CONSUMPTION SHIFT 1
Launch 2005
From desktop to mobile
DEVICE SHIFT 2
2
10
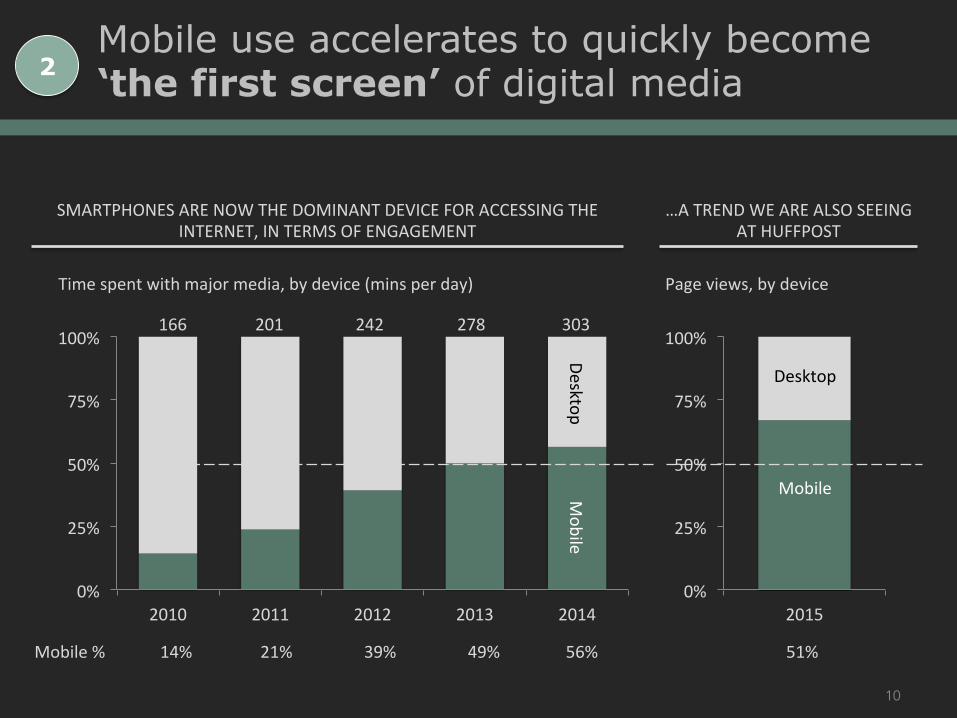
Mobile use accelerates to quickly become ‘the first screen’ of digital media 2
SMARTPHONES ARE NOW THE DOMINANT DEVICE FOR ACCESSING THE INTERNET, IN TERMS OF ENGAGEMENT
0%
25%
50%
75%
100%
2010 2011 2012 2013 2014
166
Desktop
278 242 201
Time spent with major media, by device (mins per day)
Mobile
303
Mobile % 14% 21% 39% 49% 56%
…A TREND WE ARE ALSO SEEING AT HUFFPOST
0%
25%
50%
75%
100%
2015
Desktop
Page views, by device
Mobile
51%

11
0
25
50
Changes in news consumption (mins per day)
Shid from desktop to mobile (increase in mobile)
Shid from print to online (decrease in print)
2006
(O
nlin
e)
2008
(M
obile
)
2014
(O
nlin
e)
2016
F (M
obile
)
42 39
2 5
2010
(O
nlin
e)
2012
(M
obile
)
32 36
25
31
21
27
14
24
7
20
4
15
3
11
Shid from desktop to mobile will be greater than shid from print to online at equivalent point in ^me
Shift to mobile shaping up as impactful than shift to print for audience behavior 2
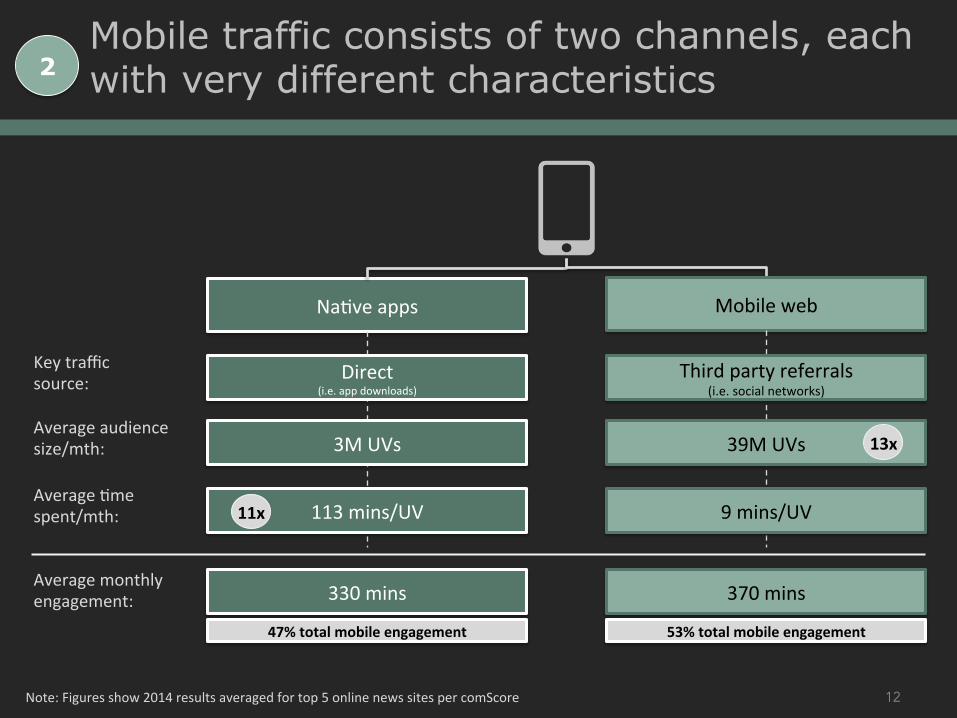
Na^ve apps
Key traffic source: Direct
(i.e. app downloads)
Average audience size/mth: 3M UVs
Average ^me spent/mth: 113 mins/UV
Average monthly engagement: 330 mins
47% total mobile engagement
12
Mobile traffic consists of two channels, each with very different characteristics
Mobile web
Third party referrals (i.e. social networks)
39M UVs
9 mins/UV
370 mins
13x
11x
53% total mobile engagement
Note: Figures show 2014 results averaged for top 5 online news sites per comScore
2
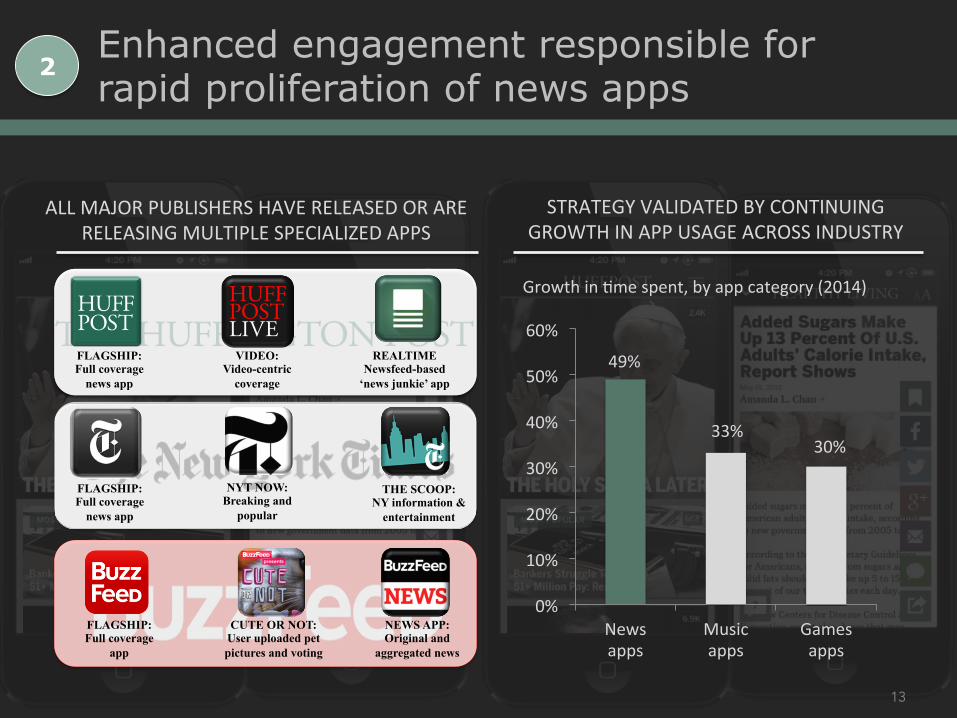
STRATEGY VALIDATED BY CONTINUING GROWTH IN APP USAGE ACROSS INDUSTRY
0%
10%
20%
30%
40%
50%
60%
News apps
Music apps
Games apps
49%
33% 30%
Growth in ^me spent, by app category (2014)
13
ALL MAJOR PUBLISHERS HAVE RELEASED OR ARE RELEASING MULTIPLE SPECIALIZED APPS
FLAGSHIP: Full coverage
news app
NYT NOW: Breaking and
popular
THE SCOOP: NY information &
entertainment
FLAGSHIP: Full coverage
app
CUTE OR NOT: User uploaded pet pictures and voting
NEWS APP: Original and
aggregated news
FLAGSHIP: Full coverage
news app
VIDEO: Video-centric
coverage
REALTIME Newsfeed-based
‘news junkie’ app
Enhanced engagement responsible for rapid proliferation of news apps
2
14
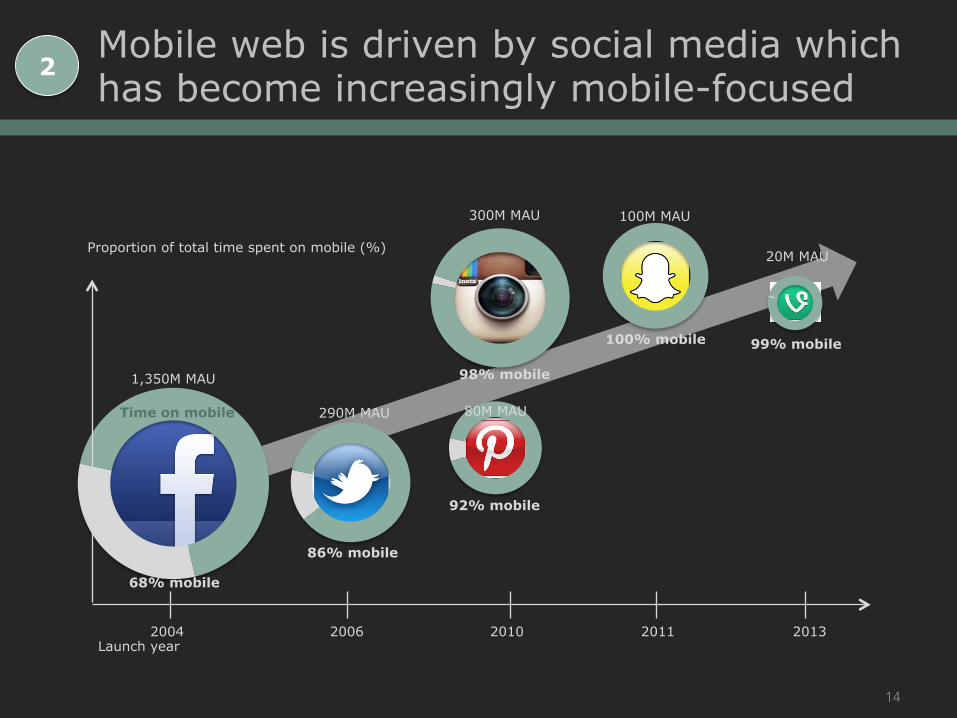
68% mobile
Time on mobile
1,350M MAU
2004 2013 2006 2010 2011
Proportion of total time spent on mobile (%)
Launch year
86% mobile
290M MAU
98% mobile
300M MAU
99% mobile
20M MAU
100% mobile
100M MAU
92% mobile
80M MAU
Mobile web is driven by social media which has become increasingly mobile-focused
2

15
To counter this, we optimized our page design to enhance engagement 2
HuffPost
“ ”
IMPROVE INTERNAL ENGAGEMENT
Be<er u=lize screen size and harness tac=le func=onality of mobile touch screen to
improve access to content
Enhanced scrolling Example: U^liza^on of con^nuous scroll
enhanced recircula^on module on scroll-‐up drives bemer engagement
Be?er swiping Example: Build on exis^ng swiping to
access bemer recircula^on modules and more content
More video Example: Enhance seamlessness of video
player on page
IMPROVE SOCIAL INTEGRATION
Tailoring content in a way that integrates our user experience deeper within social
network experience
Responsive social referral Examples: Dynamic page design to tailor content to style matching referring social media (e.g. more visual content when
coming from Pinterest)
Atomized content sharing Example: Enables users to engage with
specific parts of content to bemer personalize sharing capabili^es
Passive personalizaIon Con^nue to pair improved page func^onality with
effec^ve passive personaliza^on technology
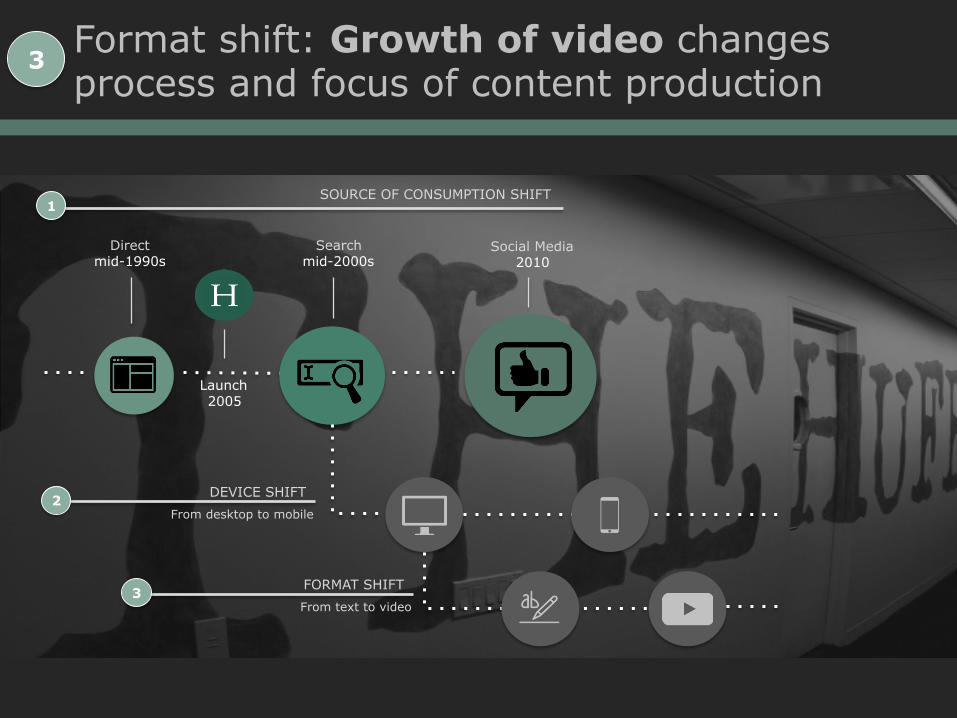
Format shift: Growth of video changes process and focus of content production
Direct mid-1990s
Social Media 2010
Search mid-2000s
SOURCE OF CONSUMPTION SHIFT 1
Launch 2005
From desktop to mobile
DEVICE SHIFT 2
From text to video
FORMAT SHIFT 3
3
17
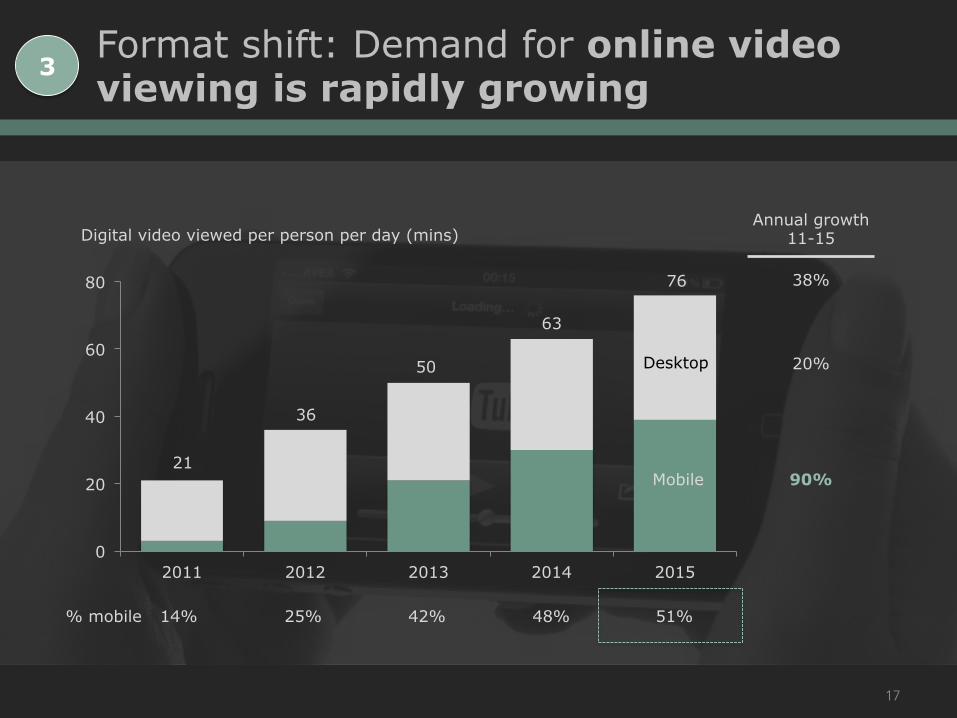
Format shift: Demand for online video viewing is rapidly growing
3
Digital video viewed per person per day (mins)
0
20
40
60
80
2011 2012 2013 2014 2015
% mobile 14% 25% 42% 48% 51%
21
36
50
63
76
Annual growth 11-15
38%
20%
90%
Desktop
Mobile

18
Format shift: greater numbers of devices provide greater access 3
Total 71% 71% 4% 6% 4%
56% of millennials ^me watching ‘TV’ is not on TV
Time spent watching TV or movies, by device
Trailing millennials
Leading millennials
Genera^on X
Baby boomers
Matures 92%
88%
76%
53%
44%
5%
8%
15%
7%
9%
4%
8%
7%
6%
23%
32%
5%
9%
8%
19
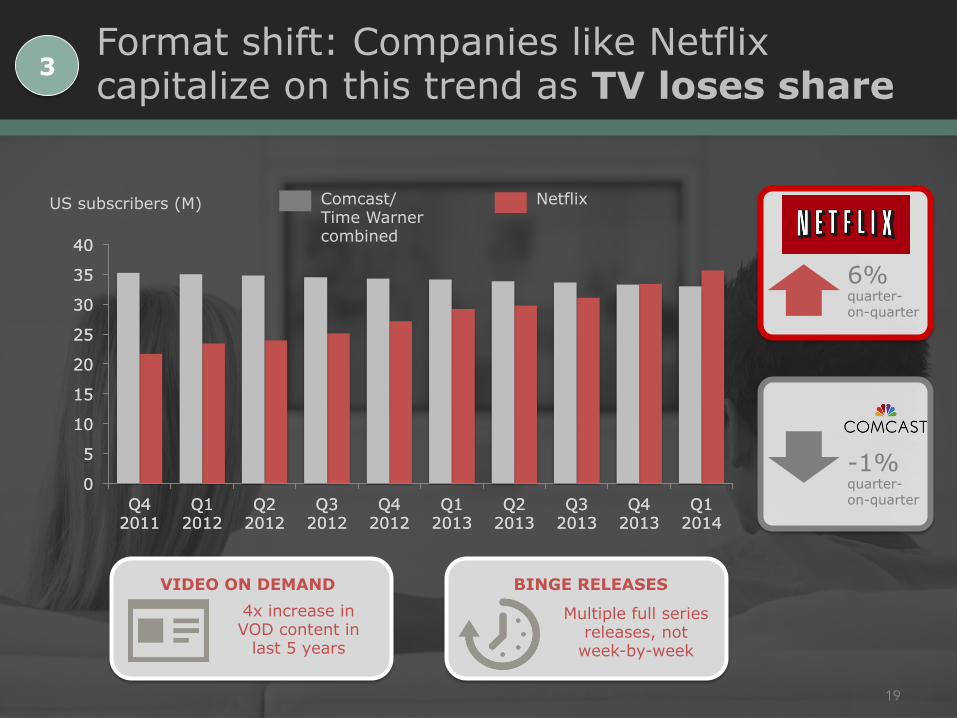
Format shift: Companies like Netflix capitalize on this trend as TV loses share 3
6% quarter-on-quarter
-1% quarter-on-quarter
Comcast/ Time Warner combined
Netflix
0
5
10
15
20
25
30
35
40
Q4 2011
Q1 2012
Q2 2012
Q3 2012
Q4 2012
Q1 2013
Q2 2013
Q3 2013
Q4 2013
Q1 2014
US subscribers (M)
0
5
10
15
20
25
30
35
40
Q4 2011
Q1 2012
Q2 2012
Q3 2012
Q4 2012
Q1 2013
Q2 2013
Q3 2013
Q4 2013
Q1 2014
VIDEO ON DEMAND 4x increase in VOD content in
last 5 years
BINGE RELEASES
Multiple full series releases, not
week-by-week

20
Supply is also expanding greatly with a new genre of ‘YouTube stars’ competing with TV 3
LOW PRODUCTION AND DISTRIBUTION COSTS FOR ‘YOUTUBE STARS’ CREATING NEW GENRE
$0
$2
$4
$6
HBO Neqlix FOX AMC MCN
Hourly cost of production ($M)
$5.0M
$4.0M $3.5M
$3.0M
$0.1M
… THESE LOW COST CREATORS ARE GETTING VIEWS AT LARGER SCALE THAN TRADITIONAL PLAYERS
0 50 100 150 200
CBS
Comcast
Fullscree
Vimeo
VEVO
Maker
Online video audiences (April 2015) M, comScore
153M
44M
43M
37M
34M
33M
30M
Driven by low-‐cost content

21
We have built video operations into three distinct tiers of video content 3
PREMIUM LICENSED CONTENT
Premium partnerships with top content producers distributed across our properties e.g. NBC Universal
USER-GENERATED CONTENT
Content generated by users and contributed to our sites e.g. Outspeak video journalism
ORIGINAL CONTENT
Live and on demand original content e.g. HuffPost Live 8 hours per day of streaming content
22
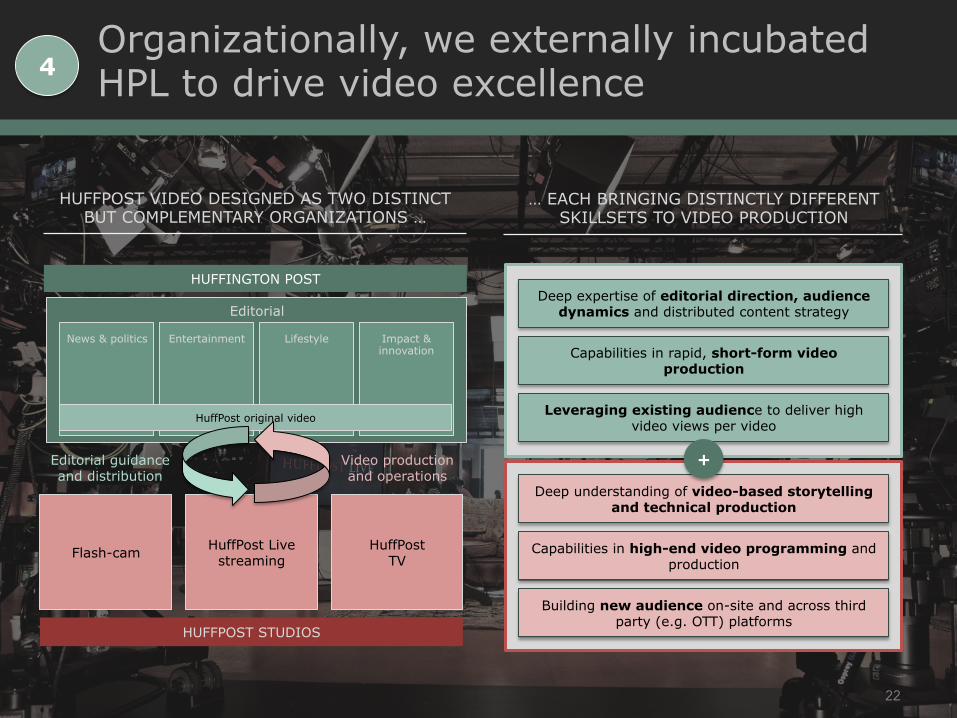
Organizationally, we externally incubated HPL to drive video excellence 4
HUFFPOST VIDEO DESIGNED AS TWO DISTINCT BUT COMPLEMENTARY ORGANIZATIONS …
HUFFINGTON POST
Editorial
News & politics Entertainment Lifestyle Impact & innovation
HuffPost original video
HUFFPOST STUDIOS
HuffPost TV Flash-cam HuffPost Live
streaming
Editorial guidance and distribution
Video production and operations
… EACH BRINGING DISTINCTLY DIFFERENT SKILLSETS TO VIDEO PRODUCTION
Deep expertise of editorial direction, audience dynamics and distributed content strategy
Leveraging existing audience to deliver high video views per video
Capabilities in rapid, short-form video production
Deep understanding of video-based storytelling and technical production
Building new audience on-site and across third party (e.g. OTT) platforms
Capabilities in high-end video programming and production
+
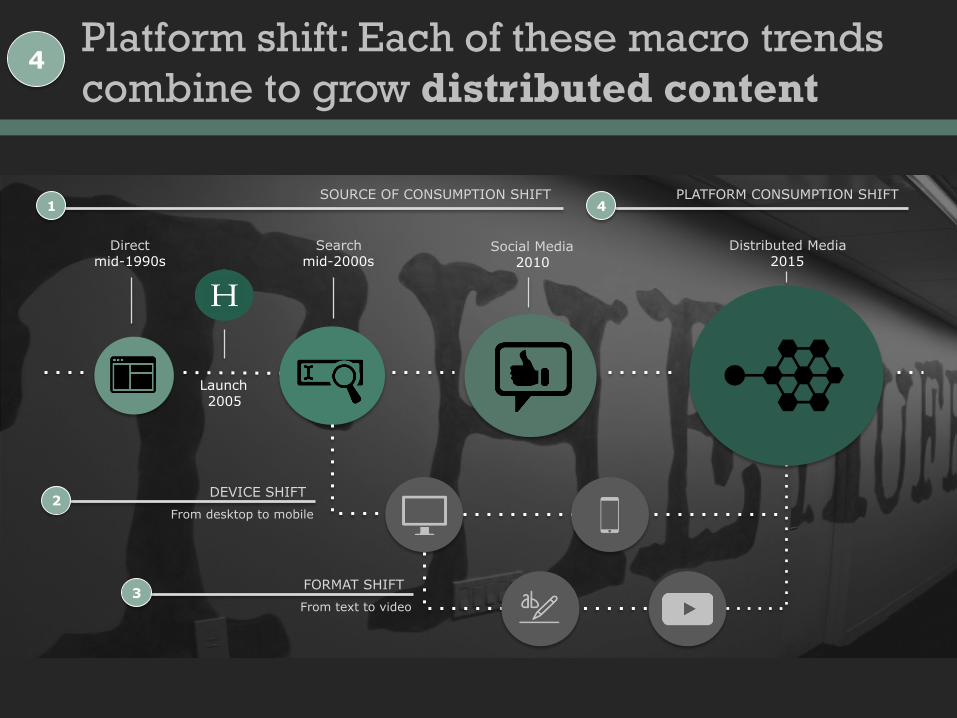
Platform shift: Each of these macro trends combine to grow distributed content
Direct mid-1990s
Social Media 2010
Search mid-2000s
SOURCE OF CONSUMPTION SHIFT 1
Launch 2005
From desktop to mobile
DEVICE SHIFT 2
From text to video
FORMAT SHIFT 3
4
PLATFORM CONSUMPTION SHIFT 4
Distributed Media 2015

Platform shift: Demographics illustrate the clear shift towards distributed content
4
0%
25%
50%
75%
100%
Baby boomers Genera^on X Leading millennials Trailing millennials
Preferred sources of media, by demographic
9% 24% 33% 51% % distributed
Distributed
Direct
More than 50% of people aged
14-‐25 find media through distributed sources
Increasing propor^on of future news audience
Source: Deloime Digital Democracy Survey

Social is the most important of distributed sources 4
…AND SOCIAL REFERRALS ARE THE LARGEST SOURCE OF TRAFFIC TO HUFFPOST
% referrals from social
~10% ~20% ~30%
0%
20%
40%
60%
80%
100%
Social
All other
Multiplatform external referrrals, by source
2013 2014 2015
SOCIAL MEDIA IS #1 ONLINE ACTIVITY, DRIVEN BY PARTICULARLY HIGH USAGE ON MOBILE…
Daily time spent on social media (mins)
29 8 21 Daily minutes on social
0%
20%
40%
60%
80%
100%
Desktop Mobile Total
Social media
News & ent’ ment
Comms
Games
Commerce Search
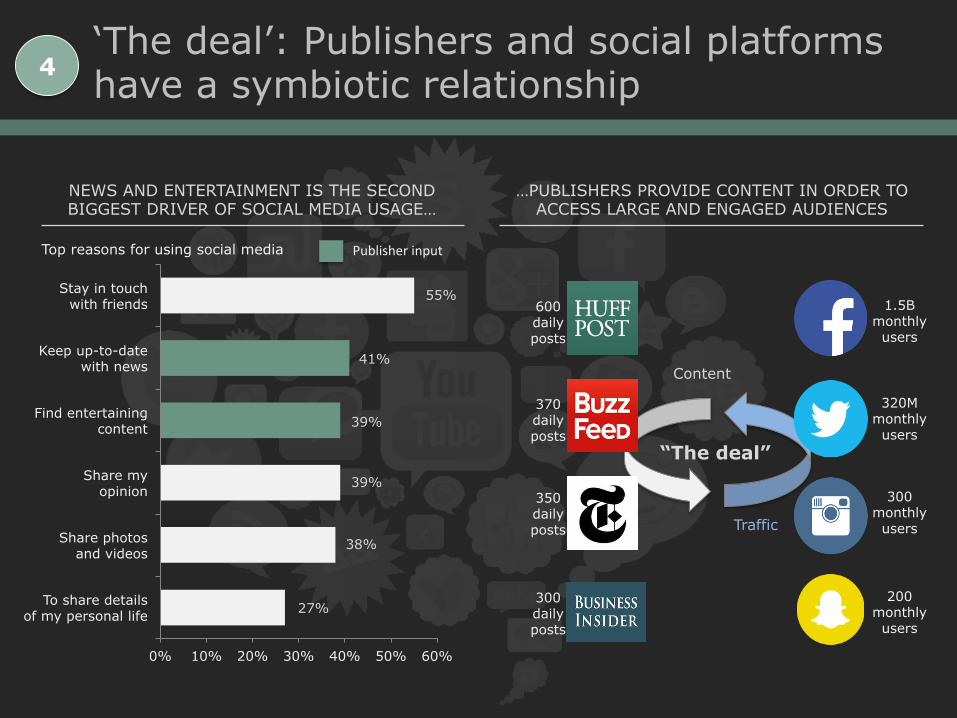
‘The deal’: Publishers and social platforms have a symbiotic relationship 4
600 daily posts
350 daily posts
370 daily posts
300 daily posts
…PUBLISHERS PROVIDE CONTENT IN ORDER TO ACCESS LARGE AND ENGAGED AUDIENCES
“The deal”
Content
Traffic
1.5B monthly
users
300 monthly
users
320M monthly
users
200 monthly
users
NEWS AND ENTERTAINMENT IS THE SECOND BIGGEST DRIVER OF SOCIAL MEDIA USAGE…
0% 10% 20% 30% 40% 50% 60%
To share details of my personal life
Share photos and videos
Share my opinion
Find entertaining content
Keep up-to-date with news
Stay in touch with friends
55%
27%
38%
39%
39%
41%
Publisher input Top reasons for using social media
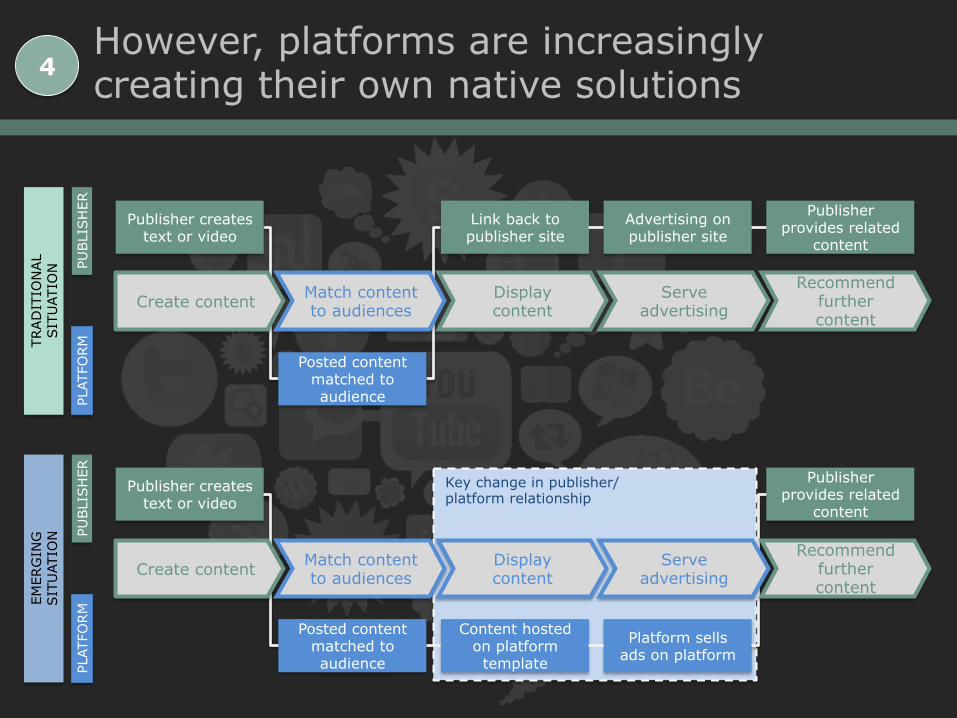
However, platforms are increasingly creating their own native solutions 4
TRAD
ITIO
NAL
SIT
UAT
ION
Publisher creates text or video
Publisher provides related
content
Advertising on publisher site
Link back to publisher site
Posted content matched to audience
PUBLI
SH
ER
PLAT
FORM
Create content Match content to audiences
Display content
Recommend further content
Serve advertising
Key change in publisher/ platform relationship
EMER
GIN
G
SIT
UAT
ION
PUBLI
SH
ER
PLAT
FORM
Publisher creates text or video
Publisher provides related
content
Platform sells ads on platform
Content hosted on platform template
Posted content matched to audience
Create content Match content to audiences
Display content
Recommend further content
Serve advertising
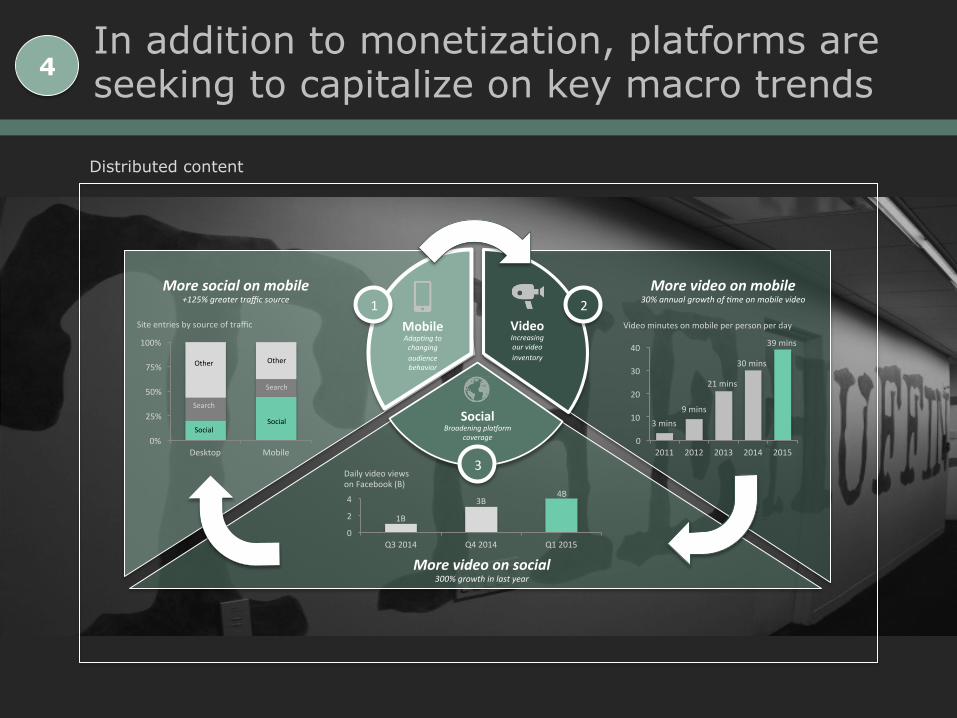
In addition to monetization, platforms are seeking to capitalize on key macro trends 4
More social on mobile +125% greater traffic source
Site entries by source of traffic
0%
25%
50%
75%
100%
Desktop Mobile
Social
Search
Other
Social
Search
Other
More video on mobile 30% annual growth of =me on mobile video
Video minutes on mobile per person per day
0
10
20
30
40
2011 2012 2013 2014 2015
3 mins 9 mins
21 mins
30 mins
39 mins
0
2
4
Q3 2014 Q4 2014 Q1 2015
Daily video views on Facebook (B)
1B
3B 4B
More video on social 300% growth in last year
2Video Increasing our video inventory
3
Social Broadening plaKorm
coverage
1Mobile Adap=ng to changing audience behavior
Distributed content
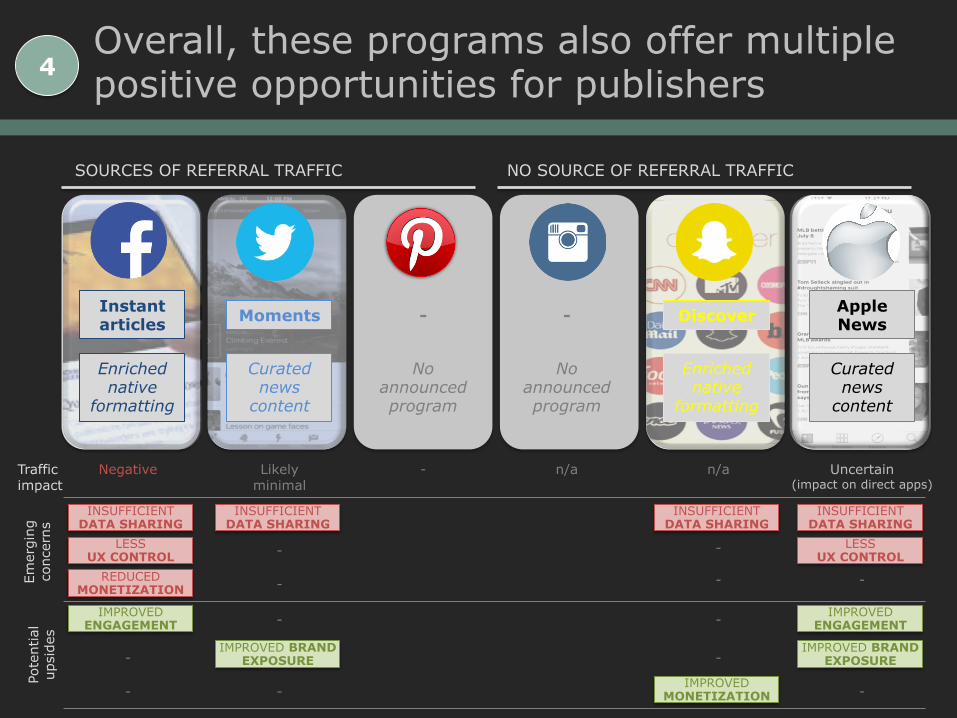
Overall, these programs also offer multiple positive opportunities for publishers 4
SOURCES OF REFERRAL TRAFFIC
Instant articles Moments -
Enriched native
formatting
Curated news
content
No announced program
NO SOURCE OF REFERRAL TRAFFIC
- Discover Apple News
No announced program
Enriched native
formatting
Curated news
content
Traffic impact
Negative Likely minimal
n/a Uncertain (impact on direct apps)
- n/a
Emer
ging
co
ncer
ns
Pote
ntia
l up
side
s
INSUFFICIENT DATA SHARING
LESS UX CONTROL
REDUCED MONETIZATION
INSUFFICIENT DATA SHARING
LESS UX CONTROL
INSUFFICIENT DATA SHARING
INSUFFICIENT DATA SHARING
IMPROVED ENGAGEMENT
IMPROVED BRAND EXPOSURE
IMPROVED MONETIZATION
IMPROVED BRAND EXPOSURE
IMPROVED ENGAGEMENT
-
-
-
- -
- -
-
-
-
-
-
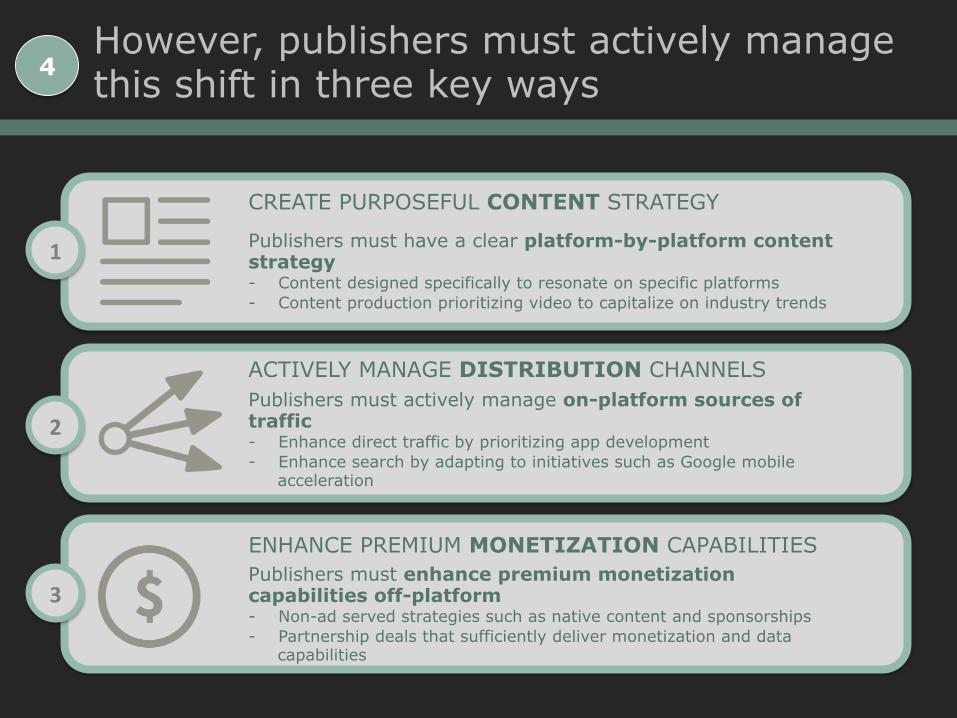
However, publishers must actively manage this shift in three key ways 4
CREATE PURPOSEFUL CONTENT STRATEGY
Publishers must have a clear platform-by-platform content strategy - Content designed specifically to resonate on specific platforms - Content production prioritizing video to capitalize on industry trends
1
ACTIVELY MANAGE DISTRIBUTION CHANNELS Publishers must actively manage on-platform sources of traffic - Enhance direct traffic by prioritizing app development - Enhance search by adapting to initiatives such as Google mobile
acceleration
2
ENHANCE PREMIUM MONETIZATION CAPABILITIES Publishers must enhance premium monetization capabilities off-platform - Non-ad served strategies such as native content and sponsorships - Partnership deals that sufficiently deliver monetization and data
capabilities
3

Ultimately this is an extension of the evolution we have seen in online media 4
Print newspapers
Shift to online (Desktop)
Shift to mobile
Shift to distributed
2000s- 2010- 2015-
Sub-standard response to industry shift
• Replicate print paper online
• Replicate desktop site on mobile
• Replicate on-platform content across channels
More successful response • Innovate to enhance audience interaction (i.e. comments), adjust editorial processes and content for different style of audience engagement
• Innovate to enhance content and page functionality capabilities for different devices
• Innovate to tailor content and monetization strategy on a platform-by-platform basis

HuffPost success is due to its adaptation to each stage of the media evolution
Direct mid-1990s
Social Media 2010
Search mid-2000s
Launch 2005
SOURCE OF CONSUMPTION SHIFT 1
PLATFORM CONSUMPTION SHIFT 4
From desktop to mobile
DEVICE SHIFT 2
From text to video
FORMAT SHIFT 3
Distributed Media 2015 Prioritize technology in
order to monitor and improve performance in
real time
1
Product innovation
adapt to fundamental changes in audience behavior
2
Organizational innovation to help accelerate new production 3
Emphasize partnerships
to adapt to changing market
dynamics
4

Thank you
Jimmy Maymann
President, Content and Consumer ���
Brands, AOL
@maymann


