Sources:
1) CT MUS (Cameron and Trivedi, Microeconometrics Using Stata)
2) CT (Cameron and Trivedi, Microeconometrics)
3) Wooldridge-Introductory Econometrics
Reading data into Stata and examining data
From CT MUS (Cameron and Trivedi, Microeconometrics Using Stata)
desc
gen ltot =ln(totexp)
summarize (can be abbreviated as ‘sum’; for example: ‘sum posexp’)
summarize p*
list if in 1/10, clean
list suppins phylim
tabulate (can be abbreviated as ‘tab’: for example: ‘tab posexp’)
tab income if income<=0
sum totexp, detail
table female totchr
table female totchr suppins
tabulate female suppins, row col
table female, contents(N totchr mean totchr sd totchr p50 totchr)
table female suppins, contents(N totchr mean totchr sd totchr p50 totchr)
tabstat totexp ltotexp, stat (count mean)
tabstat totexp ltotexp, stat (count mean) col(stat)

Notation and Conventions (from CT)

Linear Regression (Ch 3 in in CT MUS)
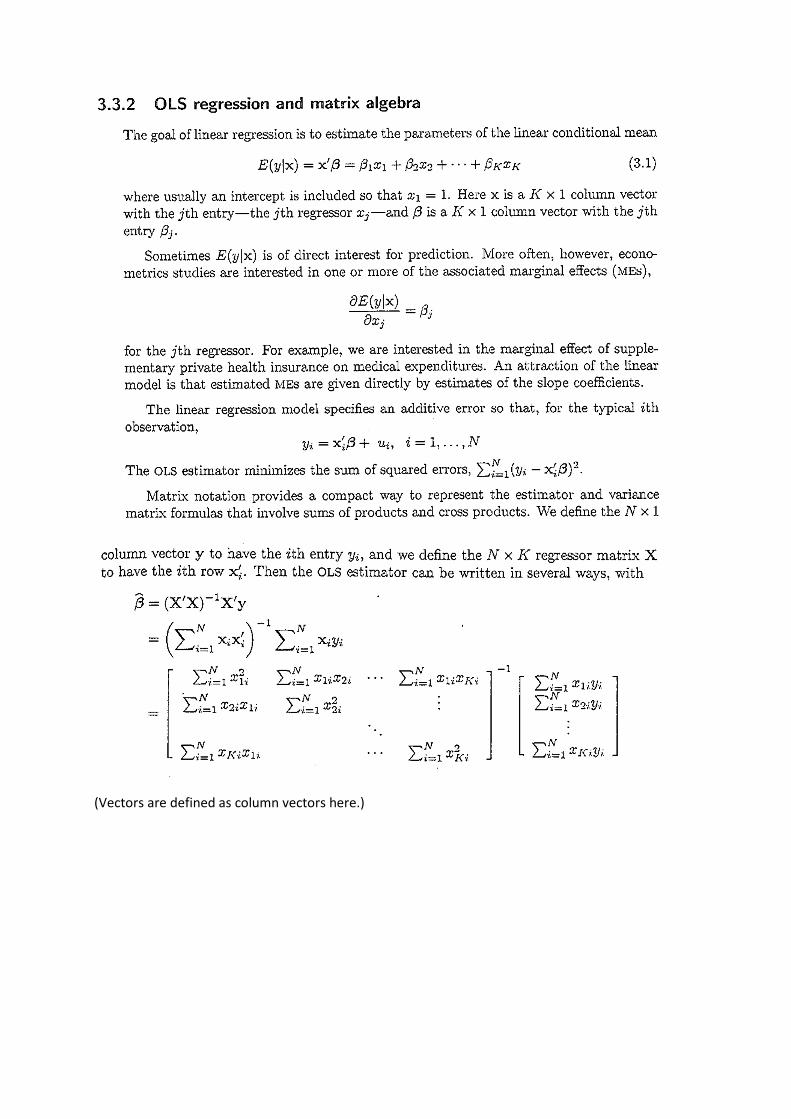
(Vectors are defined as column vectors here.)


*********** Run the following regression in Stata: ****************
reg ltotexp suppins phylim actlim totchr age female income, robust

test phylim = actlim


Note: If a random variable 𝑿~𝑵(𝝁, 𝝈𝟐), then Y = exp(X) lognormal. 𝑬(𝒀) = 𝒆𝒙𝒑(𝝁 +𝟏
𝟐𝝈𝟐).
Note: If you need to run a regression but do not need the output to be displayed, use:
quietly regress y x1 x2 .....

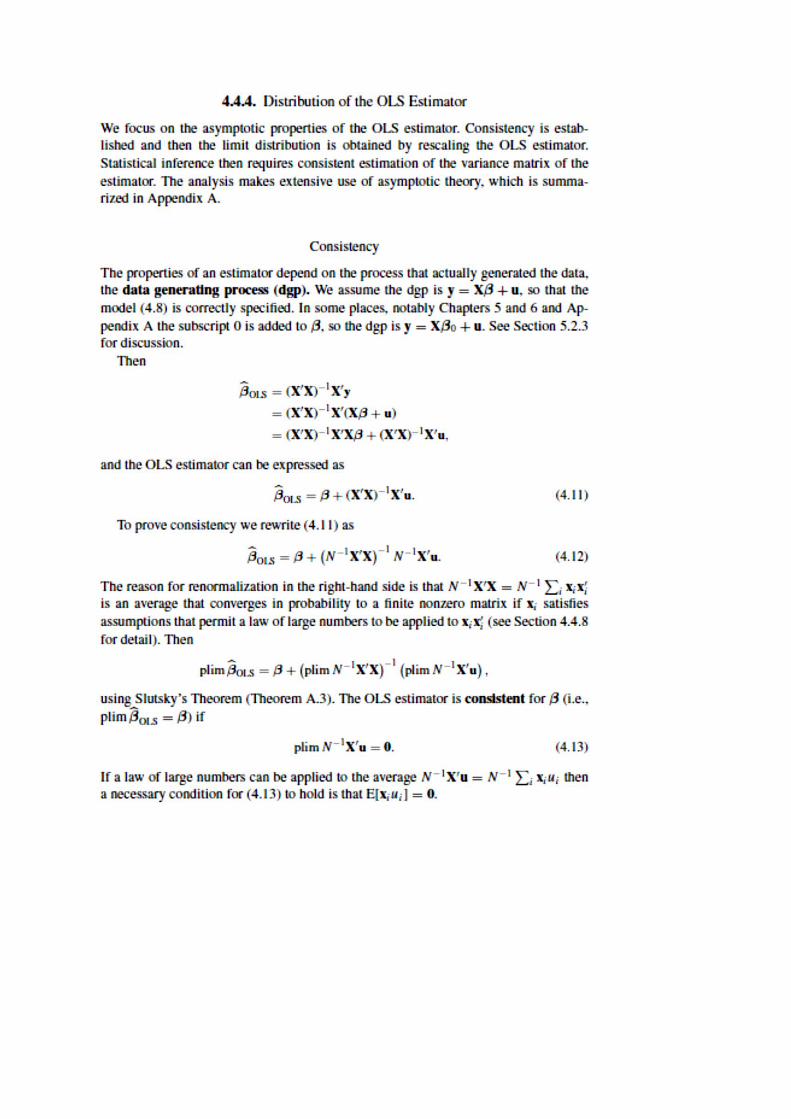
Linear Regression ( Ch 4 in CT )