Download - real time-PCR

real-time PCR ( qPCR )
Technique & Applications
BY: AQEEL NAFEA
osmania university
BIOCHEMISTRY
sem. IV
1007-13-514-005
21-2-2015

PCR … Technology evolution
1 - Traditional PCR
- - Reverse Transcription – PCR ( RT-PCR )
2 - Quantitative real-time PCR ( Q-PCR )

Q-PCR( qPCR) = Quantitative real-time PCR
But Not = Reverse Transcription - PCR (RT-PCR)
First, We must know
My advice to you
- write it always with .. small letter .. to avoid confusion
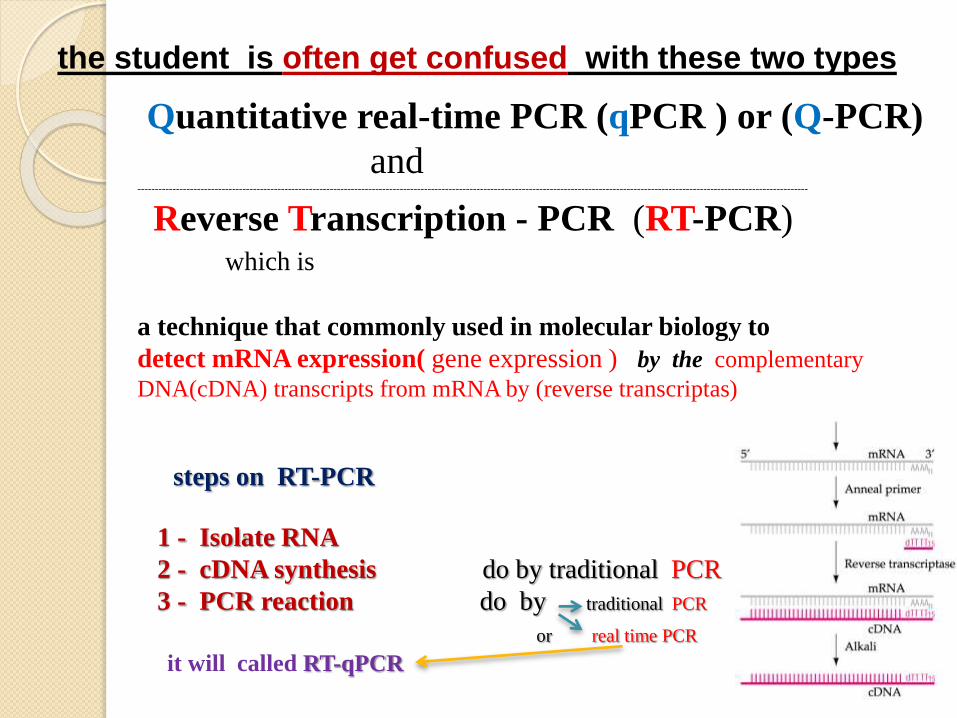
the student is often get confused with these two types
Quantitative real-time PCR (qPCR ) or (Q-PCR)
and------------------------------------------------------------------------------------------------------------------------------------------------------------------------------------------------
Reverse Transcription - PCR (RT-PCR) which is
a technique that commonly used in molecular biology to
detect mRNA expression( gene expression ) by the complementary
DNA(cDNA) transcripts from mRNA by (reverse transcriptas)
steps on RT-PCR
1 - Isolate RNA
2 - cDNA synthesis do by traditional PCR
3 - PCR reaction do by traditional PCR
or real time PCR
it will called RT-qPCR
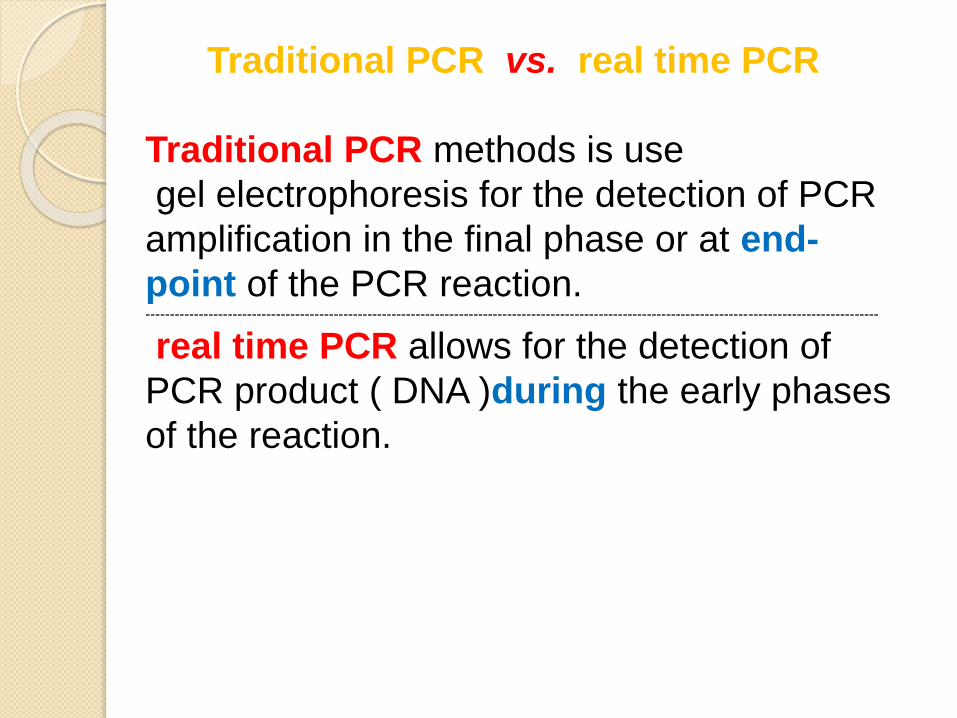
Traditional PCR vs. real time PCR
Traditional PCR methods is use
gel electrophoresis for the detection of PCR
amplification in the final phase or at end-
point of the PCR reaction.--------------------------------------------------------------------------------------------------------------------------------------------------------
real time PCR allows for the detection of
PCR product ( DNA )during the early phases
of the reaction.
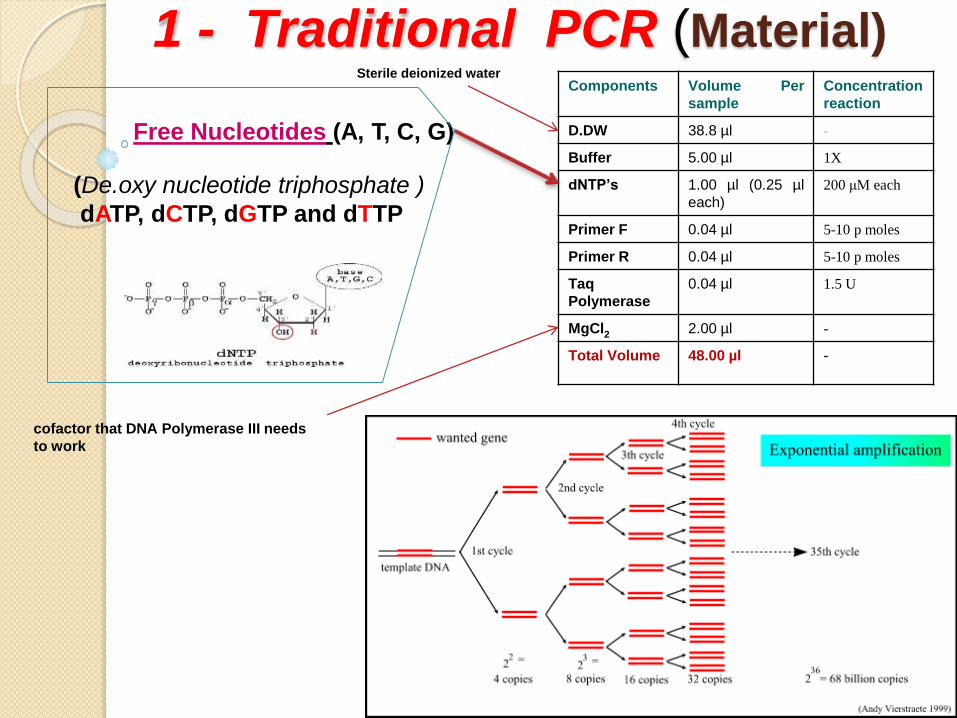
1 - Traditional PCR (Material)Components Volume Per
sample
Concentration
reaction
D.DW 38.8 µl -
Buffer 5.00 µl 1X
dNTP’s 1.00 µl (0.25 µl
each)
200 μM each
Primer F 0.04 µl 5-10 p moles
Primer R 0.04 µl 5-10 p moles
Taq
Polymerase
0.04 µl 1.5 U
MgCl2 2.00 µl -
Total Volume 48.00 µl -
Free Nucleotides (A, T, C, G)
(De.oxy nucleotide triphosphate )
dATP, dCTP, dGTP and dTTP
Sterile deionized water
cofactor that DNA Polymerase III needs
to work

Steps of Traditional PCR
Denaturation:
This step is the first regular cycling event and consists of heating the reaction to 94–98 °C
Annealing
The reaction temperature is lowered to 45–60 °C for primer attachment
Extension/elongation:
At 72 °C for taq plymerase
Final elongation:


2 - Quantitative real-time PCR ( Q-PCR )
real-time PCR instruments consist of two main components:
1. Thermal Cycler ( PCR machine )
2. Optical Module ( to detect the fluorescence in the tubes during the run of DNA amplification )

Types of real-time PCR (Q-PCR )
dependent on types of the Dye
1 - Hydrolyzation based Assays
• TaqMan
Beacons
2 - DNA-binding agents
* SYBR Green
Application of Q-PCR
real-time PCR, is used for many applications,,, including
-- gene expression analysis,
-- microRNA analysis,
-- single nucleotide polymorphism (SNP) genotyping,
-- copy number variation (CNV) analysis,
-- and even protein analysis.
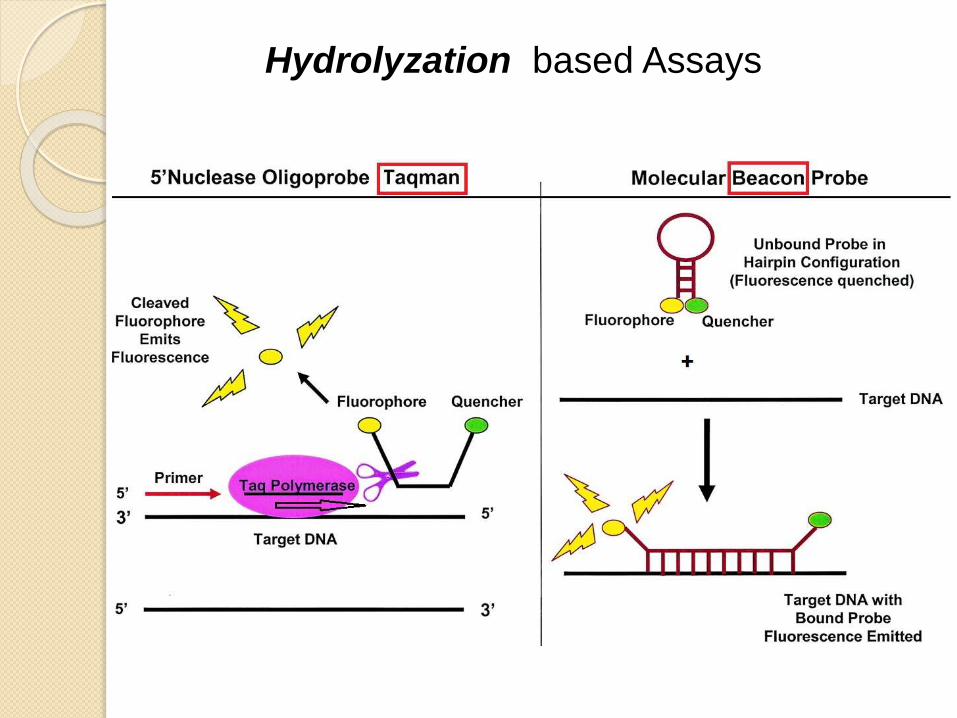
Hydrolyzation based Assays

Double- Dye Oligonucleotides -TaqMan
or Dual labeled probes- Beacon
Consists of a ssDNA probe that is complemenatry to one of the ampliconstrands
A fluorophore is attached to one end of the probe and a quencher to the other end.
Hydrolyzation Probes

detector

SYBR green
DNA-binding agents
It is used as a dye for the quantification of double stranded DNA in some methods of quantitative PCR
It is also used to visualise DNA in gel electrophoresis
detector

TaqMan vs. SYBR
GreenTaqMan Probe
Advantages:
Increased specificity
Use when the most accuratequantitation of PCR productaccumulation is desired.
Option of detecting multiplegenes in the same well(multiplexing).
------------------------------------Disadvantages:
Relative high cost of labeledprobe.
SYBR Green
Advantages:
Relative low cost ofprimers.
No fluorescent-labeledprobes required.
------------------------
Disadvantages:
Less specific
Not possible tomultiplex multiple genetargets.


How Real-Time PCR Works
To understand how real-time PCR works, let’s start by examining a sample
amplification plot
-- In this plot, the PCR cycle number is shown on the x-axis,
and the fluorescence from the amplification reaction,is shown on the y-
axis.
… which is proportional to the amount of amplified product in the tube,
The amplification plot shows two phases, an exponential phase followed by
a nonexponential plateau phase.
- During the exponential phase, the amount of PCR product approximately
doubles in each cycle. As the reaction proceeds, however, reaction
components are consumed, and ultimately one or more of the components
becomes limiting. At this point, the reaction slows and enters the plateau
phase (cycles 28–40 in Figure 1.1).
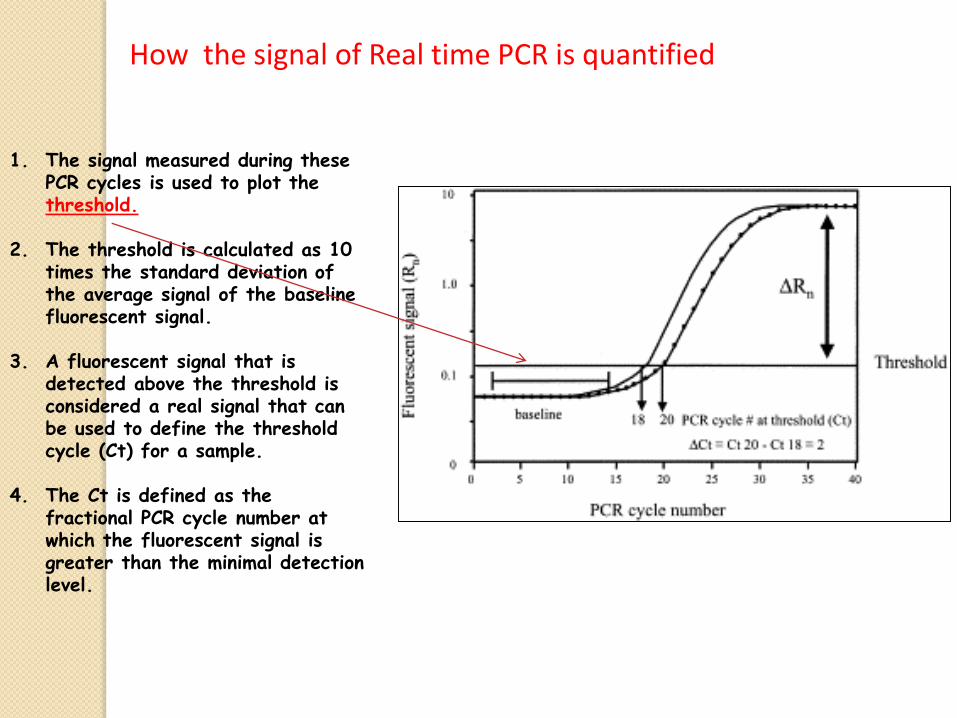
1. The signal measured during these PCR cycles is used to plot the threshold.
2. The threshold is calculated as 10 times the standard deviation of the average signal of the baseline fluorescent signal.
3. A fluorescent signal that is detected above the threshold is considered a real signal that can be used to define the threshold cycle (Ct) for a sample.
4. The Ct is defined as the fractional PCR cycle number at which the fluorescent signal is greater than the minimal detection level.
How the signal of Real time PCR is quantified

Designing primers
Look at public data bases first:
◦ Rt primer DB: htpp://medgen.ugent.be/rtprimerdb
◦ Primer bank htpp://pga.mgh.harvard.edu/primerbank/index. Html
◦ Real-time primers set(http://www.realtimeprimers.org
If you found your probe and primers:
–Then input the sequences into blast http://www.ncbi.nlm.nih.gov–Examine the sequences for possible errors, polymorphisms and avoid these regions for primer or probe design. –Avoid direct repeat in the target sequences: hybridization to alternative site in repetitive regions results in non productive binding of primers, a reduction in the efficiency of DNA amplification.
-When possible use a primer sequence in boundaries between two exons separated by along introns : no need for DNAase treatment due to genomic contamination. -try to have a short amplicon as possible (60 to 150 bp) with GC content of 60 % or less to ensure efficient denaturation.-Choose primer that target mille of your target gene