RealworldenergyuseprojectionsforVFEM
Suite1-6,D72Building,72DominionRoad,MtEden,Auckland1024,+6496291435www.emissionimpossible.co.nz
RealworldenergyuseprojectionsforVFEM
Reportpreparedfor
MinistryofTransport
byJayneMetcalfe&SurekhaSridharEmissionImpossibleLtd
5September2016
RealworldenergyuseprojectionsforVFEM
Page|i
ContentsGlossary ii
Summary iv
1 Introduction 11.1 Objectivesandscope 11.2 Methodology 21.3 Reportlayout 2
2 Benchmarkingandliteraturereview 32.1 Benchmarking 32.2 Literaturereview:fuelefficiencyprojections 7
3 Methodology:realworldenergyconsumptionprojections 143.1 Lightdutyvehicles:baseyear 143.2 Lightdutyvehicles:projections 153.3 Heavydutyvehicle:baseyear 163.4 Heavydutyvehicle:projections 16
4 Results 18
5 Conclusionsandrecommendations 20
References 21Appendix1 23
RealworldenergyuseprojectionsforVFEM
Page|ii
Glossary
Term Definition
BEV Abatteryelectricvehicleuseselectricmotorsinsteadofinternalcombustionengines(ICEs)forpropulsionusingpowerprovidedbyrechargeablebatterypacks.
CO2 Carbondioxideisagreenhousegas
GVM Grossvehiclemassisthemaximumallowedweightofthevehiclewhenloaded.LightvehicleshaveaGVMof4tonnesorless.HeavyvehicleshaveaGVMofmorethan4tonnes.
HCV Heavycommercialvehicles
HEV Ahybridelectricvehicleintegratesasmallbatteryandanelectricmotortoenhancetheenergytodistanceefficiencyoftheinternalcombustionengine.Thebattery’schargeismaintainedbytheinternalcombustionengineandregenerativebraking-itcannotbechargedbypluggingintoanelectricalsupply.Hybridscanoffergreaterfueleconomythanatraditionalinternalcombustionenginebutcanonlytravelveryshortdistancesonelectricpoweronly.
ICCT InternationalCouncilonCleanTransportation
ICE Aninternalcombustionengineisanenginepoweredthroughtheburningoffossilfuels.Theterm'ICE'isoftenusedasshorthandforanyvehiclepoweredbyaninternalcombustionengine,whetherpetrolordieseloranyotherflammablemedium.
IEA InternationalEnergyAgency
kWh Akilowatthouristheamountofenergyreleasedifworkisdoneataconstantrateof1kilowatt(kW)foronehour.ElectriccarbatterycapacityismeasuredinkWh.
LCV Lightcommercialvehiclesincludingvans,utesandverylighttruckslessthan4000kgGVM
LPV LightpassengervehiclesincludingpassengercarsandSUV’s
NEDC NewEuropeanDrivingCycleisthecurrenttestcyclefortypeapprovaloflightdutyvehicleemissions
PHEV Aplug-inhybridelectricvehicleisatypeofvehiclethathasabatterypackthatcanbechargedupbypluggingintoaregularelectricitysupply.InthisreportPHEVincludesvehiclesthatareconfiguredlikearegularhybrid,aswellasvehiclesthatuseanelectricmotorforpropulsionbutalsohaveaninternalcombustionengineonboardtoprovidepowerfor
RealworldenergyuseprojectionsforVFEM
Page|iii
agenerator.Thesearesometimescalledrangeextendedelectricvehicles(REEV)
REEV Arangeextendedelectricvehicleisavehicleasvehiclesthatuseanelectricmotorforpropulsionbutalsohaveaninternalcombustionengineonboardtoprovidepowerforagenerator,whichmaintainsaminimumchargelevelonthebattery.REEVscanbepluggedinandchargedup.REEVsdonotusethepetrol/dieselenginetodirectlypowerthewheels.InthisreportREEVsareincludedinthePHEVscategory.
SUV Sportsutilityvehicle
WLTP WorldHarmonisedLightVehiclesTestProcedureisanewtype-approvaltestprocedureforlightdutyvehicleswhichisexpectedtobeadoptedinEuropeandJapan.
RealworldenergyuseprojectionsforVFEM
Page|iv
Summary ThisreportprovidesprojectionsofrealworldfuelandenergyconsumptionfortheMinistryofTransport(MoT)VehicleFleetEmissionsModel.Theserealworldfactorsareintendedtorepresenttheaveragefuelconsumptionper100kmofnewvehiclessoldinagivenyear.Thesefactorsrepresentaveragefuelconsumptionofvehiclesoperatingintherealworldunderalldifferentdrivingconditionsacrossalldifferentvehicleswithintheclassification.
RealworldfuelconsumptionfactorsfordieselandpetrolICE(internalcombustionengine)vehiclesinNewZealandhavebeenestimatedbyMoTusingfuelconsumptionandtraveldatafromalargedatasetoffuelcardtransactions1.
WehavecomparedNewZealand’srealworldandtypeapprovalfuelconsumptiontrendswithinternationaltrends.ThiscomparisonfoundthataveragefuelconsumptionfornewlightdutyvehiclesinNewZealandishighercomparedwithEuropeandJapan,howevertrendsaresimilar.
ToensurethatrealworldfuelconsumptionfactorsareconservativeandrelevanttoNewZealand,wehavecalculatedallfuelconsumptionfiguresforothervehicletypesandforallprojectionyearsrelativetoMoTrealworldfactorsforNewZealand.
TheMoTrealworldfactorsunderpintheanalysisinthisreport.WerecommendthattheMoTanalysisofrealworldfuelconsumptionisregularlyupdatedandthattheanalysisisextendedtoincludeprivatelyownedvehiclesifpossible.
WehavedevelopedrealworldfuelandenergyconsumptionprojectionfactorsforNewZealandbasedontheresultsofaninternationalliteraturereview.Weestimatethatrealworldfuelconsumptionfrompetrolanddiesellightdutyvehiclesislikelytoreducebyapproximately18%and15%respectivelybetween2016and2030.Forheavydutyvehiclesweestimatethatrealworlddieselconsumptionislikelytoreducebyapproximately5%forsmalltrucksand13%forlargetrucksbetween2016and2030.Theseprojectedimprovementsinfuelandenergyconsumptionare:
• technicallyfeasible
• costeffective
• reasonablyconservative
Howevertheseprojectionsgowellbeyondcurrentregulatorytimeframessotheyareinherentlyuncertain.Werecommendthattheprojectionsareregularlyreviewedandupdated.
1 FuelusefactorsforthisprojectwereprovidedbyMinistryofTransport,includingfactorsforlightdutyvehicles(Wangetal.,2015)andunpublishedfactorsforheavydutyvehicles.
RealworldenergyuseprojectionsforVFEM
Page|1
1 Introduction
1.1 Objectivesandscope
TheMinistryofTransport(MoT)isredevelopingtheVehicleFleetEmissionsModel(VFEM)toincludemanymorepotentialfuelandvehiclecombinations.ThismodelisusedbyMoTtopredictNewZealand’senergyuseoutto2040.ThecurrentenergyusefactorsintheVFEMaredoingareasonablejobofpredictingenergyusefortheperiod2001-2014.
MoThascommissionedaliteraturereview(asopposedtoanyrealworldtesting)onthelikelyefficiencygainsthatmightbeexpectedinvehiclesmanufacturedineachoftheyears2016to2040,forthefollowingenergytypes:
1. Conventionalpetrol
2. Conventionaldiesel
3. Hybridpetrol
4. Hybriddiesel
5. LPG/CNG
6. Plug-inhybrid-Petrol
7. Plug-inhybrid-Diesel
8. Batteryelectric
Thesefuelscanapplytothefollowingvehicletypes:
• Lightpassenger(carsandSUVS)splitintofivebandsbasedonenginesize(cc)(<1350,1350-1599,1600-1999,2000-2999,≥3000)
• Lightcommercial(vansandutes)splitintofivebandsbasedonenginesize(cc)(<1350,1350-1599,1600-1999,2000-2999,≥3000)
• Motorcycles/mopedsinsplitintotwoenginesize(cc)bands(<60,≥60)
• Truckssplitintoninebandsbasedongrossvehiclemass(kg)(<5000,5000-7499,7500-9999,10000-11999,12000-14999,15000-19999,20000-24999,25000-29999,≥30,000)
• Busessplitintothreebandsbasedongrossvehiclemass(kg)(3501-7000,7001-12000,≥12001)
Thisprojecthasproducedaverageenergyusefactorsfrom2014to2040,fortheenergyandvehiclecombinationsthatareincludedininternationalprojections.Someenergyandvehiclecombinationsarenotincludedininternationalprojectionsbecausetheyarenotconsideredcosteffectiveortechnicallyfeasible(forexamplepetroltrucksandbuses).

RealworldenergyuseprojectionsforVFEM
Page|2
1.2 Methodology
Theprojectcomprisedthreeparts:
1. Benchmarkingandinternationalliteraturereview
2. Analysis
3. Reporting
Thisreportbrieflydescribeskeyassumptionsanddatasources.Theuncertaintyinprojectionsisalsodiscussed.Inadditiontothisreportthereisanexcelspreadsheetwhichincludesallrawdata,detailedassumptions,andcalculations.
1.3 Reportlayout
Thisreportisstructuredasfollows:
• Section2ofsummarisestheresultsofourbenchmarkingandinternationalliteraturereviewonrealworldfuelconsumption.
• Section3brieflydescribeskeythemethodologyincludingassumptionsanddatasources.
• Section4summarisestheresultsofouranalysis.
• Section5provideskeyconclusions.
RealworldenergyuseprojectionsforVFEM
Page|3
2 Benchmarkingandliteraturereview
Thischaptercomprisestwomainparts:
• BenchmarkingoffuelconsumptionandtrendstodeterminewhetherinternationalrealworldfuelconsumptionfactorsandprojectionscanbeapplieddirectlytoNewZealand.
• Literaturereviewtoidentifyinternationalrealworldfuelconsumptionprojectionsandtounderstandtheuncertaintyassociatedwiththese.
2.1 Benchmarking
Fueleconomytrends:typeapprovalvalues
NewZealanddoesnothavefueleconomystandardsforvehiclesenteringthefleetanddoesnothaveanydomesticvehiclemanufacturers.Thismeansthatthefueleconomyofvehiclesenteringthefleetdependsoninternationalrequirementsandtrends.
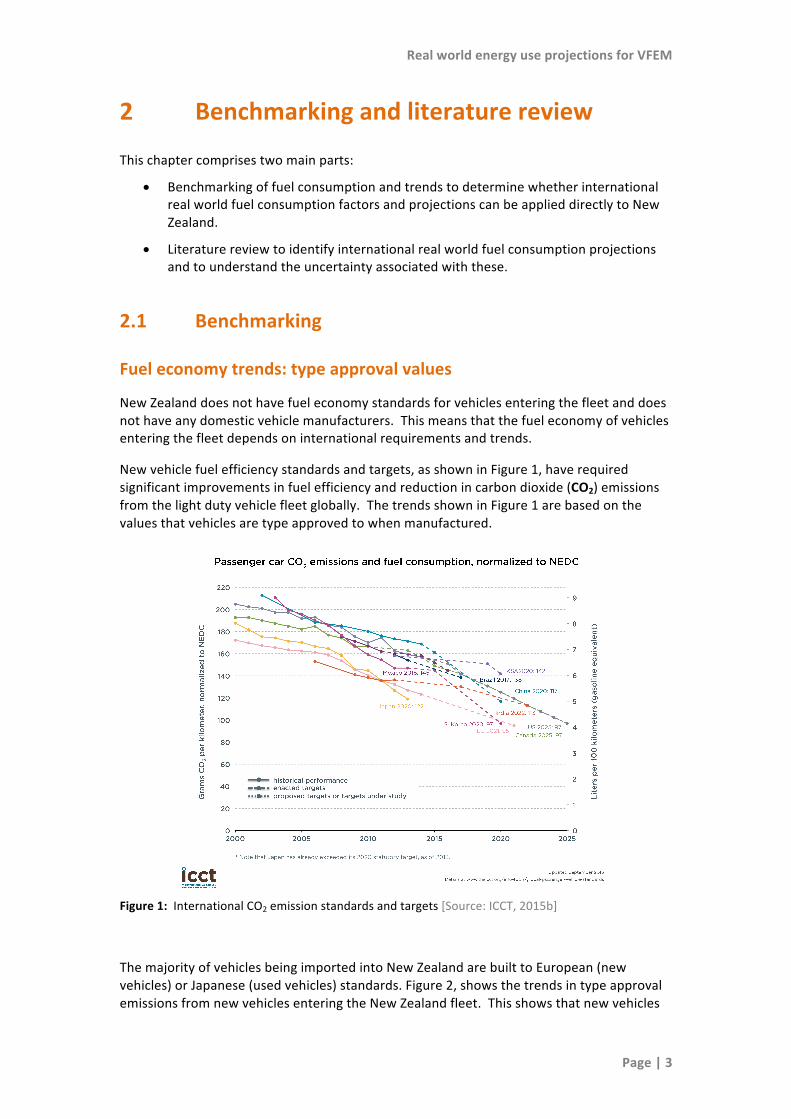
Newvehiclefuelefficiencystandardsandtargets,asshowninFigure1,haverequiredsignificantimprovementsinfuelefficiencyandreductionincarbondioxide(CO2)emissionsfromthelightdutyvehiclefleetglobally.ThetrendsshowninFigure1arebasedonthevaluesthatvehiclesaretypeapprovedtowhenmanufactured.
Figure1:InternationalCO2emissionstandardsandtargets[Source:ICCT,2015b]
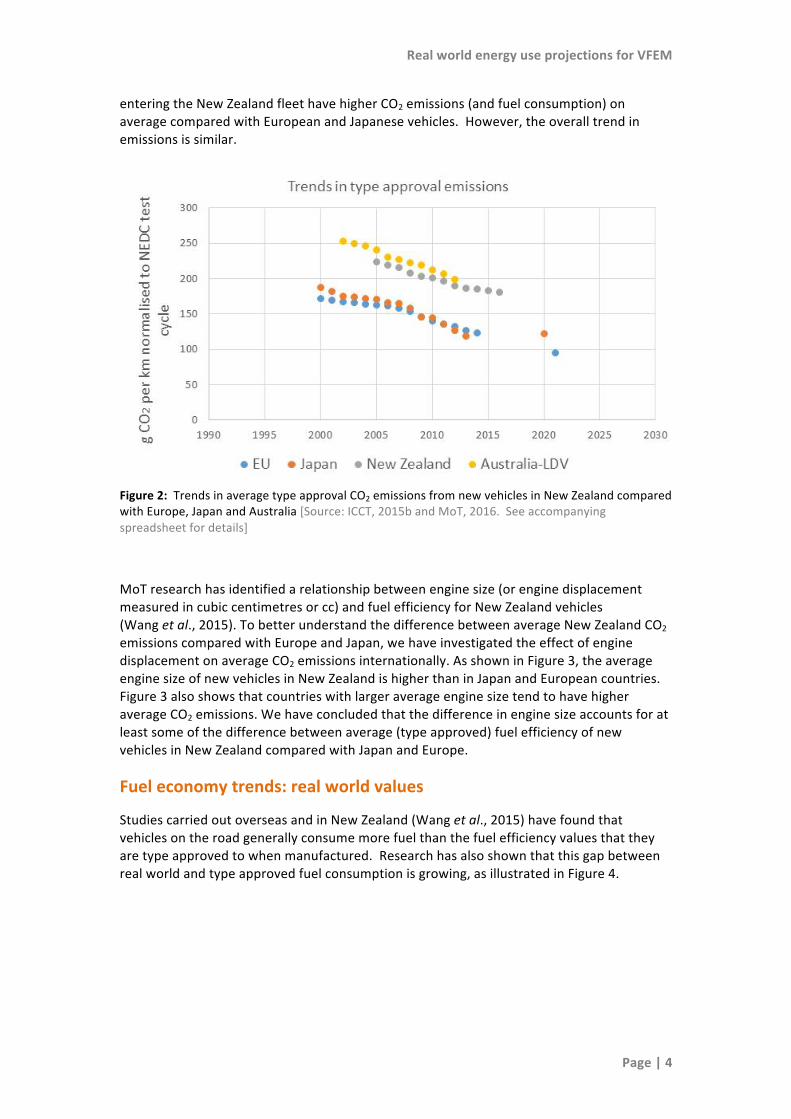
ThemajorityofvehiclesbeingimportedintoNewZealandarebuilttoEuropean(newvehicles)orJapanese(usedvehicles)standards.Figure2,showsthetrendsintypeapprovalemissionsfromnewvehiclesenteringtheNewZealandfleet.Thisshowsthatnewvehicles
RealworldenergyuseprojectionsforVFEM
Page|4
enteringtheNewZealandfleethavehigherCO2emissions(andfuelconsumption)onaveragecomparedwithEuropeanandJapanesevehicles.However,theoveralltrendinemissionsissimilar.
Figure2:TrendsinaveragetypeapprovalCO2emissionsfromnewvehiclesinNewZealandcomparedwithEurope,JapanandAustralia[Source:ICCT,2015bandMoT,2016.Seeaccompanyingspreadsheetfordetails]
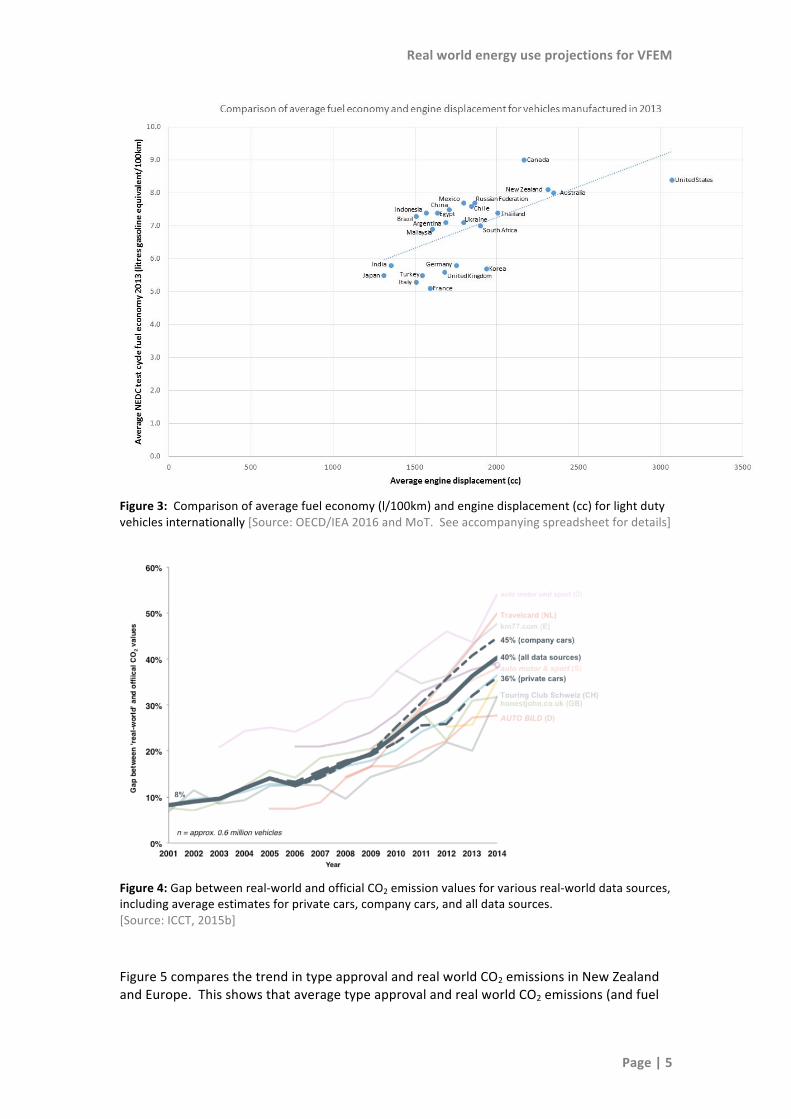
MoTresearchhasidentifiedarelationshipbetweenenginesize(orenginedisplacementmeasuredincubiccentimetresorcc)andfuelefficiencyforNewZealandvehicles(Wangetal.,2015).TobetterunderstandthedifferencebetweenaverageNewZealandCO2emissionscomparedwithEuropeandJapan,wehaveinvestigatedtheeffectofenginedisplacementonaverageCO2emissionsinternationally.AsshowninFigure3,theaverageenginesizeofnewvehiclesinNewZealandishigherthaninJapanandEuropeancountries.Figure3alsoshowsthatcountrieswithlargeraverageenginesizetendtohavehigheraverageCO2emissions.Wehaveconcludedthatthedifferenceinenginesizeaccountsforatleastsomeofthedifferencebetweenaverage(typeapproved)fuelefficiencyofnewvehiclesinNewZealandcomparedwithJapanandEurope.
Fueleconomytrends:realworldvalues
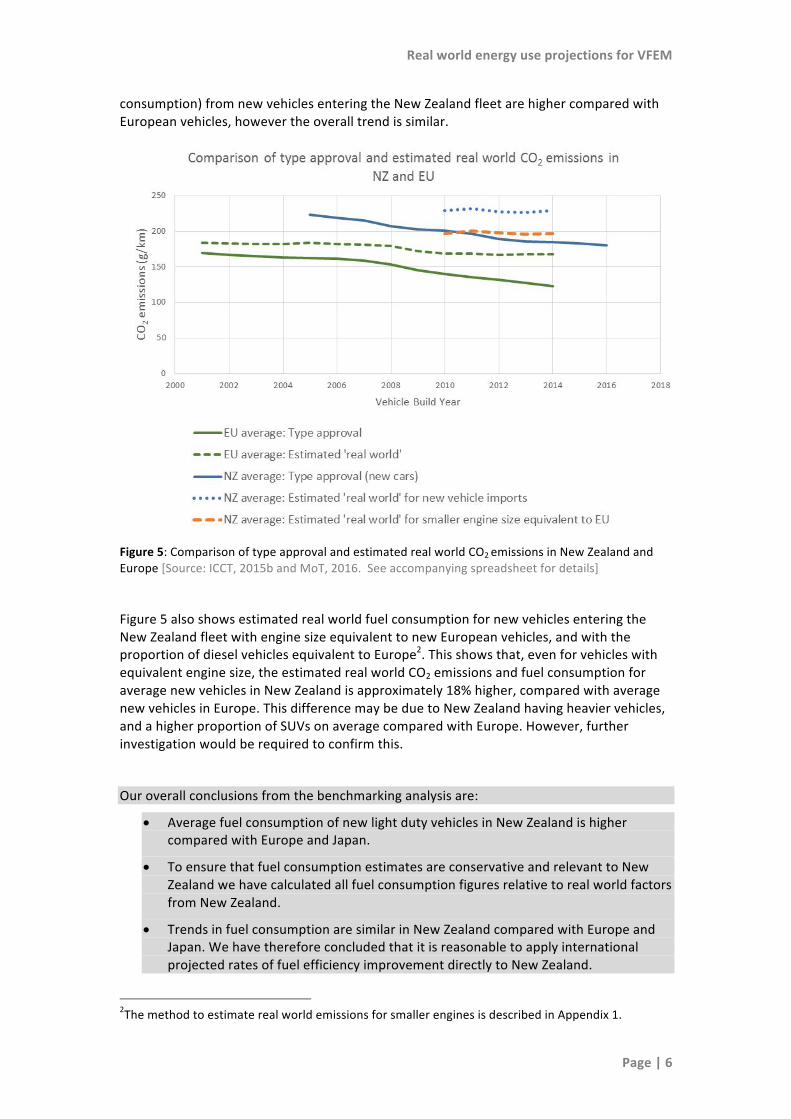
StudiescarriedoutoverseasandinNewZealand(Wangetal.,2015)havefoundthatvehiclesontheroadgenerallyconsumemorefuelthanthefuelefficiencyvaluesthattheyaretypeapprovedtowhenmanufactured.Researchhasalsoshownthatthisgapbetweenrealworldandtypeapprovedfuelconsumptionisgrowing,asillustratedinFigure4.
RealworldenergyuseprojectionsforVFEM
Page|5
Figure3:Comparisonofaveragefueleconomy(l/100km)andenginedisplacement(cc)forlightdutyvehiclesinternationally[Source:OECD/IEA2016andMoT.Seeaccompanyingspreadsheetfordetails]
Figure4:Gapbetweenreal-worldandofficialCO2emissionvaluesforvariousreal-worlddatasources,includingaverageestimatesforprivatecars,companycars,andalldatasources.[Source:ICCT,2015b]
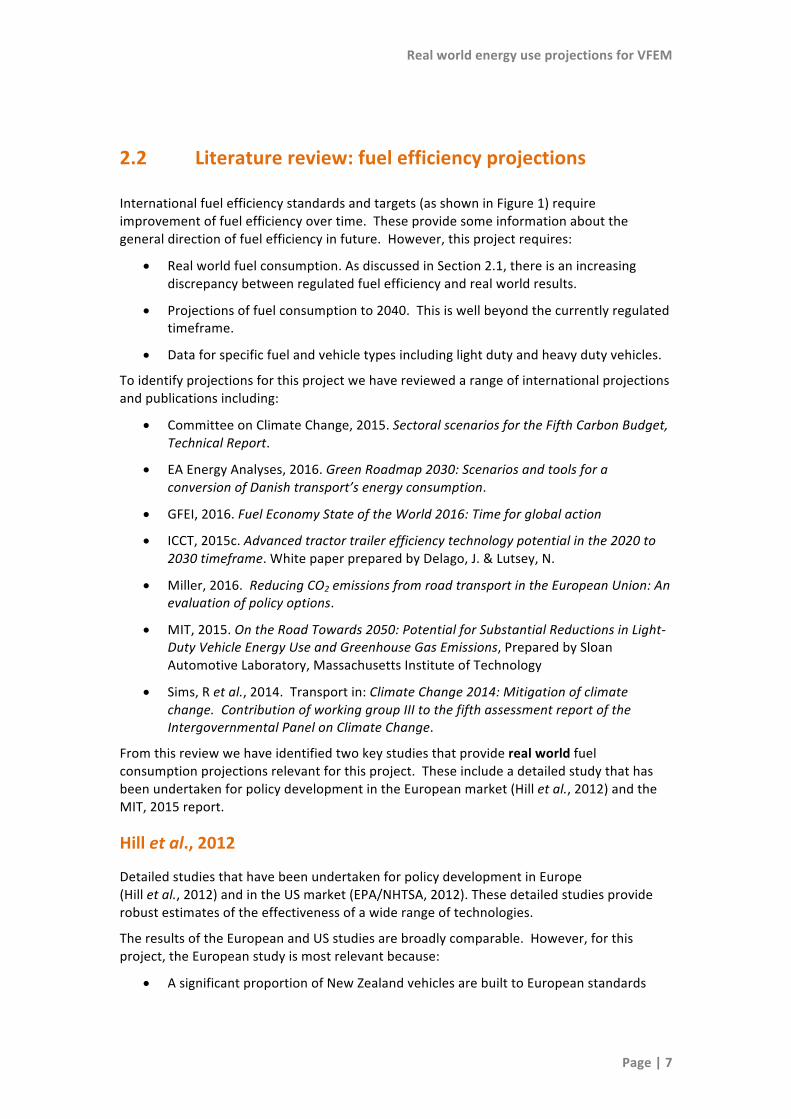
Figure5comparesthetrendintypeapprovalandrealworldCO2emissionsinNewZealandandEurope.ThisshowsthataveragetypeapprovalandrealworldCO2emissions(andfuel
RealworldenergyuseprojectionsforVFEM
Page|6
consumption)fromnewvehiclesenteringtheNewZealandfleetarehighercomparedwithEuropeanvehicles,howevertheoveralltrendissimilar.
Figure5:ComparisonoftypeapprovalandestimatedrealworldCO2emissionsinNewZealandandEurope[Source:ICCT,2015bandMoT,2016.Seeaccompanyingspreadsheetfordetails]
Figure5alsoshowsestimatedrealworldfuelconsumptionfornewvehiclesenteringtheNewZealandfleetwithenginesizeequivalenttonewEuropeanvehicles,andwiththeproportionofdieselvehiclesequivalenttoEurope2.Thisshowsthat,evenforvehicleswithequivalentenginesize,theestimatedrealworldCO2emissionsandfuelconsumptionforaveragenewvehiclesinNewZealandisapproximately18%higher,comparedwithaveragenewvehiclesinEurope.ThisdifferencemaybeduetoNewZealandhavingheaviervehicles,andahigherproportionofSUVsonaveragecomparedwithEurope.However,furtherinvestigationwouldberequiredtoconfirmthis.
Ouroverallconclusionsfromthebenchmarkinganalysisare:
• AveragefuelconsumptionofnewlightdutyvehiclesinNewZealandishighercomparedwithEuropeandJapan.
• ToensurethatfuelconsumptionestimatesareconservativeandrelevanttoNewZealandwehavecalculatedallfuelconsumptionfiguresrelativetorealworldfactorsfromNewZealand.
• TrendsinfuelconsumptionaresimilarinNewZealandcomparedwithEuropeandJapan.WehavethereforeconcludedthatitisreasonabletoapplyinternationalprojectedratesoffuelefficiencyimprovementdirectlytoNewZealand.
2ThemethodtoestimaterealworldemissionsforsmallerenginesisdescribedinAppendix1.
RealworldenergyuseprojectionsforVFEM
Page|7
2.2 Literaturereview:fuelefficiencyprojections
Internationalfuelefficiencystandardsandtargets(asshowninFigure1)requireimprovementoffuelefficiencyovertime.Theseprovidesomeinformationaboutthegeneraldirectionoffuelefficiencyinfuture.However,thisprojectrequires:
• Realworldfuelconsumption.AsdiscussedinSection2.1,thereisanincreasingdiscrepancybetweenregulatedfuelefficiencyandrealworldresults.
• Projectionsoffuelconsumptionto2040.Thisiswellbeyondthecurrentlyregulatedtimeframe.
• Dataforspecificfuelandvehicletypesincludinglightdutyandheavydutyvehicles.
Toidentifyprojectionsforthisprojectwehavereviewedarangeofinternationalprojectionsandpublicationsincluding:
• CommitteeonClimateChange,2015.SectoralscenariosfortheFifthCarbonBudget,TechnicalReport.
• EAEnergyAnalyses,2016.GreenRoadmap2030:ScenariosandtoolsforaconversionofDanishtransport’senergyconsumption.
• GFEI,2016.FuelEconomyStateoftheWorld2016:Timeforglobalaction
• ICCT,2015c.Advancedtractortrailerefficiencytechnologypotentialinthe2020to2030timeframe.WhitepaperpreparedbyDelago,J.&Lutsey,N.
• Miller,2016.ReducingCO2emissionsfromroadtransportintheEuropeanUnion:Anevaluationofpolicyoptions.
• MIT,2015.OntheRoadTowards2050:PotentialforSubstantialReductionsinLight-DutyVehicleEnergyUseandGreenhouseGasEmissions,PreparedbySloanAutomotiveLaboratory,MassachusettsInstituteofTechnology
• Sims,Retal.,2014.Transportin:ClimateChange2014:Mitigationofclimatechange.ContributionofworkinggroupIIItothefifthassessmentreportoftheIntergovernmentalPanelonClimateChange.
Fromthisreviewwehaveidentifiedtwokeystudiesthatproviderealworldfuelconsumptionprojectionsrelevantforthisproject.TheseincludeadetailedstudythathasbeenundertakenforpolicydevelopmentintheEuropeanmarket(Hilletal.,2012)andtheMIT,2015report.
Hilletal.,2012
DetailedstudiesthathavebeenundertakenforpolicydevelopmentinEurope(Hilletal.,2012)andintheUSmarket(EPA/NHTSA,2012).Thesedetailedstudiesproviderobustestimatesoftheeffectivenessofawiderangeoftechnologies.
TheresultsoftheEuropeanandUSstudiesarebroadlycomparable.However,forthisproject,theEuropeanstudyismostrelevantbecause:
• AsignificantproportionofNewZealandvehiclesarebuilttoEuropeanstandards
RealworldenergyuseprojectionsforVFEM
Page|8
• TheEuropeanreport(Hilletal.,2012)providesprojectionsto2050whereastheUSstudyextendsto2025
• TheHilletal.,2012reportprovidesestimatedrealworldfuelconsumption
TheHilletal.,2012analysishasrecentlybeenreviewedandupdatedonbehalfoftheEuropeanCommission,butdetailedresultshavenotyetbeenpublished(GFEI,2016).TheUKCommitteeonClimateChangehasincorporatedtheupdatedanalysisintheir2015scenarioassessment(CommitteeonClimateChange,2015).AccordingtotheCommitteeonClimatechange(2015)report:
• Conventionalcarefficiencycouldfeasiblyimprovebyaround37%onarealworldbasisbetween2010and2030.ThisissimilartotheHilletal.,2012estimate.
• Theaverageabatementcostsofconventionalvehicleefficiencyimprovementishigherthanpreviousestimates,mainlyreflectingtheincreasedgapbetweenreal-worldandtest-cycleemissionsandlowerprojectedfuelprices.
• Theestimatedconventionalvehicleefficiencyimprovementsin2030arecost-effectiverelativetotheaveragecarbonvalueprojectedoverthelifetimeofanewvehiclein2030.Improvingtheefficiencyofconventionalvehiclesisalow-regretsmeasureandisincludedinalloftheCommitteeonClimateChangeprojections.
• UpdatedprojectionsforPHEVandBEVssuggestthattherearemoreopportunitiestoimproverealworldefficiencycomparedwithpreviousestimates.UpdatedprojectionsforimprovementoftheenergyefficiencyofPHEVsandBEVsareslightlymoreoptimisticcomparedtotheHilletal.,2012study.
• Thereislittlenewevidenceonefficiencyofheavygoodsvehicles.ClimateChangeCommittee2015projectionsforheavygoodsvehiclesarebasedontheHilletal.,2012study.
WeconcludethattheHilletal.,2012studyprovidesarobustassessmentofthepotentialreductioninrealworldfuelconsumptionforawiderangeoftechnologies.Theprojectedreductionsareconsideredcosteffective.However,theprojectionsgowellbeyondregulatedrequirementssothereisconsiderableuncertaintyabouttheextentthatthesereductionswillactuallybeachieved.
MIT,2015
TheMIT,2015reportprovidesa“realisticbutaggressive”scenarioforimprovementoflightdutyvehiclefuelefficiency.Theauthorsconfirmthatitisappropriatetoapplytheprojectionsgloballystatingthat:
therelativevaluesandhowtheychange,arecloselycomparablefordifferentsizesandtypesofvehiclesinthevariousmajorworldregions,withsimilarassumptionsaboutthetechnologiesinvolvedandhowtheycombineandprogress.This“self-similar”characteristicisnotexact,but,giventheuncertaintiesinvolved,itisusuallyanappropriateassumption.
The“realisticbutaggressive”factorsaredescribedasneitheroverlyoptimisticorpessimistic.Thefactorsare:
• intendedtorepresenttheaveragenewvehiclesoldinanygivenyear(notthebest)
• basedonengineeringanalysisaswellasjudgements
RealworldenergyuseprojectionsforVFEM
Page|9
• generatedexpectingthatpoliciesandregulationswillpushthedevelopmentoffueleconomybutnotincludingdemandspecificpolicies
• basedontheassumptionthatpetroleumpriceswillcontinuetorisegradually,butwillnotbecomereallyhighoverthenextfewdecades
Somekeyassumptionsinclude:
• vehiclesizeisheldconstantacrossdifferentpropulsiontechnologiesandovertime
• vehicleweightisreducedby15%by2030,andanadditional15%by2050
• 10%improvementinaccelerationtimeto2030,taperingofftonofurtherimprovementby2050
• vehiclecontent(features)andauxiliaryloadswillincreaseovertimefollowingrecenthistory
Overallthefactorsresultinanimprovementofaround1.5%to2%compoundedwhichisroughly30%to50%betterthanthehistoricalrecord.
WeconcludethattheMIT2015studyprovidesanassessmentofpotentialreductioninrealworldfuelconsumptionfromlightdutyvehiclesthatincorporatesrealisticassumptionsandisinternationallyapplicable.
Comparisonofprojections:lightdutyvehicles
Toassesstheconservatismofprojectionswehavecomparedtheresultsforlightdutyvehiclesfromthreeprojectionsasfollows:
1. TheEuropeanstudy(Hilletal.,2012),whichprovidesprojectionsoftechnicallyfeasibleandcosteffectiveimprovementsinenergyconsumptionto2050
2. A“realisticbutaggressive”scenariofromMIT,2015whichprojectsenergyconsumptionto2050
3. A2010projectionfromtheMinistryofEnvironmentofJapanwhichispublishedintheMIT,2015report.TheMIT,2015reportjudgestheJapaneseprojectionas“conservative”.ThisJapaneseprojectiongoesto2030andhasbeenextrapolatedbyMITtoprovideaconservativeprojectionto2050.
ForpetrolanddieselICEsthecomparisonisshowninFigures6and7.
RealworldenergyuseprojectionsforVFEM
Page|10
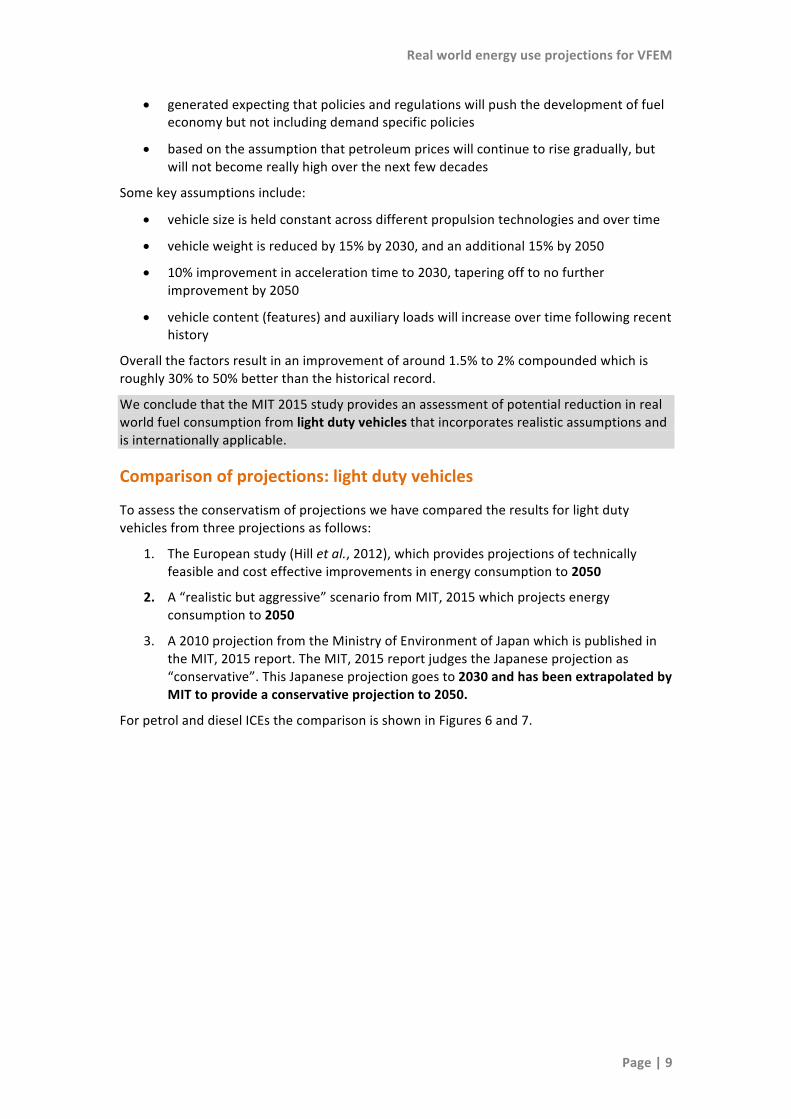
Figure6:Comparisonofprojectedfuelconsumptionrelativeto2010forlightdutypetrolICE
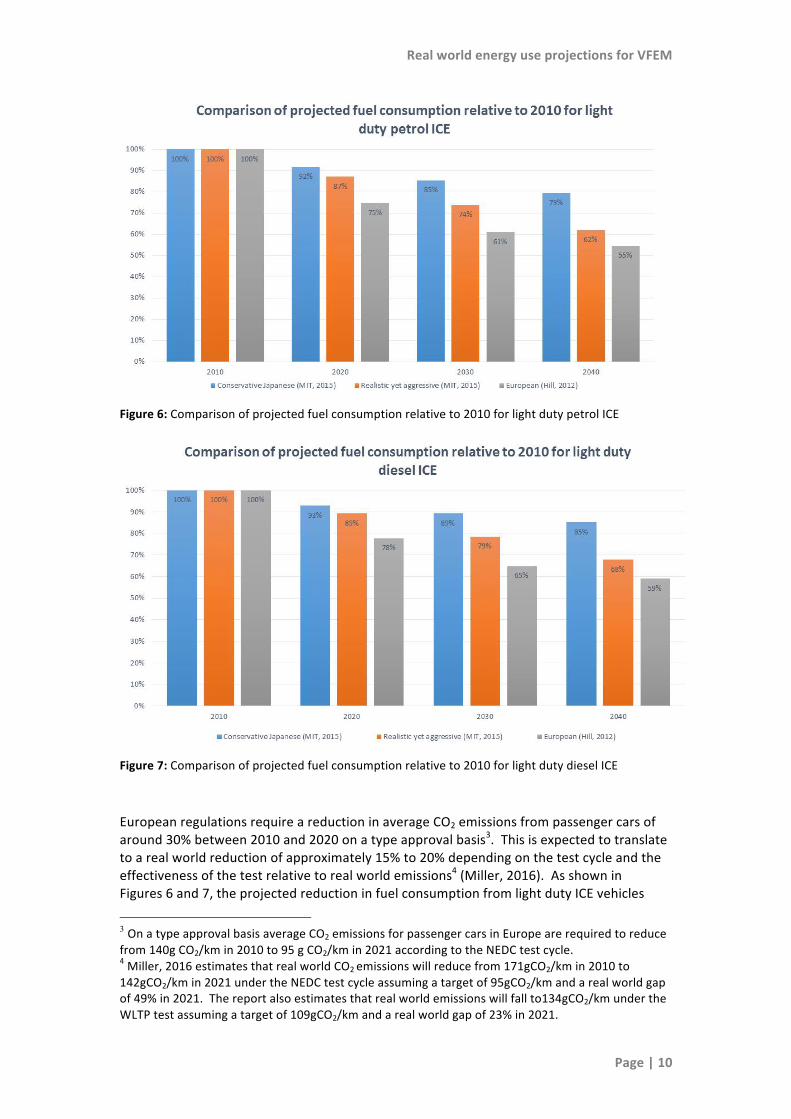
Figure7:Comparisonofprojectedfuelconsumptionrelativeto2010forlightdutydieselICE
EuropeanregulationsrequireareductioninaverageCO2emissionsfrompassengercarsofaround30%between2010and2020onatypeapprovalbasis3.Thisisexpectedtotranslatetoarealworldreductionofapproximately15%to20%dependingonthetestcycleandtheeffectivenessofthetestrelativetorealworldemissions4(Miller,2016).AsshowninFigures6and7,theprojectedreductioninfuelconsumptionfromlightdutyICEvehicles
3 OnatypeapprovalbasisaverageCO2emissionsforpassengercarsinEuropearerequiredtoreducefrom140gCO2/kmin2010to95gCO2/kmin2021accordingtotheNEDCtestcycle.4Miller,2016estimatesthatrealworldCO2emissionswillreducefrom171gCO2/kmin2010to142gCO2/kmin2021undertheNEDCtestcycleassumingatargetof95gCO2/kmandarealworldgapof49%in2021.Thereportalsoestimatesthatrealworldemissionswillfallto134gCO2/kmundertheWLTPtestassumingatargetof109gCO2/kmandarealworldgapof23%in2021.
RealworldenergyuseprojectionsforVFEM
Page|11
between2010and2020rangesfrom25%accordingtoHilletal.,to13%accordingtoMIT2015,and8%accordingtotheJapanesegovernment2010projection.
RelativetothecurrentlyexpectedreductioninaveragerealworldCO2emissionsfrompassengercarsof15%to20%between2010and2020,theHilletal.,2012projectionsappearoptimisticandtheJapaneseprojectionappearspessimistic,atleastforEuropeanvehicles.
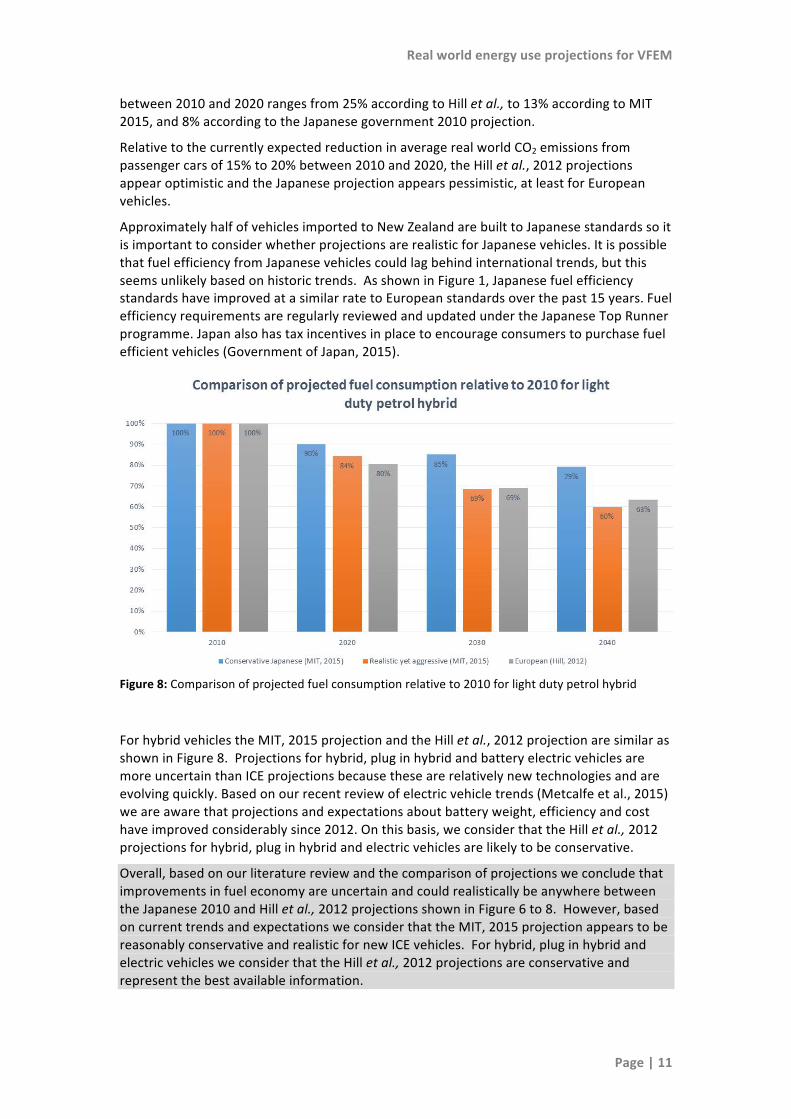
ApproximatelyhalfofvehiclesimportedtoNewZealandarebuilttoJapanesestandardssoitisimportanttoconsiderwhetherprojectionsarerealisticforJapanesevehicles.ItispossiblethatfuelefficiencyfromJapanesevehiclescouldlagbehindinternationaltrends,butthisseemsunlikelybasedonhistorictrends.AsshowninFigure1,JapanesefuelefficiencystandardshaveimprovedatasimilarratetoEuropeanstandardsoverthepast15years.FuelefficiencyrequirementsareregularlyreviewedandupdatedundertheJapaneseTopRunnerprogramme.Japanalsohastaxincentivesinplacetoencourageconsumerstopurchasefuelefficientvehicles(GovernmentofJapan,2015).
Figure8:Comparisonofprojectedfuelconsumptionrelativeto2010forlightdutypetrolhybrid
ForhybridvehiclestheMIT,2015projectionandtheHilletal.,2012projectionaresimilarasshowninFigure8.Projectionsforhybrid,pluginhybridandbatteryelectricvehiclesaremoreuncertainthanICEprojectionsbecausethesearerelativelynewtechnologiesandareevolvingquickly.Basedonourrecentreviewofelectricvehicletrends(Metcalfeetal.,2015)weareawarethatprojectionsandexpectationsaboutbatteryweight,efficiencyandcosthaveimprovedconsiderablysince2012.Onthisbasis,weconsiderthattheHilletal.,2012projectionsforhybrid,pluginhybridandelectricvehiclesarelikelytobeconservative.
Overall,basedonourliteraturereviewandthecomparisonofprojectionsweconcludethatimprovementsinfueleconomyareuncertainandcouldrealisticallybeanywherebetweentheJapanese2010andHilletal.,2012projectionsshowninFigure6to8.However,basedoncurrenttrendsandexpectationsweconsiderthattheMIT,2015projectionappearstobereasonablyconservativeandrealisticfornewICEvehicles.Forhybrid,pluginhybridandelectricvehiclesweconsiderthattheHilletal.,2012projectionsareconservativeandrepresentthebestavailableinformation.
RealworldenergyuseprojectionsforVFEM
Page|12
Comparisonofprojections:heavydutyvehicles
Thereislimitedinformationaboutheavydutyvehiclefuelefficiencyandprojections.IntheEuropeanUniontherehasbeennohistoricalrequirementtomeasurefuelefficiencyandCO2emissionsfromheavydutyvehicles.AccordingtodatafromindustryinEurope,newHCVfuelconsumptionandCO2emissionsperformanceimprovedsteadilyuntilthemid-1990s,thenstabilisedanddidnotmateriallyimprovefurtherinthelastdecade(EuropeanCommission,2014).ThisisconsistentfindingsinNewZealandwherethefuelefficiencyofnewHDV’shasnotchangedsignificantlyoverthepastdecade5.
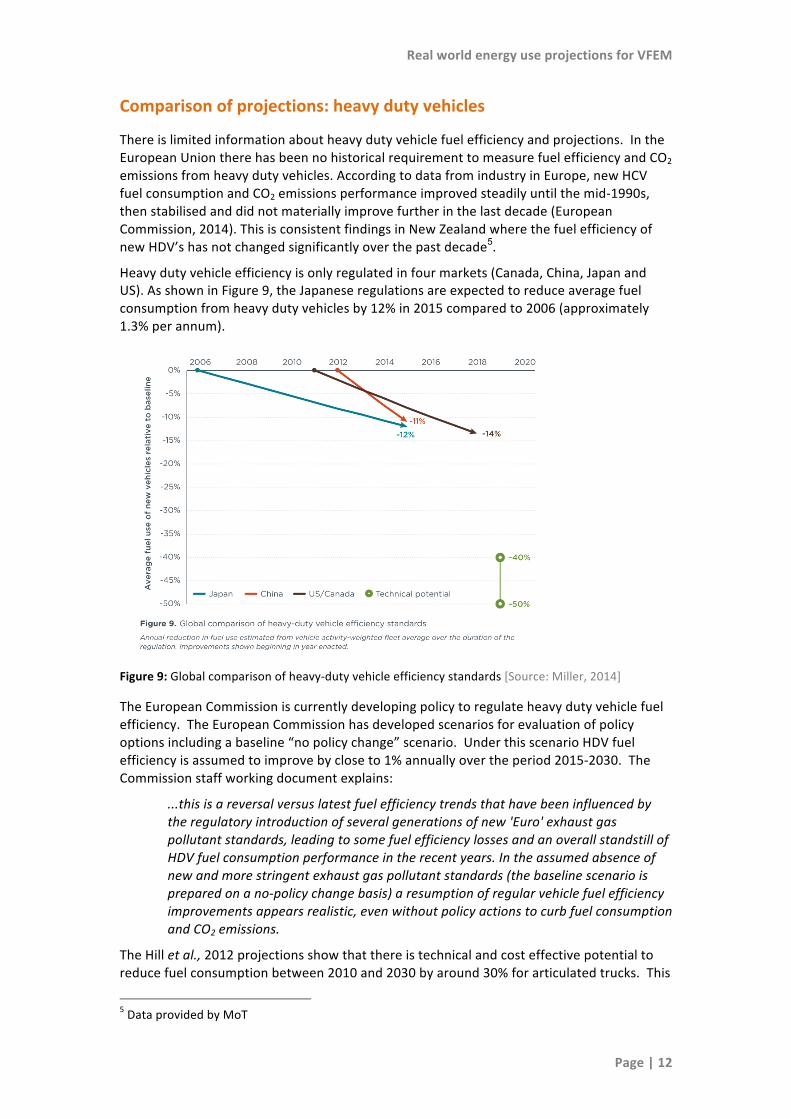
Heavydutyvehicleefficiencyisonlyregulatedinfourmarkets(Canada,China,JapanandUS).AsshowninFigure9,theJapaneseregulationsareexpectedtoreduceaveragefuelconsumptionfromheavydutyvehiclesby12%in2015comparedto2006(approximately1.3%perannum).
Figure9:Globalcomparisonofheavy-dutyvehicleefficiencystandards[Source:Miller,2014]
TheEuropeanCommissioniscurrentlydevelopingpolicytoregulateheavydutyvehiclefuelefficiency.TheEuropeanCommissionhasdevelopedscenariosforevaluationofpolicyoptionsincludingabaseline“nopolicychange”scenario.UnderthisscenarioHDVfuelefficiencyisassumedtoimprovebycloseto1%annuallyovertheperiod2015-2030.TheCommissionstaffworkingdocumentexplains:
...thisisareversalversuslatestfuelefficiencytrendsthathavebeeninfluencedbytheregulatoryintroductionofseveralgenerationsofnew'Euro'exhaustgaspollutantstandards,leadingtosomefuelefficiencylossesandanoverallstandstillofHDVfuelconsumptionperformanceintherecentyears.Intheassumedabsenceofnewandmorestringentexhaustgaspollutantstandards(thebaselinescenarioispreparedonano-policychangebasis)aresumptionofregularvehiclefuelefficiencyimprovementsappearsrealistic,evenwithoutpolicyactionstocurbfuelconsumptionandCO2emissions.
TheHilletal.,2012projectionsshowthatthereistechnicalandcosteffectivepotentialtoreducefuelconsumptionbetween2010and2030byaround30%forarticulatedtrucks.This
5DataprovidedbyMoT
RealworldenergyuseprojectionsforVFEM
Page|13
isconsistentwithanICCTassessment(ICCT,2015c)whichconcludesthatthereareseveralavailabletechnologypackagesthatcouldreducefuelconsumptionofarticulatedtrucksby30%to40%comparedwith2010levels.
TheHilletal.,2012reportincludesprojectionsforarangeofheavydutyvehiclesandbuses.Thereportnotesthatarangeofprojectionsarerequiredbecausetheresultsforheavydutyvehiclescannotnecessarilybescaledaccordingtosize.Heavydutyvehiclesarediverseintheirrelativesizes,technicalspecificationsandusagepatterns.Soforexample,insmallertrucksthataretypicallyusedinurbanareashybridpowertrainswillhaveagreaterimpactduetosignificantstopstartactivityandspeedfluctuations,comparedtoheaviertrucksusedforlonghauloperations.Conversely,theapplicationofaerodynamicimprovementshasmostbenefitforlargevehiclesthataretravellingathighspeedsforasignificantproportionoftheiractivity.
TheHilletal.,projectionsshowthatthereistechnicalandcosteffectivepotentialtoreducefuelconsumptionbetween2010and2030byaround13%forsmallrigidtrucks,25%forlargerigidtrucksand30%forarticulatedtrucks.
Overall,weconcludethatthereisconsiderableuncertaintyinfutureprojectionsofheavydutyvehiclefuelefficiency.Weconsiderthattherateofimprovementcouldrealisticallybeanywherebetweennoimprovement(0%perannuminkeepingwithrecenttrends)andtheprojectionsfromHilletal.,2012.
Forthisprojectwerecommend50%oftheHilletal.,projectedratesofimprovementasareasonablyconservativemiddleground.
Underthis50%oftheHilletal.,2012scenario,themaximumannualrateimprovementis1%perannumforarticulatedtrucks.Thisisreasonablecomparedwiththerateofimprovementrequiredtodateinregulatedmarkets(includingJapanatapproximately1.3%perannum)aswellasthebaseline“nopolicychange”scenarioconsideredbytheEuropeanCommission,whichassumedannualaverageimprovementofcloseto1%annually.
RealworldenergyuseprojectionsforVFEM
Page|14
3 Methodology:realworldenergyconsumptionprojections
Theprojectionsinthisreportareintendedtorepresentrealworldfuelconsumption.Theserealworldfactorsaretheaveragefuelconsumptionper100kmofnewvehiclessoldinagivenyear.Theyarebasedonfuelconsumptionofvehiclesoperatingintherealworldunderalldifferentdrivingconditions.Thesefactorsrepresentanaverageacrossalldifferentvehicleswithintheclassification.
ForthisprojectweassumedthatthedataprovidedbyMoTisrepresentativeofrealworldfuelconsumptionofvehiclesmanufacturedin2012.Fuelconsumptionfactorsforothervehicletypes,andforallprojectionyearsarecalculatedrelativetotheserealworldfactors.
Thissectionofthereportbrieflysummarisesthekeyassumptions.Detailedassumptionsandcalculationsareprovidedintheaccompanyingspreadsheet.
3.1 Lightdutyvehicles:baseyear
RealworldfuelconsumptionfactorsforlightdutydieselandpetrolICE(internalcombustionengine)vehiclesinNewZealandhavebeenestimatedbyMoTusingfuelconsumptionandtraveldatafromfuelcardtransactions(Wangetal.,2015).
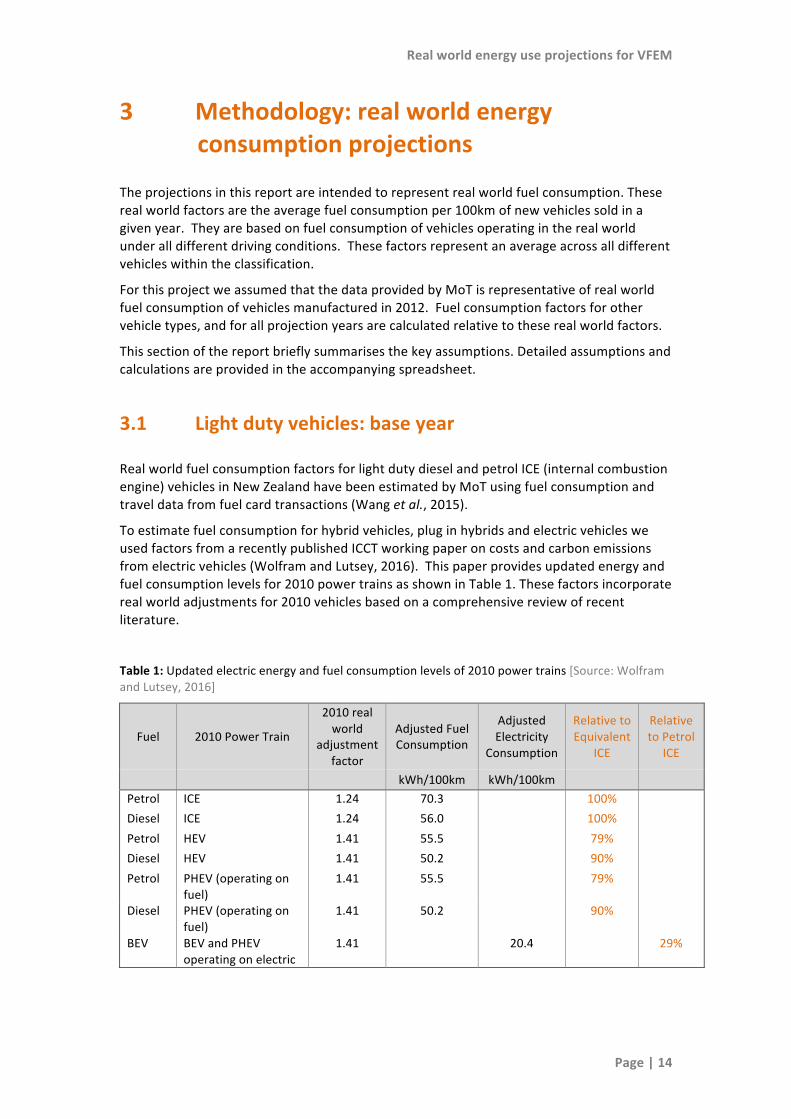
Toestimatefuelconsumptionforhybridvehicles,pluginhybridsandelectricvehiclesweusedfactorsfromarecentlypublishedICCTworkingpaperoncostsandcarbonemissionsfromelectricvehicles(WolframandLutsey,2016).Thispaperprovidesupdatedenergyandfuelconsumptionlevelsfor2010powertrainsasshowninTable1.Thesefactorsincorporaterealworldadjustmentsfor2010vehiclesbasedonacomprehensivereviewofrecentliterature.
Table1:Updatedelectricenergyandfuelconsumptionlevelsof2010powertrains[Source:WolframandLutsey,2016]
Fuel 2010PowerTrain
2010realworld
adjustmentfactor
AdjustedFuelConsumption
AdjustedElectricity
Consumption
RelativetoEquivalent
ICE
RelativetoPetrol
ICE
kWh/100km kWh/100km Petrol ICE 1.24 70.3 100% Diesel ICE 1.24 56.0 100% Petrol HEV 1.41 55.5 79% Diesel HEV 1.41 50.2 90% Petrol PHEV(operatingon
fuel)1.41 55.5 79%
Diesel PHEV(operatingonfuel)
1.41 50.2 90%
BEV BEVandPHEVoperatingonelectric
1.41 20.4 29%
RealworldenergyuseprojectionsforVFEM
Page|15
BasedonfactorsshowninTable1,fuelconsumptionforallvehicleswascalculatedrelativetotheMoTrealworldfuelconsumptionfactorfortheequivalentinternalcombustionengine.Forexample:
1600–1999ccpetrolHEVfuelconsumption=1600-1999ccpetrolICEMoTrealworldfuelconsumptionx79%
ToestimatefuelconsumptionforPHEVs(pluginhybridelectricvehicles)weneedtoestimatetheproportionoftimethatthevehicleoperatesonelectricity.Weassume48%ofdrivinginelectricmodebasedontheresultsofarecentreview(Plötzetal.,2015).Thisreportestimatesanaverageof48%forlargevehicles,typicalofthecurrentlyavailablePHEVsinNewZealand(MitsubishiOutlander,ToyotaPriusandVolvoV60).
FuelconsumptionofPHEV’swascalculatedrelativetotheequivalentMoTfuelconsumption.Forexample:
1600–1999ccpetrolPHEVpetrolconsumption=1600-1999ccpetrolICEMoTrealworldfuelconsumptionx79%x(100%-48%)
Electricityconsumptioniscalculatedonthesamebasis,forexample:
1600–1999ccpetrolPHEVelectricityconsumption=equivalentenergyconsumptionof1600-1999ccpetrolICEMoTrealworldfuelconsumptionx29%x(48%)
Batteryelectricvehiclesarecalculatedonthesamebasisi.e.29%oftheequivalentenergyconsumptionofapetrolICE.
3.2 Lightdutyvehicles:projections
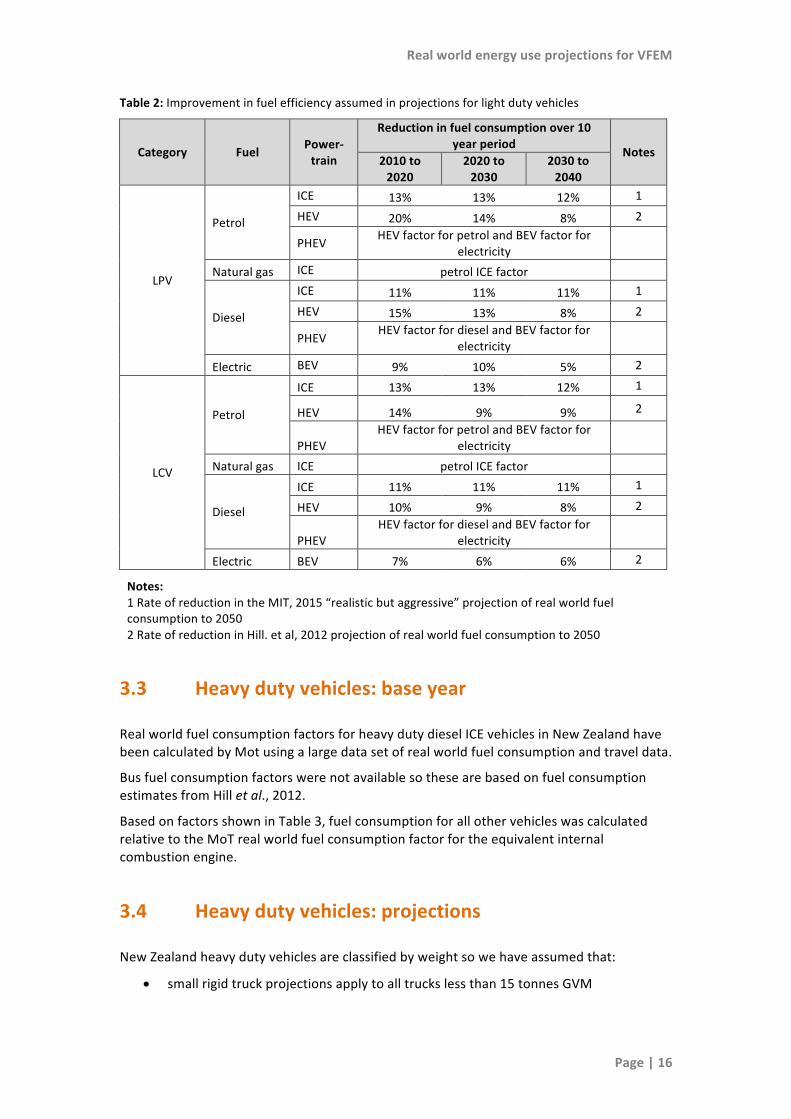
AllprojectedenergyconsumptionfactorsarecalculatedrelativetothebaseyearfactorsusingthereductionratesshowninTable2asfollows.
RealworldenergyuseprojectionsforVFEM
Page|16
Table2:Improvementinfuelefficiencyassumedinprojectionsforlightdutyvehicles
Category Fuel Power-train
Reductioninfuelconsumptionover10yearperiod Notes
2010to2020
2020to2030
2030to2040
LPV
Petrol
ICE 13% 13% 12% 1HEV 20% 14% 8% 2
PHEV HEVfactorforpetrolandBEVfactorforelectricity
Naturalgas ICE petrolICEfactor
Diesel
ICE 11% 11% 11% 1HEV 15% 13% 8% 2
PHEV HEVfactorfordieselandBEVfactorforelectricity
Electric BEV 9% 10% 5% 2
LCV
Petrol
ICE 13% 13% 12% 1
HEV 14% 9% 9% 2
PHEVHEVfactorforpetrolandBEVfactorfor
electricity
Naturalgas ICE petrolICEfactor
Diesel
ICE 11% 11% 11% 1
HEV 10% 9% 8% 2
PHEVHEVfactorfordieselandBEVfactorfor
electricity
Electric BEV 7% 6% 6% 2
Notes:1RateofreductionintheMIT,2015“realisticbutaggressive”projectionofrealworldfuelconsumptionto20502RateofreductioninHill.etal,2012projectionofrealworldfuelconsumptionto2050
3.3 Heavydutyvehicles:baseyear
RealworldfuelconsumptionfactorsforheavydutydieselICEvehiclesinNewZealandhavebeencalculatedbyMotusingalargedatasetofrealworldfuelconsumptionandtraveldata.
BusfuelconsumptionfactorswerenotavailablesothesearebasedonfuelconsumptionestimatesfromHilletal.,2012.
BasedonfactorsshowninTable3,fuelconsumptionforallothervehicleswascalculatedrelativetotheMoTrealworldfuelconsumptionfactorfortheequivalentinternalcombustionengine.
3.4 Heavydutyvehicles:projections
NewZealandheavydutyvehiclesareclassifiedbyweightsowehaveassumedthat:
• smallrigidtruckprojectionsapplytoalltruckslessthan15tonnesGVM
RealworldenergyuseprojectionsforVFEM
Page|17
• largerigidtruckprojectionsapplytoalltrucksbetween15tonnesand25tonnesGVM
• articulatedtruckprojectionsapplytoalltrucksover25tonnesGVM
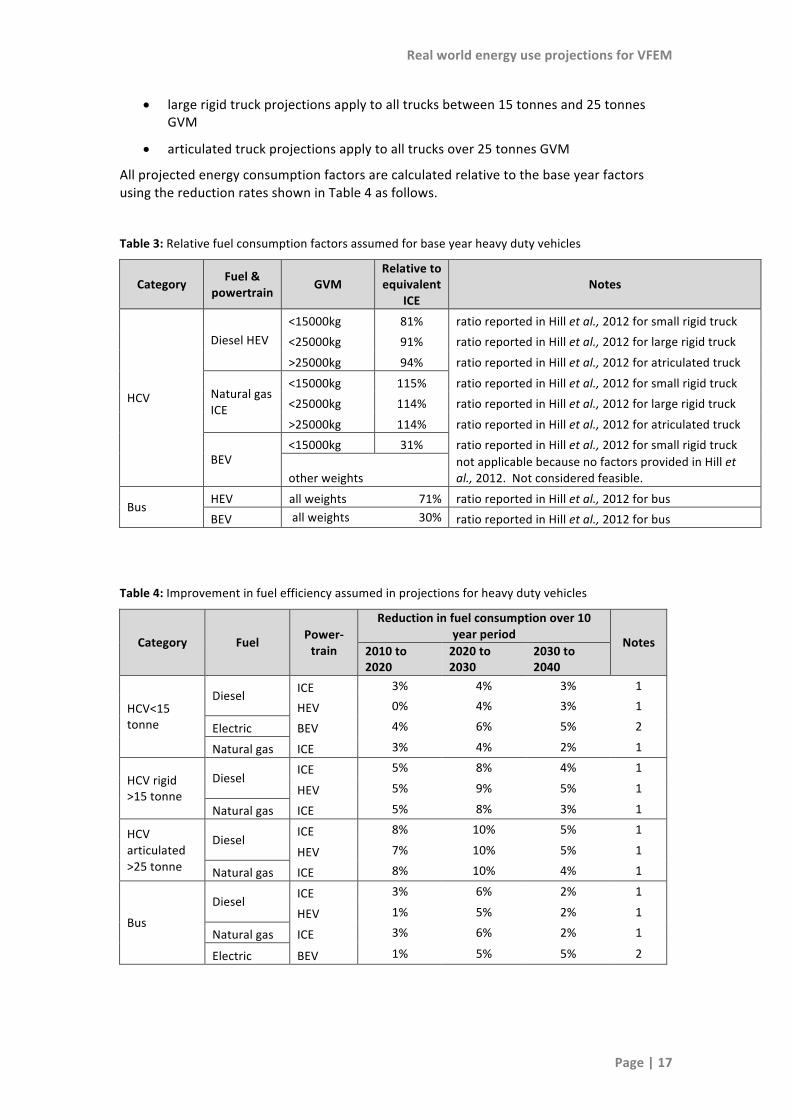
AllprojectedenergyconsumptionfactorsarecalculatedrelativetothebaseyearfactorsusingthereductionratesshowninTable4asfollows.
Table3:Relativefuelconsumptionfactorsassumedforbaseyearheavydutyvehicles
Category Fuel&powertrain GVM
Relativetoequivalent
ICENotes
HCV
DieselHEV<15000kg 81% ratioreportedinHilletal.,2012forsmallrigidtruck<25000kg 91% ratioreportedinHilletal.,2012forlargerigidtruck>25000kg 94% ratioreportedinHilletal.,2012foratriculatedtruck
NaturalgasICE
<15000kg 115% ratioreportedinHilletal.,2012forsmallrigidtruck<25000kg 114% ratioreportedinHilletal.,2012forlargerigidtruck>25000kg 114% ratioreportedinHilletal.,2012foratriculatedtruck
BEV<15000kg 31% ratioreportedinHilletal.,2012forsmallrigidtruck
otherweightsnotapplicablebecausenofactorsprovidedinHilletal.,2012.Notconsideredfeasible.
Bus HEV allweights71% ratioreportedinHilletal.,2012forbusBEV allweights30% ratioreportedinHilletal.,2012forbus
Table4:Improvementinfuelefficiencyassumedinprojectionsforheavydutyvehicles
Category Fuel Power-train
Reductioninfuelconsumptionover10yearperiod Notes
2010to2020
2020to2030
2030to2040
HCV<15tonne
Diesel ICE 3% 4% 3% 1
HEV 0% 4% 3% 1
Electric BEV 4% 6% 5% 2
Naturalgas ICE 3% 4% 2% 1
HCVrigid>15tonne
DieselICE 5% 8% 4% 1
HEV 5% 9% 5% 1
Naturalgas ICE 5% 8% 3% 1
HCVarticulated>25tonne
DieselICE 8% 10% 5% 1
HEV 7% 10% 5% 1
Naturalgas ICE 8% 10% 4% 1
BusDiesel ICE 3% 6% 2% 1
HEV 1% 5% 2% 1
Naturalgas ICE 3% 6% 2% 1
Electric BEV 1% 5% 5% 2
RealworldenergyuseprojectionsforVFEM
Page|18
4 Results
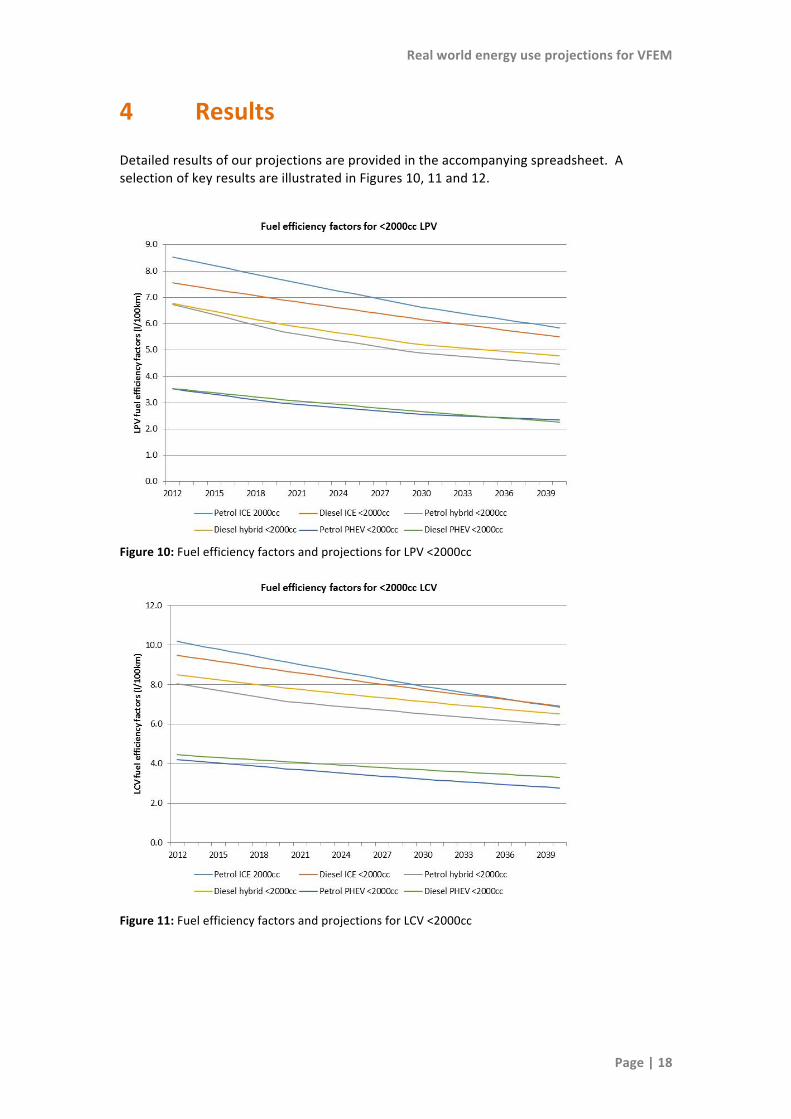
Detailedresultsofourprojectionsareprovidedintheaccompanyingspreadsheet.AselectionofkeyresultsareillustratedinFigures10,11and12.
Figure10:FuelefficiencyfactorsandprojectionsforLPV<2000cc
Figure11:FuelefficiencyfactorsandprojectionsforLCV<2000cc

RealworldenergyuseprojectionsforVFEM
Page|19
Figure12:Fuelefficiencyfactorsandprojectionsforheavyvehicles
RealworldenergyuseprojectionsforVFEM
Page|20
5 Conclusionsandrecommendations
RealworldfuelconsumptionfactorsfordieselandpetrolICE(internalcombustionengine)vehiclesinNewZealandhavebeenestimatedbyMoTusingfuelconsumptionandtraveldatafromalargedatasetofrealworldfuelcardtransactions6.
Thisprojectdevelopedfactorsforothervehicletypesandforfutureyears.ToensurethatthesefactorsareconservativeandrelevanttoNewZealandwehavecalculatedallfuelconsumptionfiguresrelativetoMoTrealworldfactorsforNewZealand.
TheMoTrealworldfactorsunderpinthisanalysis.WerecommendthattheMoTanalysisisregularlyupdated.Itisalsoimportantthattheanalysisisextendedtoincludeprivatelyownedvehicles,includingoldervehiclesandvehiclesmanufacturedtoJapanesestandards(asrecommendedbyWangetal.,2015).
WehavedevelopedprojectionfactorsforNewZealandvehiclefuelsandenergyconsumptionbasedoninternationalprojections.
Theprojectedfuelandenergyconsumptionfactorsarebasedonimprovementsthatare
• technicallyfeasible
• costeffective
• reasonablyconservative
Howevertheseprojectionsgowellbeyondcurrentregulatorytimeframessotheyareinherentlyuncertain.
Werecommendthattheprojectionsareregularlyreviewedandupdated.
6FuelusefactorsforthisprojectwereprovidedbyMinistryofTransport,includingfactorsforlightdutyvehicles(Wangetal.,2015)andunpublishedfactorsforheavydutyvehicles.
RealworldenergyuseprojectionsforVFEM
Page|21
References
CommitteeonClimateChange,2015.SectoralscenariosfortheFifthCarbonBudget,TechnicalReport.PreparedfortheCommitteeonClimateChange
EAEnergyAnalyses,2015.VehicleEnergyUseandCost-MethodologyusedinGronTransportRoadmap2030.WorkingPaper
EuropeanCommission,2014.CommissionStaffWorkingDocument,ImpactAssessmentaccompanyingthedocumentStrategyforReducingHeavyDutyVehiclesFuelConsumptionandCO2emissions.
EPA/NHTSA,2012.JointTechnicalSupportDocument:FinalRulemakingfor2017to2025Light-DutyVehicleGreenhouseGasEmissionStandardsandCorporateAverageFuelEconomyStandards.U.S.EnvironmentalProtectionAgencyandNationalHighwayTrafficSafetyAdministration.
GFEI,2016.FuelEconomyStateoftheWorld2016:TimeforGlobalAction.PreparedbytheGlobalFuelEconomyInitiative,
GovernmentofJapan,2015.Japan’ssecondbiennialreportundertheUnitedNationsFrameworkConventiononClimateChange.
Hill,N.etal.,2012.Areviewoftheefficiencyandcostassumptionsforroadtransportvehiclesto2050.
ICCT,2015a.Datatables[August2015]GlobalPVstandardchartlibrary(accessed27/7/2016)Availableat:http://www.theicct.org/global-pv-standards-chart-library
ICCT,2015b.Fromlaboratorytoroad:A2015UpdateofOfficialand“Real-World”FuelConsumptionandCO2valuesforPassengerCarsinEurope,PreparedbytheTietge,U;Zacharof,N;Mock,P;Franco,V;German,J;Bandivadekar,A(ICCT);Ligterink,N(TNO)&Lambrecht,U(IFEU)
ICCT,2015c.Advancedtractortrailerefficiencytechnologypotentialinthe2020to2030timeframe.WhitepaperpreparedbyDelago,J.&Lutsey,N.
ICCT,2016.EuropeanVehicleMarketStatistics,Pocketbook2015/16.PreparedbytheInternationalCouncilonCleanTransportation.
MBIE,2016.EnergyinNewZealand2015.PreparedbytheMinistryofBusiness,InnovationandEmployment
MetcalfeJ,KuschelG,&DenneT(2015).Researchintothelongtermtrendsforelectricvehiclepriceandsupply–understandingdevelopmentsintheglobalmarket,PreparedforMinistryofTransport,June
Miller,J.andFacanho,C.,2014.Thestateofcleantransportpolicy2014.PreparedfortheInternationalCouncilonCleanTransportation
Miller,J.,2016.ReducingCO2emissionsfromroadtransportintheEuropeanUnion:Anevaluationofpolicyoptions(Workingpaper2016-10).PreparedfortheInternationalCouncilonCleanTransportation
MIT,2015.OntheRoadTowards2050:PotentialforSubstantialReductionsinLight-DutyVehicleEnergyUseandGreenhouseGasEmissions,PreparedbySloanAutomotiveLaboratory,MassachusettsInstituteofTechnology
MoT,2016.QuarterlyFleetStatisticsSpreadsheetJantoMar2016update.xls.PreparedbytheMinistryofTransport
OECD/IEA,2016.TechnologyandPolicyDriversoftheFuelEconomyofNewLight-DutyVehicles:Comparativeanalysisacrossselectedautomotivemarkets(Workingpaper12),Preparedbythe
RealworldenergyuseprojectionsforVFEM
Page|22
InternationalEnergyAgency
Plötz,P.,Funke,S.&Jochem,P.,2015.Real-worldfueleconomyandCO2emissionsofplug-inhybridelectricvehicles,
Sims,R.,Schaeffer,R.,Creutzig,F.,Cruz-Núñez,X.,D’Agosto,M.etal.,2014.Transportin:ClimateChange2014:Mitigationofclimatechange.ContributionofworkinggroupIIItothefifthassessmentreportoftheIntergovernmentalPanelonClimateChange.[Edenhofer,O.,R.Pichs-Madruga,Y.Sokona,E.Farahani,S.Kadner,K.Seyboth,A.Adler,I.Baum,S.Brunner,P.Eickemeier,B.Kriemann,J.Savolainen,S.Schlömer,C.vonStechow,T.ZwickelandJ.C.Minx(eds.)].CambridgeUniversityPress,Cambridge,UnitedKingdomandNewYork,NY,USA
Wang,H.etal.,2015.Real-worldfuelefficiencyoflightvehiclesinNewZealand.InAustralasianTransportResearchForum.pp.1–13.
Wolfram,P.&Lutsey,N.,2016.Electricvehicles:Literaturereviewoftechnologycostsandcarbonemissions(WorkingPaper2016-14)PreparedfortheInternationalCouncilonCleanTransportation
RealworldenergyuseprojectionsforVFEM
Page|23
Appendix1
ThisappendixdescribesthecalculationtoestimateNZaveragerealworldCO2emissionsforsmallerenginesizeequivalenttoEuropeasshowninFigure5.TheproportionofdieselandpetrolvehicleshasalsobeenadjustedtobeequivalenttotheEuropeanfleet.
CalculationofrealworldCO2emissionsfromNewZealandvehicleswithEuropeanequivalentenginesizeandproportionofdieselvehicles
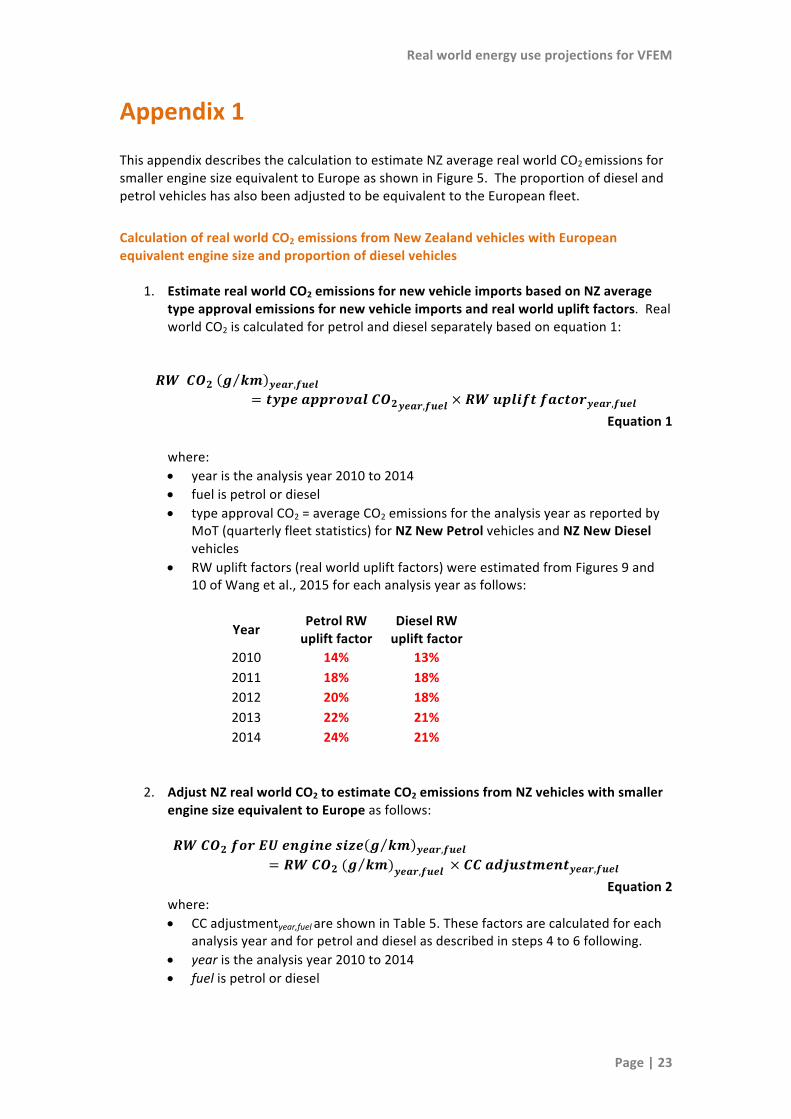
1. EstimaterealworldCO2emissionsfornewvehicleimportsbasedonNZaveragetypeapprovalemissionsfornewvehicleimportsandrealworldupliftfactors.RealworldCO2iscalculatedforpetrolanddieselseparatelybasedonequation1:
𝑹𝑾𝑪𝑶𝟐 𝒈 𝒌𝒎 𝒚𝒆𝒂𝒓,𝒇𝒖𝒆𝒍= 𝒕𝒚𝒑𝒆𝒂𝒑𝒑𝒓𝒐𝒗𝒂𝒍𝑪𝑶𝟐𝒚𝒆𝒂𝒓,𝒇𝒖𝒆𝒍×𝑹𝑾𝒖𝒑𝒍𝒊𝒇𝒕𝒇𝒂𝒄𝒕𝒐𝒓𝒚𝒆𝒂𝒓,𝒇𝒖𝒆𝒍
Equation1where:• yearistheanalysisyear2010to2014• fuelispetrolordiesel• typeapprovalCO2=averageCO2emissionsfortheanalysisyearasreportedby
MoT(quarterlyfleetstatistics)forNZNewPetrolvehiclesandNZNewDieselvehicles
• RWupliftfactors(realworldupliftfactors)wereestimatedfromFigures9and10ofWangetal.,2015foreachanalysisyearasfollows:
Year PetrolRWupliftfactor
DieselRWupliftfactor
2010 14% 13%2011 18% 18%2012 20% 18%2013 22% 21%2014 24% 21%
2. AdjustNZrealworldCO2toestimateCO2emissionsfromNZvehicleswithsmallerenginesizeequivalenttoEuropeasfollows:
𝑹𝑾𝑪𝑶𝟐𝒇𝒐𝒓𝑬𝑼𝒆𝒏𝒈𝒊𝒏𝒆𝒔𝒊𝒛𝒆 𝒈 𝒌𝒎 𝒚𝒆𝒂𝒓,𝒇𝒖𝒆𝒍
= 𝑹𝑾𝑪𝑶𝟐(𝒈 𝒌𝒎)𝒚𝒆𝒂𝒓,𝒇𝒖𝒆𝒍 ×𝑪𝑪𝒂𝒅𝒋𝒖𝒔𝒕𝒎𝒆𝒏𝒕𝒚𝒆𝒂𝒓,𝒇𝒖𝒆𝒍Equation2
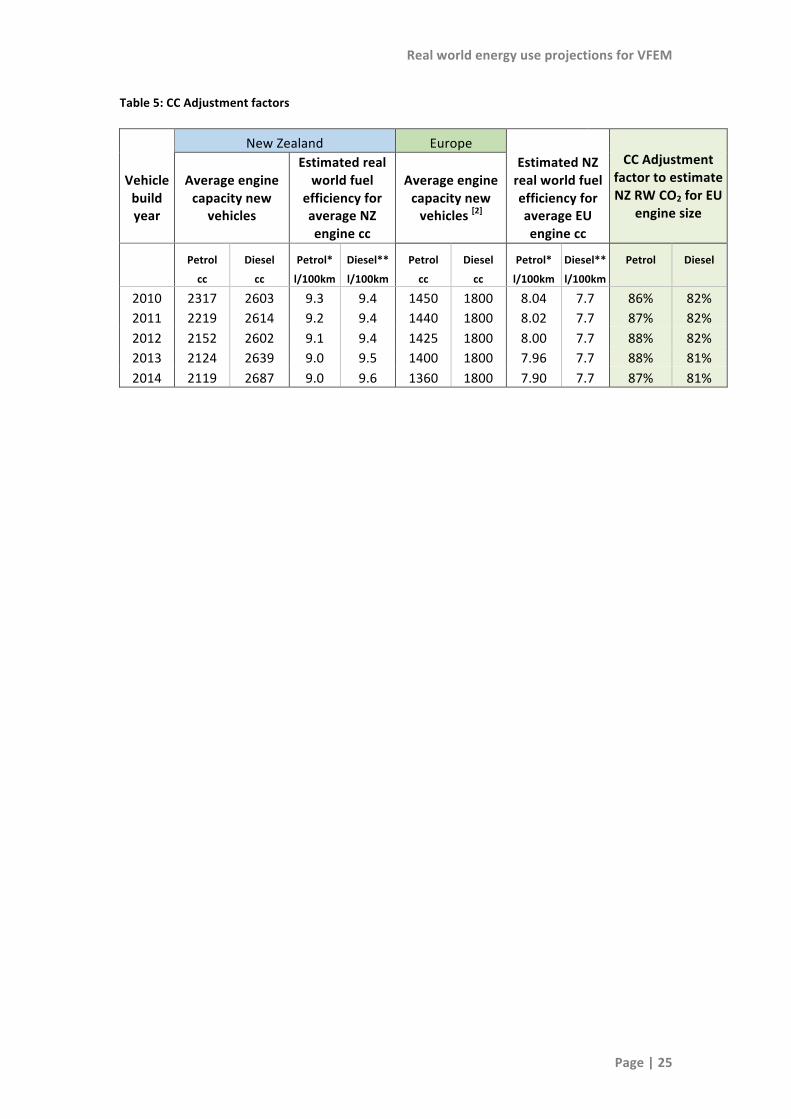
where:• CCadjustmentyear,fuelareshowninTable5.Thesefactorsarecalculatedforeach
analysisyearandforpetrolanddieselasdescribedinsteps4to6following.• yearistheanalysisyear2010to2014• fuelispetrolordiesel

RealworldenergyuseprojectionsforVFEM
Page|24
3. CalculateweightedaveragerealworldCO2emissionsbasedontheproportionofdieselandpetrolvehiclesintheEuropeanfleet.
CalculationofCCadjustmentThissectiondescribesthecalculationoftheCCadjustmentfactorusedinEquation2.TheadjustmentfactorhasbeenestimatedforeachanalysisyeartoaccountforanychangesinaverageenginesizeinEuropeandNewZealand.MoTresearchhasestablishedarelationshipbetweenrealworldfuelconsumptionandenginesizeforNewZealand(Wangetal.,2015).Wehaveusedthisrelationshiptoestimateanadjustmentfactorasfollows.
4. EstimateNZrealworldfuelconsumptionforpetrolvehicleswithNewZealandaverageenginesizeandforpetrolvehicleswithEuropeanenginesizeaccordingtoequation4:
𝑵𝒁𝑹𝑾𝒑𝒆𝒕𝒓𝒐𝒍𝒄𝒐𝒏𝒔𝒖𝒎𝒑𝒕𝒊𝒐𝒏 (𝒍 𝟏𝟎𝟎𝒌𝒎) = 𝟎. 𝟎𝟎𝟏𝟓×𝒆𝒏𝒈𝒊𝒏𝒆𝒔𝒊𝒛𝒆(𝒄𝒄) + 𝟓. 𝟖𝟔
Equation3
5. EstimaterealworldfuelconsumptionforNZdieselvehicleswithNewZealandaverageenginesizeandforNZdieselvehicleswithEuropeanenginesizeaccordingtoequation5:
𝑵𝒁𝑹𝑾𝒅𝒊𝒆𝒔𝒆𝒍𝒄𝒐𝒏𝒔𝒖𝒎𝒑𝒕𝒊𝒐𝒏 𝒍 𝟏𝟎𝟎𝒌𝒎 = 𝟎. 𝟎𝟎𝟐𝟏×𝒆𝒏𝒈𝒊𝒏𝒆𝒔𝒊𝒛𝒆 𝒄𝒄 + 𝟑. 𝟗𝟐
Equation4
6. CalculateCCadjustmentfactorsforpetrolanddieselforeachanalysisyearaccordingtoequation6and7:
𝑷𝒆𝒕𝒓𝒐𝒍𝑪𝑪𝒂𝒅𝒋𝒖𝒔𝒕𝒎𝒆𝒏𝒕𝒚𝒆𝒂𝒓 =𝑵𝒁𝑹𝑾𝒑𝒆𝒕𝒓𝒐𝒍𝒄𝒐𝒏𝒔𝒖𝒎𝒑𝒕𝒊𝒐𝒏𝑬𝑼𝒆𝒏𝒈𝒊𝒏𝒆𝒔𝒊𝒛𝒆𝒚𝒆𝒂𝒓𝑵𝒁𝑹𝑾𝒑𝒆𝒕𝒓𝒐𝒍𝒄𝒐𝒏𝒔𝒖𝒎𝒑𝒕𝒊𝒐𝒏𝑵𝒁𝒆𝒏𝒈𝒊𝒏𝒆𝒔𝒊𝒛𝒆𝒚𝒆𝒂𝒓
Equation5
and
𝑫𝒊𝒆𝒔𝒆𝒍𝑪𝑪𝒂𝒅𝒋𝒖𝒔𝒕𝒎𝒆𝒏𝒕𝒚𝒆𝒂𝒓 =𝑵𝒁𝑹𝑾𝒅𝒊𝒆𝒔𝒆𝒍𝒄𝒐𝒏𝒔𝒖𝒎𝒑𝒕𝒊𝒐𝒏𝑬𝑼𝒆𝒏𝒈𝒊𝒏𝒆𝒔𝒊𝒛𝒆𝒚𝒆𝒂𝒓𝑵𝒁𝑹𝑾𝒅𝒊𝒆𝒔𝒆𝒍𝒄𝒐𝒏𝒔𝒖𝒎𝒑𝒕𝒊𝒐𝒏𝑵𝒁𝒆𝒏𝒈𝒊𝒏𝒆𝒔𝒊𝒛𝒆𝒚𝒆𝒂𝒓
Equation6
RealworldenergyuseprojectionsforVFEM
Page|25
Table5:CCAdjustmentfactors
NewZealand Europe CCAdjustment
factortoestimateNZRWCO2forEU
enginesize
Vehiclebuildyear
Averageenginecapacitynew
vehicles
Estimatedrealworldfuel
efficiencyforaverageNZenginecc
Averageenginecapacitynewvehicles[2]
EstimatedNZrealworldfuelefficiencyforaverageEUenginecc
Petrol Diesel Petrol* Diesel** Petrol Diesel Petrol* Diesel** Petrol Diesel
cc cc l/100km l/100km cc cc l/100km l/100km
2010 2317 2603 9.3 9.4 1450 1800 8.04 7.7 86% 82%2011 2219 2614 9.2 9.4 1440 1800 8.02 7.7 87% 82%2012 2152 2602 9.1 9.4 1425 1800 8.00 7.7 88% 82%2013 2124 2639 9.0 9.5 1400 1800 7.96 7.7 88% 81%2014 2119 2687 9.0 9.6 1360 1800 7.90 7.7 87% 81%


