
1 CEFRC2 June 27, 2012
Reciprocating Internal Combustion Engines
Prof. Rolf D. Reitz,Engine Research Center,
University of Wisconsin-Madison
2012 Princeton-CEFRCSummer Program on Combustion
Course Length: 9 hrs
(Wed., Thur., Fri., June 27-29)
Hour 2
Copyright ©2012 by Rolf D. Reitz.This material is not to be sold, reproduced or distributed withoutprior written permission of the owner, Rolf D. Reitz.

2 CEFRC2 June 27, 2012
Hour 2: Turbochargers, Engine Performance Metrics
Short course outine:
Engine fundamentals and performance metrics, computer modeling supportedby in-depth understanding of fundamental engine processes and detailedexperiments in engine design optimization.
Day 1 (Engine fundamentals)Hour 1: IC Engine Review, 0, 1 and 3-D modelingHour 2: Turbochargers, Engine Performance MetricsHour 3: Chemical Kinetics, HCCI & SI Combustion
Day 2 (Spray combustion modeling)Hour 4: Atomization, Drop Breakup/CoalescenceHour 5: Drop Drag/Wall Impinge/VaporizationHour 6: Heat transfer, NOx and Soot Emissions
Day 3 (Applications)Hour 7: Diesel combustion and SI knock modelingHour 8: Optimization and Low Temperature CombustionHour 9: Automotive applications and the Future

Turbocharging
3 CEFRC2 June 27, 2012
Hour 2: Turbochargers, Engine Performance Metrics
Improved

Turbocharging
Purpose of turbocharging or supercharging is to increase inlet air density,- increase amount of air in the cylinder.
Mechanical supercharging- driven directly by power from engine.
Turbocharger - connected compressor/turbine- energy in exhaust used to drive turbine.
Supercharging necessary in two-strokesfor effective scavenging:
- intake P > exhaust P- crankcase used as a pump
Some engines combine engine-driven andmechanical (e.g., in two-stage configuration).
Intercooler after compressor- controls combustion air temperature.
4 CEFRC2 June 27, 2012
Hour 2: Turbochargers, Engine Performance Metrics

Turbocharging
Energy in exhaust is used to driveturbine which drives compressor
Wastegate used to by-pass turbine
Charge air cooling after compressorfurther increases air density- more air for combustion
5 CEFRC2 June 27, 2012
Hour 2: Turbochargers, Engine Performance Metrics
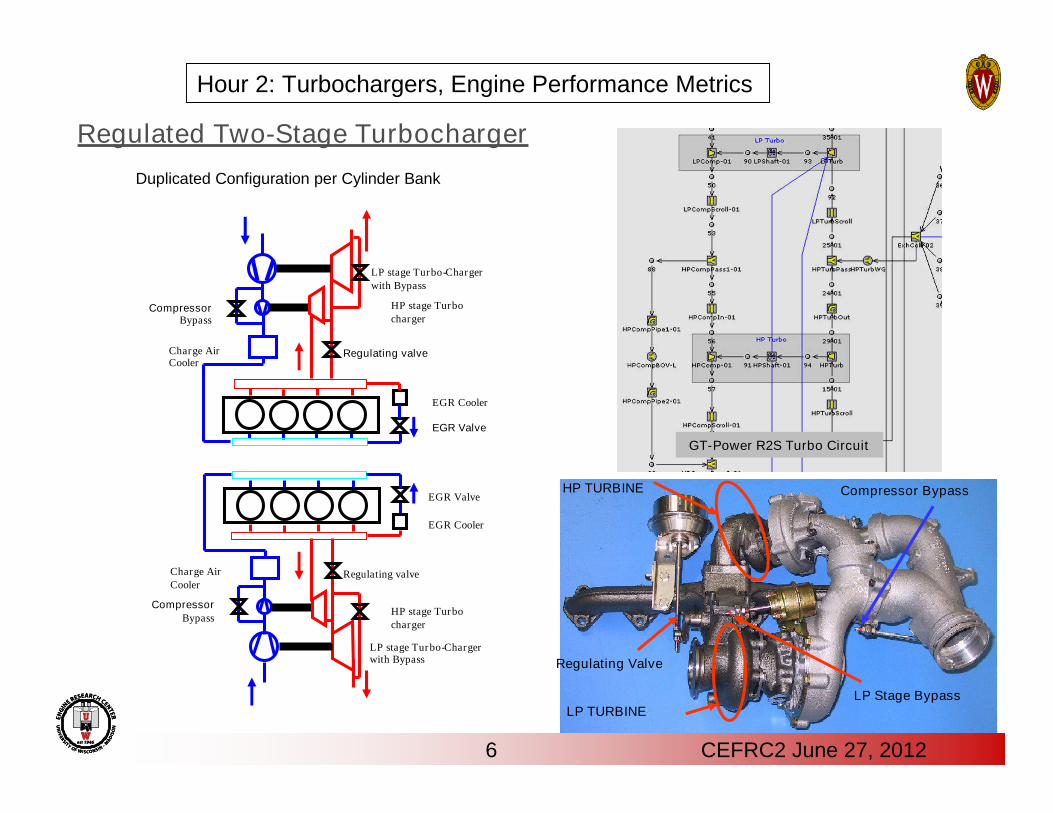
Regulated Two-Stage Turbocharger
Duplicated Configuration per Cylinder Bank
EGR Cooler
EGR Cooler
EGR Valve
EGR Valve
LP stage Turbo-Chargerwith Bypass
LP stage Turbo-Chargerwith Bypass
HP stage Turbocharger
HP stage Turbocharger
Regulating valve
Regulating valveCharge AirCooler
Charge AirCooler
CompressorBypass
CompressorBypass
LP TURBINE
Regulating Valve
LP Stage Bypass
HP TURBINE Compressor Bypass
GT-Power R2S Turbo Circuit
6 CEFRC2 June 27, 2012
Hour 2: Turbochargers, Engine Performance Metrics

Variable Valve Timing - IVC control
ln V
Q
ln T
ln V
TDC IVC
T ign
Q
Reduced Peak Temp (NOx)Improved phasing
IVC
IVC
VPP V
Isentropic
( 1)IVC
IVC
VTT V
Boost explains 20% of the improved fuel efficiency of diesel vs. SI
ln P
TDC IVC
Pressure/time ofignition
Boost
Compressor
7 CEFRC2 June 27, 2012
Hour 2: Turbochargers, Engine Performance Metrics
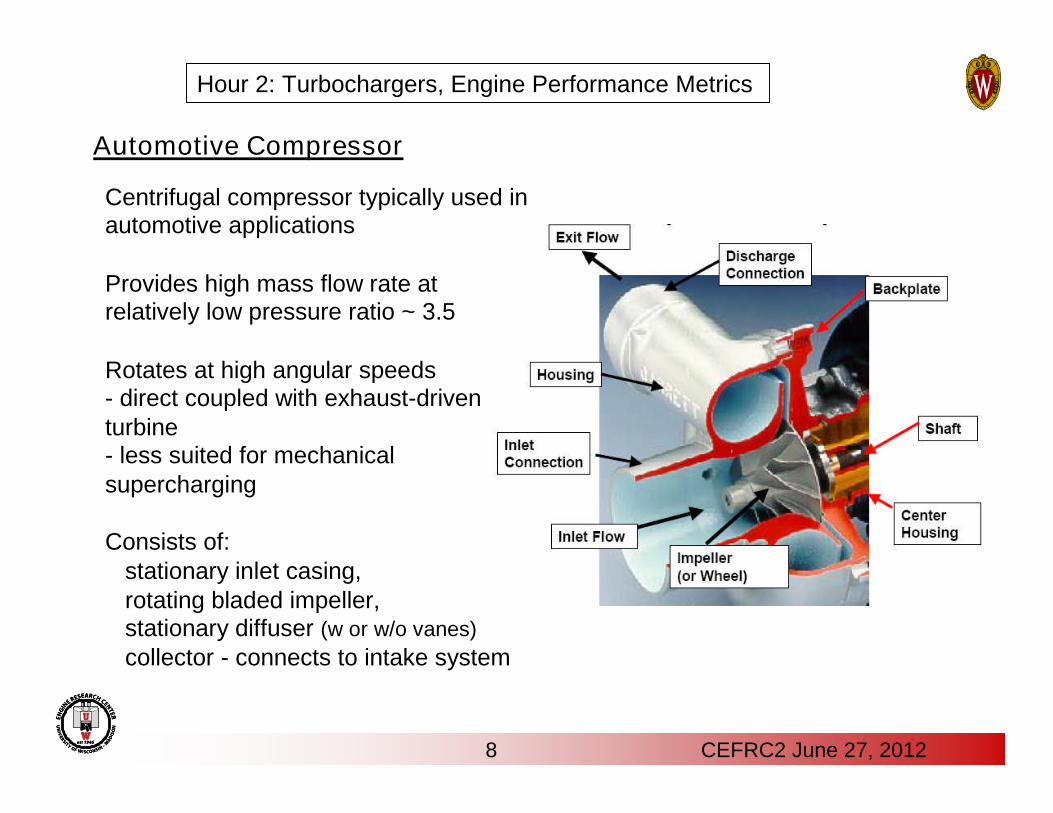
Centrifugal compressor typically used inautomotive applications
Provides high mass flow rate atrelatively low pressure ratio ~ 3.5
Rotates at high angular speeds- direct coupled with exhaust-driventurbine- less suited for mechanicalsupercharging
Consists of:stationary inlet casing,rotating bladed impeller,stationary diffuser (w or w/o vanes)collector - connects to intake system
Automotive Compressor
8 CEFRC2 June 27, 2012
Hour 2: Turbochargers, Engine Performance Metrics

201
1
11
2T
MT
2 10
11
1(1 )
2P
MP
P0 P=Pb
P/P0Pb
0
1
x
0.528
reservoir ambient
M=1Manifold pressure, P2 cmHg
m
Choked
WOT
speed
Ex. Flow past throttle plate
Choked flow for P2 < 53.5 kPa = 40.1cmHg
40.1 76
1
Isentropic compressible flow theory
0
9 CEFRC2 June 27, 2012
Hour 2: Turbochargers, Engine Performance Metrics
Anderson, 1990

Application to turbomachinery
Reduced flow passagearea
P0 /PTotal/static pressure ratio
1/0.528=1.891.0
Choked flow
Increased speed
0
0
/
/ref
ref
m T T
P P
Variable Geometry Compressor/turbine performance map
“Corrected massflow rate”
A measure of effective flowarea
1*2( 1)
1 00
2( )1Mm P A
RT
1/ 20 0 0
0
( / ) /( / )
P Vm AV A RT
RT c
P AM P P T TRT
Fliegner’s Formula:
10 CEFRC2 June 27, 2012
Hour 2: Turbochargers, Engine Performance Metrics
Anderson, 1990

P0
P3T
S
P1
P2
P03
= P0,in
= Pout
V12/2cP
Air at stagnation state 0,in accelerates toinlet pressure, P1, and velocity V1.
Compression in impeller passagesincreases pressure to P2, and velocity V2.
Diffuser between states 2 and out,recovers air kinetic energy at exit of impellerproducing pressure rise to, Pout andlow velocity Vout
Compressor
1
0,
1
a
aa
c a out in
a P in out
c in
W m h h
m c T pW
p
Note: use exit static pressure and inlet totalpressure, because kinetic energy of gasleaving compressor is usually not recovered
c
)()(
inout
inisenoutc TT
TT
Heywood, Fig. 6-43
11 CEFRC2 June 27, 2012
Hour 2: Turbochargers, Engine Performance Metrics
Heywood, 1988

12 CEFRC2 June 27, 2012
Compressor MapsWork transfer to gas occurs in impeller via change in gasangular momentum in rotating blade passage
Surge limit line– reduced mass flowdue to periodic flowreversal/reattachment inpassage boundary layers.Unstable flow can leadto damage
At high air flow rate,operation is limited bychoking at the minimumarea point within compressor
Pressure ratio evaluatedusing total-to-staticpressures since exit flowkinetic energy is notrecovered
Non-dimensionalize bladetip speed (~ND) by speedof sound
Speed/pressure limit line
Supersonic flow
Shockwave
Heywood, Fig. 6-46
Hour 2: Turbochargers, Engine Performance Metrics
Heywood, 1988

Compressor maps
0.5
0.6
0.7
0.8
0.00 0.02 0.04 0.06 0.08 0.10 0.12 0.14 0.16 0.18
Corrected Air Flow (kg/s)
Efficiency(T/T)
35000 40000 50000 70000
90000 110000 130000 150000
170000 180000 190000
35000 4000050000 70000
90000
110000
130000
150000
170000
180000
190000
1.0
1.2
1.4
1.6
1.8
2.0
2.2
2.4
2.6
2.8
3.0
0.00 0.02 0.04 0.06 0.08 0.10 0.12 0.14 0.16 0.18
Corrected Air Flow (kg/s)
PressureRatio (t/t)
GM 1.9L diesel engine
13 CEFRC2 June 27, 2012
Hour 2: Turbochargers, Engine Performance Metrics
Serrano, 2007

Turbochargers
out
Radial flow – automotive;axial flow – locomotive, marine
0
3
0
3
0
3
TTN
N
pp
TT
mm
corrected
gcorrected
T
S
P1
P2
P03
P0 = P0,in
P3 = Pout
V12/2cP
)()(
inisenout
inoutt TT
TT
14 CEFRC2 June 27, 2012
Hour 2: Turbochargers, Engine Performance Metrics

P
V
TDC BDC
Pexhst
Pintake
Compression
Expansion
Available work(area 5-6-7)
Blowdown
Automotive Turbines
P-V diagram showing available exhaust energy- turbocharging, turbocompounding, bottoming cycles and
thermoelectric generators further utilize this available energy
1
2
3 4
5
678
9
Pamb
6’
Naturally aspirated:Pintake=Pexhst=Patm (5-7-8-9-1)Boosted operation:Negative pumping work:P7<P1 – but hurts scavenging
6’’
CompressorTurbine
0,( )t g in outW m h h 1
0,1
g
goutt g P in t
in
PW m c T
P
15 CEFRC2 June 27, 2012
Hour 2: Turbochargers, Engine Performance Metrics
Reitz & Hoag, 2007

Compressor Selection
To select compressor, first determine engine breathing lines.The mass flow rate of air through engine for a given pressure ratio is:
= IMP = PR * atmospheric pressure (no losses)
= IMT = Roughly constant for given Speed
16 CEFRC2 June 27, 2012
Hour 2: Turbochargers, Engine Performance Metrics
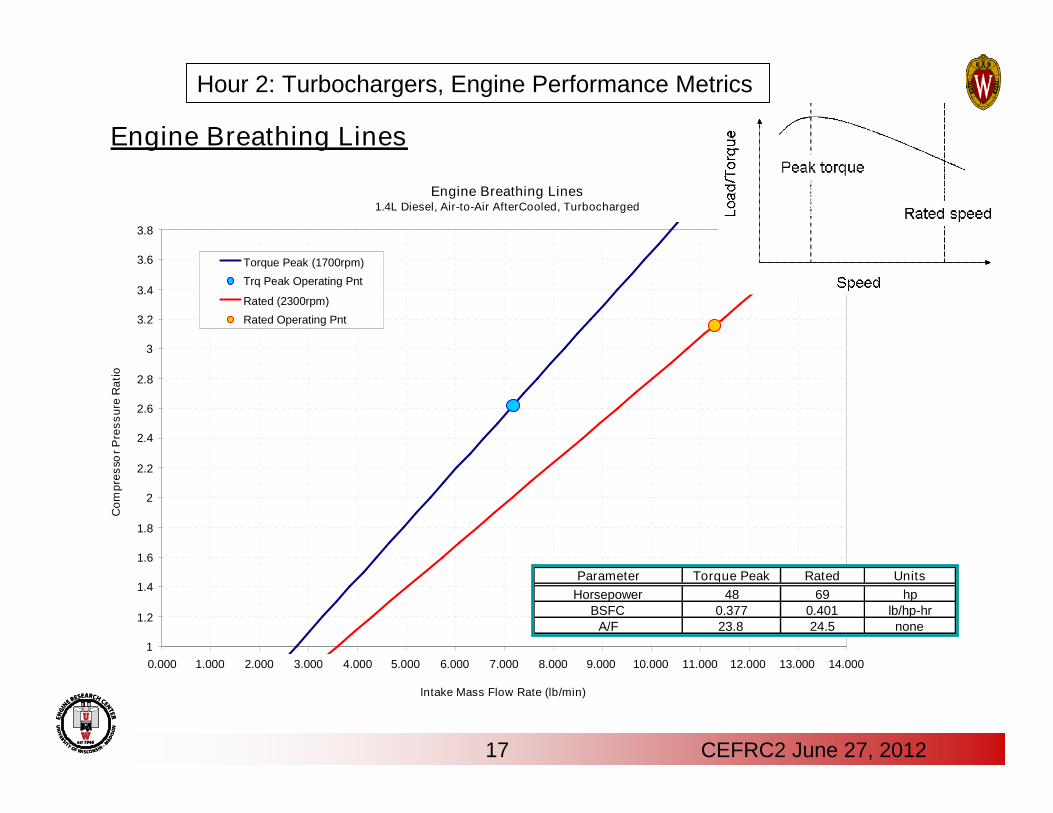
Engine Breathing Lines
Engine Breathing Lines1.4L Diesel, Air-to-Air AfterCooled, Turbocharged
1
1.2
1.4
1.6
1.8
2
2.2
2.4
2.6
2.8
3
3.2
3.4
3.6
3.8
0.000 1.000 2.000 3.000 4.000 5.000 6.000 7.000 8.000 9.000 10.000 11.000 12.000 13.000 14.000
Intake Mass Flow Rate (lb/min)
Com
pres
sorP
ress
ure
Rat
io
Torque Peak (1700rpm)
Trq Peak Operating Pnt
Rated (2300rpm)
Rated Operating Pnt
Parameter Torque Peak Rated UnitsHorsepower 48 69 hp
BSFC 0.377 0.401 lb/hp-hrA/F 23.8 24.5 none
17 CEFRC2 June 27, 2012
Hour 2: Turbochargers, Engine Performance Metrics

1
1
3
4
1
3
1
2 111
a
a
g
g
pp
m
mTCpTCp
pp
mechct
air
fuel
a
g
18 CEFRC2 June 27, 2012
Hour 2: Turbochargers, Engine Performance Metrics
Wt = Wc
. .
Heywood, 1988

Maximum possible closed-cycleefficiency (“ideal efficiency”)
State (1) to (2) isentropic(i.e., adiabatic and reversible)compression from max (V1) tomin cylinder volume (V2)Compression ratio rc = V1/V2.
State (2) to (3) adiabaticand isochoric (constant volume)combustion,State (3) to (4) isentropicexpansion.
State (4) to (1) exhaust process- available energy is rejected- can be converted to mechanicalor electrical work:
Ideal Engine Efficiency – Otto cycle
19 CEFRC2 June 27, 2012
Hour 2: Turbochargers, Engine Performance Metrics
Heywood, 1988

ηideal Function of only two variables, compression ratio (rc)and ratio of specific heats (γ)
Increasing rc increases operating volume for compression and expansionIncreasing γincreases pressure rise during combustion and increases workextraction during expansion stroke.
Both effects result in an increase in net system work for a given energy releaseand thereby increase engine efficiency.
Actual closed-cycle efficiencies to deviate from ideal:
1.) Assumption of isochoric combustion:Finite duration combustion in realistic engines.
Kinetically controlled combustion has shorter combustion duration than diesel or SI- duration limited by mechanical constraints, high pressure rise rates with audible
engine noise and high mechanical stresses2.) Assumption of calorically perfect fluid:
Specific heats decrease with increasing gas temperature; species conversion duringcombustion causes γto decrease
3.) Adiabatic assumption:Large temperature gradient near walls results in energy being lost to heat transferrather than being converted to crank work
20 CEFRC2 June 27, 2012
Hour 2: Turbochargers, Engine Performance Metrics

Other Assumptions:
In engine system models, compressors, supercharger, turbines modeled withconstant isentropic efficiency instead of using performance map.- typically, compressors, superchargers, and fixed geometry turbines have isentropic
efficiencies of 0.7. VGT has isentropic efficiency of 0.65.Charge coolers - intercooler, aftercooler, and EGR cooler modeled with zeropressure drop, a fixed effectiveness of 0.9, constant coolant temperature of 350 K.
21 CEFRC2 June 27, 2012
Hour 2: Turbochargers, Engine Performance Metrics

Zero-dimensional closed-cycle analysis:
Combustion represented as energy addition to closed system
Fuel injection mass addition from user-specified start of injection crank angle(θSOI) and injection duration (Δθinj).
Pressure and mass integrated over the closed portion of cycle with specifiedinitial conditions at IVC of pressure (p0), temperature (T0), and composition(xn,0 for all species considered - N2, O2, Ar, CO2, and H2O) and initial trappedmass (m0), including trapped residual mass
Post-combustion composition determined assuming complete combustion ofdelivered fuel mass.
Minor species resulting from dissociation during combustion not considered
Herold, SAE 2011-01-2216
22 CEFRC2 June 27, 2012
Hour 2: Turbochargers, Engine Performance Metrics

Combustion model - Wiebe function
Heat transfer model - Woschni
First law energy balance: du=dq+pdv
Combustion:
Wall heat transfer:
23 CEFRC2 June 27, 2012
Hour 2: Turbochargers, Engine Performance Metrics
Herold, SAE 2011-01-2216

Friction model
Chen-Flynn model ( SAE 650733).
FMEP = C + (PF*Pmax) + (MPSF*Speedmp)
+ (MPSSF*Speedmp2)
where: C = constant part of FMEP (0.25 bar)
PF = Peak Cylinder Pressure Factor (0.005)
Pmax = Maximum Cylinder Pressure
MPSF = Mean Piston Speed Factor (0.1)
MPSSF = Mean Piston Speed Squared Factor (0)
Speedmp = Mean Piston Speed
BTE*LHV=IMEPg-PMEP-FMEP
DOE goal BTE=55%
Engine brake thermal efficiency BTE
24 CEFRC2 June 27, 2012
Hour 2: Turbochargers, Engine Performance Metrics
0 5 10 15 20 25 3020
30
40
50
60
70
Load -- Gross IMEP [bar]
BT
E[%
]
GIE = 55%GIE = 60%GIE = 65%
PMEP = 0.4 barFMEP = 1 bar
150 bar PCP Limit
UW Dyno limit
UW RCCISCOTEresults(Exp/Sim)
{1 }PMEP FMEPBTE GIEIMEPg
45
55
Chen-Flynn SAE 650733).

Lavoie, 2012
1-D modeling for engine performance analysis – Lavoie et al. (2012)
25 CEFRC2 June 27, 2012
Hour 2: Turbochargers, Engine Performance Metrics

Mid load
26 CEFRC2 June 27, 2012
Hour 2: Turbochargers, Engine Performance Metrics
Lavoie, 2012
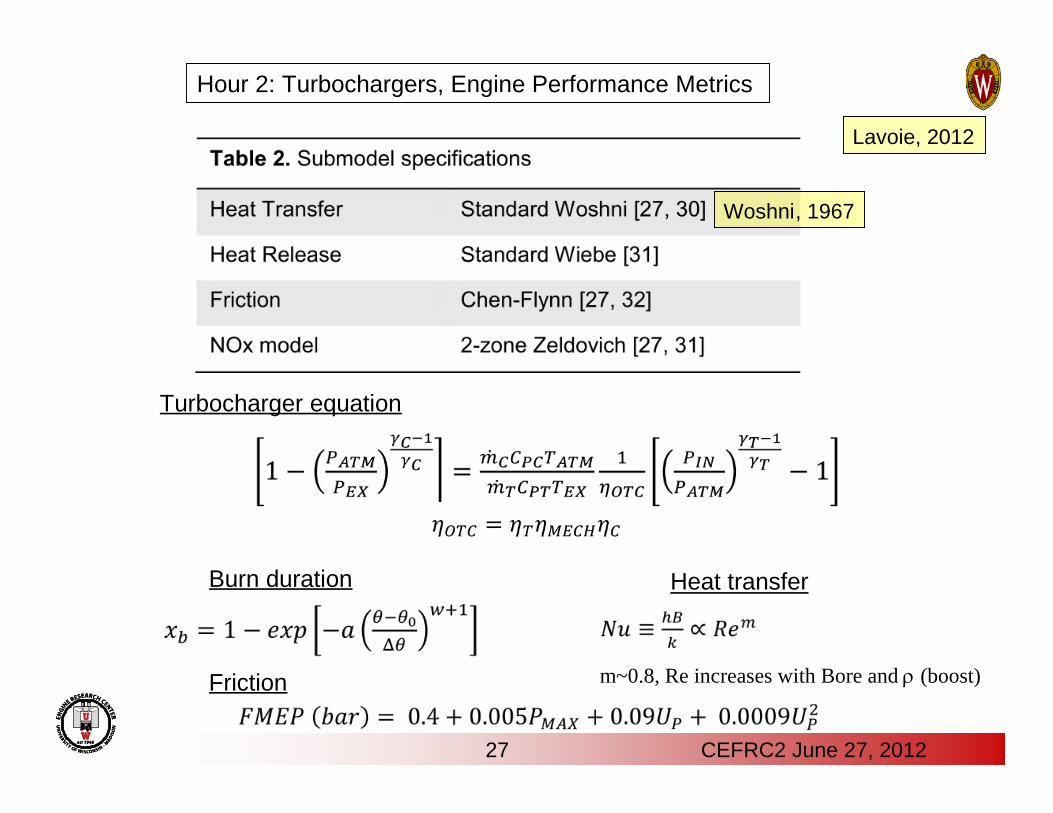
Burn duration Heat transfer
Friction
Turbocharger equation
m~0.8, Re increases with Bore and (boost)
27 CEFRC2 June 27, 2012
Hour 2: Turbochargers, Engine Performance Metrics
Woshni, 1967
Lavoie, 2012
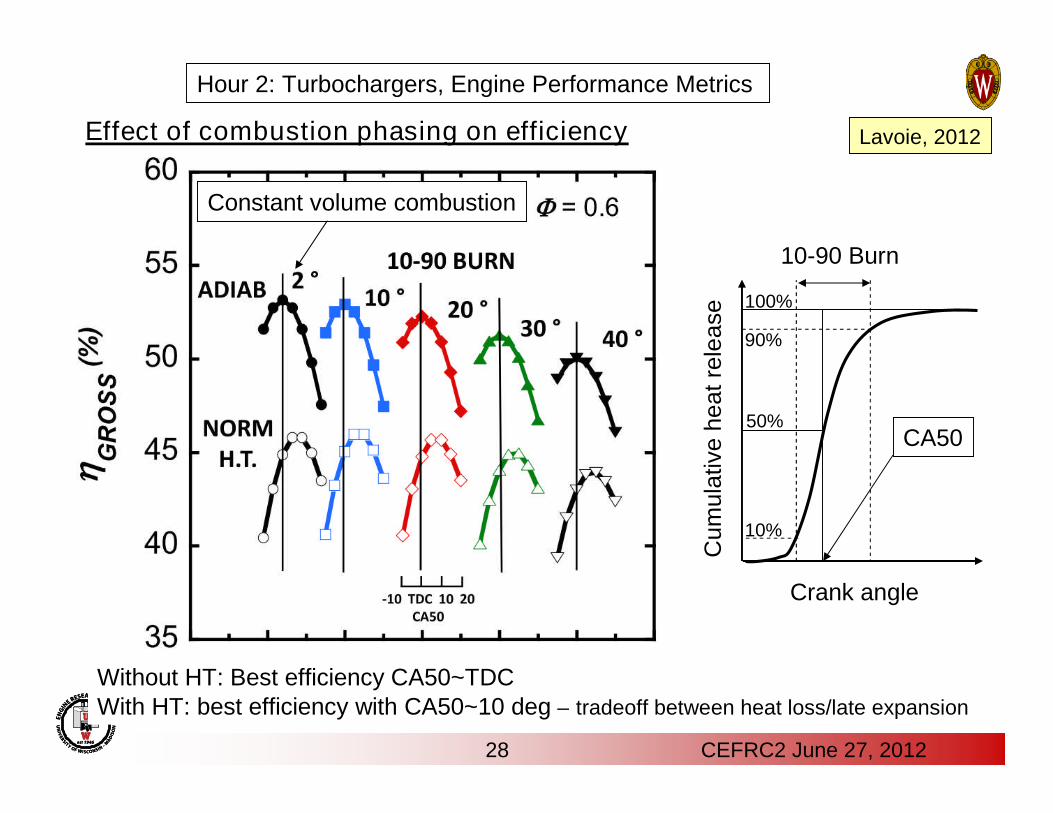
Effect of combustion phasing on efficiency
Constant volume combustion
Without HT: Best efficiency CA50~TDCWith HT: best efficiency with CA50~10 deg – tradeoff between heat loss/late expansion
28 CEFRC2 June 27, 2012
Hour 2: Turbochargers, Engine Performance Metrics
Cum
ulat
ive
heat
rele
ase
Crank angle
10-90 Burn
CA50
10%
50%
90%
100%
Lavoie, 2012
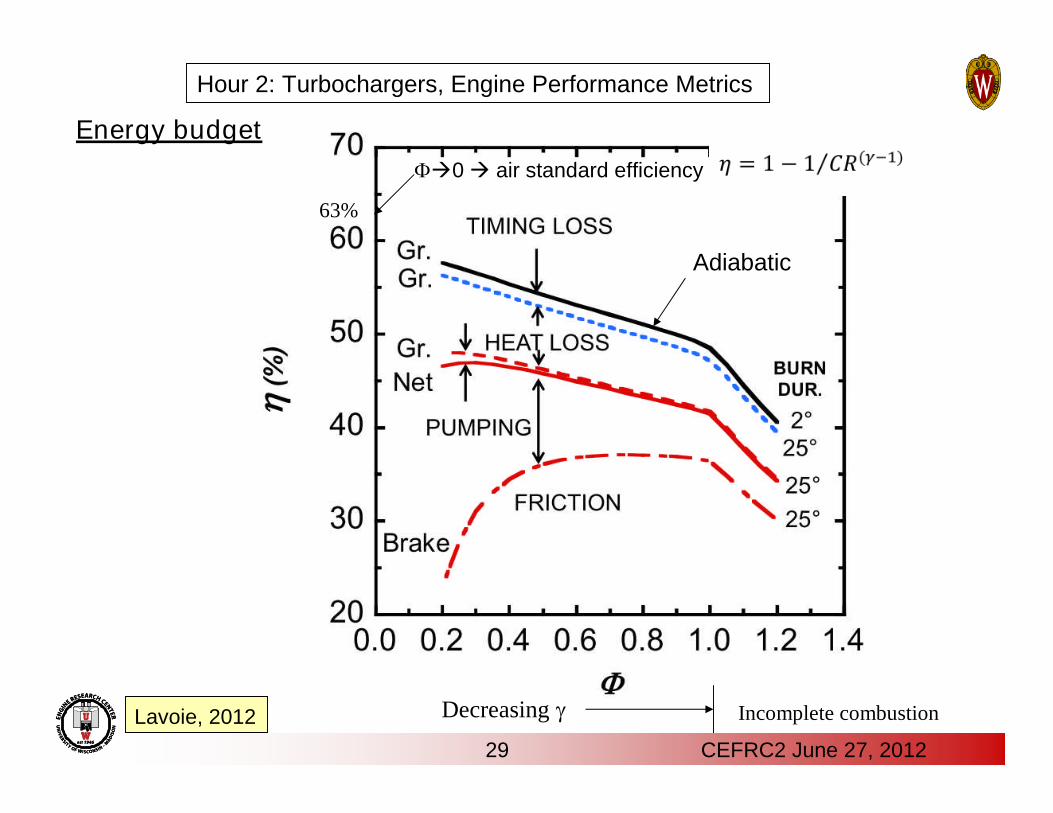
63%
0 air standard efficiency
Adiabatic
Decreasing Incomplete combustion
Energy budget
29 CEFRC2 June 27, 2012
Hour 2: Turbochargers, Engine Performance Metrics
Lavoie, 2012

Fuel-to-charge equivalence ratio, ’
Bur
ned
gas
tem
pera
ture
ranges from 0.2 to 1 with air, EGR ranges from 0 to 80% with =1
Effect of dilution
30 CEFRC2 June 27, 2012
Hour 2: Turbochargers, Engine Performance Metrics
Lavoie, 2012

Effect of boost on efficiency
Reduced heat transfer loss
Reduced friction losses
31 CEFRC2 June 27, 2012
Hour 2: Turbochargers, Engine Performance Metrics
Lavoie, 2012
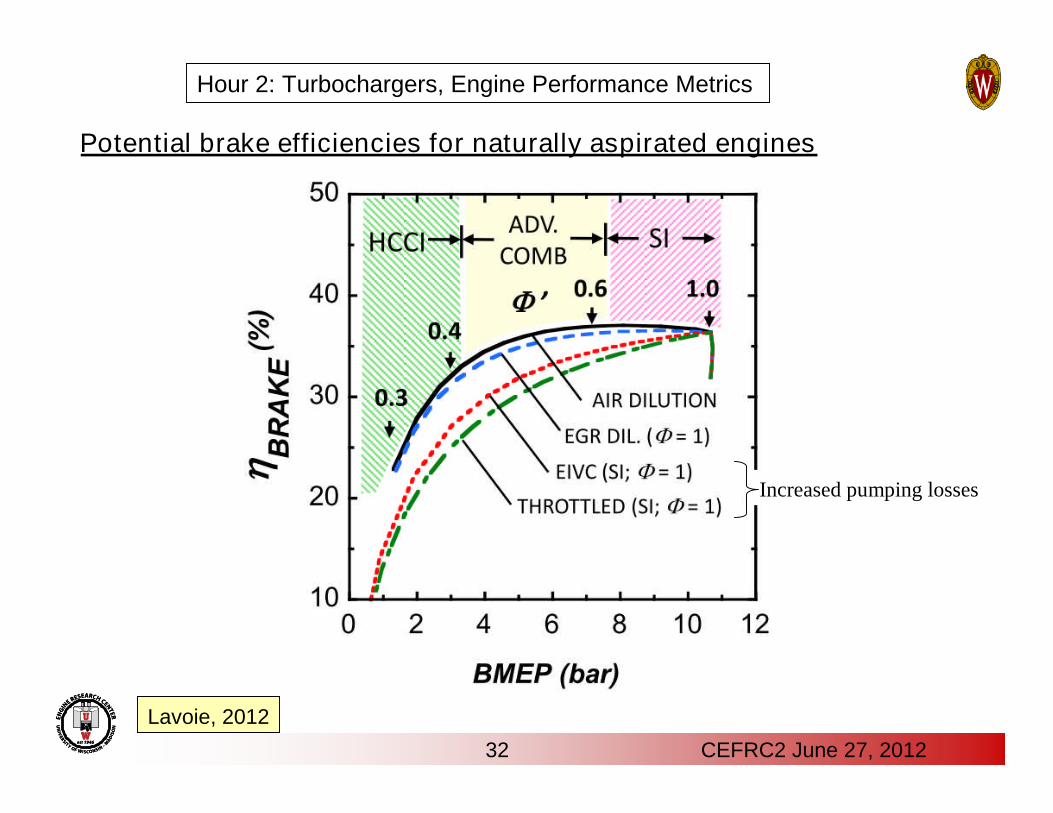
Potential brake efficiencies for naturally aspirated engines
Increased pumping losses
32 CEFRC2 June 27, 2012
Hour 2: Turbochargers, Engine Performance Metrics
Lavoie, 2012

Summary
33 CEFRC2 June 27, 2012
Turbocharging can increase engine efficiency by using available energy in exhaustand by reducing pumping work
Air standard “ideal cycle” analysis provides a bound on engine efficiencyestimates.
0-D engine system models provide estimates of engine system efficiencies,if combustion details (e.g., timing and duration) and heat transfer losses are assumed
The goal of multi-dimensional models (to be discussed next) is to predict thecombustion details
Hour 2: Turbochargers, Engine Performance Metrics


