Reference genes for transcriptional analysis of floweringand fruit ripening stages in apple (Malus 3 domesticaBorkh.)
Pamela Perini • Giancarlo Pasquali • Marcia Margis-Pinheiro •
Paulo Ricardo Dias de Oliviera • Luıs Fernando Revers
Received: 1 November 2013 / Accepted: 24 March 2014
� Springer Science+Business Media Dordrecht 2014
Abstract Apple (Malus 9 domestica Borkh.) is the
most important deciduous tree fruit crop grown around
the world. Comparisons of gene expression profiles
from different tissues, conditions or cultivars are
valuable scientific tools to better understand the gene
expression changes behind important silvicultural and
nutritional traits. However, the accuracy of techniques
employed to access gene expression is dependent on
the evaluation of stable reference genes for data
normalization to avoid statistical significance undue or
incorrect conclusions. The objective of this work was
to select the best genes to be used as references for
gene expression studies in apple trees by reverse
transcription-quantitative polymerase chain reaction
(RT-qPCR). Vegetative and reproductive tissues of
the apple ‘‘Gala’’ cultivar were evaluated during their
seasonal cycle of growth and dormancy. The expres-
sion of 23 traditional housekeeping genes or genes
suggested as constitutive by microarray data was
investigated. Tested combinations of primers allowed
the specific amplification and the generation of
suitable efficiency curves for gene expression studies
by RT-qPCR. Gene stability was determined by two
different statistical descriptors, geNorm and Norm-
Finder. The known variable PAL gene expression was
used to validate selected normalizers. Results obtained
allowed us to conclude that MDH, SAND, THFS,
TMp1 and WD40 are the best reference genes to
accurately normalize the relative transcript abun-
dances using RT-qPCR in various tissues of apple.
Keywords Malus 9 domestica � Apple �RT-qPCR � Reference genes � Gene expression
Abbreviations
ACT2 Actin 2
ACT11 Actin 11
ACTfam Actin family
ARC5 Accumulation and replication of
chloroplast 5
C3HC4 Ring C3HC4 zinc finger protein
CDC48 Cell division cycle protein 48 homolog
CKL Casein kinase 1 isoform delta like
Ct Cycle threshold
Electronic supplementary material The online version ofthis article (doi:10.1007/s11032-014-0078-3) contains supple-mentary material, which is available to authorized users.
P. Perini � G. Pasquali � M. Margis-Pinheiro
Programa de Pos-graduacao em Biologia Celular e
Molecular, Centro de Biotecnologia, Universidade
Federal do Rio Grande do Sul (UFRGS), P.O. Box 15005,
Porto Alegre, RS CEP 91501-970, Brazil
M. Margis-Pinheiro
Departamento de Genetica, Nucleo de Genomica
Funcional de Plantas, UFRGS, P.O. Box 15053, Porto
Alegre, RS CEP 91501-970, Brazil
P. R. D. de Oliviera � L. F. Revers (&)
Laboratorio de Genetica Molecular Vegetal, Embrapa
Uva e Vinho, Rua Livramento 515, P.O. Box 130, Bento
Goncalves, RS CEP 95700-000, Brazil
e-mail: [email protected]
123
Mol Breeding
DOI 10.1007/s11032-014-0078-3
DFCI Dana Farber Cancer Institute and the
Harvard School of Public Health
DLD Dihydrolipoamide dehydrogenase
E Efficiencies
EF1a Elongation factor 1 alpha
EF1b Elongation factor 1 beta
EST Expressed sequence tag
GAPDH Glyceraldehyde 3-phosphate
dehydrogenase
KEA1 K? efflux antiporter 1
M Expression stability
MDH Malate dehydrogenase
miRNAs MicroRNAs
NF Normalization factor
PAL Phenylalanine ammonia-lyase
PCS Phytochelatin synthetase-like protein
PP2A-1 Serine/threonine-protein phosphatase
2A-1
PP2A-A3 Serine/threonine-protein phosphatase 2A
subunit A3
R2 Correlation coefficient
RT-qPCR Reverse transcription-quantitative
polymerase chain reaction
SAGE Serial analysis of gene expression
SAND Protein of unknown function SAND
family
THFS Formate-tetrahydrofolate ligase
Tm Melting temperatures
TMp1 Type 1 membrane protein like
TUBa5 Tubulin alpha 5
TUBb6 Tubulin beta 6
UBC10 Ubiquitin-conjugating enzyme 10
V Pairwise variation
WD40 Transcription factor WD40-like repeat
domain
Introduction
Apple is one of the most widely cultivated tree fruit
and the fourth most economically important following
citrus, grape and banana (Hummer and Janick 2009).
Central Asia is the area of greatest apple diversity and
the center of its origin (Kellerhals 2009). The genus
Malus (family Rosaceae) has 25–30 species, but there
are more than 7,500 known cultivars (Kellerhals
2009). The most important commercially produced
apple cultivars belong to the species Malus 9 domes-
tica Borkh. According to the Food and Agriculture
Organization (FAO) of the United Nations, 75.6
million tons of apples were produced in 2011, being
China, USA, India, Turkey, Poland, Italy, France, Iran,
Brazil, Russian Federation, Chile and Argentina the
major producers (FAO 2012).
Given its cultural and economic importance, apple
has always received much attention from the scientific
community, resulting in considerable progress in
genetic and, more recently, in genomic research. The
recent genome sequencing of the diploid apple cultivar
‘‘Golden Delicious’’ (Velasco et al. 2010) contributed
significantly to more advanced studies on apple and
other Rosaceae or temperate fruit crops. The total
number of genes predicted from the apple genome
reaches more than 57,000, being the highest gene
number reported among plants so far (Velasco et al.
2010). Additionally, the development of genome-wide
genotyping tools combined with different genetic
mapping strategies is providing an unprecedented
advance toward the understanding of the genetic
architecture of agronomical significant traits of this
important perennial crop species (Maric et al. 2010;
Chagne et al. 2012; Kumar et al. 2012).
The most important characters to be genetically
improved in apple and the basis of important genetic
breeding programs are disease resistance (Milcevi-
cova et al. 2010), grafting (Kosina 2010), dormancy
and chilling requirement (Garcia-Banuelos et al. 2009;
Heide and Prestrud 2005), fruit ripening (Wei et al.
2010) and production of nutraceutical compounds
(Łata et al. 2009). The understanding of the expression
patterns and regulation of some key genes responsible
or critically related to such characters may help to
unveil the molecular, biochemical and physiological
mechanisms involved in each of these processes.
Gene expression analysis using large-scale strate-
gies in apple has been done by the generation of
expressed sequence tags (ESTs; Newcomb et al. 2006;
Wisniewski et al. 2008), cDNA-SSH (Norelli et al.
2009), cDNA-AFLP (Baldo et al. 2010) and micro-
arrays (Pichler et al. 2007; Jensen et al. 2009; Soglio
et al. 2009; Sarowar et al. 2011). To validate the results
of such high-throughput techniques and to evaluate
changes in gene expression, reverse transcription-
quantitative polymerase chain reaction (RT-qPCR) is
one of the most widely applied and sensitive methods.
It is also an easily, automated, rapid, and high-
throughput quantitative technology (Bustin 2010).
Precisely because of its high sensitivity, qPCR is also
Mol Breeding
123
very susceptible to variations (Bustin 2010). So, the
publication of the ‘‘Minimum Information for pub-
lication of Quantitative real-time PCR Experiments’’
or ‘‘MIQE guidelines’’ (Bustin et al. 2009) sug-
gested a minimum set of information that research-
ers should provide for their qPCR data, focusing on
the generation of more uniform, comparable and
reliable data.
For RT-qPCR data to be reliable, precise normal-
ization is necessary. Normalization involves reporting
the ratios of mRNA concentrations of the genes of
interest to those of reference genes (Bustin et al. 2009).
The ideal reference genes should be constantly
transcribed in all cell types and tissues independently
of external factors, and their abundance should show
strong correlation with the total amount of mRNA
present in samples (Radonic et al. 2004; Bustin et al.
2009). Genes involved in basic cellular processes,
such as cell structure maintenance or primary metab-
olism, are often chosen as normalizers. However, no
single housekeeping gene is universal for all species or
experiments. Various reports describe the identifica-
tion of reference genes for expression studies using
RT-qPCR in different plant species such as poplar
(Brunner et al. 2004), sugarcane (Iskandar et al. 2004),
Arabidopsis thaliana (Czechowski et al. 2005; Re-
mans et al. 2008), potato (Nicot et al. 2005), grapevine
(Reid et al. 2006), rice (Jain et al. 2006), cotton (Tu
et al. 2007; Artico et al. 2010), soybean (Jian et al.
2008; Kulcheski et al. 2010), tomato (Exposito-
Rodrıguez et al. 2008; Løvdal and Lillo 2009),
Brachypodium distachyon (Hong et al. 2008), Lolium
perenne (Martin et al. 2008), coffee (Barsalobres-
Cavallari et al. 2009), peach (Tong et al. 2009),
cucumber (Wan et al. 2010), logan tree (Lin and Lai
2010), tobacco (Schmidt and Delaney 2010), euca-
lyptus (de Almeida et al. 2010; Cassan-Wang et al.
2012; Oliveira et al. 2012), peanut seed (Jiang et al.
2011) and pepper (Wan et al. 2011). The lack of
information on reference genes for the normalization
of gene expression data in apple prompted us to
evaluate a collection of candidate genes by RT-qPCR,
specifically interested us the analysis of flowering and
fruit ripening stages. Among the conditions tested, our
results indicated that the housekeeping genes encod-
ing MDH, SAND, THFS, TMp1 and WD40 are the best
reference genes to accurately normalize the relative
transcript abundances using RT-qPCR in various
tissues/organs of apple.
Materials and methods
Plant material
Plant material was obtained from 3-year-old clones of
Gala Baigent� apple trees grafted on Marubakaido
rootstock with M.9 as interstem, grown in an exper-
imental orchard at the Temperate Fruit Tree Experi-
mental Station of Embrapa Uva e Vinho, in Vacaria,
RS, Brazil (28�3005000S, 50�5404100W, 972 m altitude).
Ten apple buds, organs or tissues were harvested
through the vegetative and reproductive 2009/2010
cycle following the Fleckinger scale (EPPO 1984):
dormant buds corresponding to the developmental
stage A for pome fruits; buds at initial bursting
(C stage); flower buds at the pink stage (E2 stage);
young leaves (E2 stage); mature leaves (I stage); just-
set fruits, whole with 10 mm in diameter (I stage);
pulp and skin of unripe fruits with 40 mm in diam-
eter (J stage); and pulp and skin of mature fruits
with *70 mm in diameter. Representative pictures of
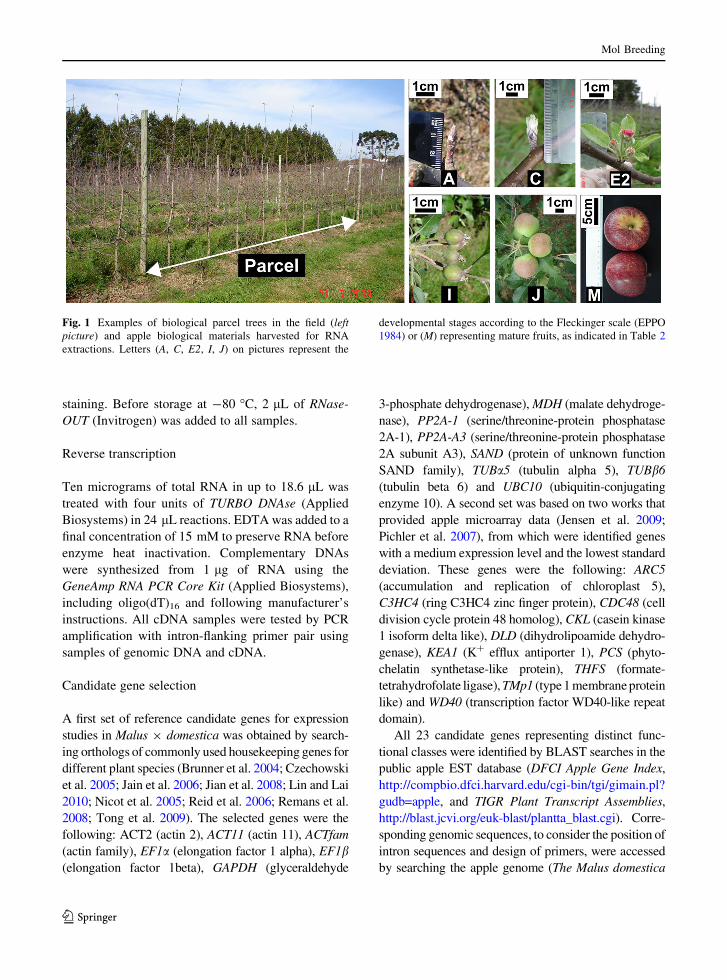
these stages are presented in Fig. 1. Three parcels
of ten clonal trees each were considered as three
biological replicates. From each parcel, equal samples
were harvested from each tree and frozen in liquid
nitrogen in the field and stored at -80 �C until RNA
extraction.
RNA isolation
Total RNA was isolated as described by Reid et al.
(2006), a protocol previously developed by Zeng and
Yang (2002) without the employment of a commercial
kit. Three to eight extractions were conducted in
parallel in microcentrifuge tubes using 10 mg of
powdered plant material and 750 lL of extraction
buffer. After nucleic acid precipitation with sodium
acetate and isopropanol, each sample was dissolved in
water and transferred to a single tube to a final volume
of 500 lL. Following the selective precipitation of
RNA with 2 M lithium chloride and washing, the
RNA precipitate was dissolved in 200 lL TE prepared
with RNase-free reagents. Only RNA samples with
260/280 ratio between 1.8 and 2.0 and 260/230 ratio
greater than 2.0 were used for subsequent analysis.
RNA concentration was estimated by spectrophotom-
etry (GeneQuant Pro, Amersham Biosciences). The
integrity of RNA samples was assessed by 0.85 %
agarose gel electrophoresis and ethidium bromide
Mol Breeding
123
staining. Before storage at -80 �C, 2 lL of RNase-
OUT (Invitrogen) was added to all samples.
Reverse transcription
Ten micrograms of total RNA in up to 18.6 lL was
treated with four units of TURBO DNAse (Applied
Biosystems) in 24 lL reactions. EDTA was added to a
final concentration of 15 mM to preserve RNA before
enzyme heat inactivation. Complementary DNAs
were synthesized from 1 lg of RNA using the
GeneAmp RNA PCR Core Kit (Applied Biosystems),
including oligo(dT)16 and following manufacturer’s
instructions. All cDNA samples were tested by PCR
amplification with intron-flanking primer pair using
samples of genomic DNA and cDNA.
Candidate gene selection
A first set of reference candidate genes for expression
studies in Malus 9 domestica was obtained by search-
ing orthologs of commonly used housekeeping genes for
different plant species (Brunner et al. 2004; Czechowski
et al. 2005; Jain et al. 2006; Jian et al. 2008; Lin and Lai
2010; Nicot et al. 2005; Reid et al. 2006; Remans et al.
2008; Tong et al. 2009). The selected genes were the
following: ACT2 (actin 2), ACT11 (actin 11), ACTfam
(actin family), EF1a (elongation factor 1 alpha), EF1b(elongation factor 1beta), GAPDH (glyceraldehyde
3-phosphate dehydrogenase), MDH (malate dehydroge-
nase), PP2A-1 (serine/threonine-protein phosphatase
2A-1), PP2A-A3 (serine/threonine-protein phosphatase
2A subunit A3), SAND (protein of unknown function
SAND family), TUBa5 (tubulin alpha 5), TUBb6
(tubulin beta 6) and UBC10 (ubiquitin-conjugating
enzyme 10). A second set was based on two works that
provided apple microarray data (Jensen et al. 2009;
Pichler et al. 2007), from which were identified genes
with a medium expression level and the lowest standard
deviation. These genes were the following: ARC5
(accumulation and replication of chloroplast 5),
C3HC4 (ring C3HC4 zinc finger protein), CDC48 (cell
division cycle protein 48 homolog), CKL (casein kinase
1 isoform delta like), DLD (dihydrolipoamide dehydro-
genase), KEA1 (K? efflux antiporter 1), PCS (phyto-
chelatin synthetase-like protein), THFS (formate-
tetrahydrofolate ligase), TMp1 (type 1 membrane protein
like) and WD40 (transcription factor WD40-like repeat
domain).
All 23 candidate genes representing distinct func-
tional classes were identified by BLAST searches in the
public apple EST database (DFCI Apple Gene Index,
http://compbio.dfci.harvard.edu/cgi-bin/tgi/gimain.pl?
gudb=apple, and TIGR Plant Transcript Assemblies,
http://blast.jcvi.org/euk-blast/plantta_blast.cgi). Corre-
sponding genomic sequences, to consider the position of
intron sequences and design of primers, were accessed
by searching the apple genome (The Malus domestica
Fig. 1 Examples of biological parcel trees in the field (left
picture) and apple biological materials harvested for RNA
extractions. Letters (A, C, E2, I, J) on pictures represent the
developmental stages according to the Fleckinger scale (EPPO
1984) or (M) representing mature fruits, as indicated in Table 2
Mol Breeding
123
Ta
ble
1C
and
idat
eap
ple
refe
ren
ceg
enes
,p
rim
erse
qu
ence
san
dam
pli
con
char
acte
rist
ics
eval
uat
edb
yR
T-q
PC
R
Acr
onym
Gen
edes
crip
tion
Acc
essi
on
codea
Forw
ard/r
ever
sepri
mer
sequen
ces
(50 –
30 )
Am
pli
con
size
(bp)
Intr
on
size
(bp)
PC
R
effi
cien
cy
Am
pli
con
Tmb
(�C
)
AC
T2
Act
in2
MD
P0000774288
GC
CA
TC
CA
GG
CT
GT
TC
TC
TC
/
TG
AG
GT
CA
CG
AC
CA
GC
AA
GG
154
78
2.0
986.5
03
AC
T11
Act
in11
MD
P0000921834
MD
P0000652692
GC
TG
TT
CT
TT
CC
CT
CT
AC
GC
/
GC
AT
GG
GG
AA
GA
GC
AT
AT
CC
110
155
1.9
483.2
36
AC
Tfa
mA
ctin
fam
ily
MD
P0000774288
MD
P0000572047
MD
P0000168646
MD
P0000157737
AT
GT
AT
GT
TG
CC
AT
CC
AG
GC
/
AC
GA
CC
AG
CA
AG
GT
CC
AG
AC
156
127
1.8
986.2
09
AR
C5
Acc
um
ula
tion
and
repli
cati
on
of
chlo
ropla
st5
MD
P0000254859
MD
P0000138874
CG
AG
CT
GG
GT
TA
CG
TC
AA
TT
TT
/
CA
GA
TG
CA
CC
AC
TA
CC
AC
CT
G
76
No
1.9
982.3
55
C3H
C4
RIN
GC
3H
C4
zinc
finger
pro
tein
MD
P0000219802
MD
P0000162279
GT
GA
TA
TG
CC
TT
GA
GC
AG
GA
G/
CA
AC
TG
GT
CA
GG
TG
TA
AG
GA
GC
92
91
2.0
383.1
23
CD
C48
Cel
ldiv
isio
ncy
cle
pro
tein
48
hom
olo
g
MD
P0000527728
MD
P0000173662
GC
CA
AT
GT
AC
GT
GA
AA
TC
TT
TG
AC
/
CC
CC
CA
GC
AT
CA
CC
TA
CA
CT
116
No
2.9
0–
c
CK
LC
asei
nkin
ase
1is
ofo
rmdel
ta
like
MD
P0000274900
CA
AG
GA
CT
GA
AA
GC
GG
GA
AC
/
GG
AT
AC
CC
AC
GG
CA
TA
AT
GC
102
122
2.0
481.1
01
DL
DD
ihydro
lipoam
ide
deh
ydro
gen
ase
MD
P0000897124
CC
AC
CT
GC
AT
CG
AG
AA
GC
GT
/
TG
GA
GA
AC
TT
CA
CT
CC
GT
GA
141
514
1.9
686.8
08
EF
1a
Elo
ngat
ion
fact
or
1al
pha
MD
P0000304140
MD
P0000213603
TG
CA
TT
CA
CT
CT
TG
GT
GT
CA
/
GG
TA
GG
AT
GA
GA
CT
TC
CT
TC
116
100
1.9
284.0
71
EF
1b
Elo
ngat
ion
fact
or
1bet
aM
DP
0000903484
MD
P0000189047
MD
P0000626096
MD
P0000661533
MD
P0000596986
AA
GG
CT
TC
TA
CC
AA
GA
AG
AA
GG
A/
TC
CT
CG
AG
CT
TC
TT
CA
TG
TC
95
89
1.9
382.1
38
GA
PD
HG
lyce
rald
ehyde
3-p
hosp
hat
e
deh
ydro
gen
ase
MD
P0000645828
GA
TG
AT
GT
CG
TG
TC
CA
CC
GA
CT
T/
CA
CT
CG
TT
GT
CG
TA
CC
AT
GA
119
93
1.9
584.4
66
KE
A1
Kef
flux
anti
port
er1
MD
P0000165222
MD
P0000244586
TC
TG
TG
GA
TT
TG
GG
CG
AG
TT
/
GA
GC
GT
CC
AA
CT
GC
CA
CT
CT
166
372
2.0
482.9
24
MD
HM
alat
edeh
ydro
gen
ase
MD
P0000197620
MD
P0000170418
MD
P0000174740
CG
TG
AT
TG
GG
TA
CT
TG
GA
AC
/
TG
GC
AA
GT
GA
CT
GG
GA
AT
GA
113
88
1.9
684.1
07
PC
SP
hyto
chel
atin
synth
etas
eli
ke
MD
P0000094767
GG
AG
AT
GG
AC
CC
AA
GC
CA
TG
/
AG
GA
GA
GC
GA
AA
CA
CA
AC
AC
G
100
2,0
34
1.9
784.4
54
PP
2A
-1S
er/t
hr-
pro
tein
phosp
hat
ase
2A
-1
MD
P0000189196
GT
TT
GG
AA
GA
TC
TT
TA
CA
GA
/
GG
AG
AC
AG
CC
CT
CC
AT
GC
AA
92
87
1.9
380.3
56
PP
2A
-
A3
Ser
/thr-
pro
tein
phosp
hat
ase
2A
-A3
MD
P000029099
TT
TG
GC
CC
TG
AA
TG
GG
CA
AT
/
TG
GA
GA
AT
CG
TC
AT
CC
GA
TA
92
90
1.7
4–
c
SA
ND
Pro
tein
of
unknow
nfu
nct
ion
SA
ND
fam
ily
MD
P0000185470
MD
P0000202305
MD
P0000088431
TA
CT
AA
TG
TG
CA
AA
CA
CA
AG
/
TG
AT
TC
TG
AT
GC
CA
TG
AC
AA
AG
T
85
84
1.9
682.4
89
TH
FS
Form
ate-
tetr
ahydro
fola
te
ligas
e
MD
P0000182376
MD
P0000622972
MD
P0000604460
MD
P0000722369
AG
CA
GC
GT
TG
AA
TA
CT
CA
GA
G/
AT
AC
TG
GG
TT
TT
CG
CC
AT
GC
99
380
1.9
883.4
93
TM
p1
Type
1m
embra
ne
pro
tein
like
MD
P0000241680
AG
AC
CG
AC
TC
AA
TG
TT
GC
TC
TC
A/
GT
GG
AA
GG
TG
GT
GC
AA
AT
CC
73
No
2.0
083.2
51
Mol Breeding
123

Genome, http://genomics.research.iasma.it/), or com-
pared with A. thaliana genome (The Arabidopsis Infor-
mation Resource, http://www.arabidopsis.org/).
Primer design and efficiency tests
Primers were designed using Primer3 v.0.4.0 software
(http://frodo.wi.mit.edu/primer3/) with melting tem-
peratures (Tm) of 58–61 �C, primer lengths of
20–24 bp, 40–60 % GC content, amplicon lengths of
70–170 bp, and tested using OligoAnalyzer IDT soft-
ware (http://www.idtdna.com/analyzer/applications/
oligoanalyzer/). Primer pairs for ARC5 and TMp1
were taken from the literature (Jensen et al. 2009).
Accession numbers, gene description, primer sequen-
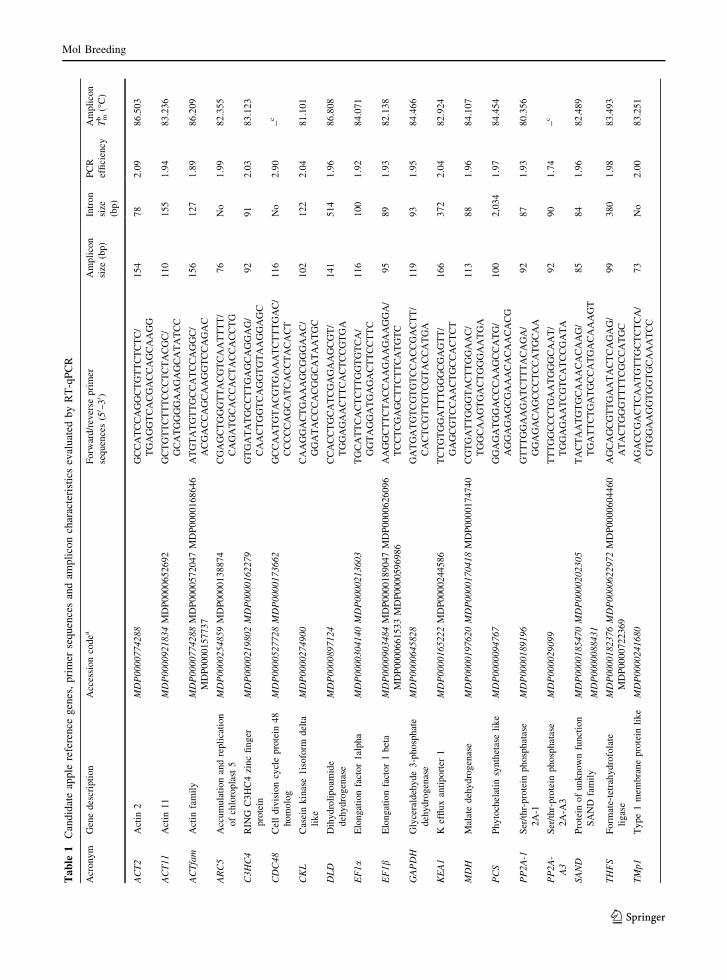
ces, amplicon lengths and whether a region was con-
sidered are shown in Table 1. All primer pairs
produced a single product as inspected in the resulting
melting curve after RT-qPCR (Supplementary data
S1). Exceptions were EF1a, EF1b, KEA1 and TUBb6.
Primer pair specificity to target genes was additionally
checked by sequencing the purified amplicons. Tm of
each amplicon is also shown in Table 1.
In order to evaluate primer efficiency, a standard
curve was constructed with five points in a fivefold
dilution series starting from a 1/5 sample concentra-
tion ([1/5], [1/25], [1/125], [1/625], [1/3,125]). Primer
efficiency (E) and correlation coefficient (R2) were
calculated using StepOne Software v.2.1 (Applied
Biosystems). PCR amplification efficiencies were
calculated for each candidate endogenous control with
the formula E = 10-1/slope, using the slope of the plot,
Ct (cycle threshold) versus log input of cDNA. It was
used an equivalent mixture of the representative
samples as input material for the dilution series, as
recommended by Derveaux et al. (2010). The esti-
mated PCR efficiencies are presented in Table 1.
Primers were synthesized by IDT-Integrated DNA
Technologies.
Quantitative PCR
Polymerase chain reactions were performed in a
StepOnePlusTM Real-Time PCR System (Applied
Biosystems). SYBR Green (Ambion�, 1:10,000 dilu-
tion) was used to monitor dsDNA synthesis, and ROX
(19) was employed as passive fluorescence reference.
Reactions were performed in 20 lL volumes contain-
ing 10 lL of the diluted cDNA (1:100), 200 nM ofTa
ble
1co
nti
nu
ed
Acr
onym
Gen
edes
crip
tion
Acc
essi
on
codea
Forw
ard/r
ever
sepri
mer
sequen
ces
(50 –
30 )
Am
pli
con
size
(bp)
Intr
on
size
(bp)
PC
R
effi
cien
cy
Am
pli
con
Tmb
(�C
)
TU
Ba5
Tubuli
nal
pha
5M
DP
0000832105
MD
P0000681201
TT
TG
AT
GT
AC
AG
AG
GA
GA
TG
/
AT
GC
CG
CA
CT
TG
AA
CC
CA
GT
117
91
1.9
885.4
11
TU
Bb
6T
ubuli
nbet
a6
MD
P0000951799
MD
P0000754298
MD
P0000321157
GA
AT
GC
AG
AT
GA
GT
GT
AT
GG
/
GA
CA
CC
AG
AC
AT
GG
TT
GC
AG
127
211
1.9
783.9
94
UB
C10
Ubiq
uit
in-c
onju
gat
ing
enzy
me
10
MD
P0000140755
TT
GA
AG
GA
GC
AG
TG
GA
GT
CC
/
GC
AC
CA
AT
GG
AT
CA
TC
CG
GG
97
267
1.9
983.7
88
WD
40
Tra
nsc
ripti
on
fact
or
WD
40-
like
repea
tdom
ain
MD
P0000230683
MD
P0000168479
GG
AT
TT
AC
TG
TG
TT
GG
TG
AA
G/
TG
CC
AA
TT
AC
CT
CC
TT
TT
CG
TG
102
1,4
36
2.0
180.5
86
aA
cces
sion
codes
of
pre
dic
ted
tran
scri
pts
in‘‘
Malu
s9
dom
esti
cagen
om
e’’
dat
abas
e(h
ttp:/
/gen
om
ics.
rese
arch
.ias
ma.
it/)
use
dto
support
pri
mer
des
ign.
Ital
iciz
edM
DP
sin
dic
ate
pre
dic
ted
gen
e
tran
scri
pts
targ
eted
by
the
pri
mer
pai
rsaf
ter
sequen
cing
of
the
puri
fied
ampli
cons
bT
min
dic
ates
the
mel
ting
tem
per
ature
det
erm
ined
by
the
mel
ting
curv
est
epof
the
ampli
fica
tion
pro
gra
mc
Am
pli
fica
tion
dis
regar
ded
bec
ause
of
PC
Ref
fici
ency
Mol Breeding
123

each primer, 50 lM of each dNTP, 0.2 units of
AmpliTaq Gold Polymerase (Applied Biosystems),
19 Buffer Solution (Applied Biosystems) and 2 mM
MgCl2 (Applied Biosystems). Each biological sample
was analyzed in technical triplicates, and no-template
controls were included. RT-qPCR assays were con-
ducted with the following cycling: 95 �C for 10 min to
enzyme activation, 40 amplification cycles of 95 �C
for 15 s and 60 �C for 1 min, and a final dissociation
curve between 60 and 95 �C.
Gene expression stability analyses
The stability of each candidate gene expression
through samples was analyzed using geNorm version
3.5 (Vandesompele et al. 2002) and NormFinder
(Andersen et al. 2004) software. NormFinder only
ranks candidate genes by their stability (minor value
corresponds to a more stable expression) and suggests
the two best normalizers for different group compar-
isons. The geNorm algorithm also determines the
optimal number of genes required for normalization,
by calculating the pairwise variation (V), which
measures the effect of adding further reference genes
in the normalization factor (NF). Vandesompele et al.
(2002) suggested a value of 0.15 as V value cut-off,
below which the inclusion of an additional reference
gene would not be required. The number of cycles
needed for the amplification-associated fluorescence to
reach a specific threshold level of detection (the Ct
value) is known to be inversely correlated with the
amount of nucleic acid that was in the original sample
(Walker 2002). For analyses in both programs, the Ct
values were converted into quantities by employing the
comparative Ct method, where each sample Ct is
subtracted from the lowest Ct (DCt), and then
Q = 2DCt, where 2 represents 100 % of amplification
efficiency (Livak and Schmittgen 2001). For each
analysis, the sample presenting the lowest Ct was used
as calibrator to calculate DCt.
Reference gene validation
To demonstrate how the use of different reference genes
can affect the normalization of the expression data for a
gene of interest, the mean expression of a target gene
between different biological samples was calculated.
The expression of the phenylalanine ammonia-lyase
(PAL—EC:4.3.1.5) gene was evaluated by RT-qPCR.
PAL primer pair was designed as described above and
defined as GGCATTTGGAGGAGAACTTG and
AGAACCTTGAGGGGTGAAGC. The employment
of this primer pair allowed the amplification of
three genes from Malus 9 domestica genome:
MDP0000261492, MDP0000191304, MDP0000388769
(accession code in http://genomics.research.iasma.it/).
PCR exhibited an efficiency of 2.02, producing a
108-bp amplicon with a Tm of 83.81 �C, flanking an
estimated 81-bp intron. The expression of the target
PAL gene was normalized using four different strate-
gies, as stated in the ‘‘Results’’ section. The relative
expression of the target gene was calculated using the
2-DDCt method (Livak and Schmittgen 2001), consid-
ering amplification efficiency as 2. Three independent
biological samples were used as described in ‘‘Plant
material’’ section. When two or more genes were
employed for normalization, the average PAL relative
expression values were obtained for each sample tissue,
for each individual reference gene, and then, the stan-
dard error was calculated. The level of steady-state PAL
mRNAs in dormant buds was employed as calibrator
and set to 1.
Results
RT-qPCR analysis of putative apple reference
genes
In order to select a reliable set of reference genes for
apple gene expression studies, RT-qPCR assays based
on SYBR Green (Invitrogen) detection were per-
formed with 13 commonly used housekeeping genes
(ACT2, ACT11, ACTfam, EF1a, EF1b, GAPDH,
MDH, PP2A-1, PP2A-A3, SAND, TUBa5, TUBb6
and UBC10; see ‘‘Materials and methods’’ for gene
identities and references) and other 10 potential
normalizers deduced from public data from micro-
array hybridization analyses (ARC5, C3HC4, CDC48,
CKL, DLD, KEA1, PCS, THFS, TMp1 and WD40).
The list of tested genes, their identities and amplicon
characteristics are presented in Table 1. The majority
of the primer pairs targeted a single gene within a
given gene family with the exceptions of C3CH4,
EF1a, MDH and THFS that targeted two identical
predicted gene models as indicated in Table 1. Despite
the use of multiple predicted gene models to design the
primer pair for the actin gene family, sequencing of the
Mol Breeding
123
amplicons revealed that ACTfam primer pair targeted
the same transcript of ACT2 but in a different position.
Primer pairs designed for all candidate genes were
evaluated according to their efficiencies (E) employing
a standard curve with serial dilutions of apple tissue
cDNA pools. The correlation coefficient (R2) for all
resulting amplification curves was higher than 0.99,
and 21 out of the 23 primer pairs allowed amplification
efficiencies between 1.89 and 2.04 (Table 1). Consid-
ering that the optimal PCR efficiency is 100 % or 2,
when the whole target cDNA would be duplicated at
every PCR cycle during the exponential phase, the
efficiency values obtained were therefore considered
acceptable. Hence, the amplification products of each
reaction were comparable to each other. Notwith-
standing, primer pairs designed for PP2A-A3 and
CDC48 genes were discarded because of their low or
overestimated efficiencies during the respective reac-
tions. EF1a, EF1b, KEA1 and TUBb6 genes were also
excluded from the analysis due to unexpected ampli-
fication products (Supplementary data S1). Thus, 17
genes were further evaluated.
Ct values (Walker 2002) were used to analyze the
steady-state mRNA levels of each gene in ten different
apple buds, organs or tissues: dormant buds, buds at
initial bursting, flower buds at pink stage, young and
mature leaves, just-set fruits, pulp and skin of unripe
fruits, and pulp and skin of mature fruits (Supplemen-
tary data S2, Fig. 1; a more precise definition of bud
and fruit stages is presented in ‘‘Materials and
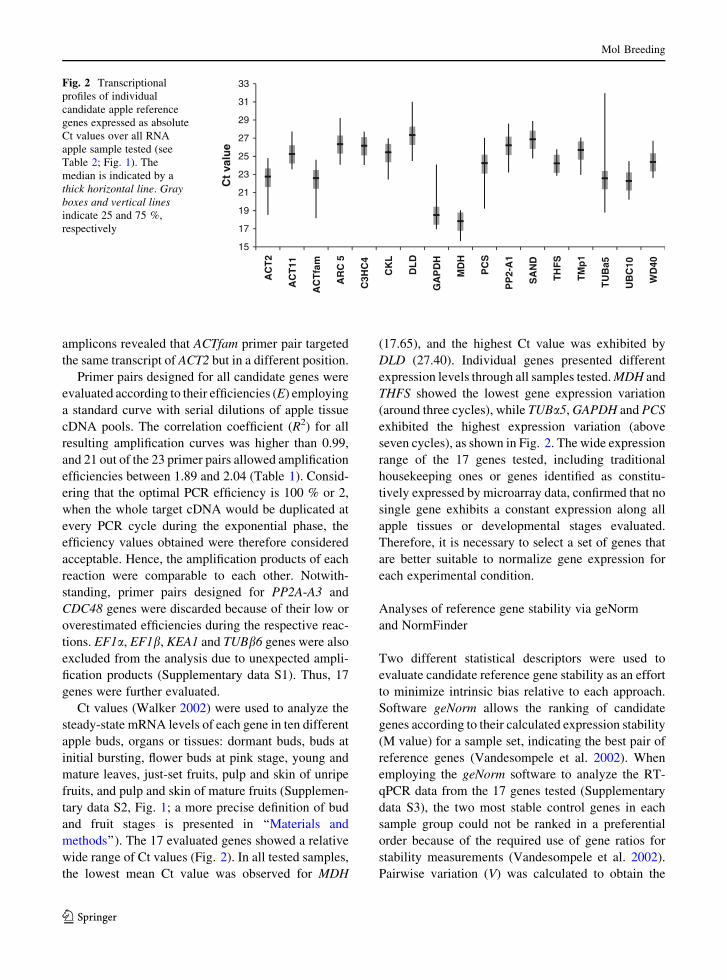
methods’’). The 17 evaluated genes showed a relative
wide range of Ct values (Fig. 2). In all tested samples,
the lowest mean Ct value was observed for MDH
(17.65), and the highest Ct value was exhibited by
DLD (27.40). Individual genes presented different
expression levels through all samples tested. MDH and
THFS showed the lowest gene expression variation
(around three cycles), while TUBa5, GAPDH and PCS
exhibited the highest expression variation (above
seven cycles), as shown in Fig. 2. The wide expression
range of the 17 genes tested, including traditional
housekeeping ones or genes identified as constitu-
tively expressed by microarray data, confirmed that no
single gene exhibits a constant expression along all
apple tissues or developmental stages evaluated.
Therefore, it is necessary to select a set of genes that
are better suitable to normalize gene expression for
each experimental condition.
Analyses of reference gene stability via geNorm
and NormFinder
Two different statistical descriptors were used to
evaluate candidate reference gene stability as an effort
to minimize intrinsic bias relative to each approach.
Software geNorm allows the ranking of candidate
genes according to their calculated expression stability
(M value) for a sample set, indicating the best pair of
reference genes (Vandesompele et al. 2002). When
employing the geNorm software to analyze the RT-
qPCR data from the 17 genes tested (Supplementary
data S3), the two most stable control genes in each
sample group could not be ranked in a preferential
order because of the required use of gene ratios for
stability measurements (Vandesompele et al. 2002).
Pairwise variation (V) was calculated to obtain the
15
17
19
21
23
25
27
29
31
33
AC
T2
AC
T11
AC
Tfa
m
AR
C 5
C3H
C4
CK
L
DL
D
GA
PD
H
MD
H
PC
S
PP
2-A
1
SA
ND
TH
FS
TM
p1
TU
Ba5
UB
C10
WD
40
Ct
valu
e
Fig. 2 Transcriptional
profiles of individual
candidate apple reference
genes expressed as absolute
Ct values over all RNA
apple sample tested (see
Table 2; Fig. 1). The
median is indicated by a
thick horizontal line. Gray
boxes and vertical lines
indicate 25 and 75 %,
respectively
Mol Breeding
123

optimal number of normalization factors, and those
values are also presented in Supplementary data S3 to
reach the cut-off value of 0.15.
The geNorm program developers recommend
M values below the threshold of 1.5 to identify genes
with stable expression (Vandesompele et al. 2002).
Gutierrez et al. (2008a) proposed a maximum M value
of 0.5 for more accurate and confident results. Besides,
it is recommended an optimal number of genes
required for normalization, indicated by pairwise
variation (V; Vandesompele et al. 2002). Therefore,
we found that the top-ranked gene pair was sufficient
to normalize test gene expression in each sample set
(Supplementary data S3 Table 3, V2/3 \ 0.15), except
for the combination of all samples and the combina-
tion of all fruit samples. In these two cases, the use of
four reference genes is recommended (Supplementary
data S3, V4/5 \ 0.15).
The NormFinder software uses a mathematical
model that enables the estimation of gene expression
based not only on the overall variation of reference
genes but also on the variation among subgroups of
sample sets (Andersen et al. 2004). Results concerning
our candidate apple reference genes, after processing
RT-qPCR data by NormFinder, are shown in Supple-
mentary data S4. Considering that best genes are those
with the lowest stability value according to Norm-
Finder developers, with minimal intra- and intergroup
variation, these were ranked at the top in Supplemen-
tary data S4. In addition, NormFinder allowed us to
indicate the best combination of gene pairs to
normalize subgroups within each sample set (Supple-
mentary data S4).
Taking all our results together, the first important
observation was that the five best reference genes
identified for apple gene expression studies by geNorm
and NormFinder were the same: THFS, MDH, SAND,
TMp1 and WD40. These five genes were pointed out as
best references when employing either geNorm or
NormFinder when all samples were considered,
including different developmental stages or tissues
of buds, flowers, leaves and fruits, without subgroups.
This is a robust result that increases the reliability of
our data and experimental design since based on
distinct statistic algorithms; there were no discrepan-
cies between software outputs.
When only dormant buds and buds at initial
bursting were analyzed, ARC5, MDH and WD40
genes were coincident in both approaches as having
stability values below 0.2, although PCS and THFS
would be the best gene pair combination for normal-
ization according to NormFinder alone. For gene
expression investigation in apple young and mature
leaves, the ACT11 and TMp1 genes were coincident in
both approaches for proper normalization of data
according to both software. In addition, MDH or THFS
could also be alternatively used.
As NormFinder accepts the definition of subgroups,
some sample sets were differently considered from
those established by geNorm, especially when fruits
were investigated. This was mainly due to the fact that
the same fruit sample included different developmen-
tal stages and tissues. Considering all fruit samples, it
was possible to find out that SAND, THFS, ACT11 and
WD40 were the best reference genes among the top
ranking genes based on the two strategies of analysis.
When the goal was the comparison of unripe and
mature fruits, regardless of the tissue evaluated, two
geNorm analyses were performed. In both analyses,
the ACT2, CKL, DLD, SAND and TMp1 genes
presented high and common stable expressions.
According to the NormFinder output, the top five
more stable genes were CKL, DLD, SAND, THFS and
TMp1. Therefore, taking into account both results, we
assumed the combination of the four recurrent genes
CKL, DLD, SAND and TMp1 as the best options for
normalization in gene expression analysis of apple
fruit development.
ARC5, CKL, PCS, TMp1 and SAND were the five
most stable genes according to the geNorm analysis of
skin and pulp tissues considering both unripe and
mature apple fruits. Considering the NormFinder
analysis, CKL, THFS and SAND were the top-ranked
genes. As mentioned previously, geNorm stability
values below the threshold of 0.5 are indicative of
good normalizers (Gutierrez et al. 2008a). Thus, since
both CKL and SAND genes reached this criterion, they
were selected as best references to normalize test gene
expression in apple fruit pulp and skin, regardless of
the fruit developmental stage. Additionally, ARC5
may also be included as reference gene. In order to
summarize all results, the best genes for each sample
set are compiled and presented in Table 2.
Validation of apple reference genes
The expression of an apple gene encoding phenylal-
anine ammonia-lyase (PAL) was analyzed by RT-
Mol Breeding
123

qPCR in order to validate the best candidate genes as
internal normalizers. According to the apple gene
expression database available at Dana Farber Cancer
Institute and the Harvard School of Public Health
(DFCI; http://compbio.dfci.harvard.edu/tgi/), PAL
gene expression is quite variable among different plant
tissues and stages of development. In this database,
ESTs corresponding to PAL gene (accession code
TC60080) were described for 23 different apple tis-
sues or organ libraries. According to DFCI database,
PAL ESTs corresponded to about 0.06 % of the ESTs
present in apple bud libraries, 0.08 and 0.10 % in
leaves and fruit libraries, respectively. PAL steady-
state mRNA levels were therefore measured by RT-
qPCR in all apple organs and tissues previously
assayed and normalized using four different strategies:
(1) with all candidate reference genes individually; (2)
with the two most stable reference genes selected by
NormFinder (SAND and THFS); (3) with the two most
stable reference genes identified by geNorm (MDH
and THFS); (4) with the four most stable reference
genes suggested by both analyses (MDH, SAND,
THFS and TMp1).
When single genes were individually used as
references for normalizing PAL relative expression,
a large fluctuation of results was observed (Supple-
mentary data S5). For example, as shown in Fig. 3, the
variation of PAL mRNA levels using MDH, SAND or
THFS individually as reference genes leads to a wide
variation in the relative expression of the test gene.
Since we are dealing with relative expression values, it
is understandable that PAL mRNA levels would vary
according to the reference gene employed for normal-
ization. Even using good reference genes, they cannot
show similar trends in the relative expression of a
target gene when studying distinct sampling condi-
tions. Then, PAL expression profiles in each apple
tissue or organ tested varied widely according to the
reference gene chosen for normalization. For instance,
while PAL exhibited an increased expression of about
eightfold in buds at initial bursting in comparison with
dormant buds when mRNA levels were normalized by
SAND, such conclusion was not equivalent when the
MDH or THFS genes were individually employed as
reference (Fig. 3). Similar inconsistent results were
observed in all other tissues and organs, as shown in
Fig. 3 and in Supplementary data S5.
When the best combinations of reference genes
were evaluated for the normalization of PAL relative
expression in all tested apple samples, a much more
reliable expression profile of PAL was obtained, as
shown in Fig. 3 and in Supplementary data S5. THFS
was considered one of the most stable genes by both
geNorm and NormFinder, and PAL expression in
relation to it was consistent with that obtained with the
employment of the two best reference genes indicated
by geNorm. Interestingly, PAL expression profile
normalized by the best gene pair according to
NormFinder was equivalent to that obtained when
the four best reference genes of both software were
taken. However, we must be careful to note that THFS
alone or pairs of genes indicated by one or other
software may have different outcomes depending on
the set of biological samples analyzed.
Discussion
Since the advent of high-throughput methods such as
the serial analysis of gene expression (SAGE),
microarrays and deep sequencing to evaluate gene
expression, RT-qPCR is considered the gold standard
technique for accurate, sensitive and fast measurement
of gene expression and, therefore, validation of
expression results (Derveaux et al. 2010). However,
the use of appropriate, robust validation in all
measurements of steady-state mRNA levels with
trustable reference genes is very important and
advisable (Gutierrez et al. 2008b). Traditional house-
keeping genes have been proved to lack real consti-
tutive expression over all tested sample conditions,
Table 2 Compilation of results of the geNorm and Norm-
Finder analyses indicating the best combination of reference
genes for Malus gene expression by RT-qPCR according to
samples studied
Apple samples Reference genes
All samples THFS, MDH, SAND,
TMp1, WD40
Buds (dormant buds and at initial
bursting)
ARC5, MDH, WD40
Leaves (young and mature) ACT11, TMp1, MDH,
THFS
All fruit samples SAND, THFS, ACT11,
WD40
Fruit development (unripe and
mature)
CKL, DLD, SAND, TMp1
Fruit tissues (pulp and skin) CKL, SAND, ARC5
Mol Breeding
123

and additionally, reference genes validated for certain
studies are not applicable to other species or exper-
imental conditions (Brunner et al. 2004; Jain et al.
2006; Løvdal and Lillo 2009; Tong et al. 2009).
To select the best genes to be used as references for
gene expression studies by RT-qPCR in apple trees,
we searched for commonly used housekeeping genes
and also for potential normalizer genes whose patterns
of stable expression were deduced from available
microarray data. The strategy of using data from
expression libraries as source to identify candidate
reference genes is a very interesting one and has
already been applied to some plant species. The use of
tomato (Lycopersicum esculentum) EST databases
was one of the first reported for this purpose (Coker
and Davies 2003). The exceptionally large set of data
from microarrays also provides opportunity to identify
new reference genes, as it has been taken as an
application perspective for such assays (Clarke and
Zhu 2006). Such approach has also been done for the
model plant species A. thaliana (Czechowski et al.
2005), Eucalyptus grandis (Oliveira et al. 2012) and
wheat (Long et al. 2010). In order to look for the best
reference genes for expression studies in apple, we
searched available data from two previous studies.
Pichler et al. (2007) carried out a microarray analysis
of the variability of gene expression in summer and
autumn buds from field-grown apple trees. Jensen
et al. (2009) carried out an analysis of gene expression
patterns in summer shoot tips of ‘‘Gala’’ scions grafted
on seven different rootstocks grown in greenhouses.
From these two works, genes with an average expres-
sion level and the lowest standard deviation were
selected as candidate normalizers.
Twenty-three candidate reference genes chosen
represent distinct cellular functional classes includ-
ing cytoskeleton (ACT2, ACT11, ACTfam, TUBa5,
TUBb6), transport of vesicles (CKL) or ions (KEA1),
transport in vacuoles (SAND) or membranes (TMp1),
glucose metabolism (GAPDH and MDH), protein
metabolism (DLD, EF1a, EF1b and UBC10) or that of
nucleic acids (THFS and WD40), cell signaling
(C3HC4, PP2-A1 and PP2A-A3), cell division
(CDC48) or division of organelles (ARC5), and metal
detoxification (PCS). The expression of ribosomal
RNAs, such as 18S rRNA, was not evaluated because
of their high transcriptional level, unlike most genes of
interest. The use of these genes as reference could add
deviations in relative quantifications of target genes
(Vandesompele et al. 2002). Furthermore, genes
encoding rRNAs can only be used as references when
the approach of the work is based on total RNA
samples; when purified mRNA is the source of
templates for PCR, rRNA is eliminated (Vandesomp-
ele et al. 2002).
In order to define the expression stability of apple
candidate reference genes in the context of our
sample conditions, we used two of the most employed
0,03
0,06
0,13
0,25
0,50
1,00
2,00
4,00
8,00
16,00
dormantbuds
buds atinitial
bursting
flower budsat pinkstage
youngleaves
matureleaves
just-setfruits
skin ofunripe fruit
pulp ofunripe fruit
skin ofmature fruit
pulp ofmature fruit
Rel
ativ
e ex
pre
ssio
n o
f P
AL
(lo
g 2
)
MDH SAND THFS MDH and THFS SAND and THFS MDH, SAND, THFS and TMp1
Fig. 3 Relative expression levels of phenylalanine ammonia-
lyase (PAL) in different apple samples, normalized by different
combinations of reference genes, as indicated. MDH and THFS
were the two most stable reference genes selected by geNorm,
while SAND and THFS were indicated by NormFinder. The four
most stable reference genes were suggested by both analyses.
Standard error bars are indicated
Mol Breeding
123
algorithms for such purpose, geNorm (Vandesompele
et al. 2002) and NormFinder (Andersen et al. 2004).
Comparing different statistical approaches to select
normalizing genes allowed a better assessment of the
most reliable references, decreased the risk of selec-
tion of co-regulated genes and also excluded one gene
fostering over another because of the tendency of
some algorithm. The most prominent observation after
completing the two analyses was that both statistical
algorithms produced similar gene ranking for all
samples or subgroups tested. They enabled us to
indicate MDH, SAND, THFS, TMp1 and WD40 as the
most reliable reference genes when all apple samples
were considered, and to affirm that two or three
specific gene combinations are the ideal ones and
sufficient to normalize and test gene expression in
apple. Note, however, that THFS and WD40 belong to
the same functional class; then, they should not be
used together (Vandesompele et al. 2002).
An interesting point worth to mention is that, for
every apple sample set considered, at least one
traditional housekeeping gene and one new reference
gene were recognized as the most stable ones. Such
observation reinforced our assumption about the
potential use of expression data derived from microarray
or EST libraries as sources of information to reveal
promising candidate reference genes. In addition,
recently, the first investigation concerning the suitability
of microRNAs (miRNAs) as internal control transcripts
in plants was presented (Kulcheski et al. 2010). Then,
approaches like this might also provide adequate
controls for normalization of gene expression data.
According to our observations and those of other
authors, there is not a single universal reference gene
for all experimental conditions or plant species under
evaluation at the level of gene expression (Brunner
et al. 2004; Dheda et al. 2005; Jain et al. 2006; Løvdal
and Lillo 2009; Tong et al. 2009; Vandesompele et al.
2002), but for related species, some similarities are
found. Expression analyses of candidate reference
genes in potato (Nicot et al. 2005), tobacco (Schmidt
and Delaney 2010) and peanut seeds (Jiang et al.
2011), for instance, revealed that EF1a was a suitable
reference gene, while genes encoding actin or tubulin
were not good ones. When expression studies in rice
(Jain et al. 2006) and wheat (Long et al. 2010) are
compared, EF1a is again present among the most
stable genes, and GAPDH has been described as one of
the worst reference genes for these Poaceae species.
However, 18S and 25S rRNA encoding genes are
stable in rice but not in wheat. Our results may be
compared to those obtained by RT-qPCR studies in
peach (Tong et al. 2009), a fruit species also belonging
to the Rosaceae family. GAPDH transcripts exhibited
poor stability both in peach (Tong et al. 2009) and in
apple (Supplementary data S3 and S4).
Finally, we emphasize that putative reference genes
need to be investigated and validated for each sample
data. Specific normalizers make the data reliable, in
any technology, including RT-qPCR, and avoid sta-
tistical significance undue or incorrect conclusions
and characterizations, as exemplified here by PAL
gene relative expression.
Conclusions
Traditional housekeeping genes or genes suggested to
be constitutive by microarray data were evaluated as
potential references for gene expression studies in
vegetative and reproductive tissues and organs of
apple. MDH, SAND, THFS, TMp1 and WD40 were
found to be the most stable and suitable normalizers
for all apple tissue expression analyses by RT-qPCR.
Specific combinations of two or three control genes
were shown to be sufficient to normalize each apple
sample set analyzed.
Acknowledgments We thank Vanessa Buffon for technical
assistance, and Diogo Denardi Porto and Vıtor da Silveira
Falavigna for helpful contributions on the manuscript. We also
gratefully acknowledge our colleague Dr. Joao Caetano
Fioravanco for his assistance in the sampling strategy and for
the management of the experimental apple orchards. This work
was supported by ‘‘Financiadora de Estudos e Projetos’’ (FINEP,
Ministry of Science and Technology—MCT [grant number
01.10.0303.00]) and ‘‘Empresa Brasileira de Pesquisa
Agropecuaria’’ (EMBRAPA grant number 02.07.07.007.00.03),
Brazil. P. Perini was recipient of a M.Sc. fellowship from the
‘‘Coordenacao de Aperfeicoamento de Pessoal de Nıvel Superior’’
(CAPES, Ministry of Education), Brazil. M. Margis-Pinheiro and
G. Pasquali are recipients of research fellowships from the
‘‘Conselho Nacional de Desenvolvimento Cientıfico e
Tecnologico’’ (CNPq, MCT [Grant Numbers 306945/2009-6
and 311361/2009-9, respectively).
References
Andersen CL, Jensen JL, Ørntoft TF (2004) Normalization of
real-time quantitative reverse transcription-PCR data: a
model-based variance estimation approach to identify
Mol Breeding
123

genes suited for normalization, applied to bladder and
colon cancer data sets. Cancer Res 64:5245–5250
Artico S, Nardeli SM, Brilhante O, Grossi-de-Sa MF, Alves-
Ferreira M (2010) Identification and evaluation of new
reference genes in Gossypium hirsutum for accurate nor-
malization of real-time quantitative RT-PCR data. BMC
Plant Biol 10:49–60
Baldo A, Norelli JL, Farrell RE, Bassett CL, Aldwinckle HS,
Malnoy M (2010) Identification of genes differentially
expressed during interaction of resistant and susceptible
apple cultivars (Malus 9 domestica) with Erwinia amy-
lovora. BMC Plant Biol 10:1
Barsalobres-Cavallari CF, Severino FE, Maluf MP, Maia IG
(2009) Identification of suitable internal control genes for
expression studies in Coffea arabica under different
experimental conditions. BMC Mol Biol 10:1
Brunner AM, Yakovlev IA, Strauss SH (2004) Validating
internal controls for quantitative plant gene expression
studies. BMC Plant Biol 4:14–20
Bustin SA (2010) Why the need for qPCR publication guide-
lines?—The case for MIQE. Methods 50:217–226
Bustin SA, Benes V, Garson JA, Hellemans J, Huggett J, Ku-
bista M, Mueller R et al (2009) The MIQE guidelines:
minimum information for publication of quantitative real-
time PCR experiments. Clin Chem 55:611–622
Cassan-Wang H, Soler M, Yu H, Camargo EL, Carocha V,
Ladouce N, Savelli B, Paiva JA, Leple JC, Grima-Pettenati
J (2012) Reference genes for high-throughput quantitative
reverse transcription-PCR analysis of gene expression in
organs and tissues of Eucalyptus grown in various envi-
ronmental conditions. Plant Cell Physiol 53:2101–2116
Chagne D, Crowhurst RN, Troggio M, Davey MW, Gilmore B,
Lawley C, Vanderzande S et al (2012) Genome-wide SNP
detection, validation, and development of an 8 K SNP
array for apple. PLoS ONE 7:e31745
Clarke JD, Zhu T (2006) Microarray analysis of the transcrip-
tome as a stepping stone towards understanding biological
systems: practical considerations and perspectives. Plant J
45:630–650
Coker JS, Davies E (2003) Selection of candidate housekeeping
controls in tomato plants using EST data. Biotechniques
35:740–748
Czechowski T, Stitt M, Altmann T, Udvardi MK (2005) Gen-
ome-wide identification and testing of superior reference
genes for transcript normalization. Plant Physiol 139:5–17
de Almeida MR, Ruedell CM, Ricachenevsky FK, Sperotto RA,
Pasquali G, Fett-Neto AG (2010) Reference gene selection
for quantitative reverse transcription-polymerase chain
reaction normalization during in vitro adventitious rooting
in Eucalyptus globulus Labill. BMC Mol Biol 11:73–84
Derveaux S, Vandesompele J, Hellemans J (2010) How to do
successful gene expression analysis using real-time PCR.
Methods 50:227–230
Dheda K, Huggett JF, Chang JS, Kim LU, Bustin SA, Johnson
MA, Rook GAW et al (2005) The implications of using an
inappropriate reference gene for real-time reverse tran-
scription PCR data normalization. Anal Biochem 344:
141–143
EPPO (European and Mediterranean Plant Protection Organi-
zation) (1984) EPPO crop growth stage keys—apple and
pear. EPPO Bull 14:291–294
Exposito-Rodrıguez M, Borges AA, Borges-Perez A, Perez JA
(2008) Selection of internal control genes for quantitative
real-time RT-PCR studies during tomato development
process. BMC Plant Biol 8:131–142
FAO (Food and Agriculture Organization of the United Nations)
(2012) Food and Agriculture Organization of the United
Nations—FAOSTAT
Garcia-Banuelos ML, Gardea AA, Winzerling JJ, Vazquez-
Moreno L (2009) Characterization of a midwinter-expressed
dehydrin (DHN) gene from apple trees (Malus 9 domestica).
Plant Mol Biol Rep 27:476–487
Gutierrez L, Mauriat M, Guenin S, Pelloux J, Lefebvre J-F,
Louvet R, Rusterucci C et al (2008a) The lack of a sys-
tematic validation of reference genes: a serious pitfall
undervalued in reverse transcription-polymerase chain
reaction (RT-PCR) analysis in plants. Plant Biotechnol J
6:609–618
Gutierrez L, Mauriat M, Pelloux J, Bellini C, Van Wuytswinkel
O (2008b) Towards a systematic validation of references in
real-time RT-PCR. Plant Cell 20:1734–1735
Heide OM, Prestrud AK (2005) Low temperature, but not pho-
toperiod, controls growth cessation and dormancy induc-
tion and release in apple and pear. Tree Physiol 25:109–114
Hong S-Y, Seo PJ, Yang M-S, Xiang F, Park C-M (2008)
Exploring valid reference genes for gene expression studies
in Brachypodium distachyon by real-time PCR. BMC Plant
Biol 8:112–122
Hummer KE, Janick J (2009) Rosaceae: taxonomy, economic
importance, genomics. In: Folta KM, Gardiner SE (eds)
Plant genetics and genomics vol 6: genetics and genomics
of Rosaceae (p 636). Springer, New York, pp 1–17
Iskandar HM, Simpson RS, Casu RE, Bonnett GD, Maclean DJ,
Manners JM (2004) Comparison of reference genes for
quantitative real-time polymerase chain reaction analysis
of gene expression in sugarcane. Plant Mol Biol Rep 22:
325–337
Jain M, Nijhawan A, Tyagi AK, Khurana JP (2006) Validation
of housekeeping genes as internal control for studying gene
expression in rice by quantitative real-time PCR. Biochem
Bioph Res Com 345:646–651
Jensen PJ, Makalowska I, Altman N, Fazio G, Praul C, Max-
imova SN, Crassweller RM et al (2009) Rootstock-regu-
lated gene expression patterns in apple tree scions. Tree
Genet Genomes 6:57–72
Jian B, Liu B, Bi Y, Hou W, Wu C, Han T (2008) Validation of
internal control for gene expression study in soybean by
quantitative real-time PCR. BMC Mol Biol 9:59–72
Jiang S, Sun Y, Wang S (2011) Selection of reference genes in
peanut seed by real-time quantitative polymerase chain
reaction. Int J Food Sci Tech 46:2191–2196
Kellerhals M (2009) Introduction to apple (Malus 9 domes-
tica). In: Folta KM, Gardiner SE (eds) Plant genetics and
genomics vol 6: genetics and genomics of Rosaceae (p.
636). Springer, New York, pp 73–84
Kosina J (2010) Effect of dwarfing and semi dwarfing apple
rootstocks on growth and productivity of selected apple
cultivars. Hortic Sci 37:121–126
Kulcheski FR, Marcelino FC, Nepomuceno AL, Abdelnoor RV,
Margis R (2010) The use of microRNAs as reference genes
for quantitative polymerase chain reaction in soybean.
Anal Biochem 406:185–192
Mol Breeding
123
Kumar S, Chagne D, Bink MCAM, Volz RK, Whitworth C,
Carlisle C (2012) Genomic selection for fruit quality
traits in apple (Malus 9 domestica Borkh.). PLoS ONE
7:e36674
Łata B, Trampczynska A, Paczesna J (2009) Cultivar variation
in apple peel and whole fruit phenolic composition. Sci
Hortic 121:176–181
Lin YL, Lai ZX (2010) Reference gene selection for qPCR
analysis during somatic embryogenesis in longan tree.
Plant Sci 178:359–365
Livak KJ, Schmittgen TD (2001) Analysis of relative gene
expression data using real-time quantitative PCR and the
2(-delta deltaC(T)) method. Methods 25:402–408
Long X-Y, Wang J-R, Ouellet T, Rocheleau H, Wei Y-M, Pu
Z-E, Jiang Q-T et al (2010) Genome-wide identification
and evaluation of novel internal control genes for Q-PCR
based transcript normalization in wheat. Plant Mol Biol
74:307–311
Løvdal T, Lillo C (2009) Reference gene selection for quantitative
real-time PCR normalization in tomato subjected to nitrogen,
cold, and light stress. Anal Biochem 387:238–242
Maric S, Lukic M, Cerovic R, Mitrovic M, Boskovic R (2010)
Application of molecular markers in apple breeding.
Genetika 42:359–375
Martin RC, Hollenbeck VG, Dombrowski JE (2008) Evaluation
of reference genes for quantitative RT-PCR in Lolium
perenne. Crop Sci 48:1881–1887
Milcevicova R, Gosch C, Halbwirth H, Stich K, Hanke M-V,
Peil A, Flachowsky H et al (2010) Erwinia amylovora-
induced defense mechanisms of two apple species that
differ in susceptibility to fire blight. Plant Sci 179:60–67
Newcomb R, Crowhurst RN, Gleave AP, Rikkerink EHA, Allan
AC, Beuning LL et al (2006) Analyses of expressed
sequence tags from apple. Plant Physiol 141:147–166
Nicot N, Hausman JF, Hoffmann L, Evers D (2005) House-
keeping gene selection for real-time RT-PCR normaliza-
tion in potato during biotic and abiotic stress. J Exp Bot
56:2907–2914
Norelli JL, Farrell RE Jr, Bassett CL, Baldo AM, Lalli DA,
Aldwinckle HS, Wisniewski ME (2009) Rapid transcrip-
tional response of apple to fire blight disease revealed by
cDNA suppression subtractive hybridization analysis. Tree
Genet Genomes 5:27–40
Oliveira LA, Breton MC, Bastolla FM, Camargo SS, Margis R,
Frazzon J, Pasquali G (2012) Reference genes for the
normalization of gene expression in Eucalyptus species.
Plant Cell Physiol 53:405–422
Pichler FB, Walton EF, Davy M, Triggs C, Janssen B, Wunsche
JN, Putterill J et al (2007) Relative developmental, envi-
ronmental, and tree-to-tree variability in buds from field-
grown apple trees. Tree Genet Genomes 3:329–339
Radonic A, Thulke S, Mackay IM, Landt O, Siegert W, Nitsche
A (2004) Guideline to reference gene selection for quan-
titative real-time PCR. Biochem Biophys Res Commun
313:856–862
Reid K, Olsson N, Schlosser J, Peng F, Lund S (2006) An opti-
mized grapevine RNA isolation procedure and statistical
determination of reference genes for real-time RT-PCR dur-
ing berry development. BMC Plant Biol 6:27–37
Remans T, Smeets K, Opdenakker K, Mathijsen D, Vangrons-
veld J, Cuypers A (2008) Normalisation of real-time RT-
PCR gene expression measurements in Arabidopsis thali-
ana exposed to increased metal concentrations. Planta
227:1343–1349
Sarowar S, Zhao Y, Soria-Guerra RE, Ali S, Zheng D, Wang D,
Korban SS (2011) Expression profiles of differentially regu-
lated genes during the early stages of apple flower infection
with Erwinia amylovora. J Exp Bot 62:4851–4861
Schmidt GW, Delaney SK (2010) Stable internal reference
genes for normalization of real-time RT-PCR in tobacco
(Nicotiana tabacum) during development and abiotic
stress. Mol Genet Genomics 283:233–241
Soglio V, Costa F, Molthoff JW, Weemen-Hendriks WMJ,
Schouten HJ, Gianfranceschi L (2009) Transcription ana-
lysis of apple fruit development using cDNA microarrays.
Tree Genet Genomes 5:685–698
Tong Z, Gao Z, Wang F, Zhou J, Zhang Z (2009) Selection of
reliable reference genes for gene expression studies in
peach using real-time PCR. BMC Mol Biol 10:71–83
Tu L, Zhang X, Liu D, Jin S, Cao J, Zhu L, Deng F et al (2007)
Suitable internal control genes for qRT-PCR normalization
in cotton fiber development and somatic embryogenesis.
Chin Sci Bull 52:3110–3117
Vandesompele J, De Preter K, Pattyn F, Poppe B, Van Roy N,De Paepe A, Speleman F (2002) Accurate normalization of
real-time quantitative RT-PCR data by geometric averag-
ing of multiple internal control genes. Genome Biol 3:1–12
Velasco R, Zharkikh A, Affourtit J, Dhingra A, Cestaro A,
Kalyanaraman A, Fontana P et al (2010) The genome of the
domesticated apple (Malus 9 domestica Borkh.). Nat
Genet 42:833–839
Walker NJ (2002) A technique whose time has come. Science
296:557–559
Wan H, Zhao Z, Qian C, Sui Y, Malik AA, Chen J (2010)
Selection of appropriate reference genes for gene expres-
sion studies by quantitative real-time polymerase chain
reaction in cucumber. Anal Biochem 399:257–261
Wan H, Yuan W, Ruan M, Ye Q, Wang R, Li Z, Zhou G et al
(2011) Identification of reference genes for reverse tran-
scription quantitative real-time PCR normalization in
pepper (Capsicum annuum L.). Biochem Biophys Res
Commun 416:24–30
Wei J, Ma F, Shi S, Qi X, Zhu X, Yuan J (2010) Changes and
postharvest regulation of activity and gene expression of
enzymes related to cell wall degradation in ripening apple
fruit. Postharvest Biol Technol 56:147–154
Wisniewski M, Bassett C, Norelli J, Macarisin D, Artlip T,
Gasic K, Korban S (2008) Expressed sequence tag analysis
of the response of apple (Malus 9 domestica ‘Royal
Gala’) to low temperature and water deficit. Physiol
Plantarum 133:298–317
Zeng Y, Yang T (2002) RNA isolation from highly viscous
samples rich in polyphenols and polysaccharides. Plant
Mol Biol Report 20:417a–417e
Mol Breeding
123


