
TA7 W34m no. GL- 85- 27
REFERENCE
/ •
• v /
)
I • I
I - - -
~
-
S-C E-CProperty of the United States Government
MISCELLANEOUS PAPER GL-85-27
RELIABILITY OF THE FLEXIBLE PAVEMENT DESIGN MODEL
by
John C. Potter
Geotechnical Laboratory
DEPARTMENT OF THE ARMY Waterways Experiment Station , Corps of Engineers
PO Box 631 , Vicksburg, Mississippi 39180-0631
BOOKS ARE ACCOUNTABLE PROPERTY CHARGED TO AN INDIVIDUAL BY NAME. PLEASE DO NOT LEND TO OntERS WITHOUT CLEARlNQ YOURSELF.
September 1985
Final Report
Approved For Public Release; Distribution Unlimtted
UBRARY BRANCH TECHNICAL INFORMATION CENTER
US ARMY ENGINEO WATERWAYS EXPERIMENT STATION VICKSBURG. MISSISSIPPI
Prepared tor DEPARTMENT OF THE ARMY Assistant Secretary of the Army (R&D)
Washington, DC 20315
under ILIA Project No. 4A161101A91D, Task 02, Work Unit 160

If+ l
-Unclassified
SECURITY CLASSIFICATION OF TH IS PAGE ( When Detlt Entered) ~
REPORT DOCUMENT AT ION PAGE I READ INSTRUCTIONS I
l BEFORE COMPLETING FORM 1. REPORT NUMBER
2. GOVT ACCESSIO N N O. J RECIP I E NT' S C A T A LOG N U M BER
Miscellaneous Paper GL-85-27 TITLE (tmd Subtitle) -4 .
TYPE OF REPORT & PERIOD COV ERED '
RELIABILITY OF THE FLEXIBLE PAVEMENT Final report DESIGN MODEL
6 PERFORMING ORG. REPORT NUMBER
7. A UTHOR(e) 8 CONTRAC T O R GRANT N U M BER(B)
John c. Potter
9 . PERFORMING ORGANIZATION NAM E AND ADDRESS 10. PROG R AM ELEM E NT,PR OJE-..T, TASK
us Army Engineer Waterways Experiment Station AREA & WORK U N IT NUMBEP';
Geotechnical Laboratory ILIR Project 4A16110 1A91D PO Box 631, Vicksburg, Mississippi 39180-0631 Task 02, Work Unit 160
1 1 • CONTROLLING OFFICE NAME AND ADDRESS '2. REPORT DATE
DEPARTMENT OF THE ARMY September 1985 Assistant Secretary of the Army (R&D) 13. NUMBER OF PAGES
Washington, DC 20315 18 ;
14 MONITORI NG AGENCY NAME a ADDRESS(If dffferent from Contro lling Olft c e) 15 SECU RITY CL ASS ('-1 thl e repo rt)
Unclassified
ISe DECLASSIFICATION DOWN G RADI NG SCHEDULE
16. DISTRIBUTION ST ATEMENT (olthl e Report)
Approved for public release; distribution unlimited.
17. DISTRIBUTION STATEMENT (of the ebeltect entered In Block 20, ff different from Report)
18 . SUPPLEM E N T A RY NOTES
Available from National Technical Information Service , 5285 Port Royal Road, Spr ingfield , Virginia 22161.
19 KEY WORDS (Continue on reveree •Ide If nece e•ary 111nd Identify by block number) CBR equat l.on Flexibl e pavemen t Pavement design Probabilit y Reliabil i t y
20 . ABSrRACr (Cammue an ,..,..r_ e l tl» II .. ec-eaq a:td lderulfy by block numbe r)
The design of flexible pavements by the US Army Corps of Engineers is cur r ently based on t he Califor nia bear i ng ratio (CBR) curve. The CBR curve is empirical , and t he current design approach is determinis t ic. A probabilis t ic approach , providing more reliable designs a t potentially lower costs, can be developed from the current design procedure, except t:hat t he reliability of the CBR curve is unce rtain . This study was undertaken to establish t he reli-abili t y of the current CBR- based flexible pavement design model , using existing
(Continued)
Unclassified DO FOR ..
\ JIUt 7l 1413 E DtnON OF t N O V 65 IS O B SOLETE
SECU R ITY CL ASSIFIC A TION OF T H IS P A GE ( lll'h..., D ete Entered)

Unclassified ------------------SECURITY CLASSIFICATION D•-:__T._H_IS_P_A;..;G_E.;.(Wh_., __ D_•_t•_E_n_t_e_r•_d;..) ________________________ .,.
20. ABSTRACT (Continued).
data from accelerated traffic tests. found to be 50 percent , excluding the design parameters .
The reliability of the design model was effects of conservative estimates of the
Uncl assi fied SE CU R I T Y CL A SSIFICATION OF THIS PAGE( When D a t a Entered)
Preface
This study was conducted by the Geotechnical Laboratory (GL) , US Army
Engineer Waterways Experiment Station (WES) during the period February 1984
through September 1985. It was sponsored by the Assistant Secretary of the
Army (R&D) under the In-House Laboratory Independent Research (ILIR) Program
as Project No. 4A161101A91D, Task Area 02, Work Unit 160.
The study was conducted under the general supervision of Dr. W. F.
Marcuson III, Chief, GL ; Mr. H. H. Ulery, Jr., Chief, Pavement Systems Divi
sion (PSD); Mr. H. L . Green, Chief , Engineering Analysis Group; and Mr. D. M.
Ladd, Chief, Criteria Development Unit. The study was conducted by
Dr . John C. Potter, PSD, who is the author of the paper. A critical review of
the paper was provided by Mr. R. G. Ahlvin, a consultant. This report was
edited by Mr. Robert A. Baylot, Jr., Publications and Graphic Arts Division.
The Commanders and Directors of WES during this study were
COL Tilford C. Creel, CE, and COL Robert C. Lee , CE; Technical Director was
Mr. Fred R. Brown. During the publication of this report, COL Allen F. Grum,
USA, was Director of WES; Dr. Robert W. Whalin was Technical Director.
1

Preface •
Conversion Units of
Background
Purpose •
Scope
Review
• •
•
•
•
•
•
• Analysis
Conclusions
References
Tables 1-2
Figures 1-6
• • • • • • •
Factors , Non- SI Measurement •
• • • • • • •
• • • • • • •
• • • • • • •
• • • • • • •
• • • • • • •
• • • • • • •
• • • • • • •
• • • •
t o SI • • • •
• • • •
• • • •
• • • •
• • • •
• • • •
• • • •
• • • •
Contents
• • • • • • • • • •
(Metric) • • • • • • • • • •
• • • • • • • • • •
• • • • • • • • • •
• • • • • • • • • •
• • • • • • • • • •
• • • • • • • • • •
• • • • • • • • • •
• • • • • • • • • •
2
• • • • • •
• • • • • •
• • • • • •
• • • • • •
• • • • • •
• • • • • •
• • • • • •
• • • • • •
• • • • • •
• • •
• • •
• • •
• • •
• • •
• • •
• • •
• • •
• • •
Page
1
3
4
5
5
5
8
9
10
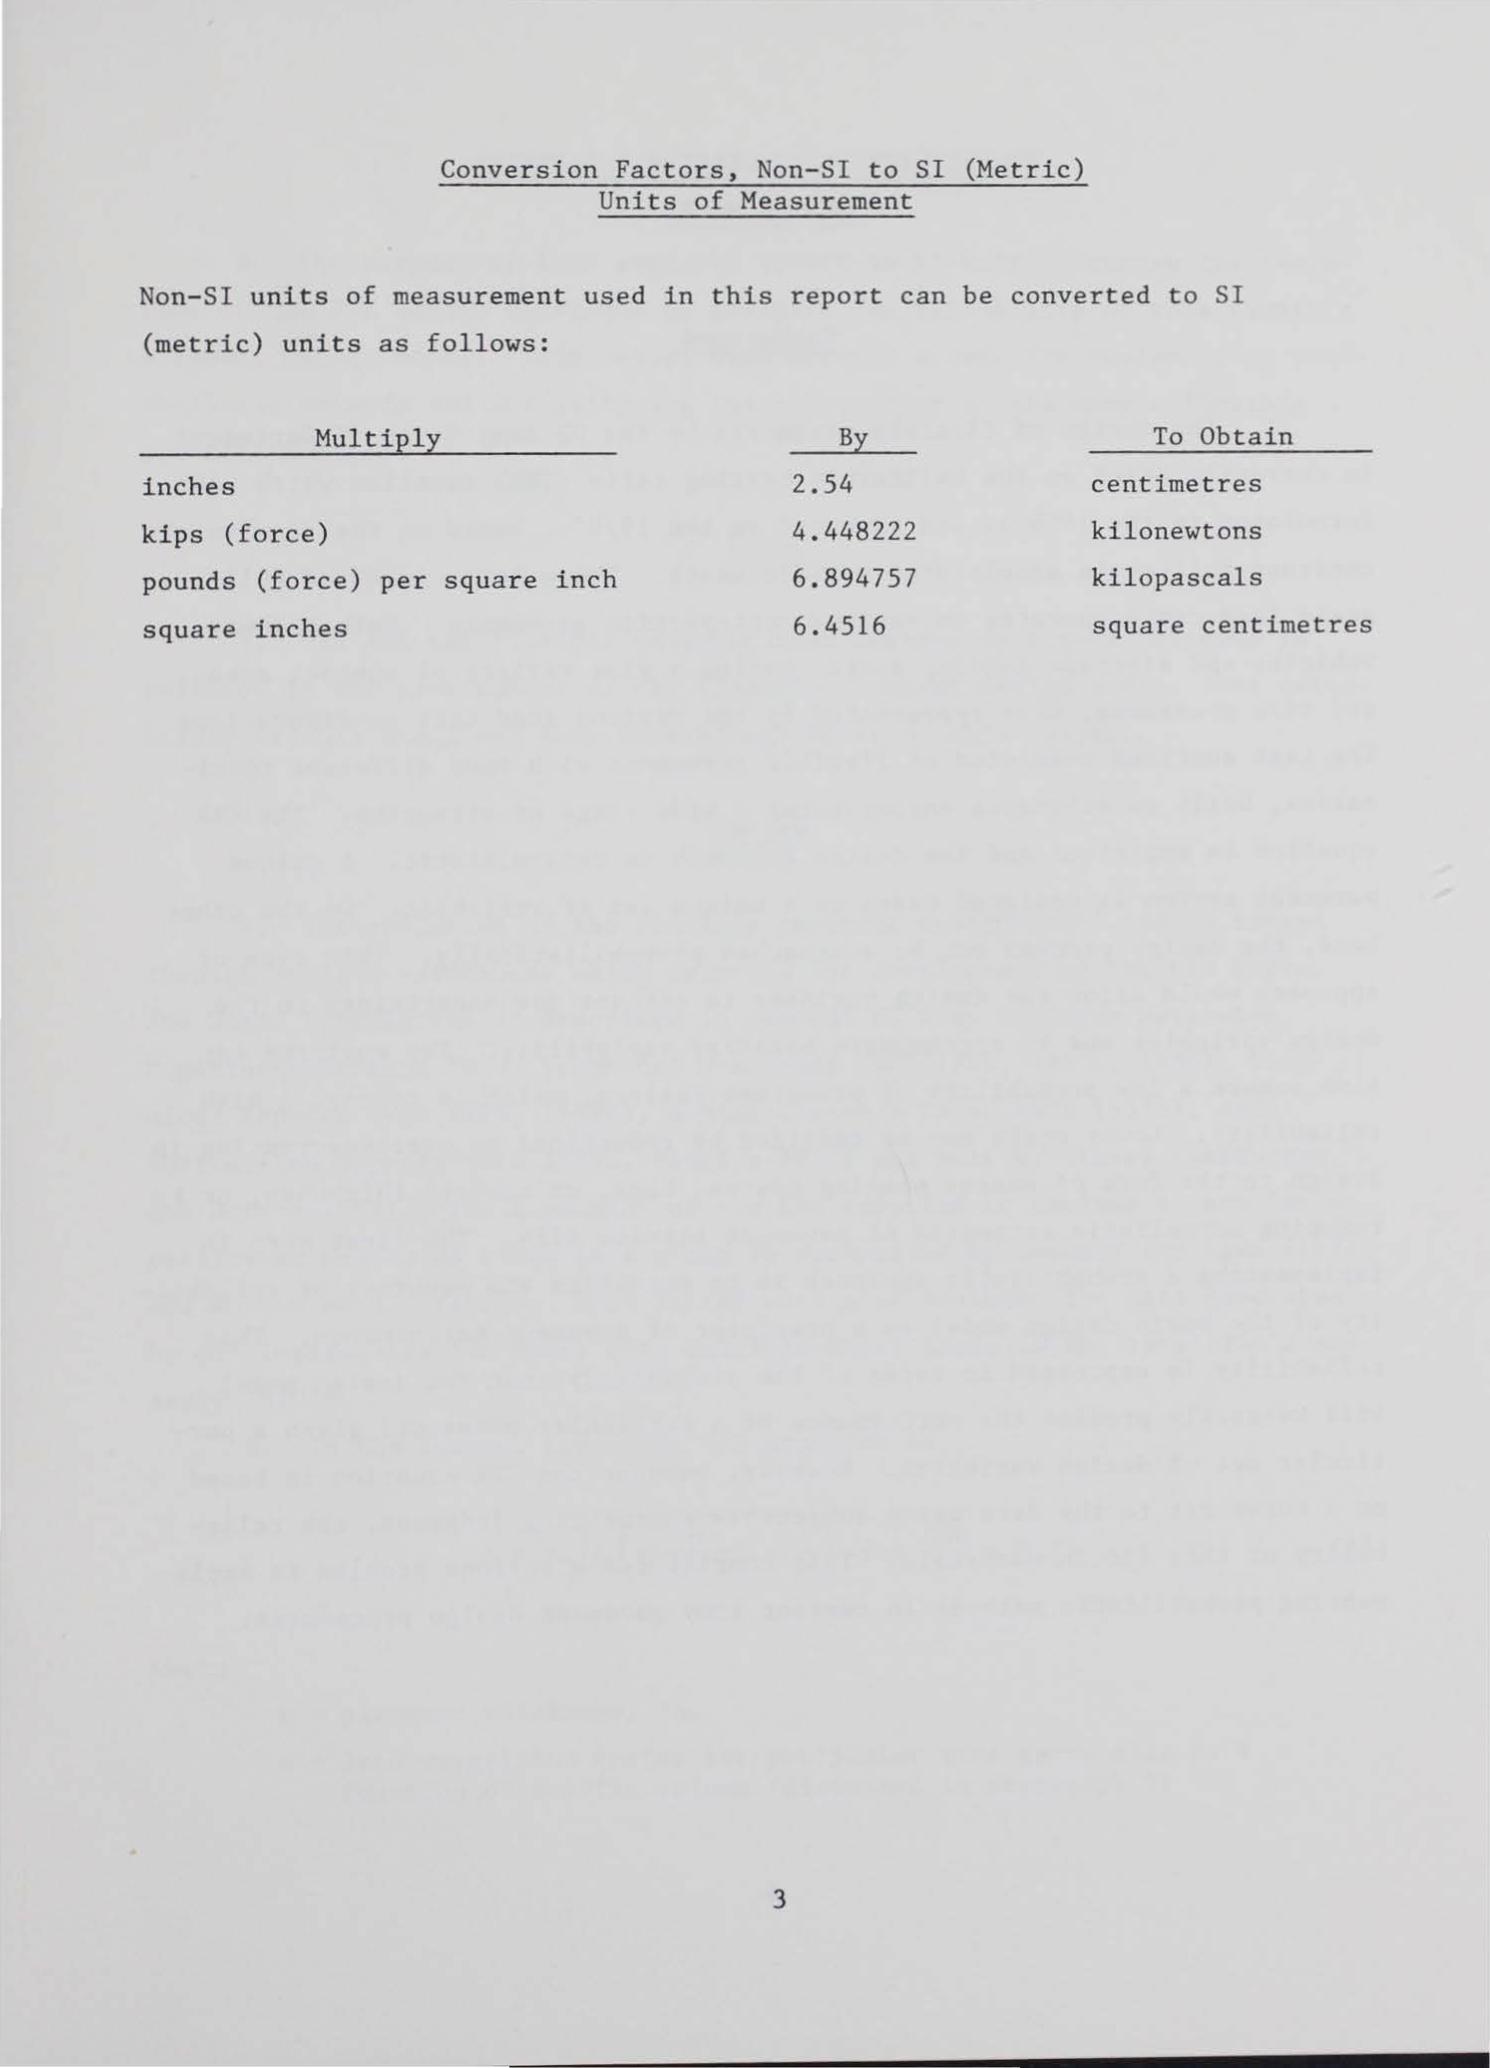
Conversion Factors, Non-SI to SI (Metric) Units of Measurement
Non-SI units of measurement used in this report can be converted to SI
(metric) units as follows:
Multiply
inches
kips (force)
pounds (force) per square inch
square inches
3
By
2.54
4.448222
6.894757
6.4516
To Obtain
centimetres
kilonewtons
kilopascals
square centimetres
-
RELIABILITY OF THE FLEXIBLE PAVEMENT
DESIGN MODEL
Background
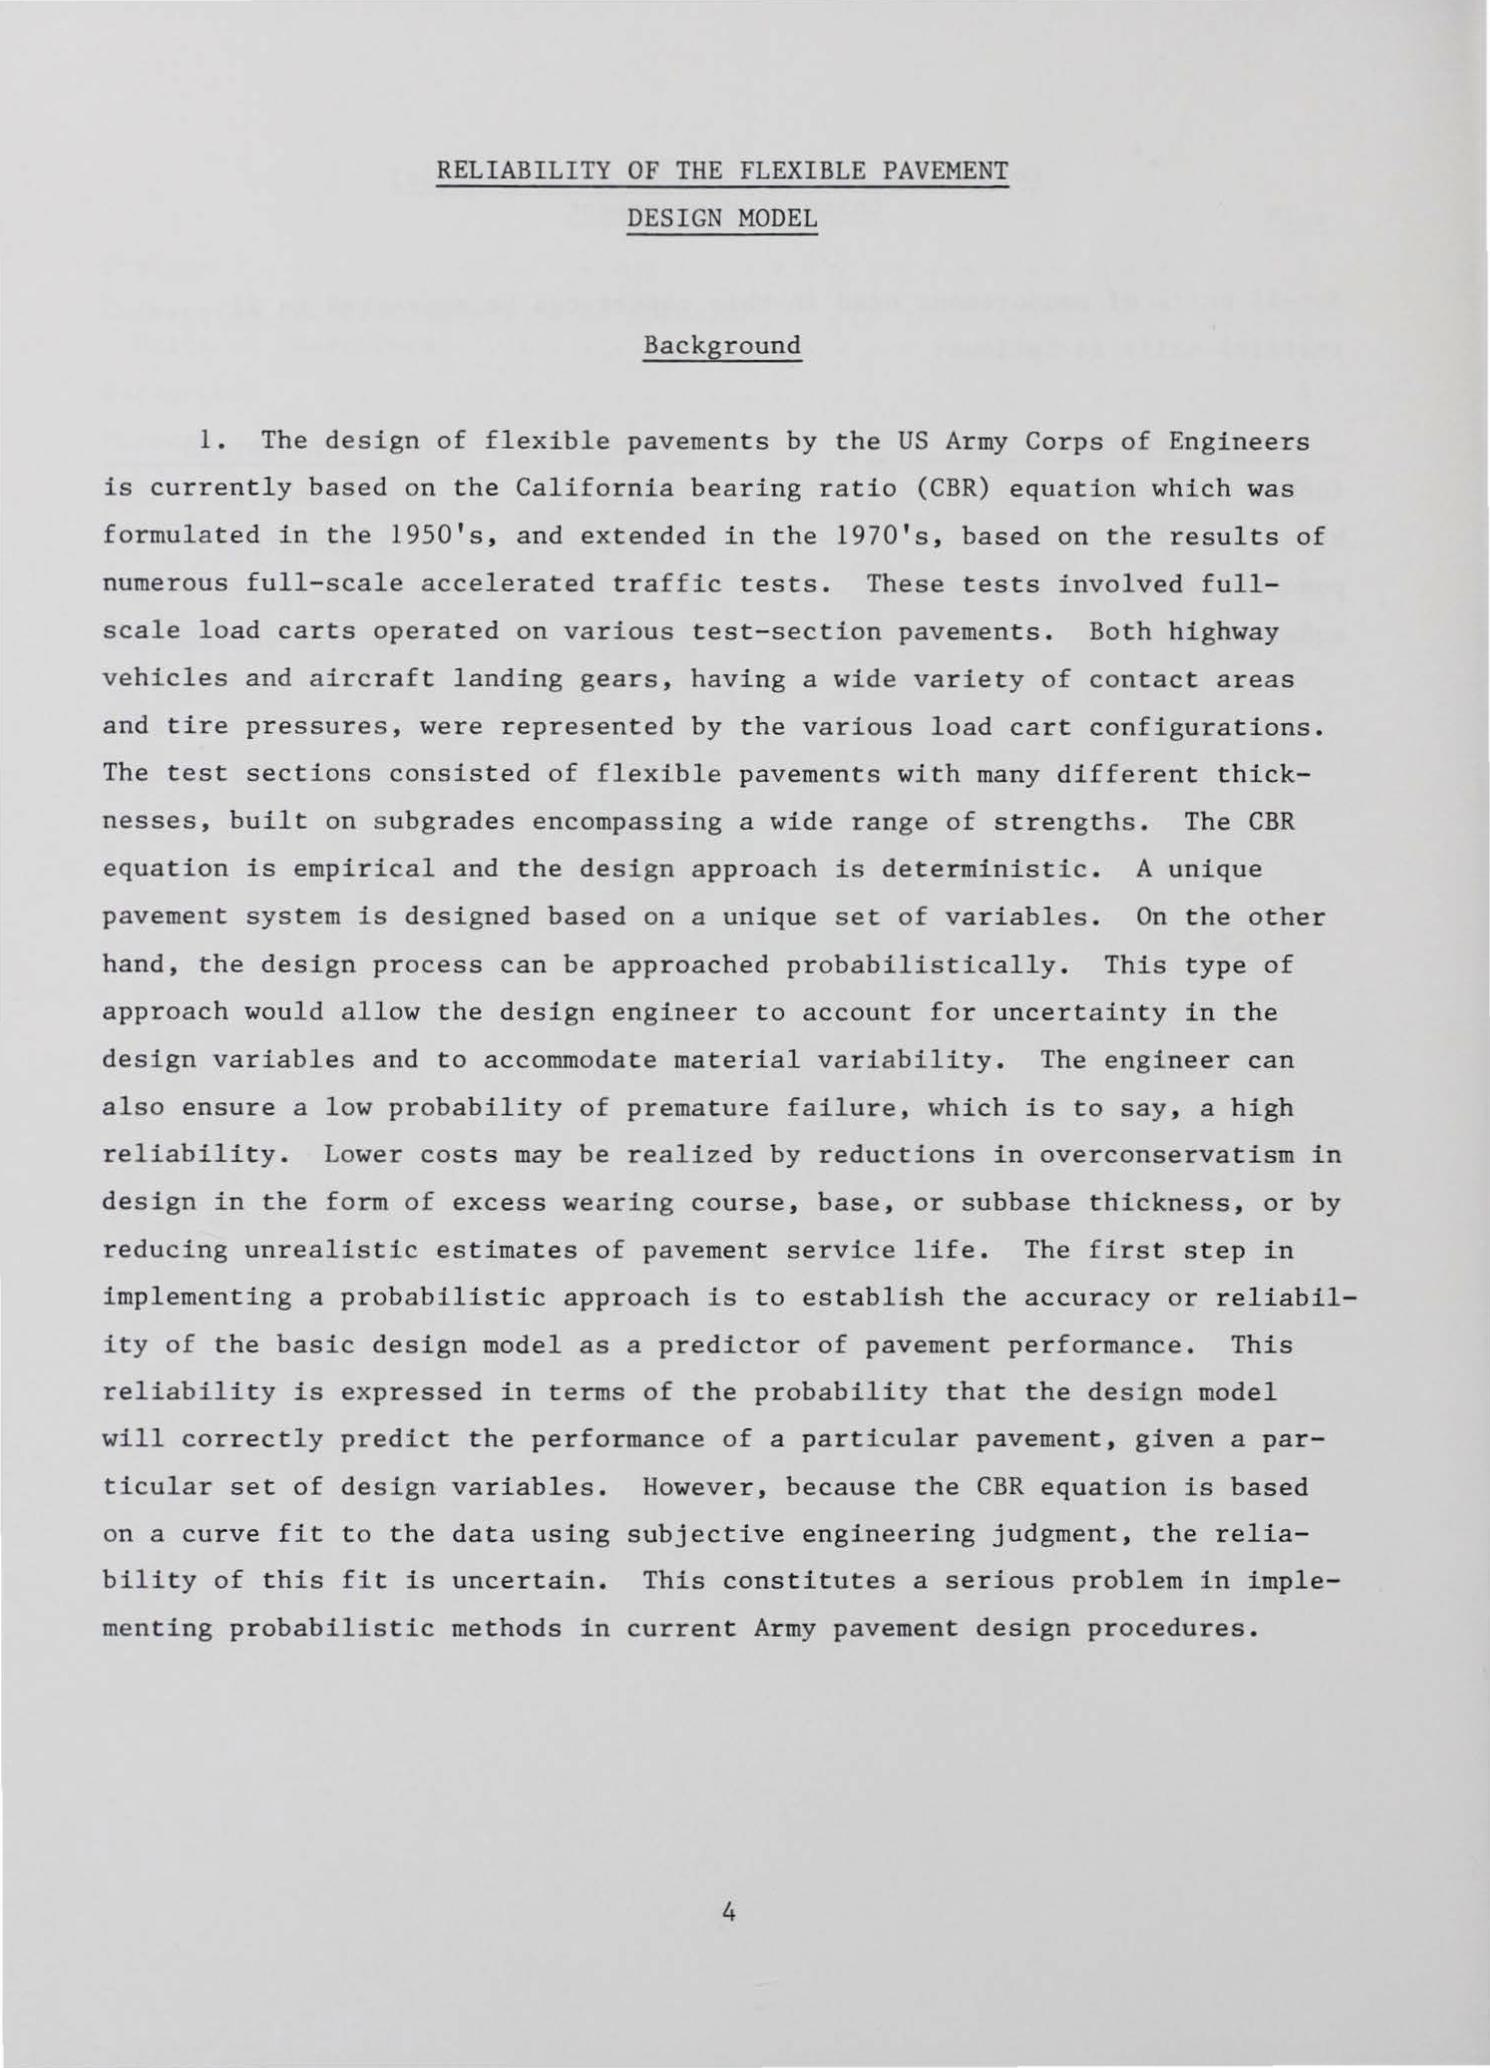
1. The design of flexible pavements by the US Army Corps of Engineers
is currently based on the California bearing ratio (CBR) equation which was
formulated in the 1950's , and extended in the 1970's, based on the results of
numerous full-scale accelerated traffic tests. These tests involved full
scale load carts operated on various test-section pavements. Both highway
vehicles and aircraft landing gears, having a wide variety of contact areas
and tire pressures, were represented by the various load cart configurations.
The test sections consisted of flexible pavements with many different thick
nesses, built on s ubgrades encompassing a wide range of strengths. The CBR
equation is empirical and the design approach is deterministic. A unique
pavement system is designed based on a unique set of variables. On the other
hand, the design process can be approached probabilistically. This type of
approach would allow the design engineer to account for uncertainty in the
design variables and to accommodate material variability. The engineer can
also ensure a low probability of premature failure, which is to say, a high
reliability. Lower costs may be realized by reductions in overconservatism in
design in the form of excess wearing course, base, or subbase thickness, or by
reducing unrealistic estimates of pavement service life. The first step in
implementing a probabilistic approach is to establish the accuracy or reliabil
ity of the basic design model as a predictor of pavement performance. This
reliability is expressed in terms of the probability that the design model
will correctly predict the performance of a particular pavement, given a par
ticular set of design variables. However, because the CBR equation is based
on a curve fit to the data using subjective engineering judgment, the relia
bility of this fit is uncertain. This constitutes a serious problem in imple
menting probabilistic methods in current Army pavement design procedures.
4
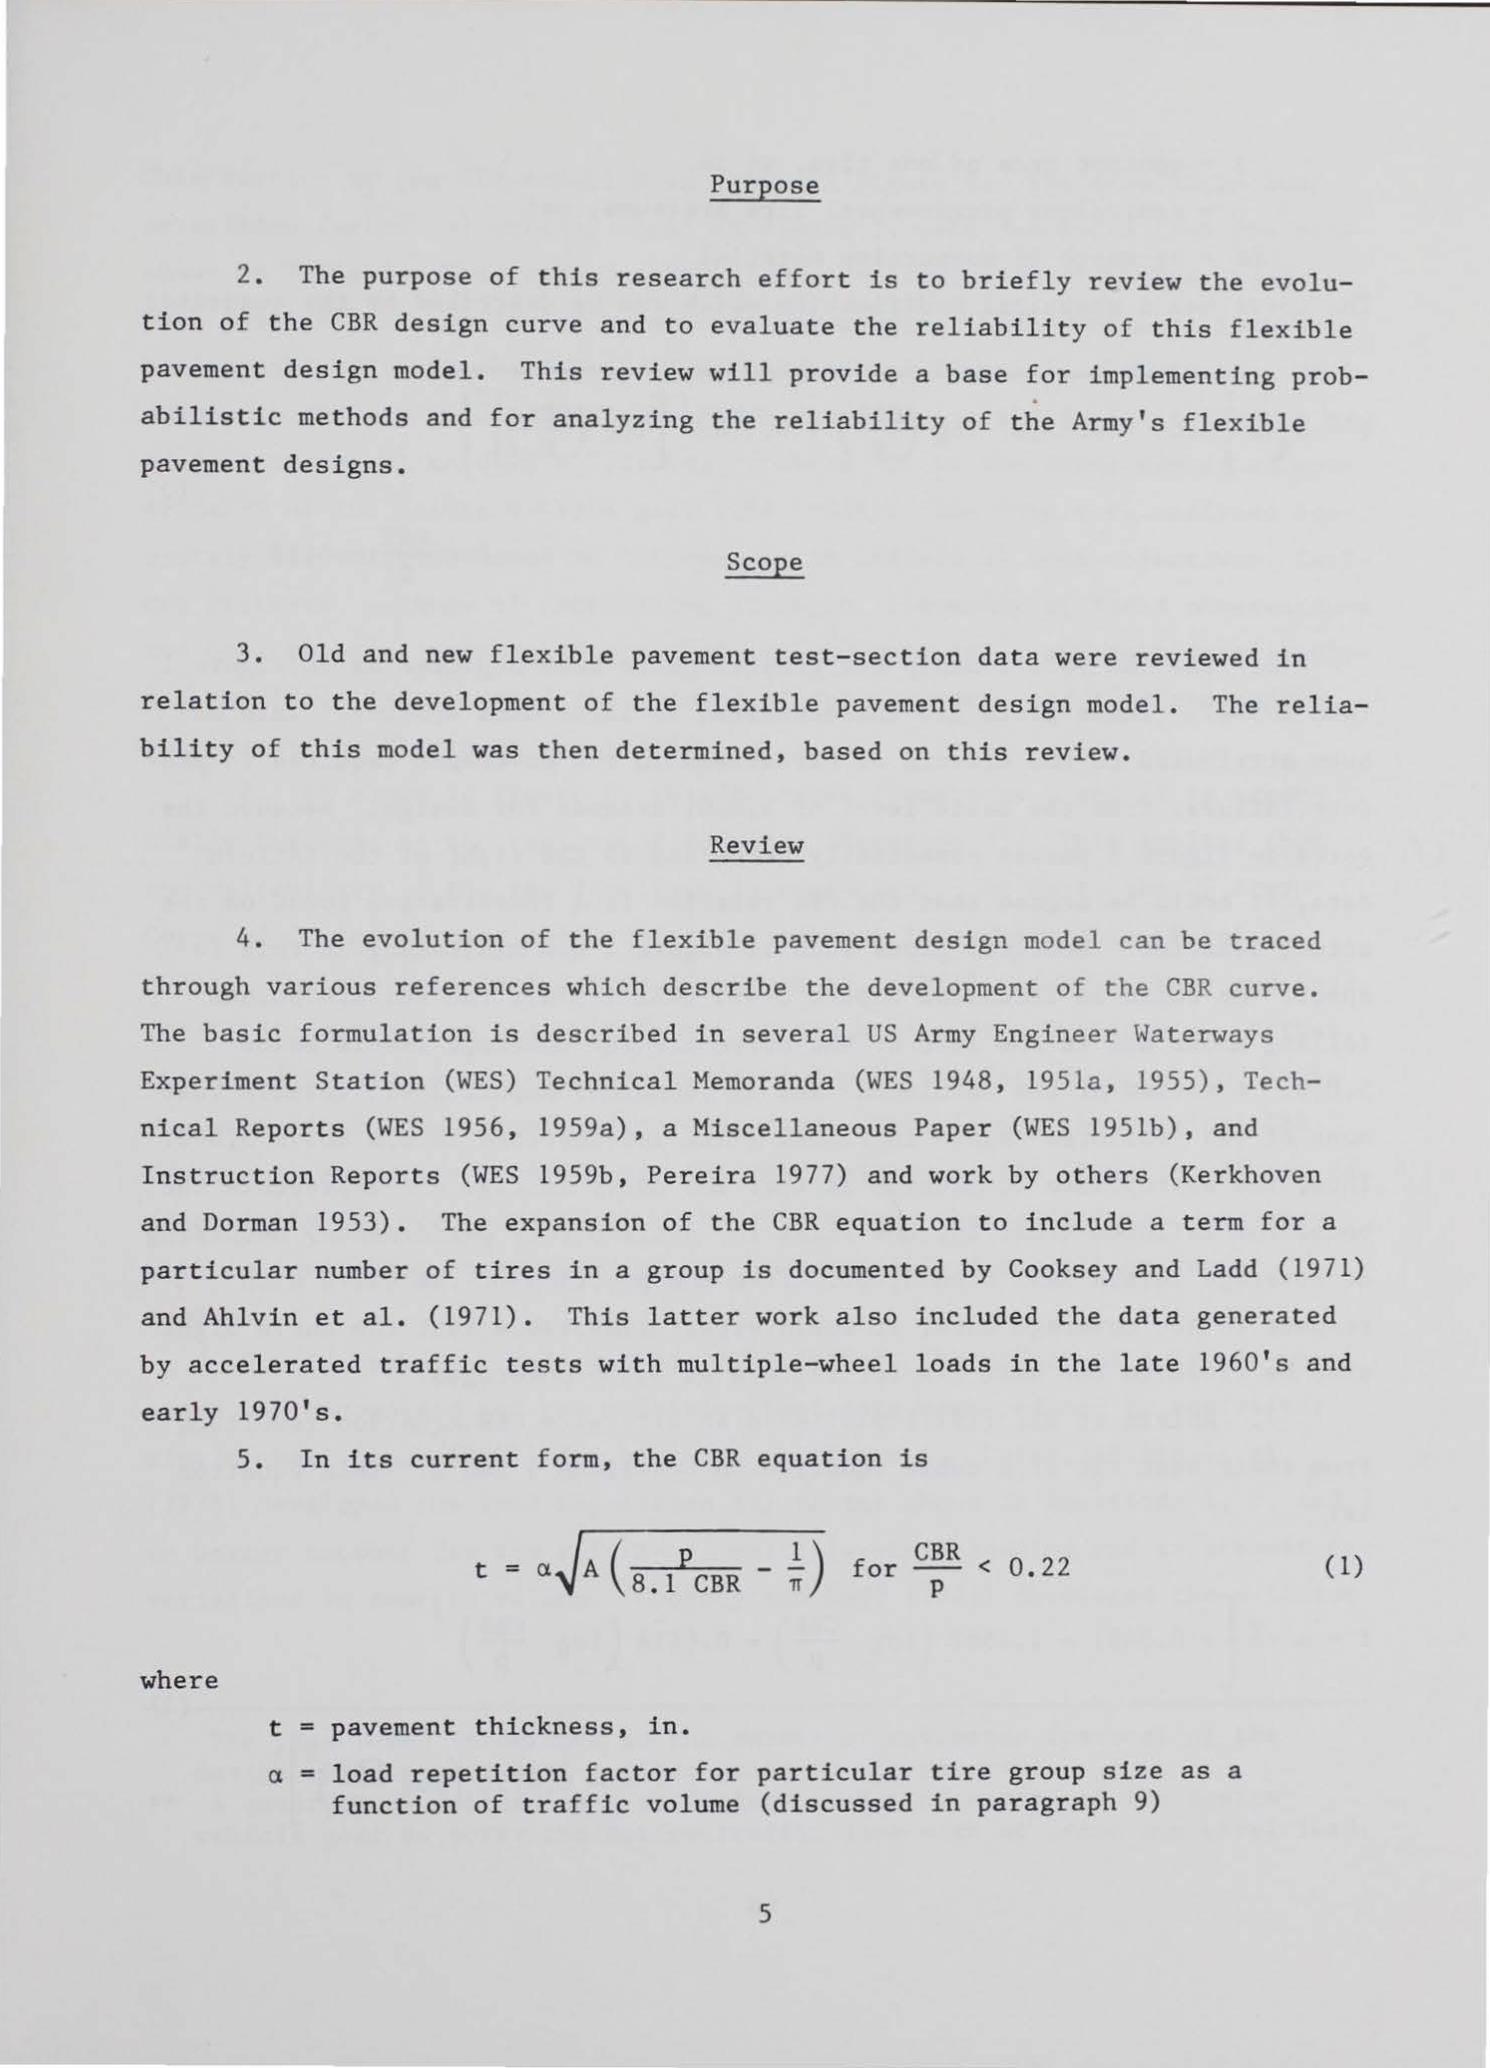
Purpose
2. The purpose of this research effort is to briefly review the evolu
tion of the CBR design curve and to evaluate the reliability of this flexible
pavement design model. This review will provide a base for implementing prob-•
abilistic methods and for analyzing the reliability of the Army's flexible
pavement designs.
Scope
3. Old and new flexible pavement test-section data were reviewed in
relation to the development of the flexible pavement design model. The relia
bility of this model was then determined, based on this review.
Review
4. The evolution of the flexible pavement design model can be traced
through various references which describe the development of the CBR curve.
The basic formulation is described in several US Army Engineer Waterways
Experiment Station (WES) Technical Memoranda (WES 1948, 1951a, 1955), Tech
nical Reports (WES 1956, 1959a), a Miscellaneous Paper (WES 1951b), and
Instruction Reports (WES 1959b, Pereira 1977) and work by others (Kerkhoven
and Dorman 1953). The expansion of the CBR equation to include a term for a
particular number of tires in a group is documented by Cooksey and Ladd (1971)
and Ahlvin et al. (1971). This latter work also included the data generated
by accelerated traffic tests with multiple-wheel loads in the late 1960's and
early 1970's.
where
5. In its current form, the CBR equation is
CBR for < 0.22 p
t - pavement thickness, in.
a = load repetition factor for particular tire group size as a function of traffic volume (discussed in paragraph 9)
5
( 1)

A - contact area of one tire, sq • l.n.
p - equivalent single-wheel tire pressure, psi
CBR - strength of supporting material
The curve has a graphical modification which can be described by the quadratic
t - a A ( CBR) [ (CBR)~ 2 0.05 - 0.35187 log p + 0.51492 log p J
for CBR > 0.22 p
( 2)
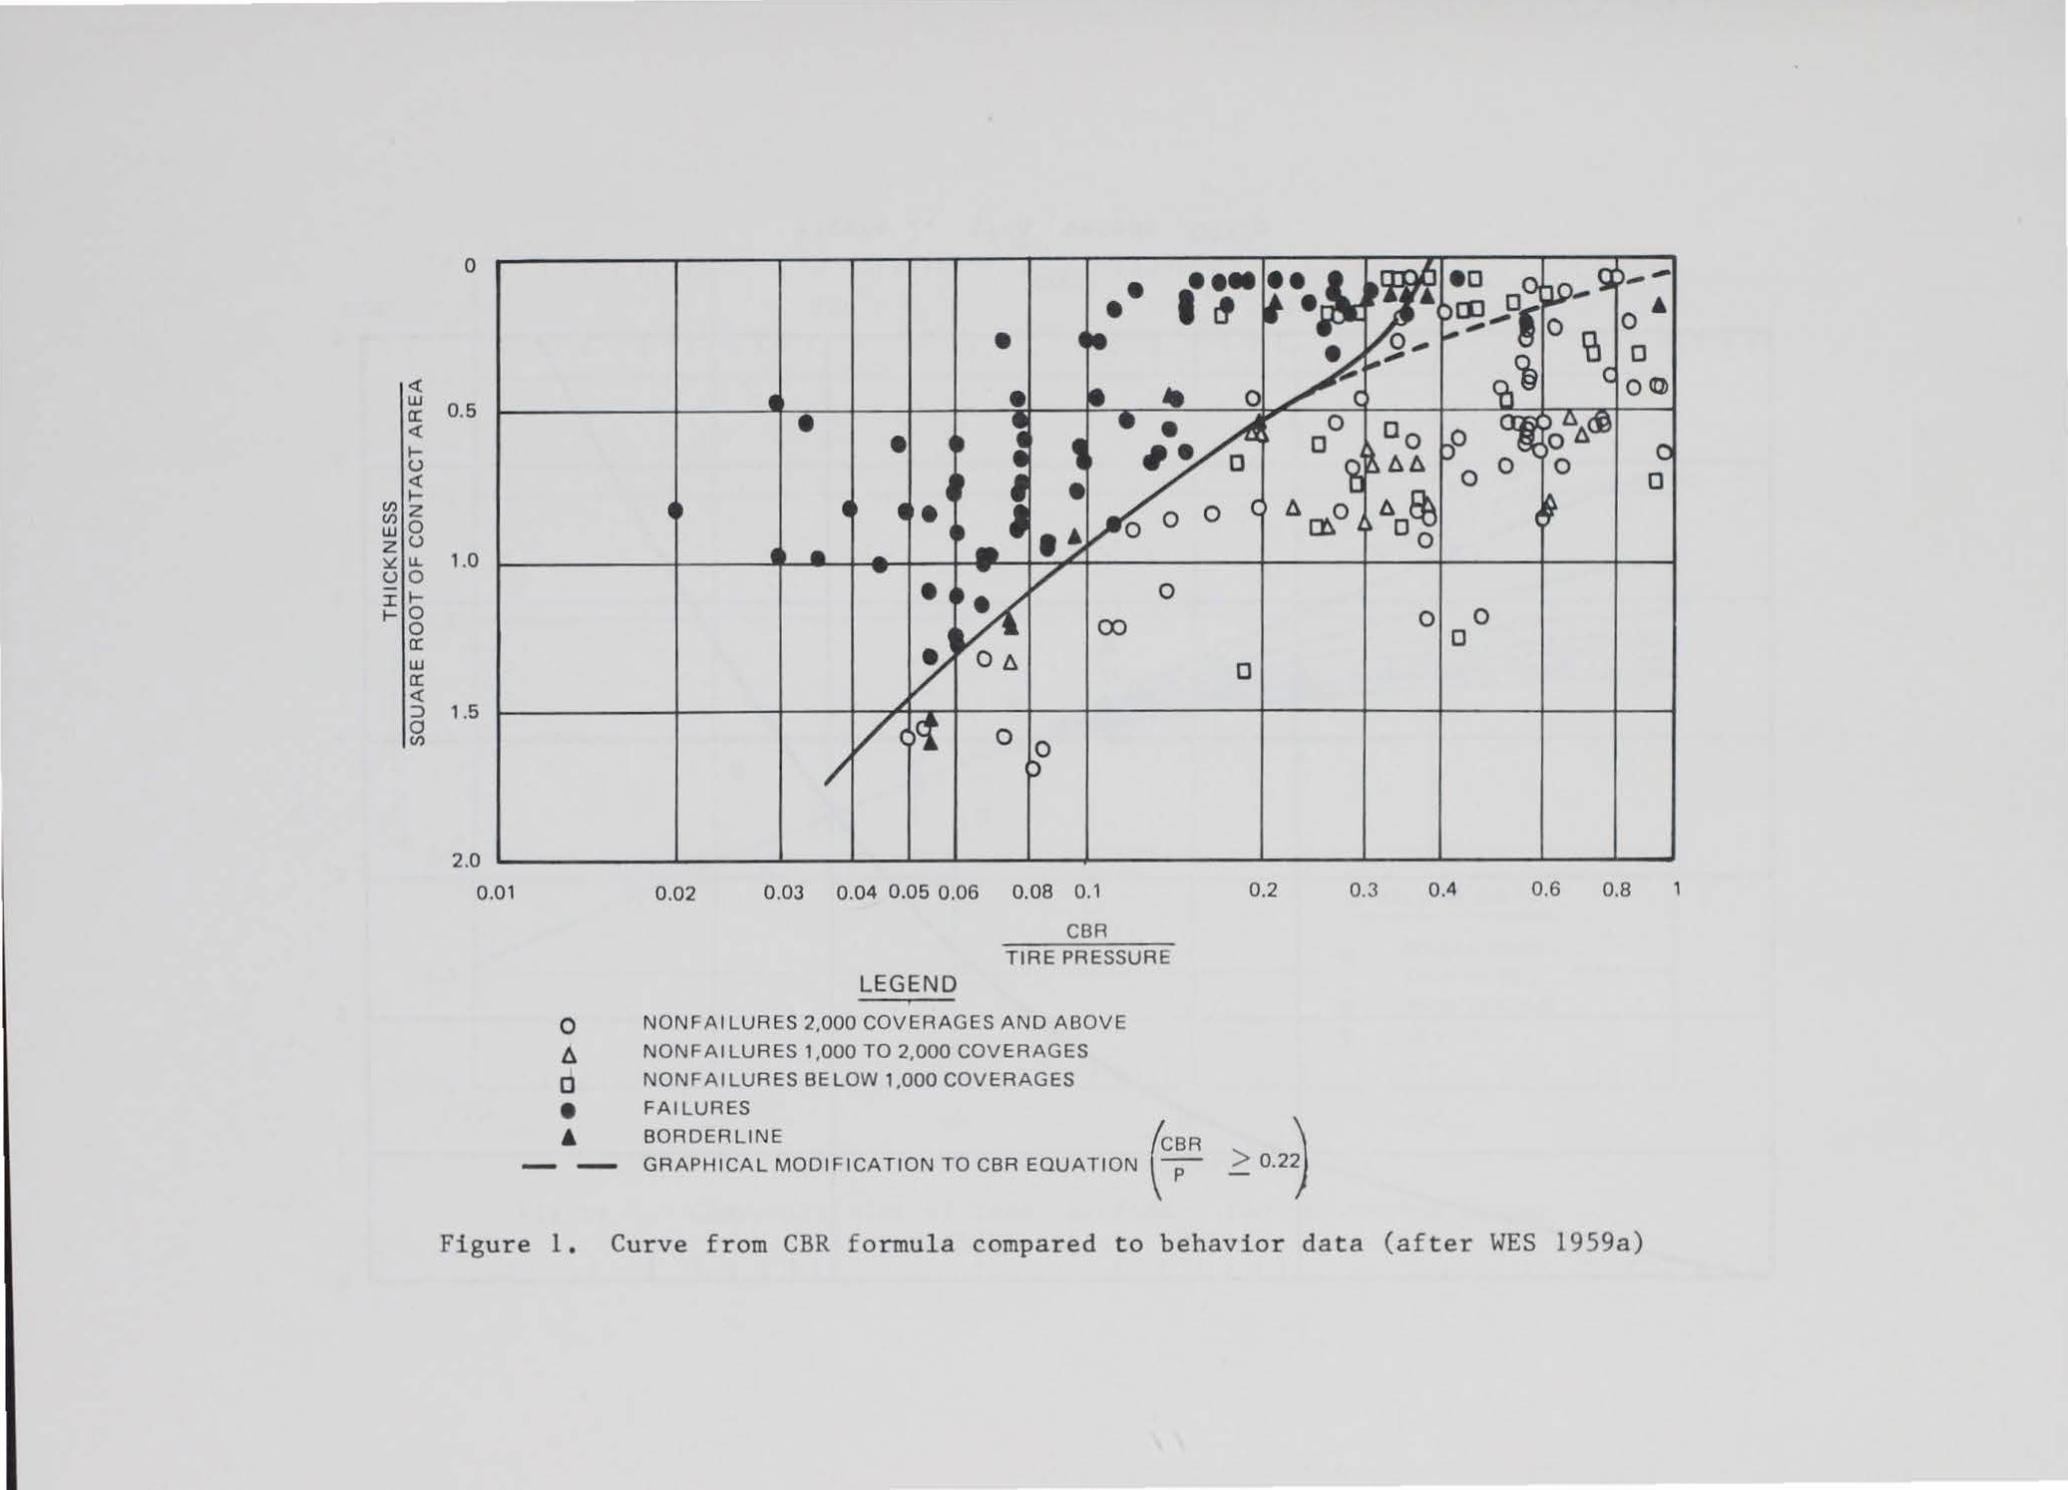
6. The CBR relationship has traditionally been depicted as in Figure 1
(WES 1959a). These plots are characterized by large data scatter. This has
been attributed to the effects of variations in the coverages required to pro
duce failure, from the basic level of 5,000, assumed for design. Because the
curve in Figure 1 passes essentially below and to the right of the failure
data, it could be argued that the CBR relation is a conservative bound on the
actual behavior. However, plots such as Figure 1 are misleading in this re
spect. As noted in Technical Report 3- 495 (WES 1959a), the failure points
falling above and to the left of the curve are for coverage levels below
5,000. A review of the tabulated data in Technical Report 3-495 reveals that
none of the "failures" shown in Figure 1 are for coverage levels above 5,000.
Thus, the appropriate conclusion is that the curve in Figure 1 represents the
bound for failures (that is, the limit for satisfactory performance) occurring
at coverage levels less than 5,000. From the position of the curve with
respect to the coverage data, it would appear reasonable that the curve might
also be close to the best fit for failure at 5,000 coverages.
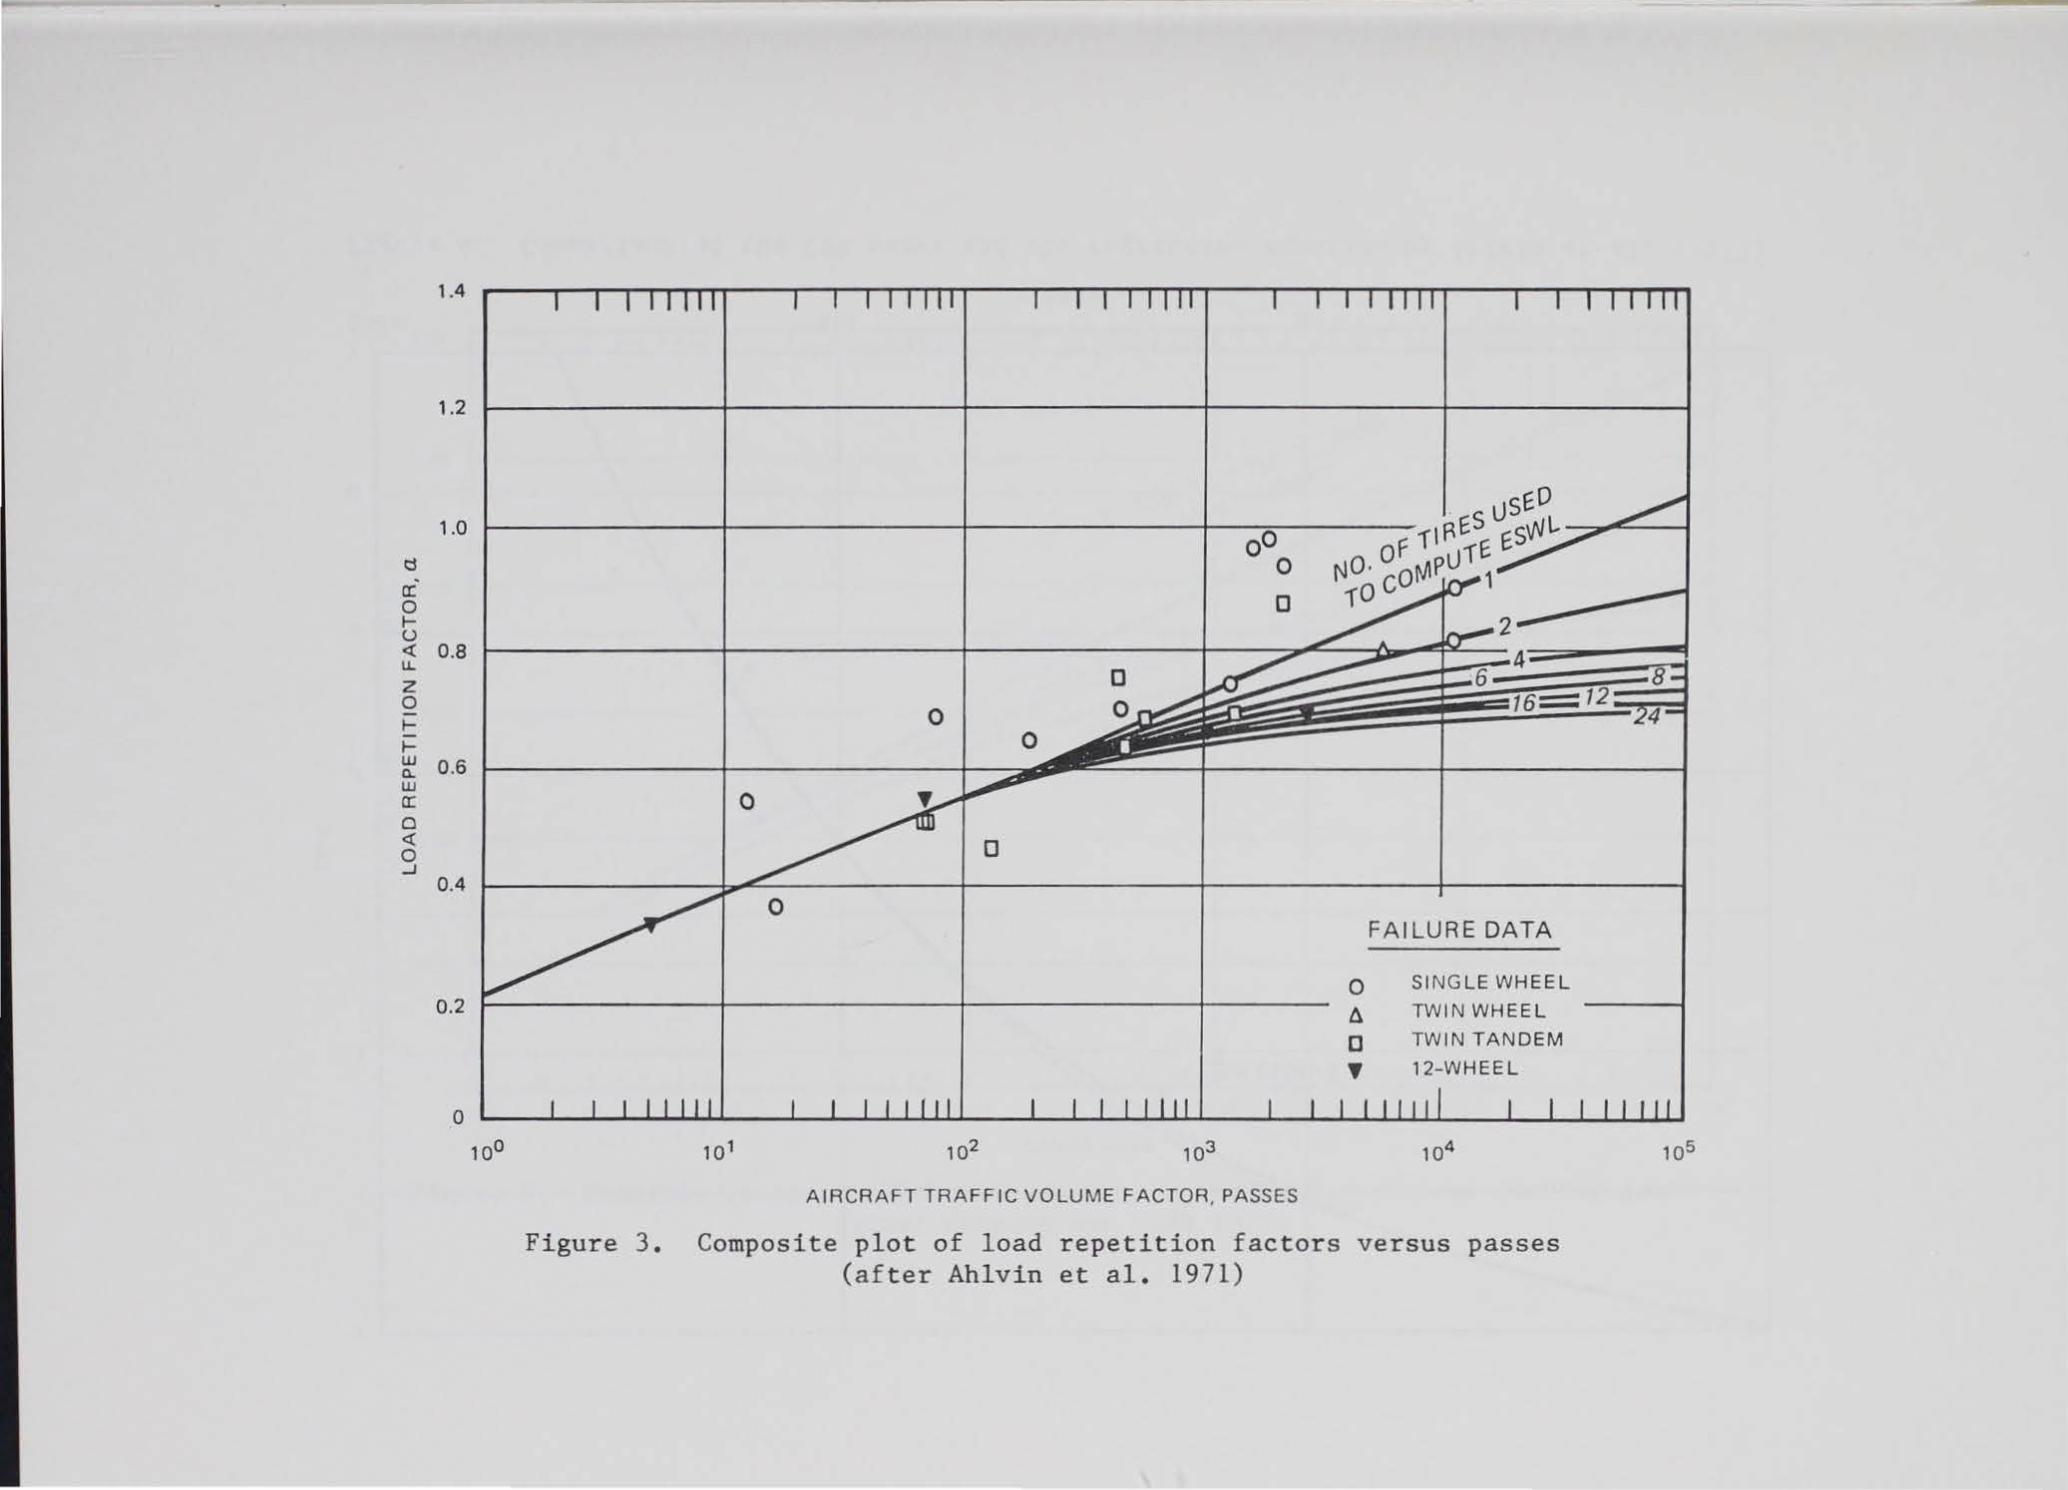
7. Ahlvin et al. (1971) published an alternate CBR equation resulting
from their best fit of a cubic equation to Equations 1 and 2. This equation
is:
17 0 048 62 (1 CBPR)- 0.6414 (log CBPR) 2
t - a r A - • 1 - 1. 15 og
(3)
6

This version of the CBR relation is shown in Figure 2. The associated load
repetition factor (a) curves, shown in Figure 3, were developed from the data
shown in Table 1. This relationship allows consideration of variations in
pass level,* gear configuration and vehicle wander. Such considerations are
not possible with the basic relationship shown in Figure 1. Previously, vari
ations in traffic volume were considered by adjusting the design thickness by
an £-factor equal to 0.15 + 0.23 log C, where C is the total number of cov
erages** of the design vehicle gear (WES 1951b). The data were analyzed sep
arately and weighted based on differences in individual test objectives, fail
ure criteria, methods of determining strength, frequency of field observations
and measurements, construction techniques and materials, and methods of apply
ing traffic. This reduced the effects of data scatter, and is discussed in
some detail by Ahlvin et al. (1971).
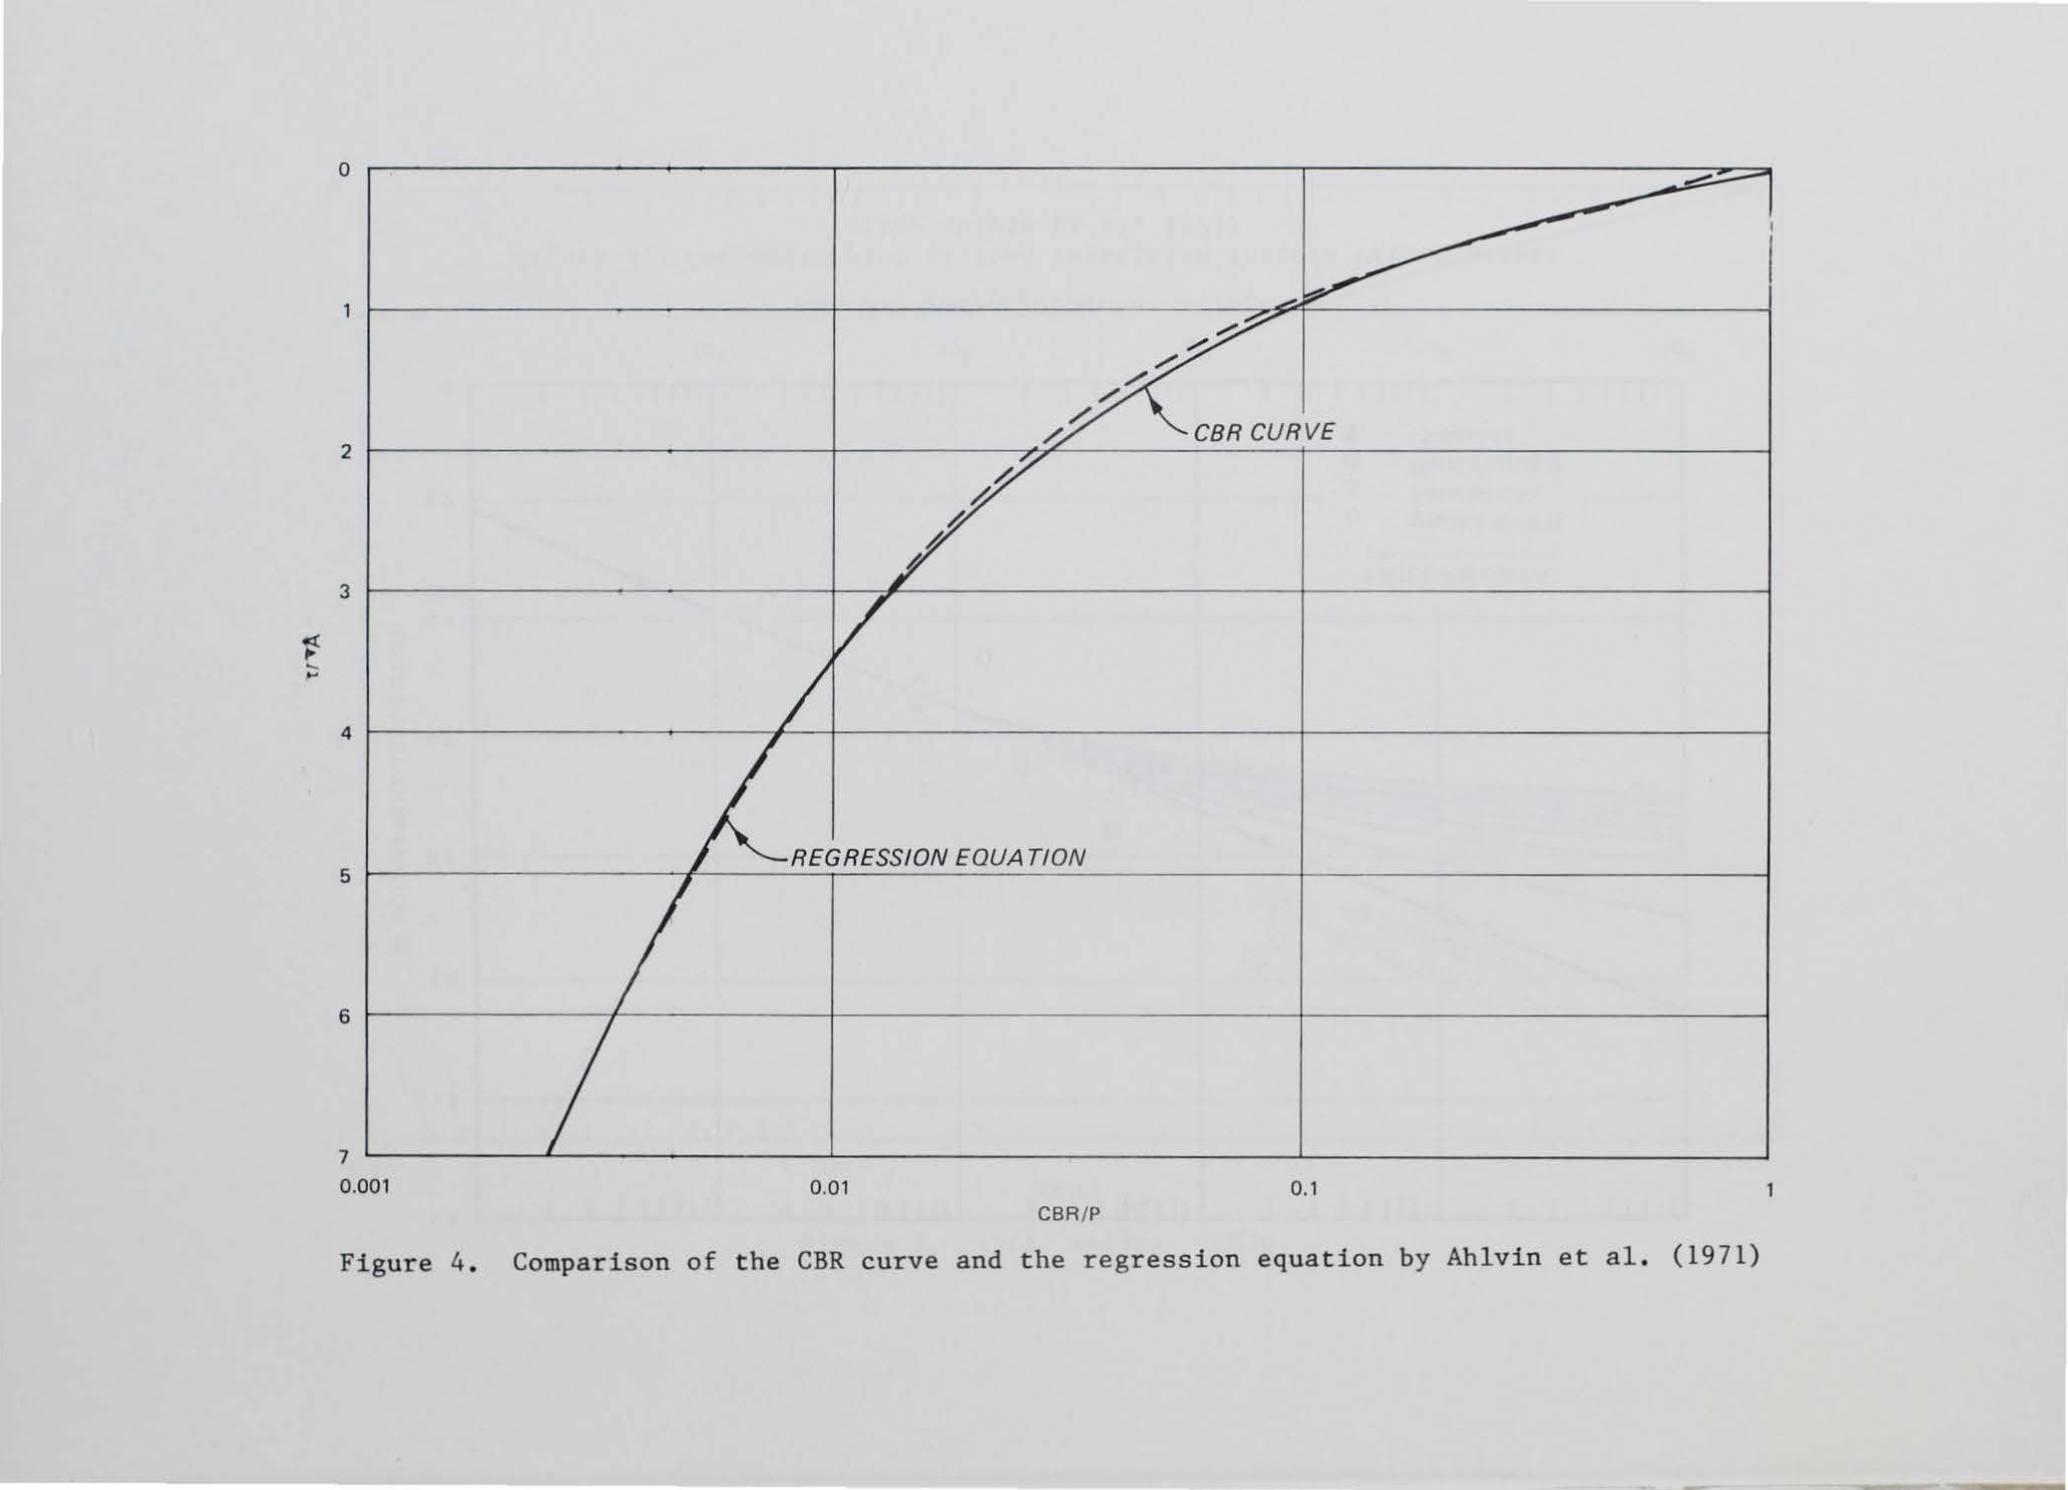
8. As shown in Figure 4, the CBR curve (Equations 1 and 2) is essen
tially the same as the regression equation (Equation 3). This implies that
the reliability of the two functions is equivalent. In fact, the US Army
Corps of Engineers uses these two relationships interchangeably (Pereira
1977). The new data included by Ahlvin et al. (1971) and by Cooksey and Ladd
(1971) did not change the reliability of the basic CBR relationship. Rather,
the new data were used to adjust the load repetition factor curves to obtain
the best fit to the actual performance data. This is why the original CBR
equations (Equations 1 and 2) and the regression equation (Equation 3) can be
essentially the same curves, in spite of the fact that additional data were
used in developing Equation 3 and the associated load repetition factor
curves.
9. In Technical Report 3-495 (WES 1959a), the effect of multiple-wheel
gears was recognized and the multiple-wheel data were reduced to equivalent
single-wheel loads (ESWL) for plotting on Figure 1. Later, Ahlvin et al.
(1971) developed the load repetition (a) factor shown in Equations 1, 2, and 3
to better account for the effects of multiple-wheel loading and to account for
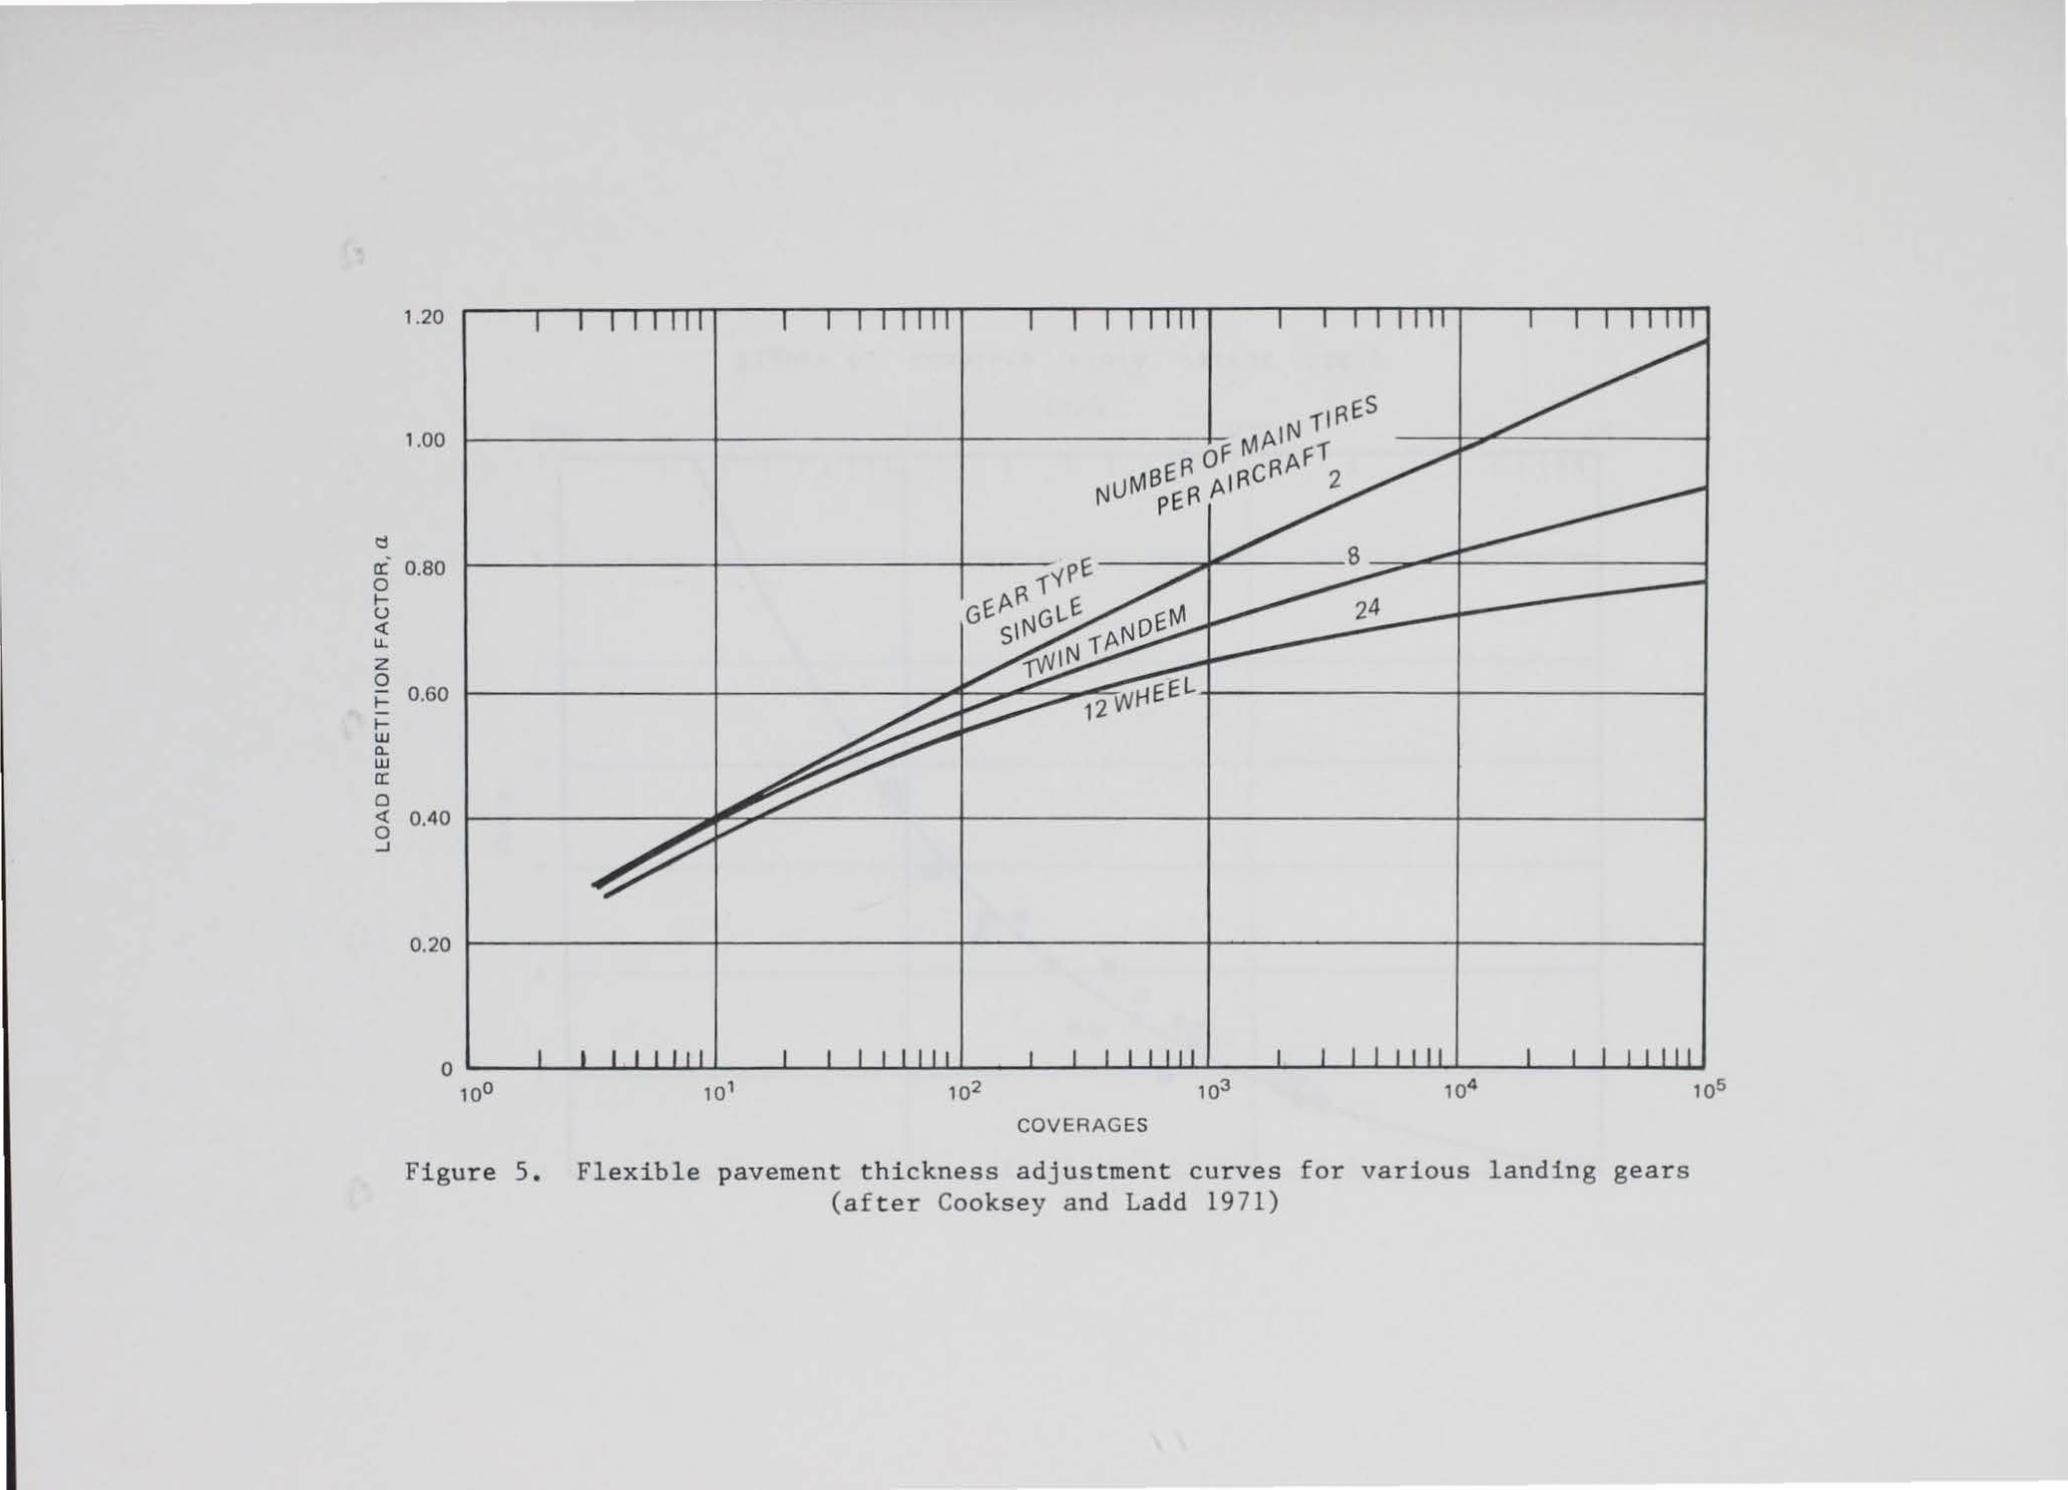
variations in traffic volume. Cooksey and Ladd (1971) developed the a-factor
* The pass level is defined as the number of movements (passes) of the design vehicle gear past a given point on the pavement.
** A coverage is defined as a sufficient number of passes of the design vehicle gear to cover the entire traffic lane with at least one wheel load.
7

curves shown in Figure 5 in terms of coverages. This is the form currently
used by the Corps of Engineers, with either Equations 1 and 2 or Equation 3 .
Because little full-scale accelerated traffic testing has been done since the
multiple-wheel, heavy- gear load tests reported by Ahlvin et al . (1971), these
relationships consider essentially all available data.
10. The a-factor curves developed by Cooksey and Ladd (1971) are based
on the data shown in Table 1, plus the additional data shown in Table 2 . Of
all available data, only the data in Tables 1 and 2 resulted from subgrade
failures, consisted of only one loading condition or intensity, and repre
sented pavements using accepted construction materials. Only subgrade fail
ures were considered since the thickness design procedure is based upon pro
tecting the subgrade from failure . Only those failures produced by one
loading condition were considered to eliminate uncertainty introduced by
assumptions about the effects of mixed traffic. The design of pavements for
different coverage levels is done by changing thickness requirements rather
than material requirements. Therefore, only data from failures on materials
meeting quality standards were used.
Analysis
11. If Equation 3 (Ahlvin et al. 1971) and the a- factor curves (Cooksey
and Ladd 1971) currently used for flexible pavement design by the Corps of
Engineers are best- fit representations of the performance data, then the
curves pass through the expected value of the dependent variable (that is,
t/IA) for any values of the independent variables. In this case, the current
criteria represent the 50th percentile of the data, and have a reliability of
50 percent. This conclusion is easily verified by plotting the data from
Tables 1 and 2, using a- factors from Figure 5, on a graph of Equations 1 and 2
or Equation 3 . As shown in Figure 6, these data are evenly distributed along
either side of a plot of Equation 3. The conclusion that the current Corps of
Engineers flexible pavement design model has a reliability of about 50 percent
is therefore confirmed .
8
Conclusions
12. The reliability of the flexible pavement design model is about
50 percent. The flexible pavement design model will therefore provide very
nearly the best estimate or expected value of the pavement thickness required
for the given design parameters, including the required service life. On the
average, about one-half of all pavements designed using this model will fail
before the design service life is reached and one-half will continue to per
form beyond their design service life. This reliability statement does not
include the effects of conservative estimates ("design" values) for the
parameters for material strength (CBR) , traffic load (p), and traffic intens
ity (a). The effects of uncertainty or conservatism in these estimates are
being addressed by the RDTE Program Project No. 4Al61102AT22, Task AO, Work
Unit 09, "Methodology for Considering Material Variability in Pavement
Design," and will be documented in a technical report to be entitled "Proba
bilistic Analysis of the CBR Design Method for Flexible Airfield Pavements."
9

References
Ahlvin, R. G., Ulery , H. H., Jr., Hutchinson, R. L., and Rice, J . L. 1971. "Multiple-Wheel Heavy Gear Load Pavement Tests, Volume 1, Basic Report," Technical Report S-71-17, US Army Engineer Waterways Experiment Station, Vicks burg, Miss.
Cooksey, D. L., and Ladd , D. M. 1971. "Pavement Design for Various Levels of Traffic Volume, " Technical Report No. AFWL-TR-70-133, Air Force Weapons Laboratory, Kirtland Air Force Base, N. Mex.
Kerkhoven, R. E., and Dorman, G. M. fornia Bearing Ratio Method for the search Center, London.
1953. " Some Consideration on the CaliDesign of Flexible Pavements, " Shell Re-
0. J. Porter and Company, Consulting Engineers. 1948. "Accelerated Traffic Test at Stockton Airfield, Stockton, California (Stockton Test No. 2)," US Army Engineer District, Sacramento, Sacramento, Calif.
Pereira , A. T. 1977. "Procedures for Development of CBR Design Curves," Instruction Report S- 77-1 , US Army Engineer Waterways Experiment Station, Vicksburg, Miss.
US Army Engineer Waterways Experiment Station . 1947. "Flexible Pavement Behavior Studies," Interim Report No. 2, Vicksburg, Miss.
. 1948. "Investigation of the Design and Control of Asphalt Paving -----.,.... Mixtures," Technical Memorandum No. 3-254, Vol 1, Vicksburg, Miss.
. 1950. " Investigation of Effects of Traffic with High- Pressure .....,_-----Tires on Asphalt Pavements ," Technical Memorandum No. 3-312, Vicksburg, Miss.
------• 1951a. " Investigations of Pressures and Deflections for Flexible Pavements; Homogeneous Clayey- Silt Test Section," Technical Memorandum No . 3- 323, Report No . 1, Vicksburg, Miss.
. 1951b. "Collection of Letter Reports on Flexible Pavement Design ----~-Curves, " Miscellaneous Paper No . 4-61, Vicksburg, Miss.
------. 1952. "Design of Flexible Airfield Pavements for Multiple-Wheel Landing Gear Assemblies , Tes t Section with Lean Clay Subgrade," Technical Memorandum No . 3- 349, Report No . 1, Vicksburg, Miss .
• 1955. "Design of Flexible Airfield Pavements for Multiple-Wheel ------Landing Gear Assemblies , Report No. 2, Analysis of Existing Data," Technical Memorandum No. 3-349 , Vicksburg, Miss .
. 1956 . "Mathematical Expression of the CBR Relations, " Technical ------Report No. 3-441, Vicksburg, Miss.
• 1959a. "Combined CBR Criteria, " Technical Report No . 3- 495, ------Vicksburg, Miss.
• -----"""'" port No . 4,
• ------Pavements,"
1959b. "Developing a Set of CBR Design Curves, " Instruction ReVicksburg, Miss.
1962. "A Limited Study of Technical Report No . 3-587,
10
Effects of Mixed Traffic on Flexible Vicksburg, Miss.
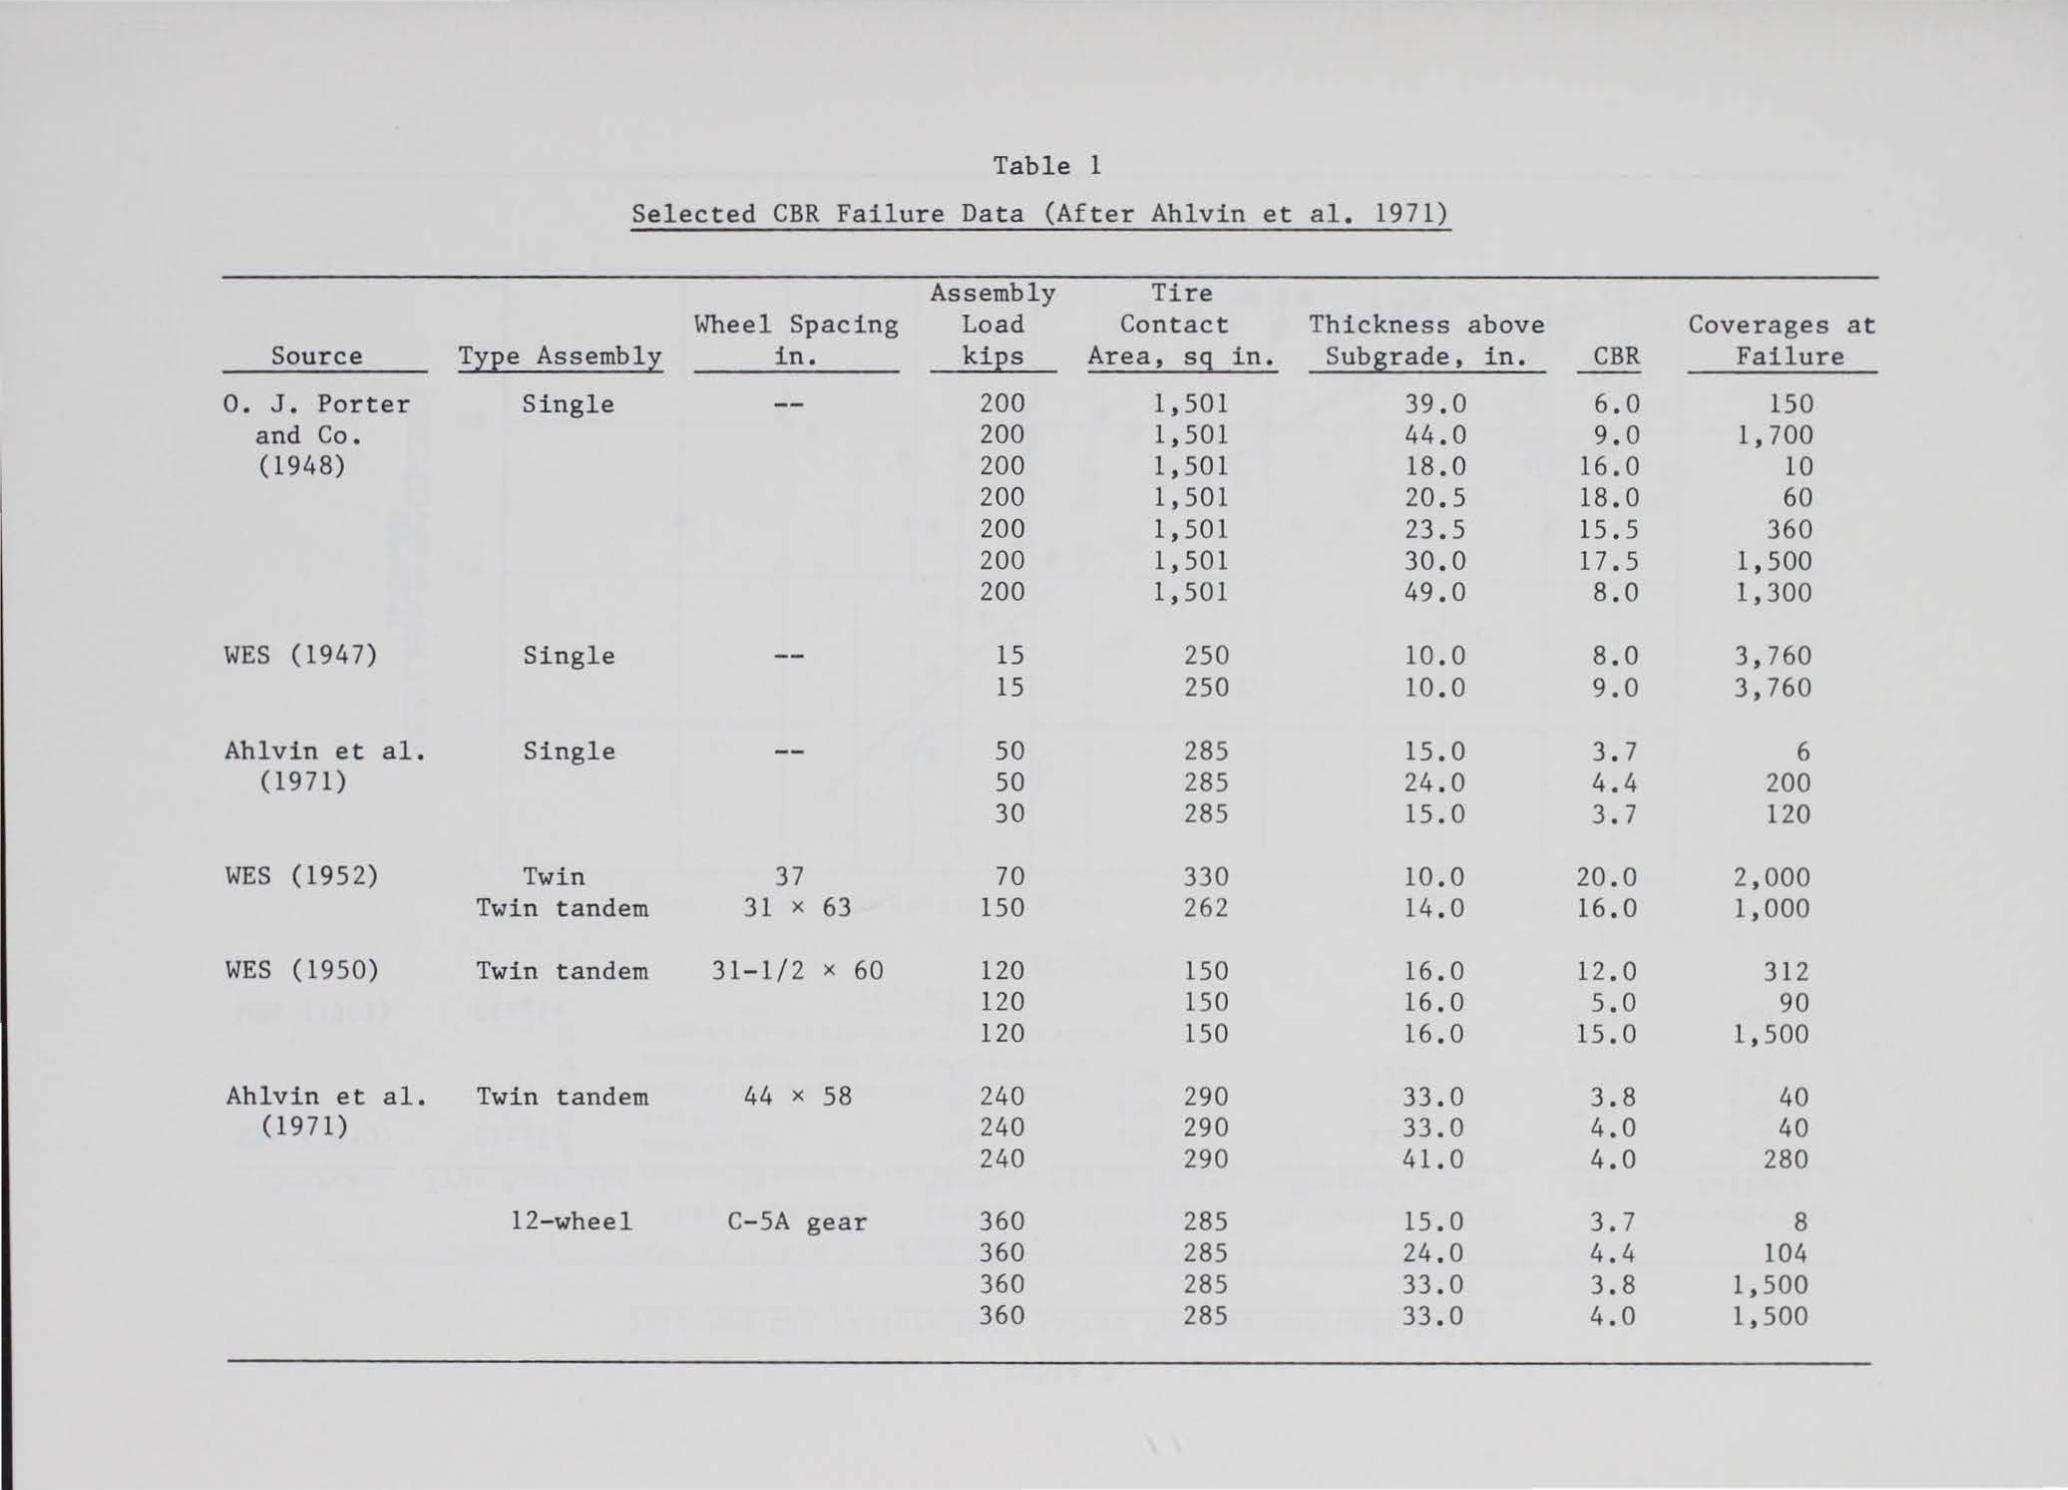
Table 1
Selected CBR Failure Data (After Ahlvin et al. 1971)
Assembly Tire Wheel Spacing Load Contact Thickness above Coverages at
Source Type Assembly in. kips Area, sq in. Subgrade, • l.n. CBR Failure
o. J. Porter Single 200 1,501 39 .0 6.0 150 and Co . 200 1,501 44.0 9.0 1,700 (1948) 200 1,501 18.0 16.0 10
200 1, 501 20 .5 18.0 60 200 1,501 23.5 15.5 360 200 1,501 30 .0 17.5 1,500 200 1,501 49.0 8.0 1,300
WES (1947) Single 15 250 10.0 8 .0 3,760 15 250 10.0 9.0 3,760
Ahlvin et al. Single so 285 15.0 3 . 7 6 (1971) so 285 24 . 0 4.4 200
30 285 15.0 3.7 120
WES (1952) Twin 37 70 330 10.0 20.0 2,000 Twin tandem 31 X 63 150 262 14.0 16.0 1,000
WES (1950) Twin tandem 31-1/2 X 60 120 150 16.0 12.0 312 120 150 16.0 5.0 90 120 150 16.0 15.0 1,500
Ahlvin et al. Twin tandem 44 X 58 240 290 33 . 0 3.8 40 (1971) 240 290 33.0 4.0 40
240 290 41.0 4.0 280
12-wheel C-SA gear 360 285 15.0 3.7 8 360 285 24.0 4.4 104 360 285 33.0 3. 8 1,500 360 285 33.0 4 . 0 1,500
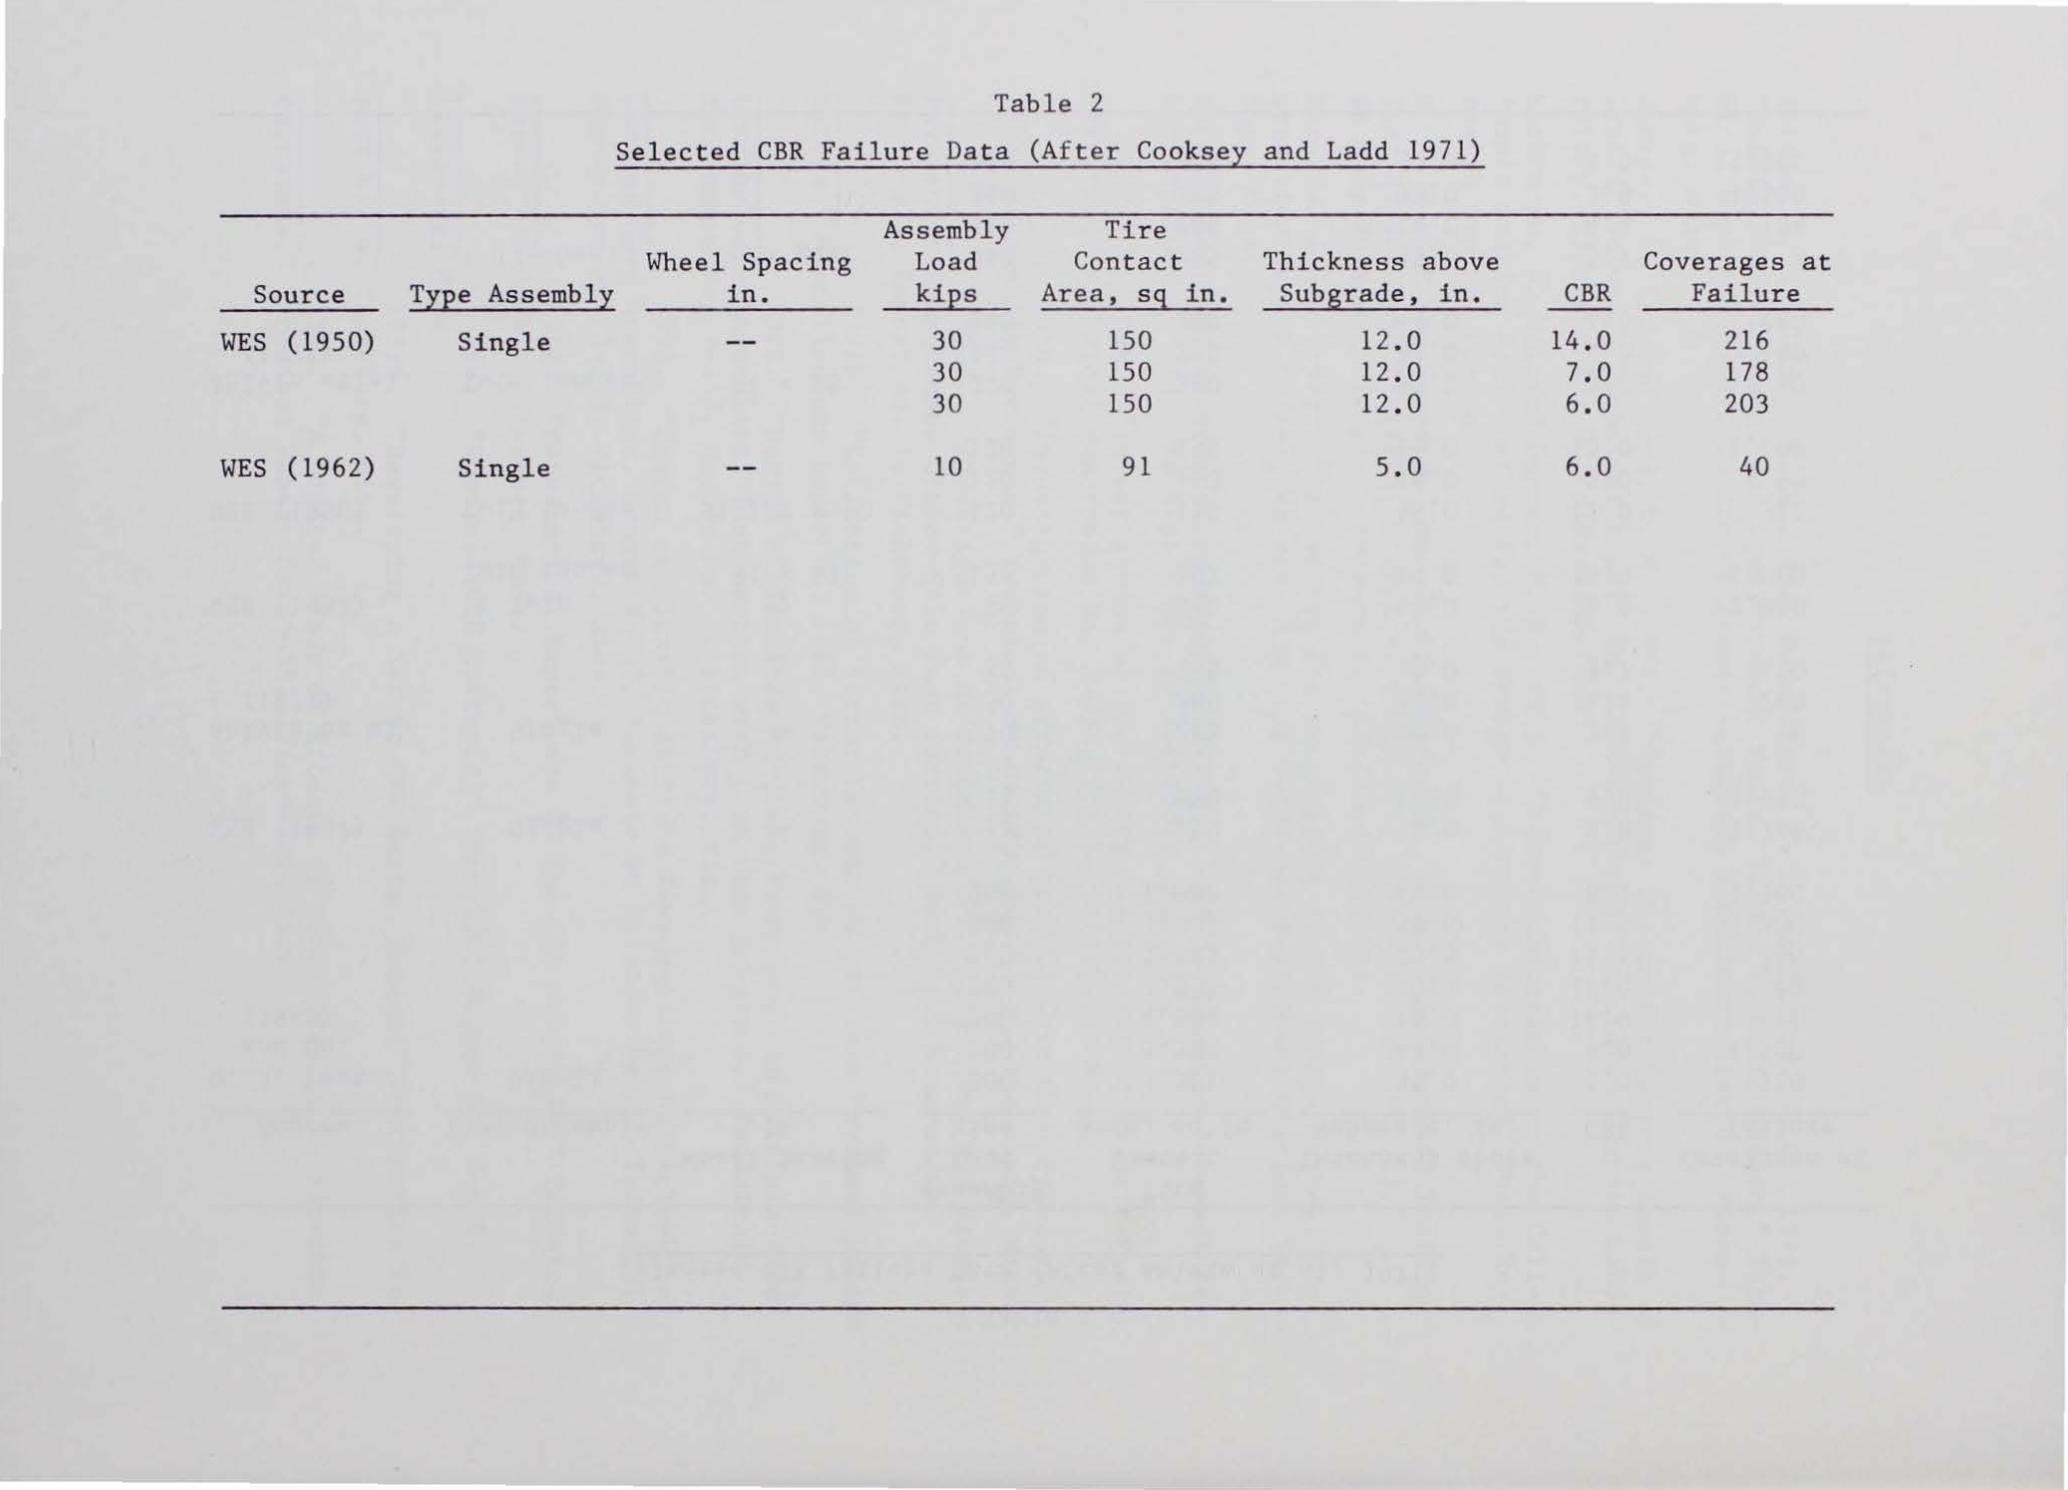
Table 2
Selected CBR Failure Data (After Cooksey and Ladd 1971)
Assembly Tire Wheel Spacing Load Contact Thickness above Coverages at
Source Type Assembly in. kips Area, sq in. Subgrade , in. CBR Failure
WES (1950) Single 30 150 12.0 14.0 216 30 150 12 . 0 7.0 178 30 150 12.0 6.0 203
WES (1962) Single 10 91 5 . 0 6 .0 40
<( w a: <(
1-u <( 1-en 2 en 0 w
2 u ~ u.. u 0 -I 1-1- 0
0 a: w a: <( :::> 0 en
0
0.5
1.0
1.5
2.0
0.01
0 6 0
• • --
, ..•.. • • rJ • •
0
0
00
0 0
0.02 0.03 0.04 0.05 0.06 0.08 0.1
CBR TIRE PRESSURE
LEGEND
NONFAI LURES 2,000 COVERAGES AND ABOVE
NONFAI LURES 1,000 TO 2,000 COVERAGES
NONFAILURES BELOW 1,000 COVERAGES
FAILURES
BORDER LINE (caR GRAPHICAL MODIFICATION TO CBR EQUATION ,~ p
0
0
0.2
o• 0 00
0
0 0 0
0.3 0.4 0.6 0.8
Figure 1. Curve from CBR fo rmula compared to behavior data (af t er WES 1959a)
1

... -
0
1
2
3
4
5
6
7
0 .001 0.01 0.1 1 CBR /P
Figure 2. t /I.A versus CBR/ p
1.4
1.2
1.0
d . a: 0 1-u <{ 0.8 u. z 0 -1-1-w 0.6 0.. w a: 0 <{ 0 ...J
0.4
0.2
0
10°
usED I I RES E sV'J L.
0 0. oF pulE N corv1 1
0 lo 2
0
0 0
0
0
FAILURE DATA
0 SINGLE WHEEL
A TWIN WHEEL
0 TWIN TANDEM
• 12-WHEEL
101 102 103 104
AIRCRAFT TRAFFIC VOLUME FACTOR, PASSES
Figure 3. Composite plot of load repetition factors versus passes (after Ahlvin et al. 1971)
105
0
1
2
3
4
5
6
7
0.001
/ ~ ~
/7 ,0
0 ~
L
I v
REGRESSION EOUA TION
0 .01 CBR/P
~
~v---......:'=
......: .......:
/.
CBR CURVE
0.1
Figure 4 . Comparison of the CBR curve and the regression equation by Ahlvin et al. (1971)
I
I
1
d . a: 0 I-(,) <( u. z 0 -I--I-w a. w a: 0 <( 0 ..J
1.20
fiR~5 1.00 ,A IN
oF~ Ff u~B~ R ,AI RcR.A 2
N p~R
0.80
24
0.60
0.40
0.20
COVERAGES
Figure 5 . Flexible pavement thickness adjustment curves for various landing gears (after Cooksey and Ladd 1971)

-....
0
1
•• 2
3
4 r-----------------~_,~------------------~--------------------~
5 r-------------~----~---------------------+--------------------~
6 r---------~---------r--------------------r-------------------~
7 ------~~~~._~~~----~--~~~~~~-----L--~~~~~~ 0.001 0.01 0 .10 1.0
CBR/P
Figure 6. Complete t/ai.A versus CBR/p


