
REGIONAL DEMAND FORECASTING STUDY FOR TRANSPORTATION
FUELS IN TURKEY
Özlem Atalay
Prof. Gürkan Kumbaroğlu
Bogazici University
INTRODUCTION
The prediction of fuel consumption has been an important tool for energy planning, with the following purposes which cited as to
• (i) develop right pricing and taxation systems,
• (ii) help decide future investments on fuels,
• (iii) aid address emission and pollution issues, and
• (iv) plan of future energy needs, identify national infrastructure and research and development requirements.
Bogazici University
INTRODUCTION
In general, established models can be handled in six main categories.
• Multi Linear Regression Models (region-based and yearly)• Moving Average (region-based and yearly)• Double Moving Average (region-based and yearly)• Simple Exponential Smoothing (region-based and yearly)• Double Exponential Smoothing (region-based and yearly)• Time series models Holt–Winters’ model (region-based and
quarterly)
Bogazici University
Regions and Fuel Distribution According to
Regions for the year 2013
Bogazici University
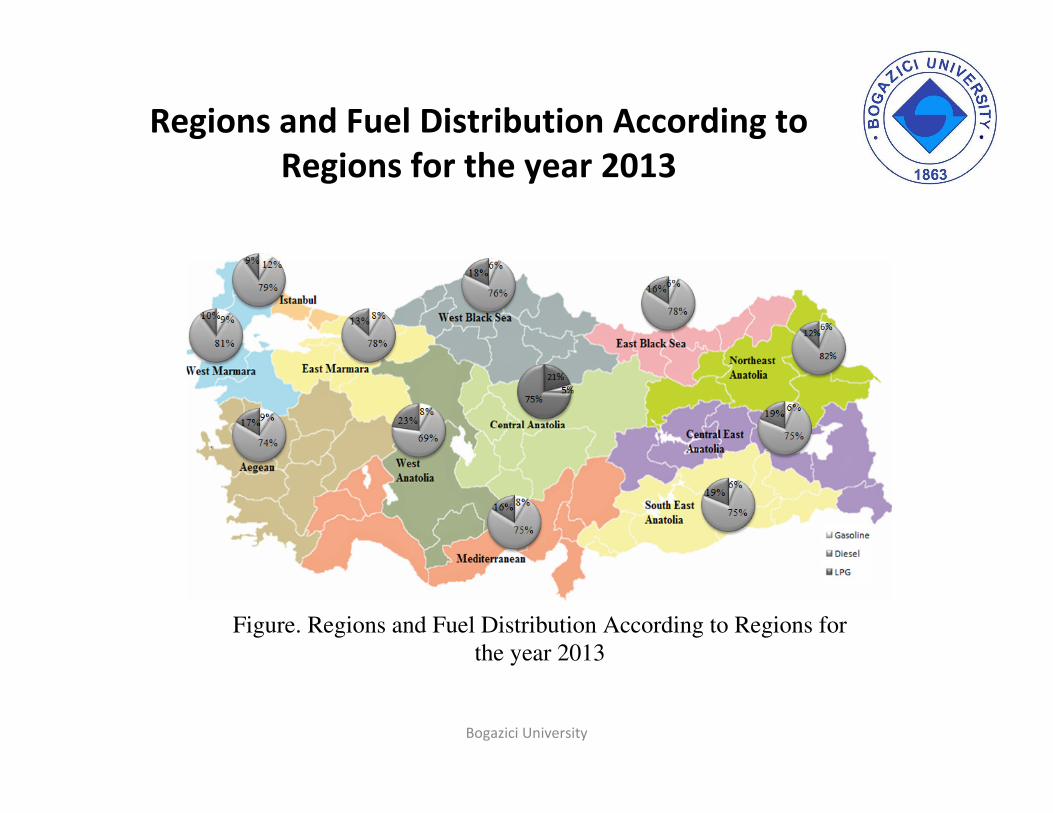
Figure. Regions and Fuel Distribution According to Regions for
the year 2013

THE TRANSPORT SECTOR IN TURKEY
Bogazici University
Figure. Road Transportation Fuel Demand
Figure . The Percentage Distribution of Vehicles According to Fuel Type in Turkey and Istanbul
INDEPENDENT VARIABLES
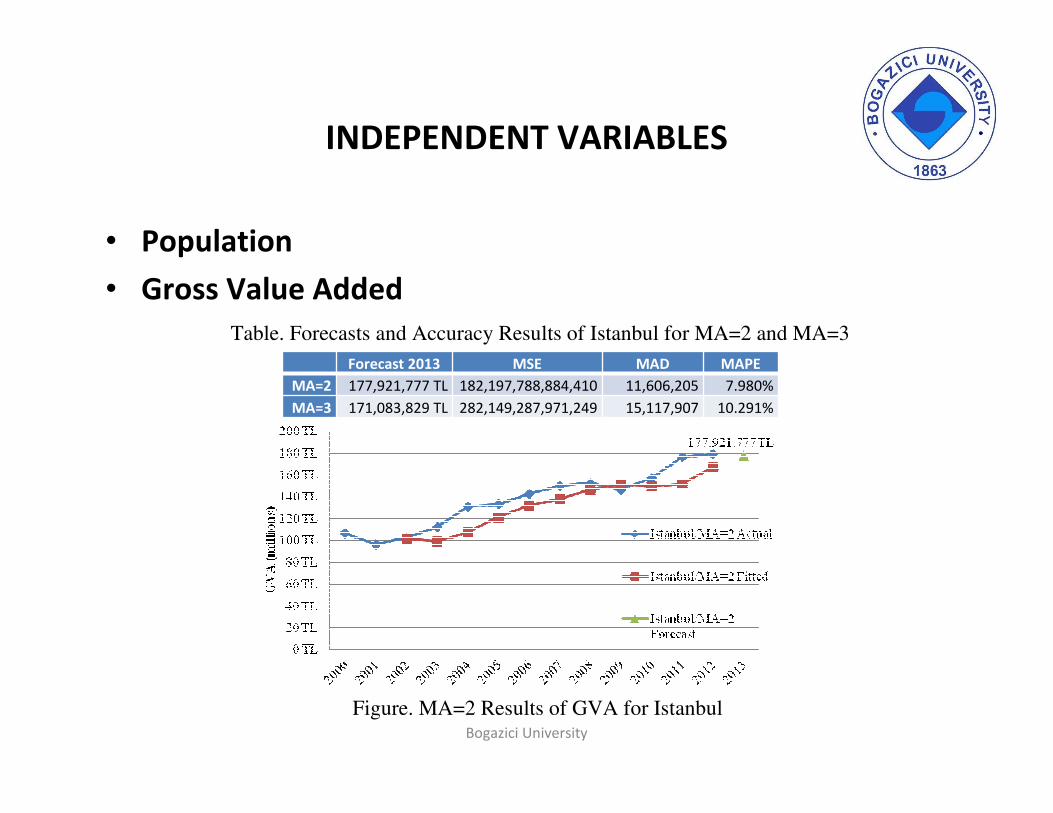
• Population
• Gross Value Added
Bogazici University
Forecast 2013 MSE MAD MAPE
MA=2 177,921,777 TL 182,197,788,884,410 11,606,205 7.980%
MA=3 171,083,829 TL 282,149,287,971,249 15,117,907 10.291%
Table. Forecasts and Accuracy Results of Istanbul for MA=2 and MA=3
Figure. MA=2 Results of GVA for Istanbul
INDEPENDENT VARIABLES
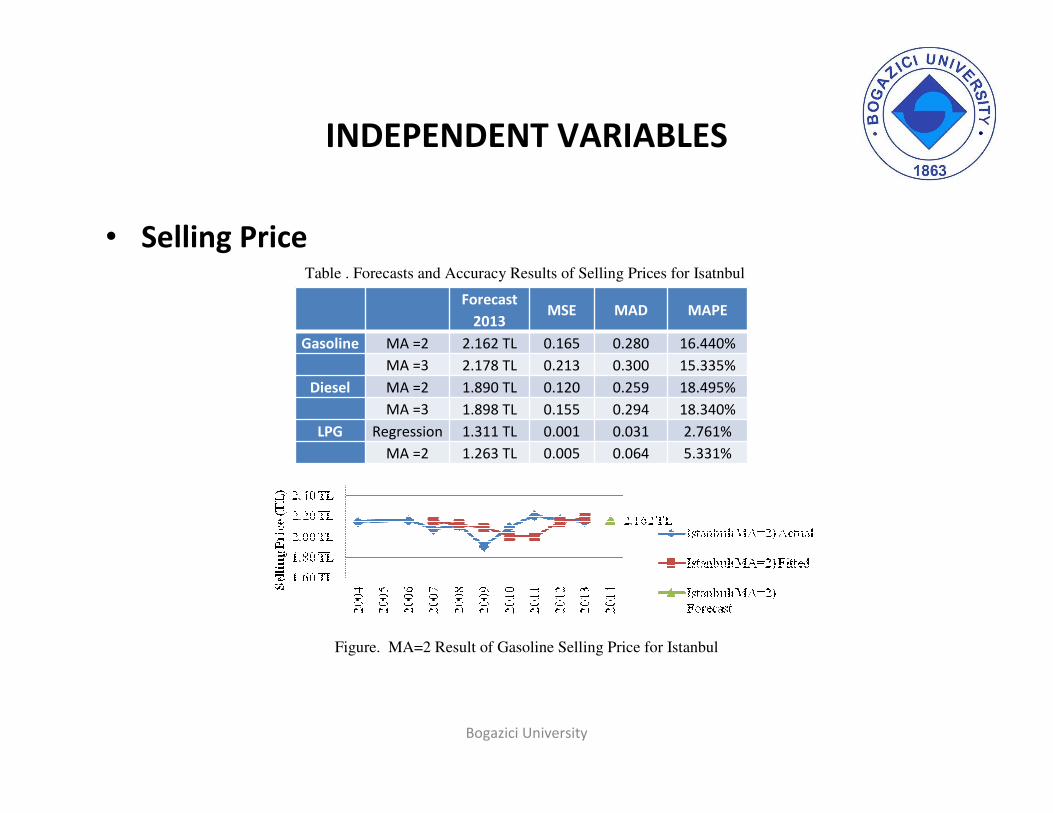
• Selling Price
Bogazici University
Forecast
2013MSE MAD MAPE
Gasoline MA =2 2.162 TL 0.165 0.280 16.440%
MA =3 2.178 TL 0.213 0.300 15.335%
Diesel MA =2 1.890 TL 0.120 0.259 18.495%
MA =3 1.898 TL 0.155 0.294 18.340%
LPG Regression 1.311 TL 0.001 0.031 2.761%
MA =2 1.263 TL 0.005 0.064 5.331%
Table . Forecasts and Accuracy Results of Selling Prices for Isatnbul
Figure. MA=2 Result of Gasoline Selling Price for Istanbul
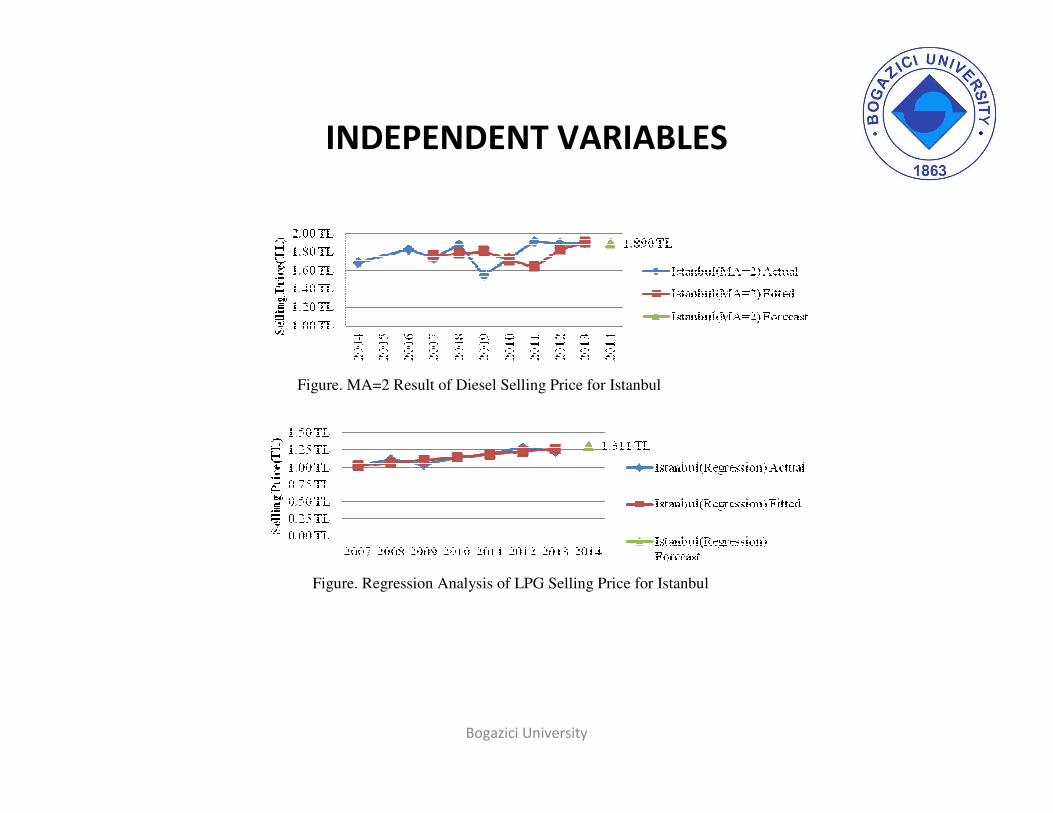
INDEPENDENT VARIABLES
Bogazici University
Figure. MA=2 Result of Diesel Selling Price for Istanbul
Figure. Regression Analysis of LPG Selling Price for Istanbul

INDEPENDENT VARIABLES
• Car Park
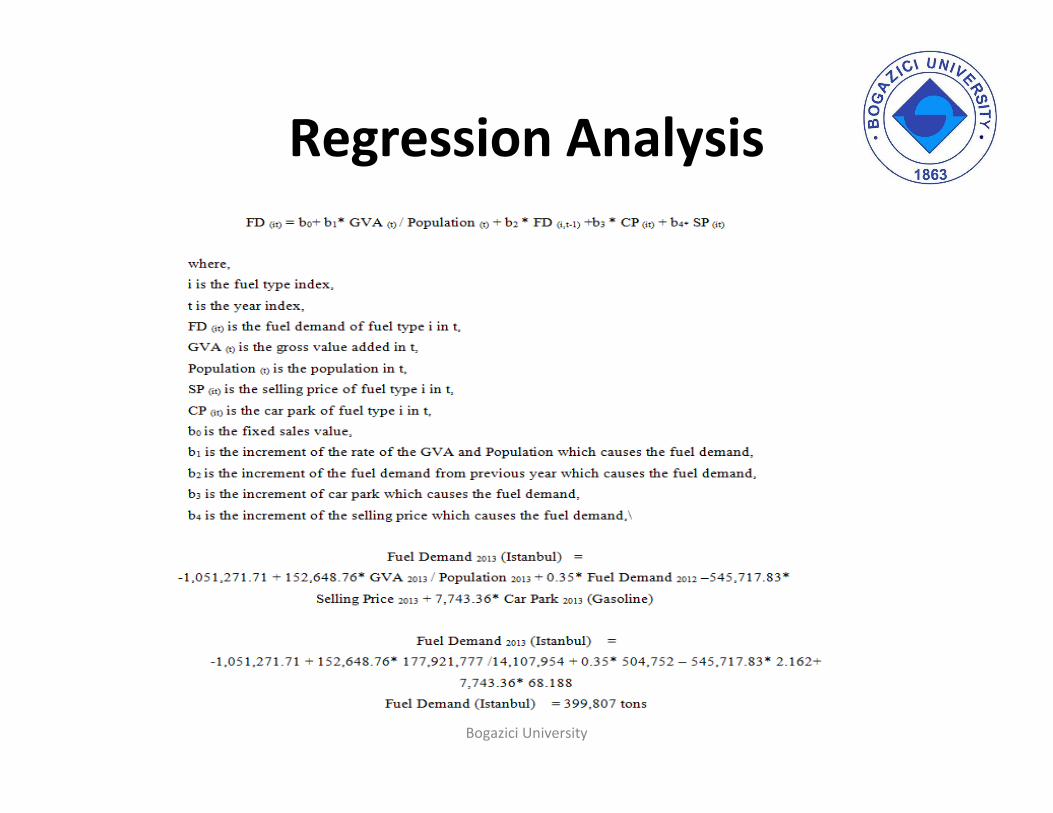
CP (it) = b0+ b1* GVA (t) / P (t) + b2 * CP (i, t-1)
- i is the fuel type index,- t is the year index,- CP (it) is the car park of fuel type i in time t,- GVA (t) is the Gross Value Added in time t, - P (t) is the population in time t,- CP (i, t-1) is the car park of fuel type i in time t-1,- b0 is the fixed sales value,- b1 is the increment of the rate of the GVA and Population which
causes the car park,- b2 is the increment of the car park from previous year which
causes the car park.
Bogazici University
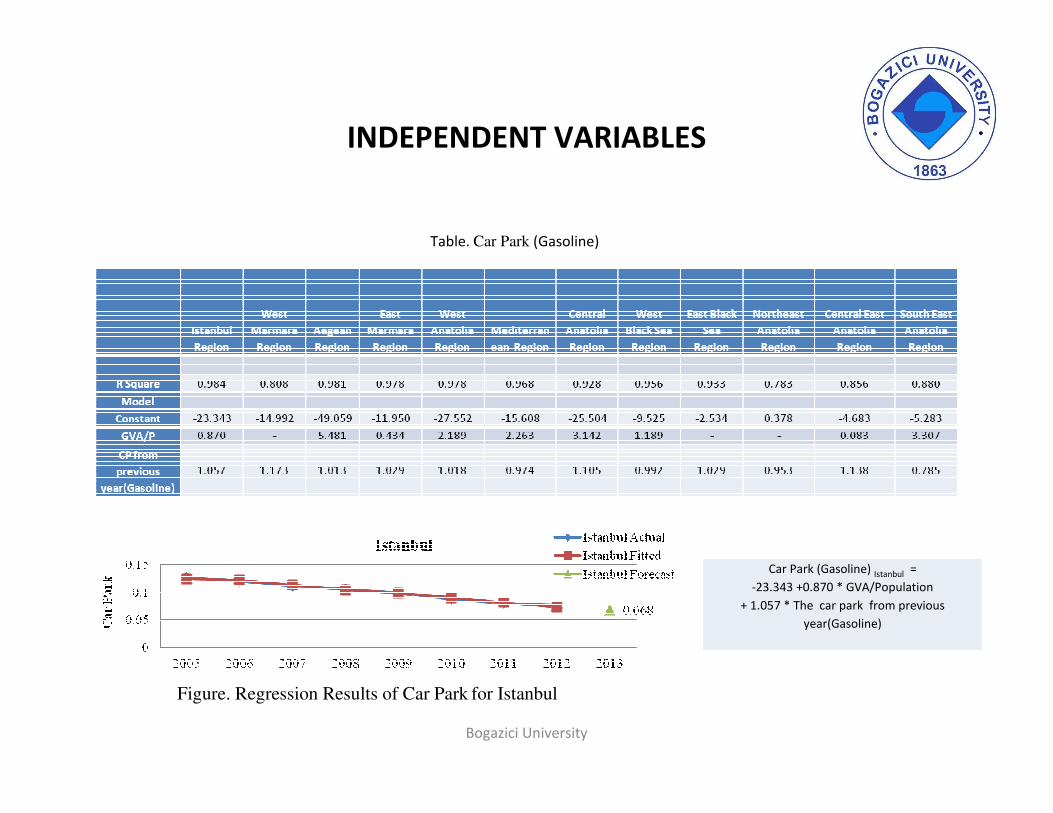
INDEPENDENT VARIABLES
Bogazici University
Table. Car Park (Gasoline)
Car Park (Gasoline) Istanbul =
-23.343 +0.870 * GVA/Population
+ 1.057 * The car park from previous
year(Gasoline)
Figure. Regression Results of Car Park for Istanbul
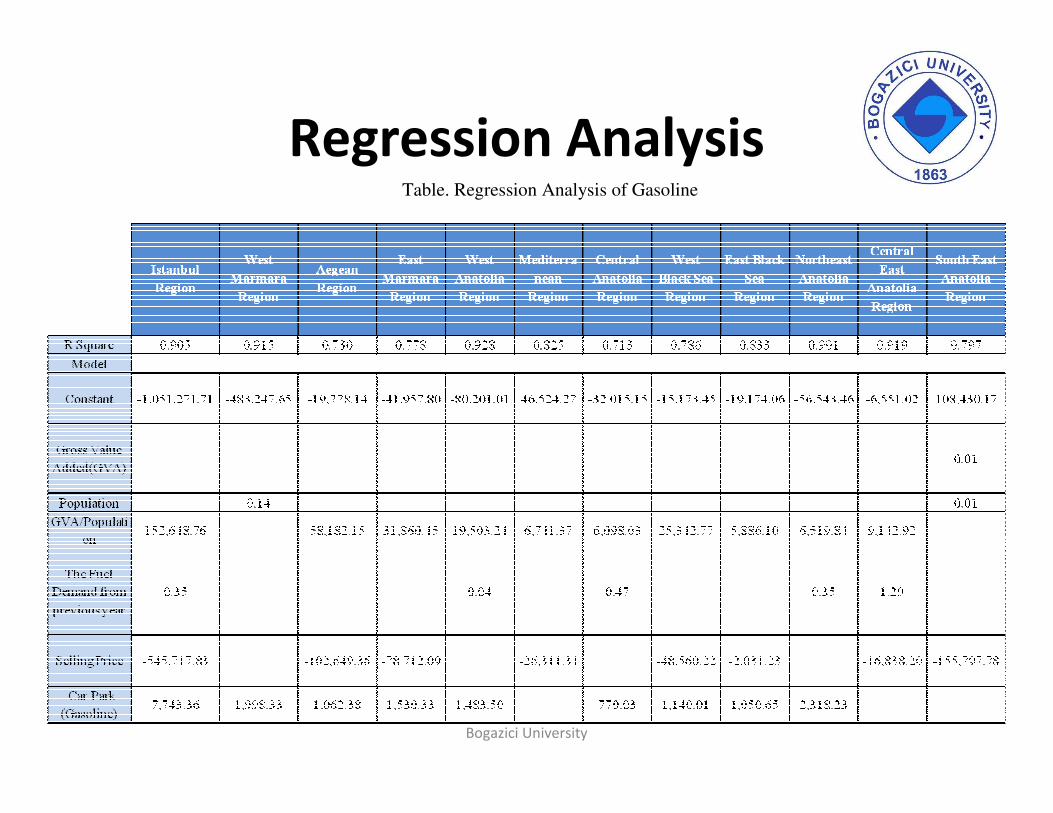
Regression Analysis
Bogazici University
Table. Regression Analysis of Gasoline
Regression Analysis
Bogazici University

Regression Analysis
Bogazici University
Figure. Regression Results of the Amount of Yearly Gasoline Sales for Istanbul

COMPARISON OF THE FUEL DEMAND
Bogazici University
Figure. Comparison of the Amount of Yearly Gasoline Sales for Istanbul (MA=2)
Figure. Comparison of the Amount of Yearly Gasoline Sales for Istanbul (MA=3)
MSE MAD MAPE
9.54E+09 73,368 13.119%
MSE MAD MAPE
15,195,631,702 111,514 20%
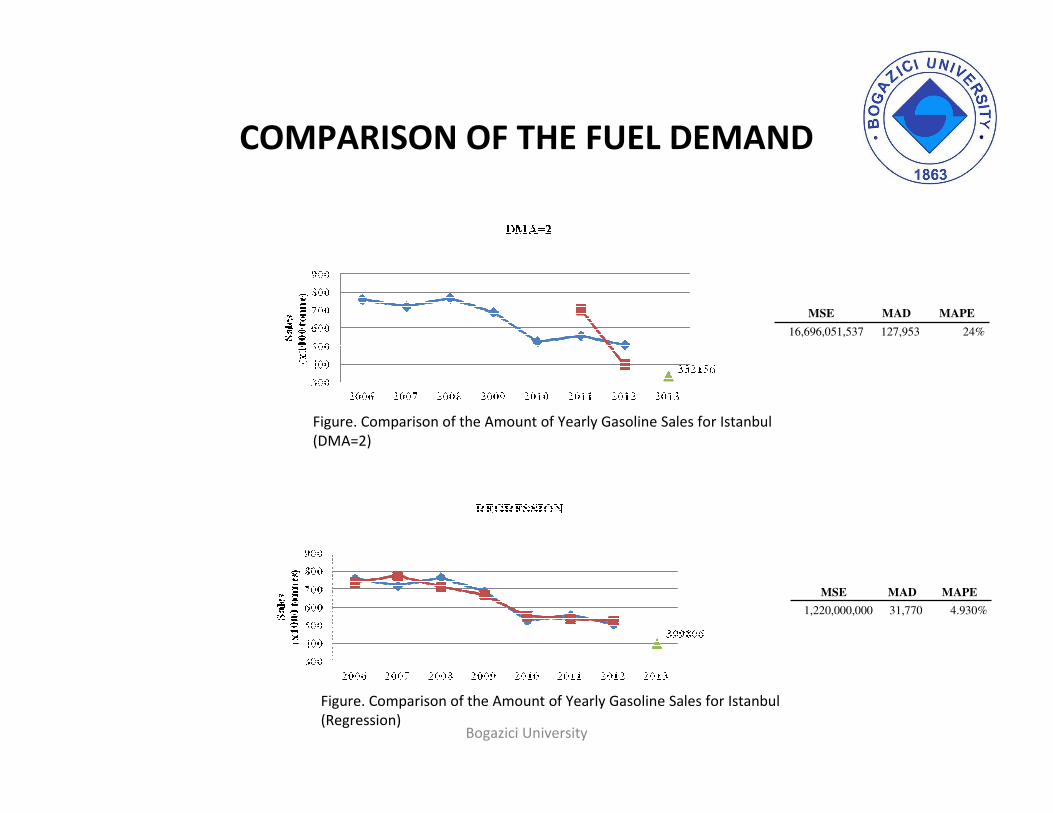
COMPARISON OF THE FUEL DEMAND
Bogazici University
Figure. Comparison of the Amount of Yearly Gasoline Sales for Istanbul (Regression)
Figure. Comparison of the Amount of Yearly Gasoline Sales for Istanbul (DMA=2)
MSE MAD MAPE
16,696,051,537 127,953 24%
MSE MAD MAPE
1,220,000,000 31,770 4.930%

COMPARISON OF THE FUEL DEMAND
Bogazici University
Figure. Comparison of the Amount of Yearly Gasoline Sales for Istanbul (SES)
Figure. Comparison of the Amount of Yearly Gasoline Sales for Istanbul (DES)
MSE MAD MAPE
7,915,307,493 71,488 12.571%
MSE MAD MAPE
6,567,972,636 67,549 11.518%

TRIPLE EXPONENTIAL SMOOTHING
Bogazici University
MSE MAD MAPE Q1 113593
1.04E+08 8029.888 6.016% Q2 121716
Α β γ Q3 119491
0.523525 0.223519 0.912047 Q4 117046
Table. Accuracy of Winter’s Method for Gasoline Sales
Figure. Winter’s Method for The Amount of Yearly Gasoline Sales (Quarterly)
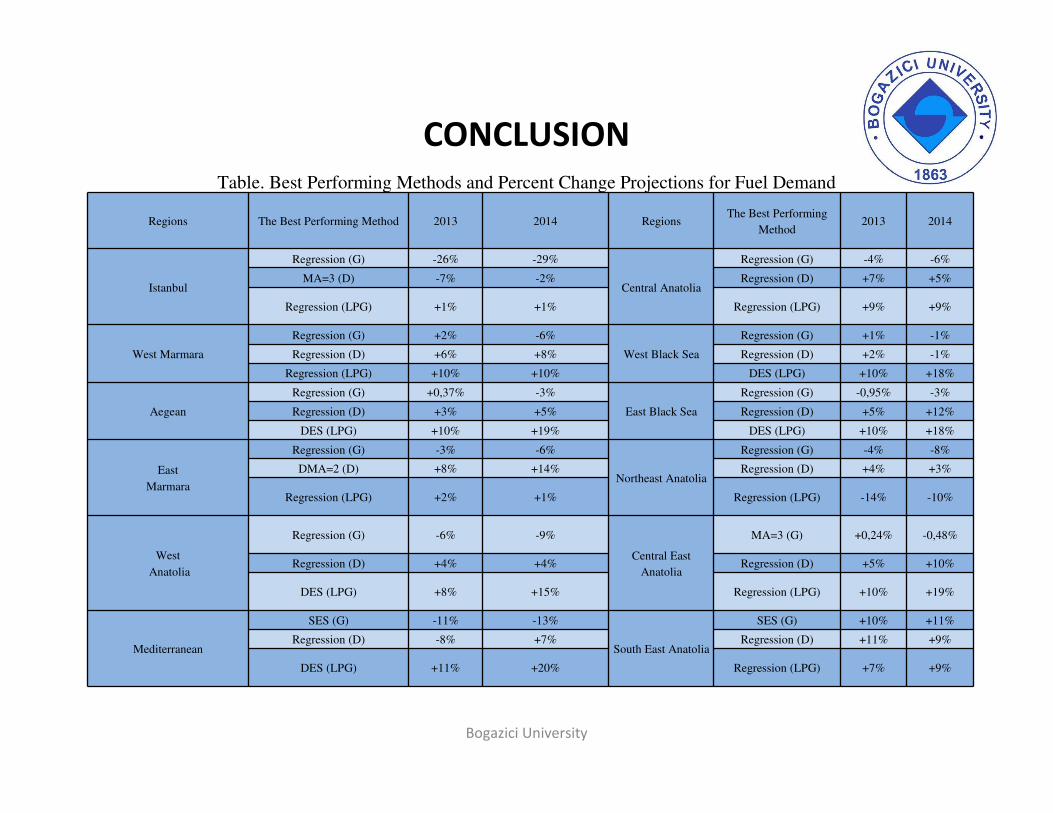
CONCLUSION
Bogazici University
Regions The Best Performing Method 2013 2014 RegionsThe Best Performing
Method2013 2014
Istanbul
Regression (G) -26% -29%
Central Anatolia
Regression (G) -4% -6%
MA=3 (D) -7% -2% Regression (D) +7% +5%
Regression (LPG) +1% +1% Regression (LPG) +9% +9%
West Marmara
Regression (G) +2% -6%
West Black Sea
Regression (G) +1% -1%
Regression (D) +6% +8% Regression (D) +2% -1%
Regression (LPG) +10% +10% DES (LPG) +10% +18%
Aegean
Regression (G) +0,37% -3%
East Black Sea
Regression (G) -0,95% -3%
Regression (D) +3% +5% Regression (D) +5% +12%
DES (LPG) +10% +19% DES (LPG) +10% +18%
East
Marmara
Regression (G) -3% -6%
Northeast Anatolia
Regression (G) -4% -8%
DMA=2 (D) +8% +14% Regression (D) +4% +3%
Regression (LPG) +2% +1% Regression (LPG) -14% -10%
West
Anatolia
Regression (G) -6% -9%
Central East
Anatolia
MA=3 (G) +0,24% -0,48%
Regression (D) +4% +4% Regression (D) +5% +10%
DES (LPG) +8% +15% Regression (LPG) +10% +19%
Mediterranean
SES (G) -11% -13%
South East Anatolia
SES (G) +10% +11%
Regression (D) -8% +7% Regression (D) +11% +9%
DES (LPG) +11% +20% Regression (LPG) +7% +9%
Table. Best Performing Methods and Percent Change Projections for Fuel Demand


