
Regional Outlook
Bernard M. MarksteinDirector of Forecasting
April, 2007

History and
Forecast
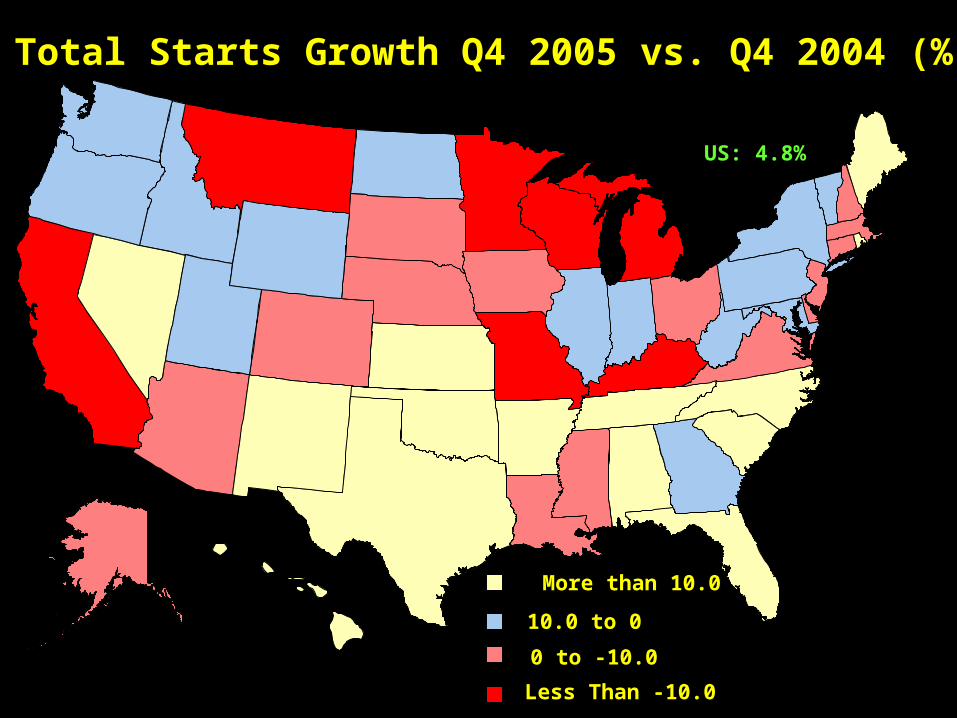
10.0 to 0
0 to -10.0
Less Than -10.0
More than 10.0
US: 4.8%
Total Starts Growth Q4 2005 vs. Q4 2004 (%)
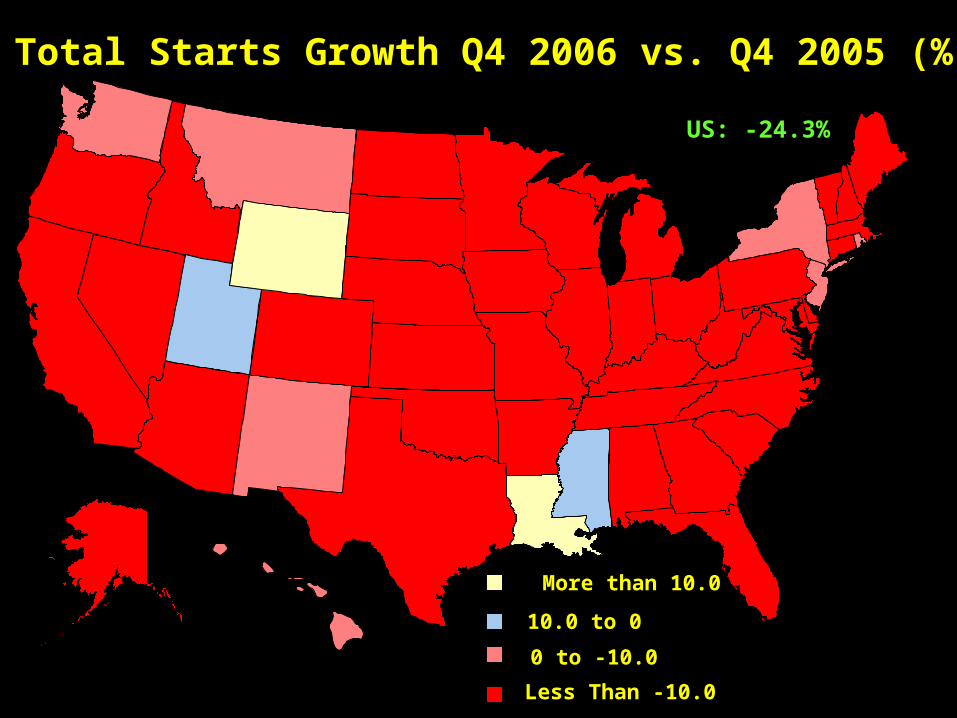
Total Starts Growth Q4 2006 vs. Q4 2005 (%)
10.0 to 0
0 to -10.0
Less Than -10.0
More than 10.0
US: -24.3%

Total Starts Growth Q4 2007 vs. Q4 2006 (%)
10.0 to 0
0 to -10.0
Less Than -10.0
More than 10.0
US: -5.4%

Total Starts Growth Q4 2008 vs. Q4 2007 (%)
10.0 to 0
0 to -10.0
Less Than -10.0
More than 10.0
US: 5.8%

Population Growth

Population Change: 2005 versus 2004
More than 2%
1% to 2%
0% to 1%
Less than 0%
US: 0.98%

Population Change: 2006 versus 2005
More than 2%
1% to 2%
0% to 1%
Less than 0%
US: 0.98%

Employment Growth

Employment Growth: 2005 versus 2004
More than 2%
1% to 2%
0% to 1%
Less than 0%
US: 1.7%

Employment Growth: 2006 versus 2005
More than 2%
1% to 2%
0% to 1%
Less than 0%
US: 1.9%

Housing Prices

Change in Existing Home Prices in Y/Y Q4, 2005
20% or more
10% to 20%
5% to 10%
5% or less
US: 13.2%

Change in Existing Home Prices in Y/Y Q4, 2006
20% or more
10% to 20%
5% to 10%
5% or less
US: 5.9%

Subprime Loans

Share of Loans serviced at Subprime: 2002 Q4
Less than 4%
4% to 7%
7% to 10%
More than 10%
US: 3.8%
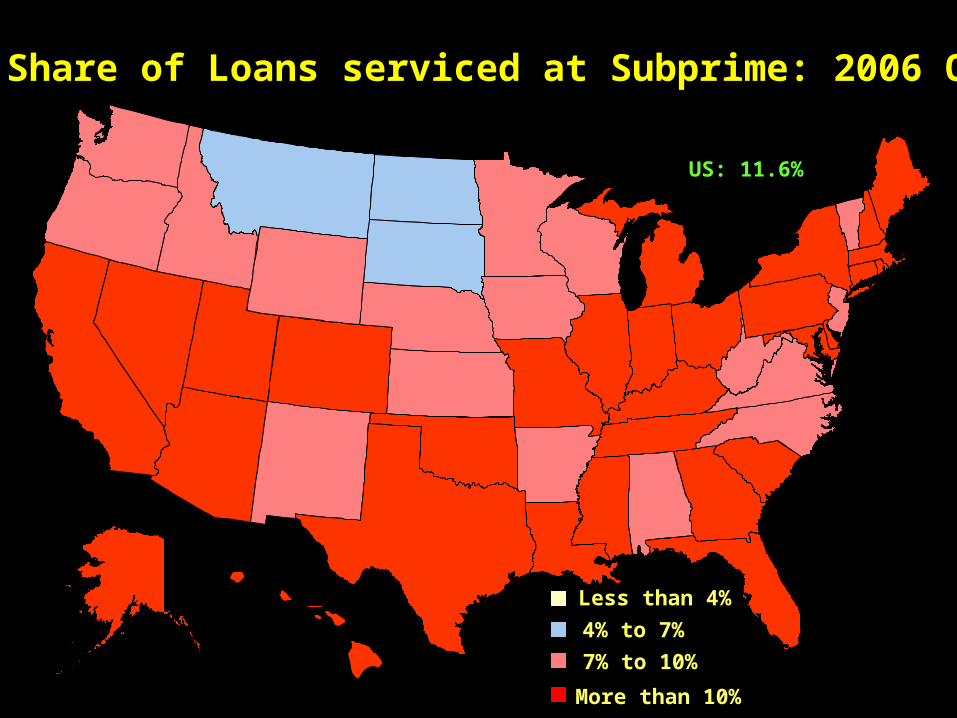
Share of Loans serviced at Subprime: 2006 Q4
Less than 4%
4% to 7%
7% to 10%
More than 10%
US: 11.6%

Share of Loans serviced at Subprime: % point increase from 2002 Q4 to 2006 Q4
Less than 3
3 to 6
6 to 9
More than 9
US: 7.8


