
ABOUT THIS SURVEY
REGISTERED NURSES in California
This study of California registered nurses (RNs) is the tenth survey conducted by the Board of Registered Nursing since 1990. In April, 2016, surveys were mailed to 8,000 RNs with Cali-fornia licenses living both within and outside California. The response rate was 53.5 percent of the eligible population, producing data from 4,178 RNs. All analyses were weighted to ensure the results represent the total population of RNs with California licenses.The complete report is available at: https://rnworkforce.ucsf.edu/publications/brn2016
2006 2008 2010 2012 2014 2016
100,000
200,000
300,000
400,000342,250
259,531
54,02154,02144,02344,023
RNs LIVING IN CALIFORNIA
RNs LIVING IN OTHER STATES/COUNTRIES
5% MALES
5% MALES
12% MALES
95% FEMALES
95% FEMALES
88% FEMALES
51-60
41-50
31-40
60+
under 30
1990 2004 2016
AVERAGE AGE 42.9 y
UNDER 30 8%
31-40 36%
41-50 29%
51-60 19%
60+ 7%
AVERAGE AGE 47.6 y
UNDER 30 4%
31-40 16%
41-50 29%
51-60 33%
60+ 17%
AVERAGE AGE 45 y
UNDER 30 9%
31-40 26%
41-50 26%
51-60 23%
60+ 16%
AGE AND GENDER COMPOSITION
1990
2004
2016
0% 25% 50% 75% 100%
Other/MixedFilipinoBlack/African AmericanHispanicWhite
RACE/ETHNICITY COMPOSITION In 1990, most RNs were 31 to 40 years old. The average age of RNs has risen since then. In 2016, equal shares were 31 to 40 years old and 41 to 50 years old.
90-95%UNDER 60 YEARS
77%60-64 YEARS
47%65+ YEARS
HOURS PER WEEK ON AVERAGE IN 1990-2016
81%
86%79%
EMPLOYMENT RATES

25.4
26.9
27.6
25
26
27
1990 2004 2016
199020042016
0 25% 50% 75% 100%
Diploma program Associate degree Baccalaureate degree Master's or Doctorate Degree 30 unit program Other
199020042016
0 25% 50% 75% 100%
Diploma program Associate degree Baccalaureate degree Master's or Doctorate Degree
EDUCATION
PRE-LICENSURE EDUCATION
REGISTERED NURSES in California
HIGHEST NURSING DEGREE
AVERAGE AGE OF GRADUATION
CURRENTLY ENROLLED IN NURSING DEGREE OR CERTIFICATION PROGRAM
8%
10%
12%
2006 2012 2016

JOB TITLESWORK SETTINGS
NURSING JOB TITLES
REGISTERED NURSES in California
JOB TITLE 1993 2004 2016 TREND 1993-2016 Staff Nurse/Direct patient care provider 59.5% 53.3% 51.3%Charge Nurse — — 1.9%Staff Nurse and Charge Nurse (both) — — 15.6%Senior management, any setting — — 1.8%Senior management, service setting 3.5% 1.7% —Middle management, any setting — — 5.4%Middle management, service setting 14.5% 6.3% —Front-line management — 11.1% 2.1%Management/Administration, academic setting 0.2% 0.1% —Clinical Nurse Specialist 3.2% 2.3% 0.5%Certified Registered Nurse Anesthetist 0.5% 0.4% 0.4%Certified Nurse Midwife 0.2% 0.2% 0.2%Nurse Practitioner 1.8% 3.6% 3.9%Educator, service setting/clinical nurse educator 2.0% 2.0% —Educator, academic setting 1.3% 1.0% —School Nurse 1.2% 1.9% 1.2%Public Health Nurse 2.2% 1.7% 1.5%Patient care coordinator/case manager — — 5.3%Discharge Planner — 0.1% —Case Manager 4.5% 3.9% —QI/Utilization Review Nurse — 0.7% 1.9%Occupational Health Nurse — — 0.3%Telenursing — — 1.0%Nurse Coordinator — — —Consultant 0.9% 0.7% —Researcher 0.8% 0.6% 0.5%Infection Control Nurse — — 0.3%Clinical Nurse Leader — — 0.3%Other 3.3% 8.3% 1.4%
1990 2004 2016
19% 22%
12%
NURSING WORK SETTING
SHARE OF RNs WITH MORE THAN ONE JOB
1.2%
3.4%
0.6%
3.3%
2006 2010 2016
0.8%
1.6%
TRAVEL AGENCYTEMPORARY WORK
SHARE OF RNs IN A TEMPORARY OR TRAVELING JOB
WORK SETTING 1990 2004 2016 TREND 1990-2016Acute hospital 67.9% 60.9% 66.3%Hospital, inpatient or emergency — — 56.1%Hospital, nursing home unit — — 1.1%Hospital, ambulatory unit — — 8.1%Hospital, ancillary unit — — 0.5%Hospital, other department — — 2.1%Skilled nursing/extended care/ rehabilitation 5.6% 4.4% 5.1%Academic nursing program 1.3% 0.9% 0.9%Public health dept/community health agency 3.4% 2.1% 1.4%Home health nursing agency/service 3.8% 3.3% 3.4%Hospice — 1.3% 0.3%Ambulatory care setting (office, surgery center) 11.8% 10.8% 8.2%Dialysis — — 1.0%Telenursing organization/call center — 0.6% 0.6%Occupational health/employee health 1.5% 0.3% 0.4%School health (K-12 or college) 2.1% 2.0% 1.3%Mental health/drug and alcohol treatment — 2.0% 1.6%Forensic setting (correctional facility, prison, jail) — 1.1% 1.5%Government agency (local, state, federal) — 2.7% 0.8%Case management/disease management — — 2.1%Self employed 1.1% 0.8% 0.3%Other 1.5% 6.9% 2.5%
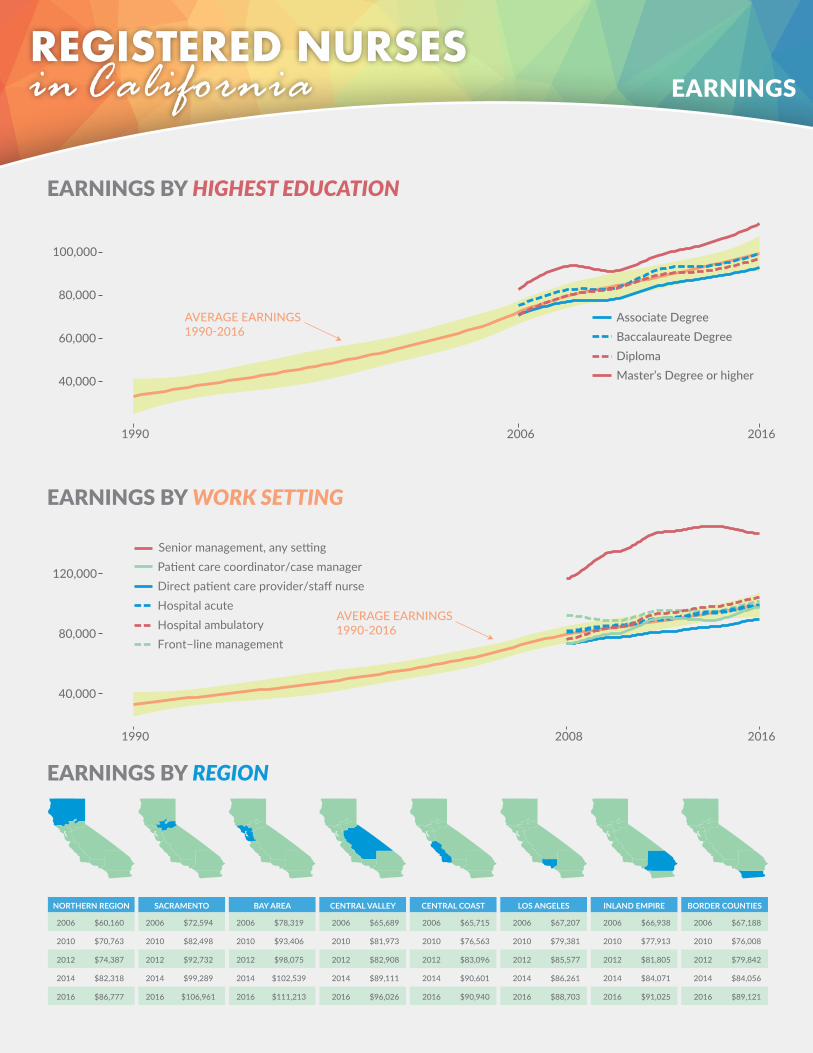
40,000
60,000
80,000
100,000
1990 2006 2016
Associate DegreeBaccalaureate DegreeDiplomaMaster’s Degree or higher
40,000
80,000
120,000
1990 2008 2016
Direct patient care provider/staff nurse
Front−line management
Hospital acuteHospital ambulatory
Patient care coordinator/case managerSenior management, any setting
AVERAGE EARNINGS1990-2016
AVERAGE EARNINGS1990-2016
NORTHERN REGION
2006 $60,160
2010 $70,763
2012 $74,387
2014 $82,318
2016 $86,777
SACRAMENTO
2006 $72,594
2010 $82,498
2012 $92,732
2014 $99,289
2016 $106,961
BAY AREA
2006 $78,319
2010 $93,406
2012 $98,075
2014 $102,539
2016 $111,213
CENTRAL VALLEY
2006 $65,689
2010 $81,973
2012 $82,908
2014 $89,111
2016 $96,026
CENTRAL COAST
2006 $65,715
2010 $76,563
2012 $83,096
2014 $90,601
2016 $90,940
LOS ANGELES
2006 $67,207
2010 $79,381
2012 $85,577
2014 $86,261
2016 $88,703
INLAND EMPIRE
2006 $66,938
2010 $77,913
2012 $81,805
2014 $84,071
2016 $91,025
BORDER COUNTIES
2006 $67,188
2010 $76,008
2012 $79,842
2014 $84,056
2016 $89,121
EARNINGS
EARNINGS BY HIGHEST EDUCATION
REGISTERED NURSES in California
EARNINGS BY WORK SETTING
EARNINGS BY REGION

Recognition for a job well done
Feeling that work is meaningful
Quality of patient care where you work
Employer-supported educational opportunities
Quality of preceptor and mentor programs
Opportunities to learn new skills
Opportunities to use your skills
Involvement in policy/management decisions
Time available for patient education
Interaction with patients
Relations with agency/registry nurses
Relations with other non-nursing staff
Relations with physicians
Involvement in patient care decisions
Leadership from your nursing administration
Teamwork between coworkers and yourself
Support from other nurses you work with
Opportunities for advancement
Job security
Work schedule
Physical work environment
Your workload
Amount of paperwork required
Non-nursing tasks required
Adequacy of clerical support services
Adequacy of the number of RNs where you work
Adequacy of RN skill level where you work
Employee benefits
Your salary
Your job overall
Very dissatisfied
Dissatisfied Neutral
Very satisfiedSatisfied
Four of the five aspects of nursing that received the highest average satisfaction ratings in 2016 were the same items receiving the highest ratings in 2014: Interactions with patients, nursing profession overall, feeling that work is mean-ingful, and job overall. In 2014, the five items with greatest satisfaction also included relations with non-nursing staff (ranked 7th in 2016).
JOB SATISFACTION
JOB SATISFACTION IN 2016
REGISTERED NURSES in California
INTERACTION WITH PATIENTS (4.24)
NURSING PROFESSION OVERALL (4.21)
FEELING THAT WORK IS MEANINGFUL (4.16)
YOUR JOB OVERALL (4.15)
TEAMWORK (4.14)
AMOUNT OF PAPERWORK REQUIRED (3.18)
INVOLVEMENT IN POLICY AND MANAGEMENT DECISIONS (3.23)
NON-NURSING TASKS REQUIRED (3.35)
ADEQUACY OF THE NUMBER OF RN STAFF (3.37)
LEADERSHIP FROM NURSING ADMINISTRATION (3.39)

FUTURE PLANS
EMPLOYMENT PLANS IN 5 YEARS
REGISTERED NURSES in California
1990 2004 2016
Plan to work approximately as much as nowPlan to reduce hours of nursing workPlan to increase hours of nursing workPlan to retire or leave nursing
0 20 40 60 80%
Plan to work approximately as much as now
0 5 10 15 20%
Plan to increase hours of nursing work
0 5 10 15 20 25 30%
Plan to reduce hours of nursing work
0 1 2 3 4 5 6 7%
Plan to leave nursing entirely, but not retire
0 10 20 30 40 50 60 70%
Plan to retire
under 30 years
35-44 years
45-54 years
55-64 years
65 years or more
under 30 years
35-44 years
45-54 years
55-64 years
65 years or more
AGE GROUPS
5 YEAR PLANS
2 YEAR PLANS
EMPLOYMENT PLANS IN 2 YEARS AND 5 YEARS — BY AGE GROUP (2016)


