Remote sensing of natural hazards
Remote sensing =satellite imagery and aerial photography
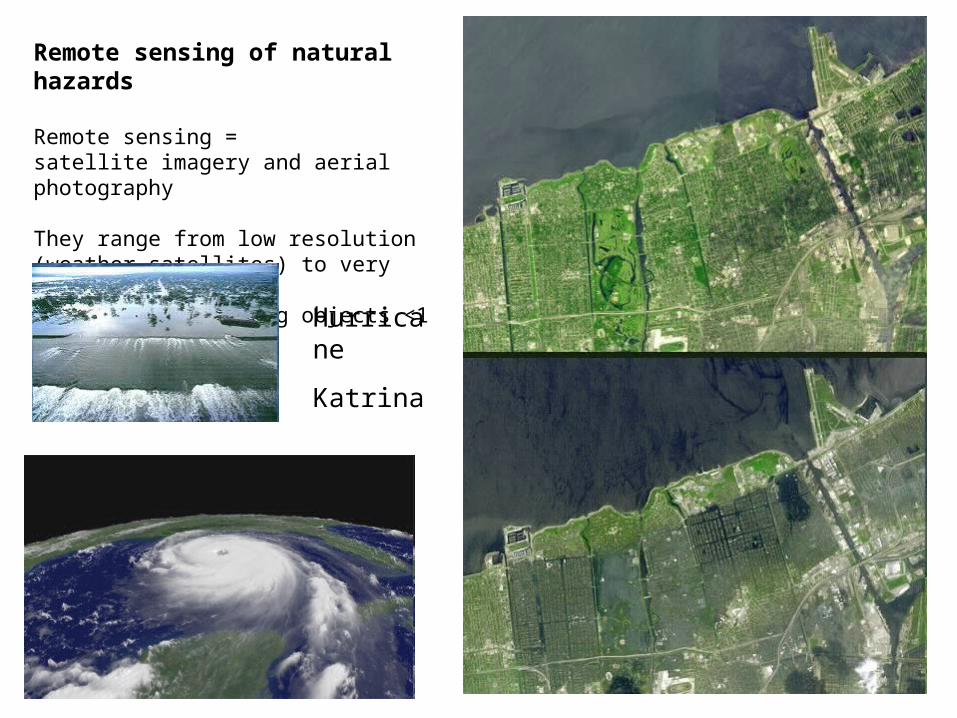
They range from low resolution (weather satellites) to very high res ..capable of detecting objects <1 metre Hurrican
e
Katrina
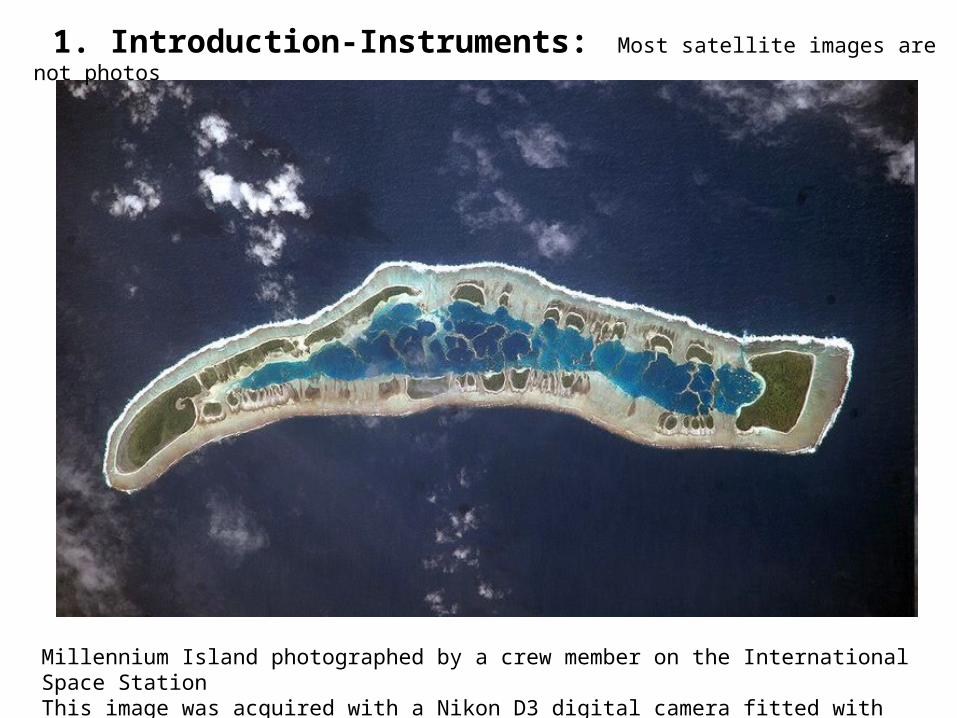
Millennium Island photographed by a crew member on the International Space StationThis image was acquired with a Nikon D3 digital camera fitted with an 800 mm lens
1. Introduction-Instruments: Most satellite images are not photos
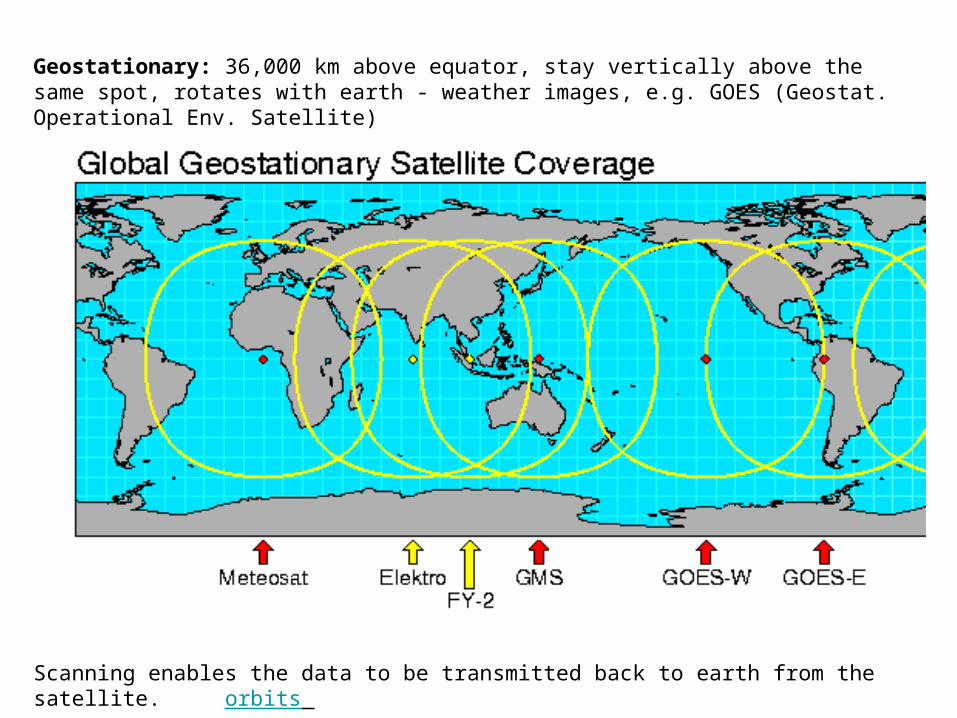
Geostationary: 36,000 km above equator, stay vertically above the same spot, rotates with earth - weather images, e.g. GOES (Geostat. Operational Env. Satellite)
Scanning enables the data to be transmitted back to earth from the satellite. orbits
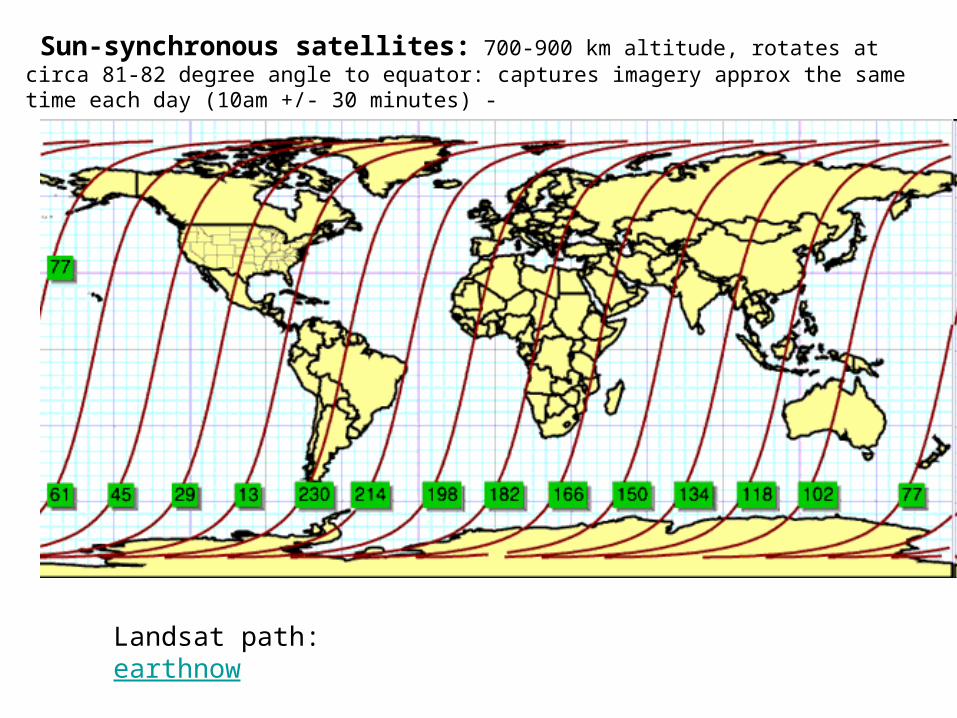
Sun-synchronous satellites: 700-900 km altitude, rotates at circa 81-82 degree angle to equator: captures imagery approx the same time each day (10am +/- 30 minutes) -
Landsat path: earthnow
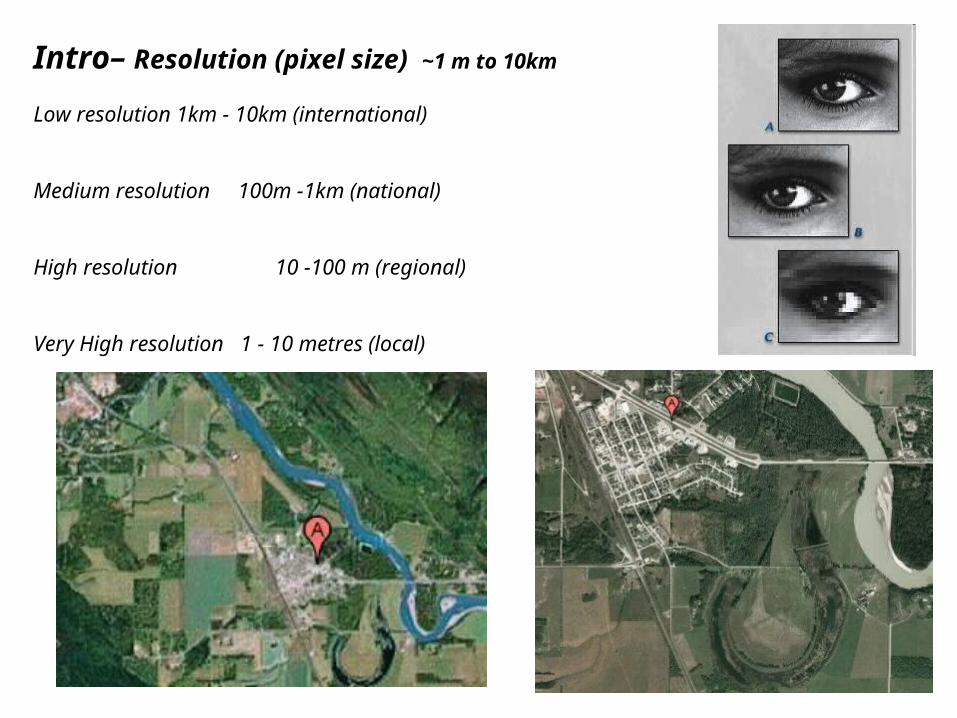
Intro– Resolution (pixel size) ~1 m to 10km
Low resolution 1km - 10km (international)
Medium resolution 100m -1km (national)
High resolution 10 -100 m (regional)
Very High resolution 1 - 10 metres (local)
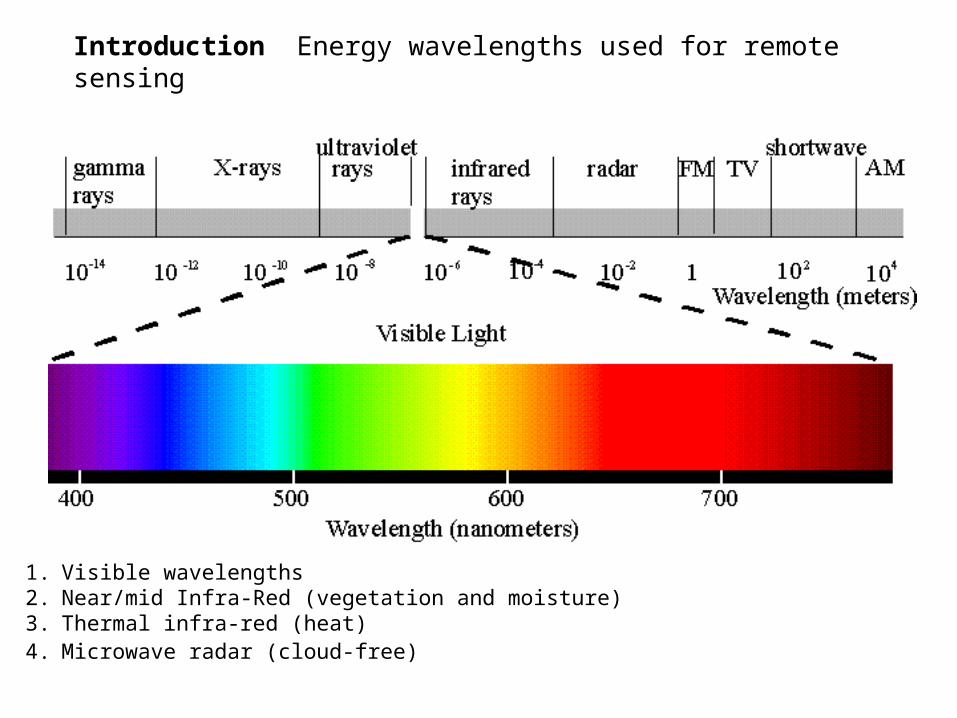
1. Visible wavelengths 2. Near/mid Infra-Red (vegetation and moisture) 3. Thermal infra-red (heat) 4. Microwave radar (cloud-free)
Introduction Energy wavelengths used for remote sensing
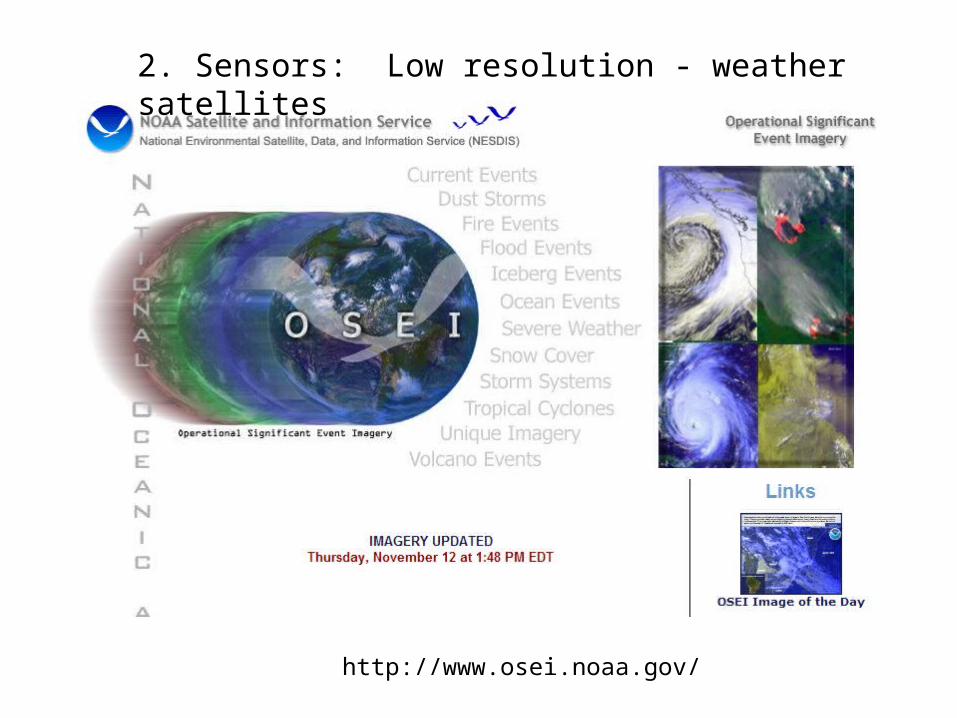
http://www.osei.noaa.gov/
2. Sensors: Low resolution - weather satellites
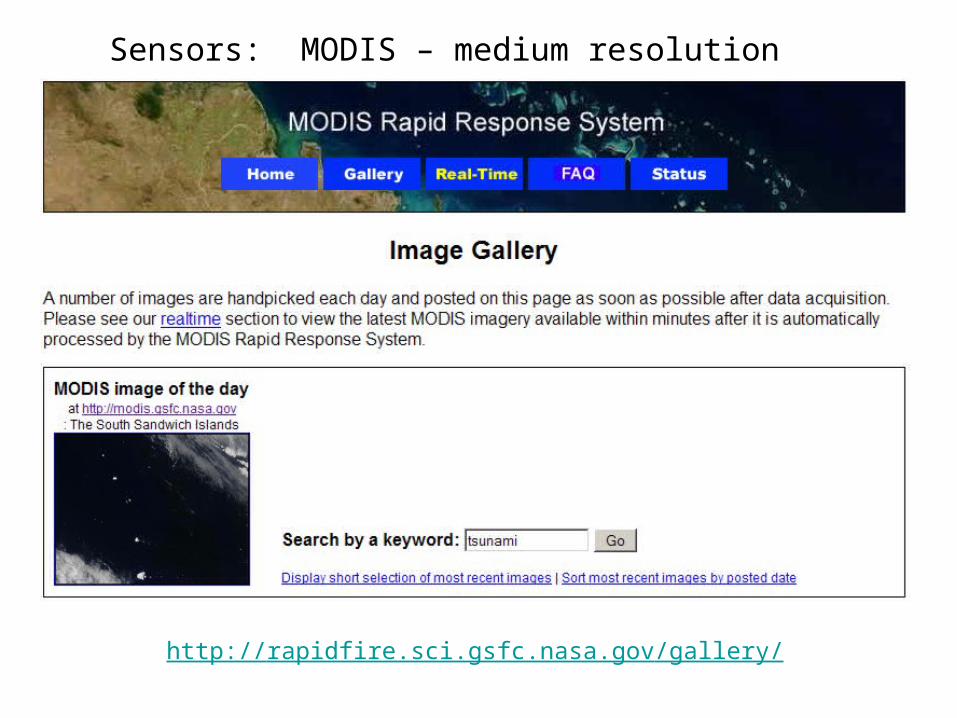
http://rapidfire.sci.gsfc.nasa.gov/gallery/
Sensors: MODIS – medium resolution
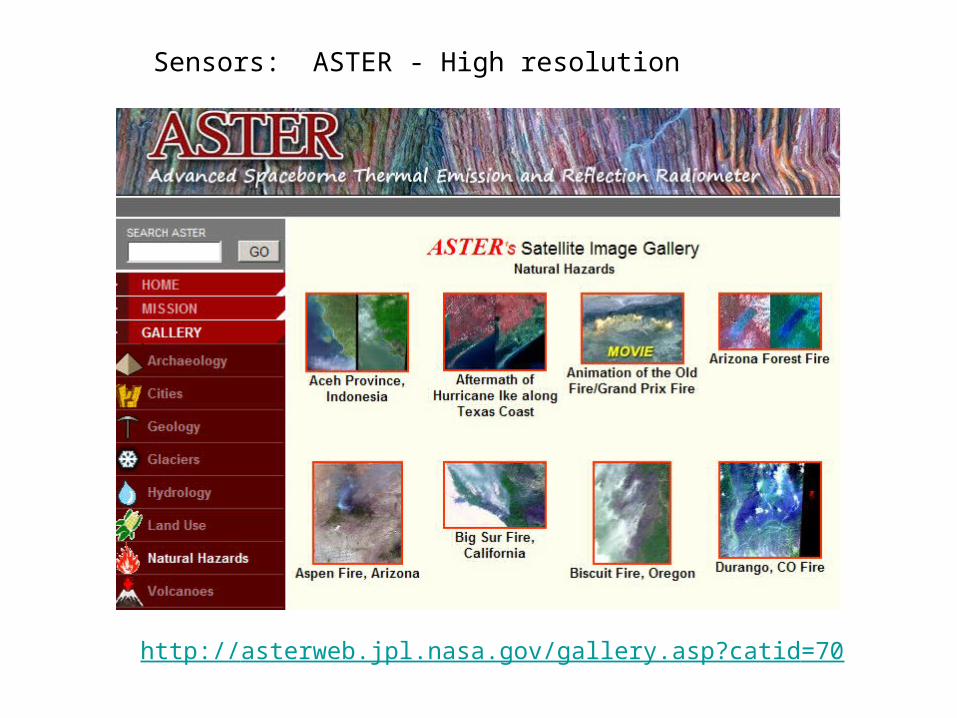
http://asterweb.jpl.nasa.gov/gallery.asp?catid=70
Sensors: ASTER - High resolution
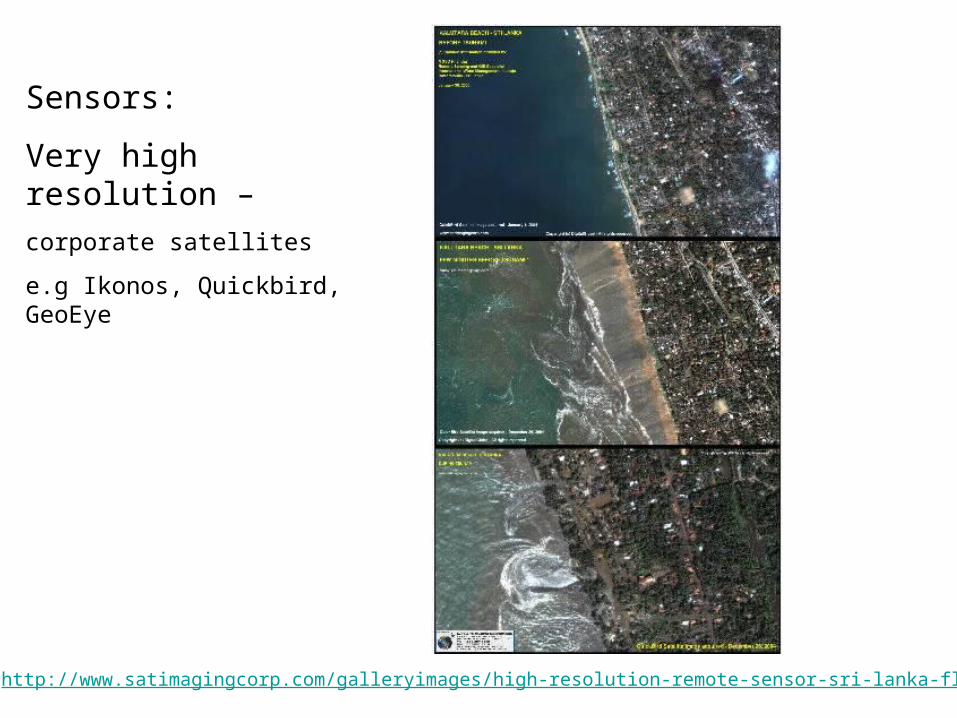
http://www.satimagingcorp.com/galleryimages/high-resolution-remote-sensor-sri-lanka-flood.jpg
Sensors:
Very high resolution –corporate satellites
e.g Ikonos, Quickbird, GeoEye
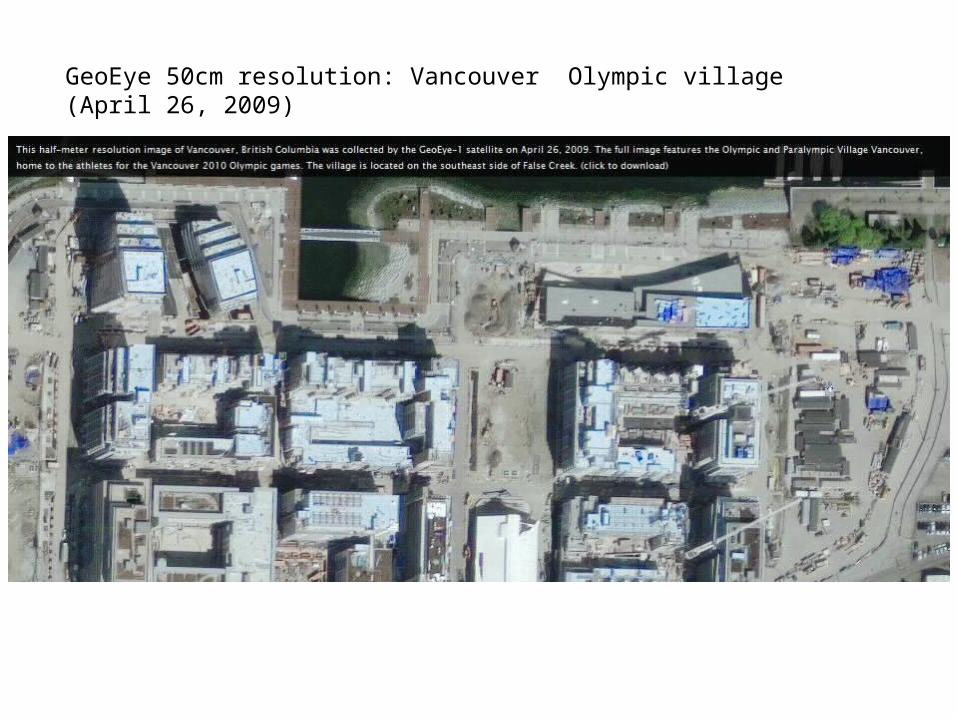
GeoEye 50cm resolution: Vancouver Olympic village (April 26, 2009)
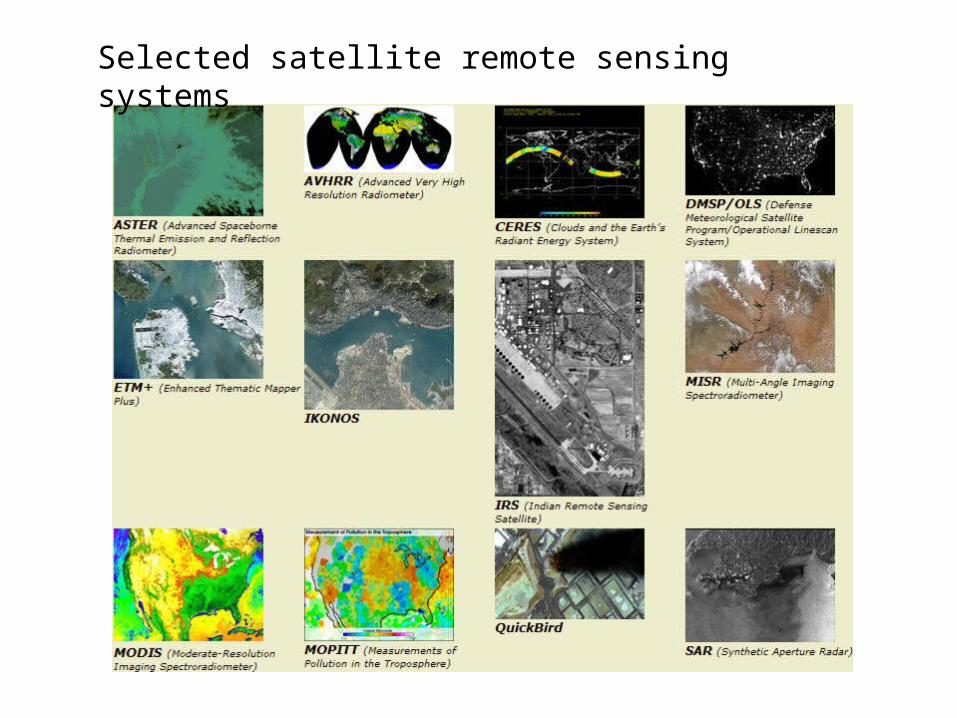
Selected satellite remote sensing systems
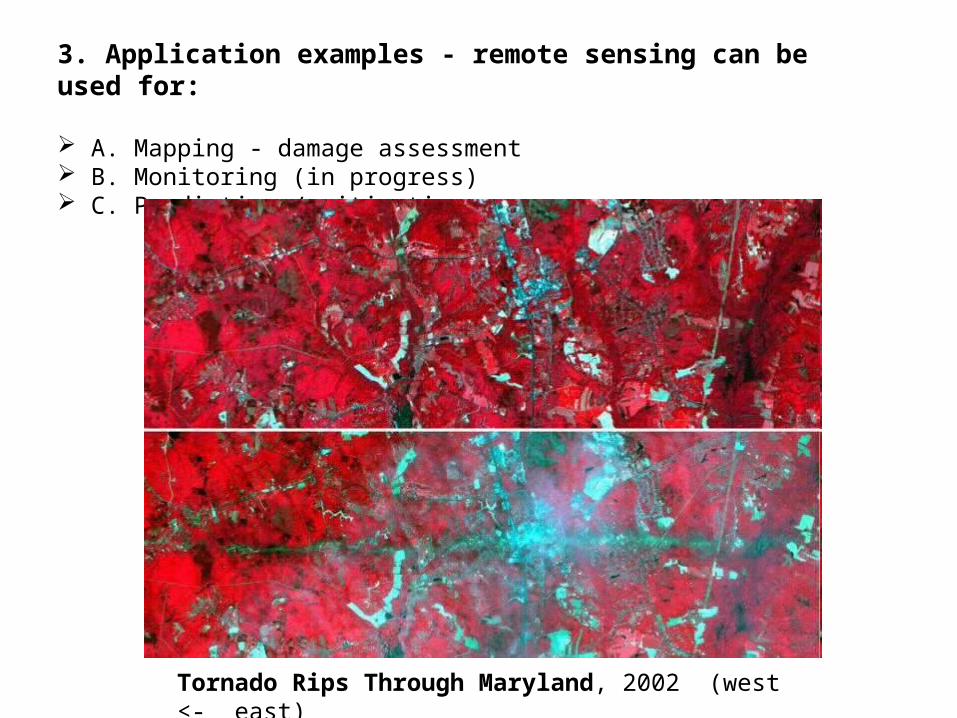
3. Application examples - remote sensing can be used for: A. Mapping - damage assessment B. Monitoring (in progress) C. Prediction / mitigation
Tornado Rips Through Maryland, 2002 (west <- east)
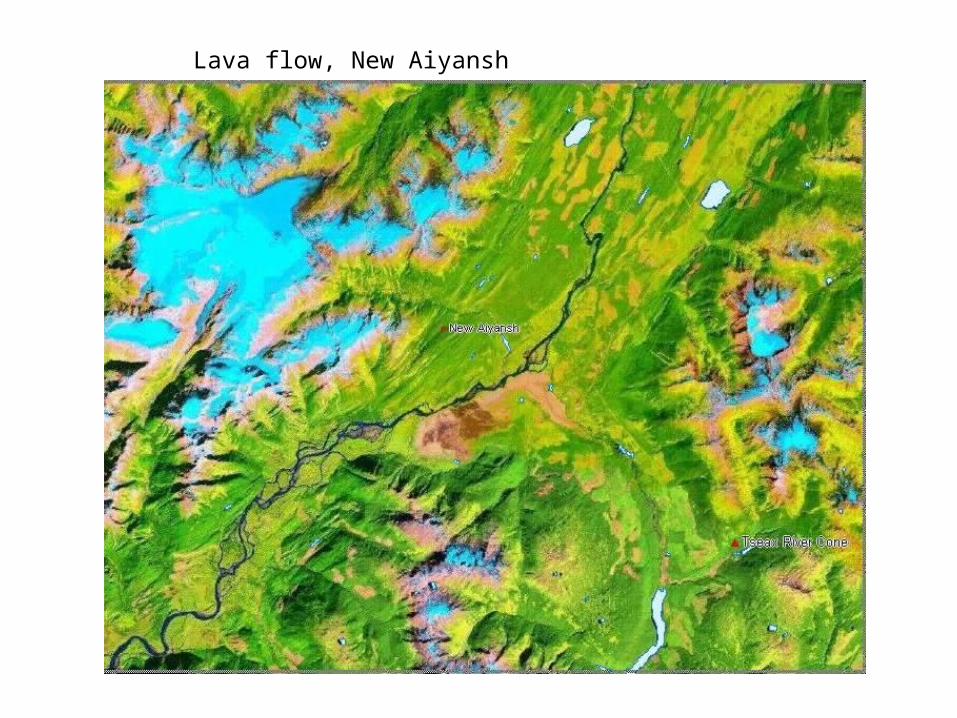
Lava flow, New Aiyansh
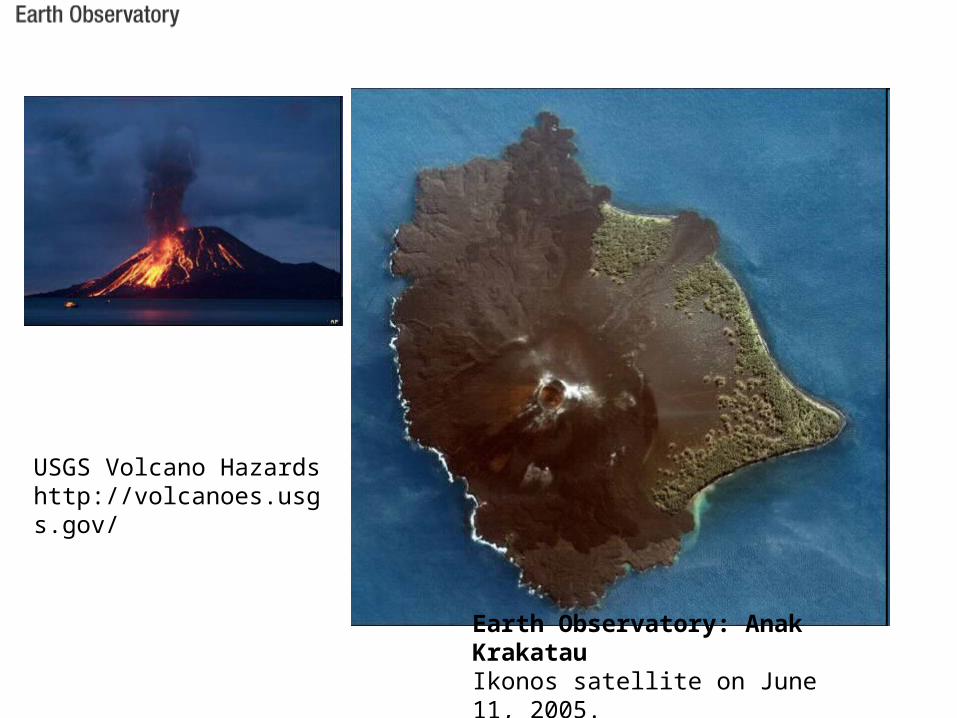
Earth Observatory: Anak KrakatauIkonos satellite on June 11, 2005.
USGS Volcano Hazards http://volcanoes.usgs.gov/
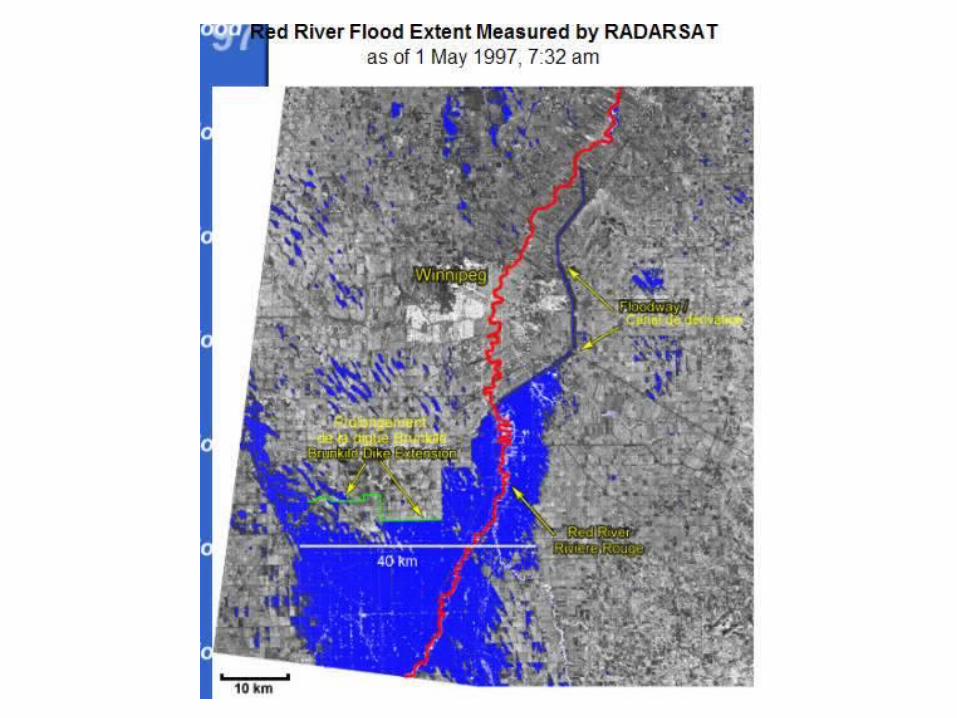
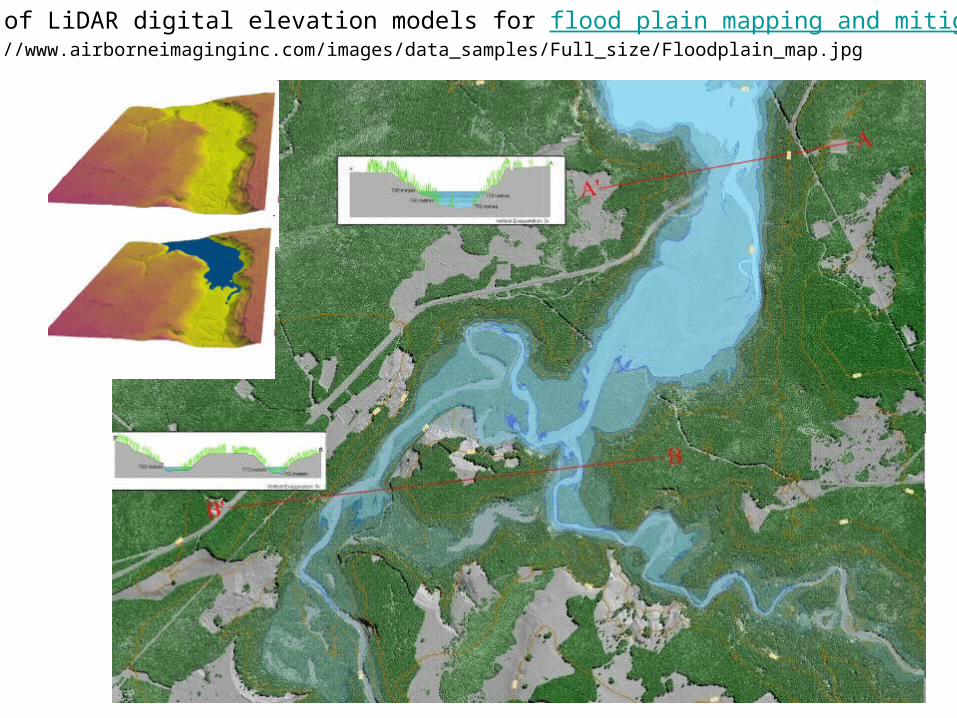
Use of LiDAR digital elevation models for flood plain mapping and mitigation http://www.airborneimaginginc.com/images/data_samples/Full_size/Floodplain_map.jpg
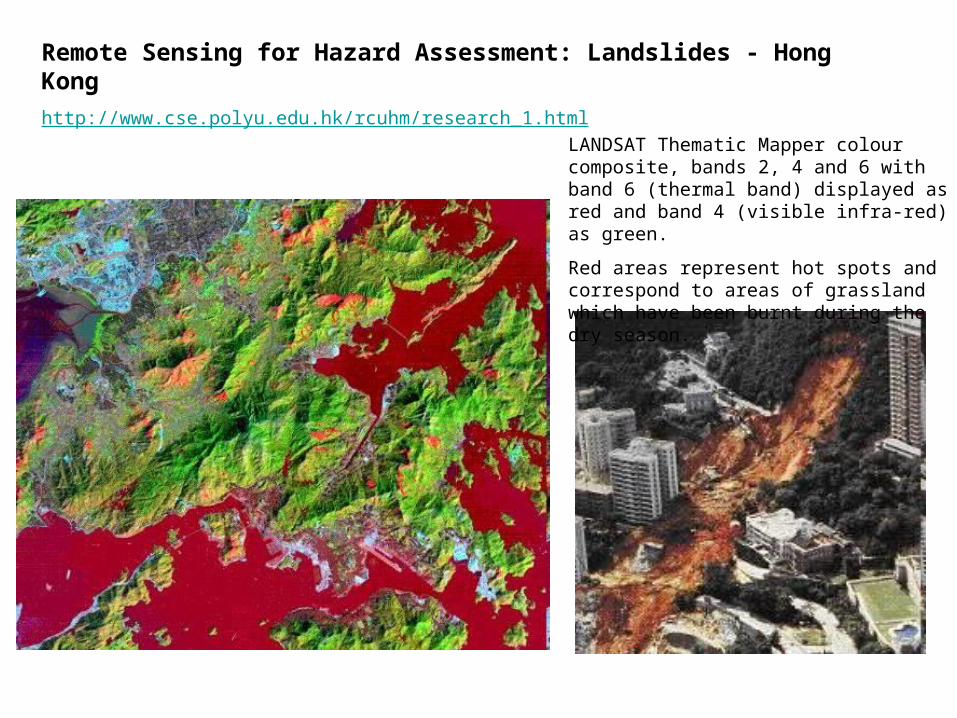
LANDSAT Thematic Mapper colour composite, bands 2, 4 and 6 with band 6 (thermal band) displayed as red and band 4 (visible infra-red) as green.
Red areas represent hot spots and correspond to areas of grassland which have been burnt during the dry season.
Remote Sensing for Hazard Assessment: Landslides - Hong Kong
http://www.cse.polyu.edu.hk/rcuhm/research_1.html
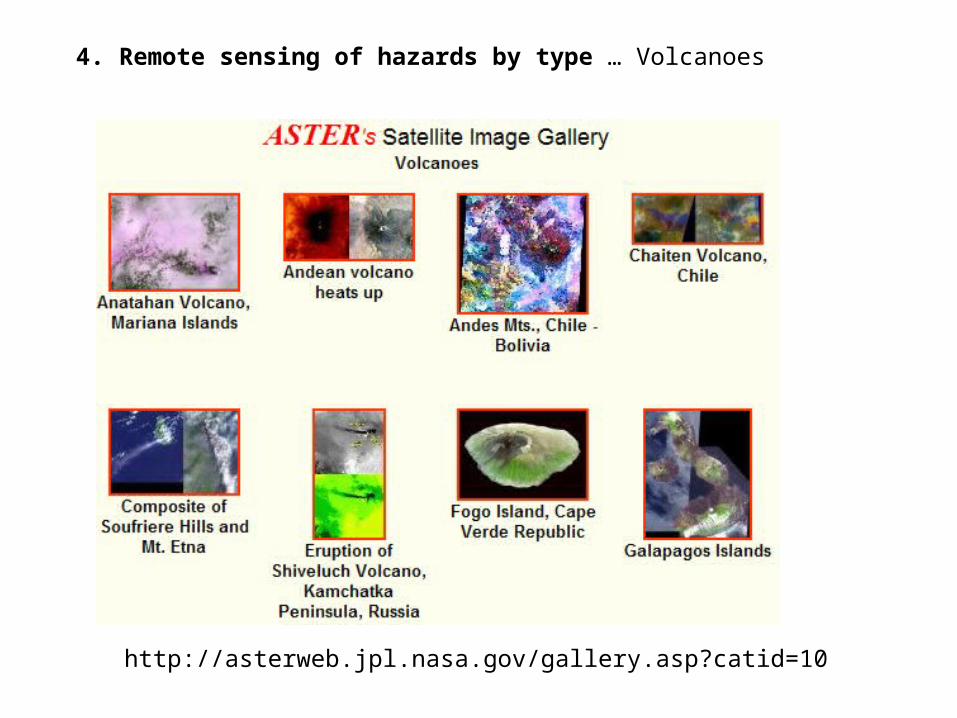
http://asterweb.jpl.nasa.gov/gallery.asp?catid=10
4. Remote sensing of hazards by type … Volcanoes
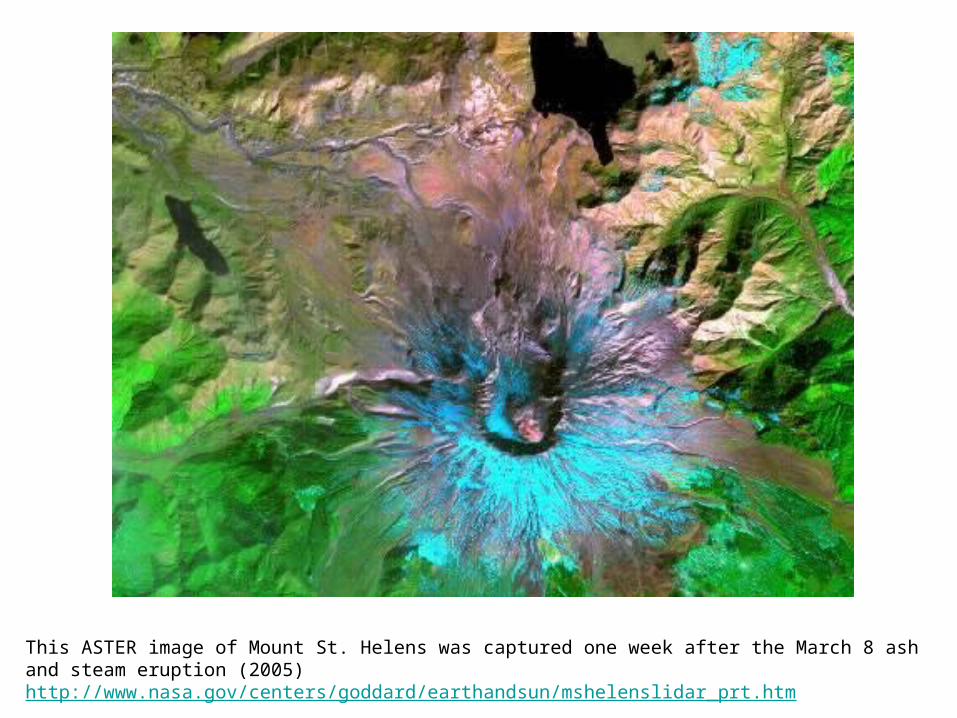
This ASTER image of Mount St. Helens was captured one week after the March 8 ash and steam eruption (2005) http://www.nasa.gov/centers/goddard/earthandsun/mshelenslidar_prt.htm
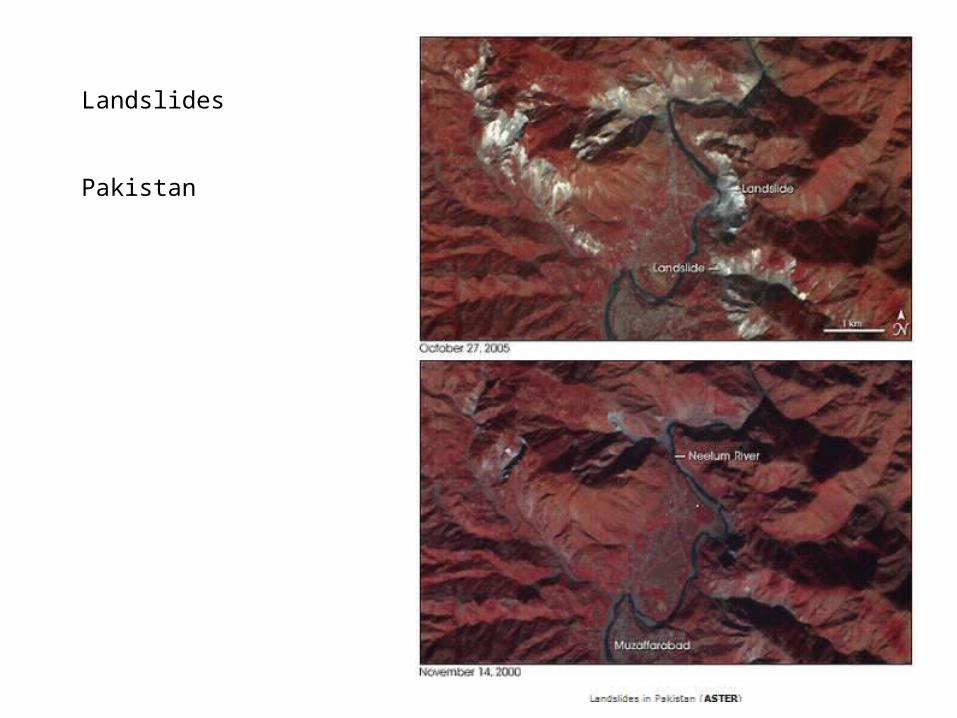
Landslides
Pakistan
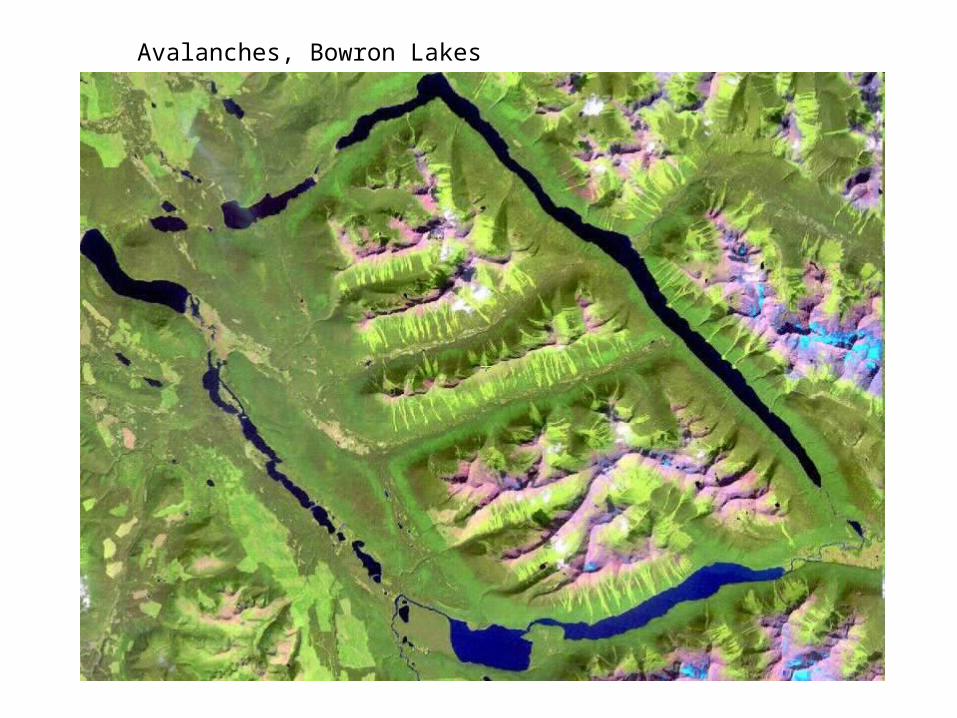
Avalanches, Bowron Lakes
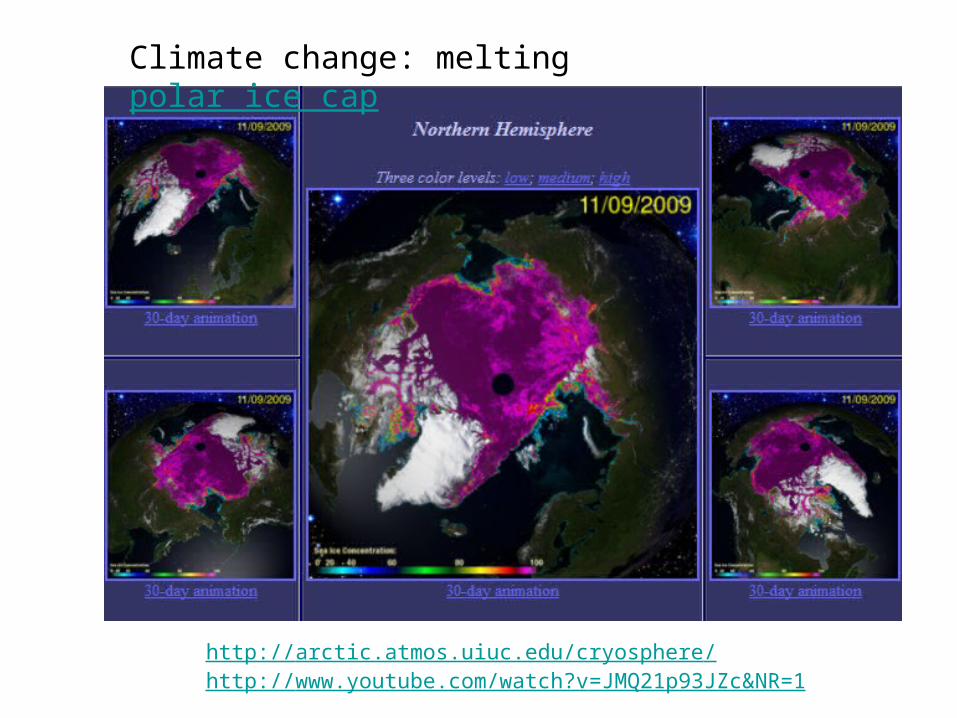
http://arctic.atmos.uiuc.edu/cryosphere/ http://www.youtube.com/watch?v=JMQ21p93JZc&NR=1
Climate change: melting polar ice cap
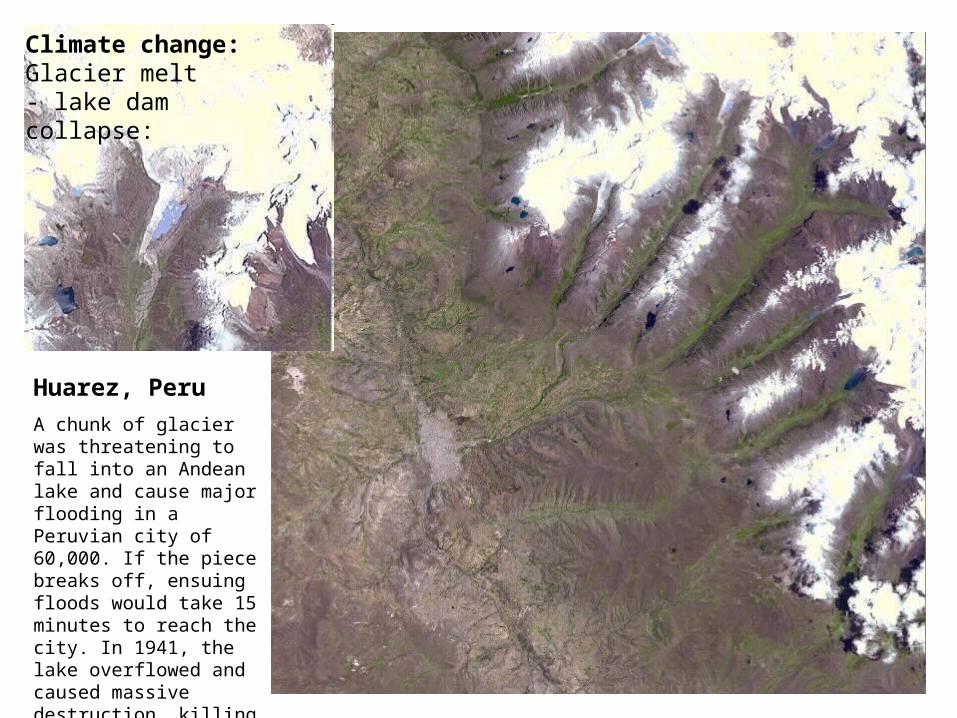
Huarez, Peru
A chunk of glacier was threatening to fall into an Andean lake and cause major flooding in a Peruvian city of 60,000. If the piece breaks off, ensuing floods would take 15 minutes to reach the city. In 1941, the lake overflowed and caused massive destruction, killing 7,000 people.
Climate change: Glacier melt - lake dam collapse:
http://www.runet.edu/~rusmart/imageoftheday/2005-09-21.html
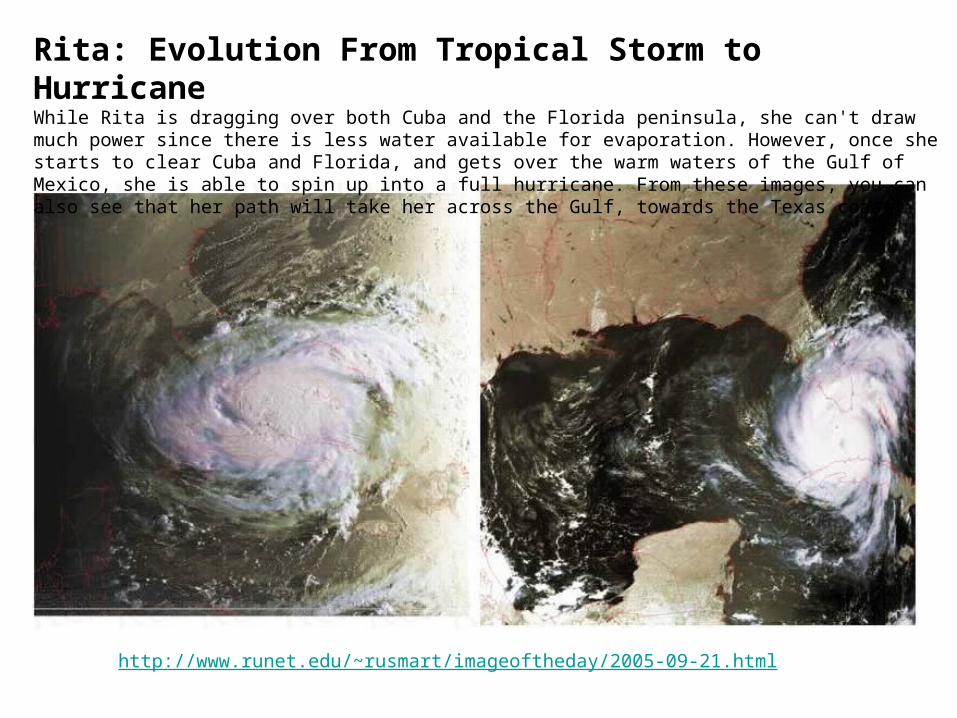
Rita: Evolution From Tropical Storm to HurricaneWhile Rita is dragging over both Cuba and the Florida peninsula, she can't draw much power since there is less water available for evaporation. However, once she starts to clear Cuba and Florida, and gets over the warm waters of the Gulf of Mexico, she is able to spin up into a full hurricane. From these images, you can also see that her path will take her across the Gulf, towards the Texas coast.
http://www.weatheroffice.gc.ca/hurricane/track_e.html
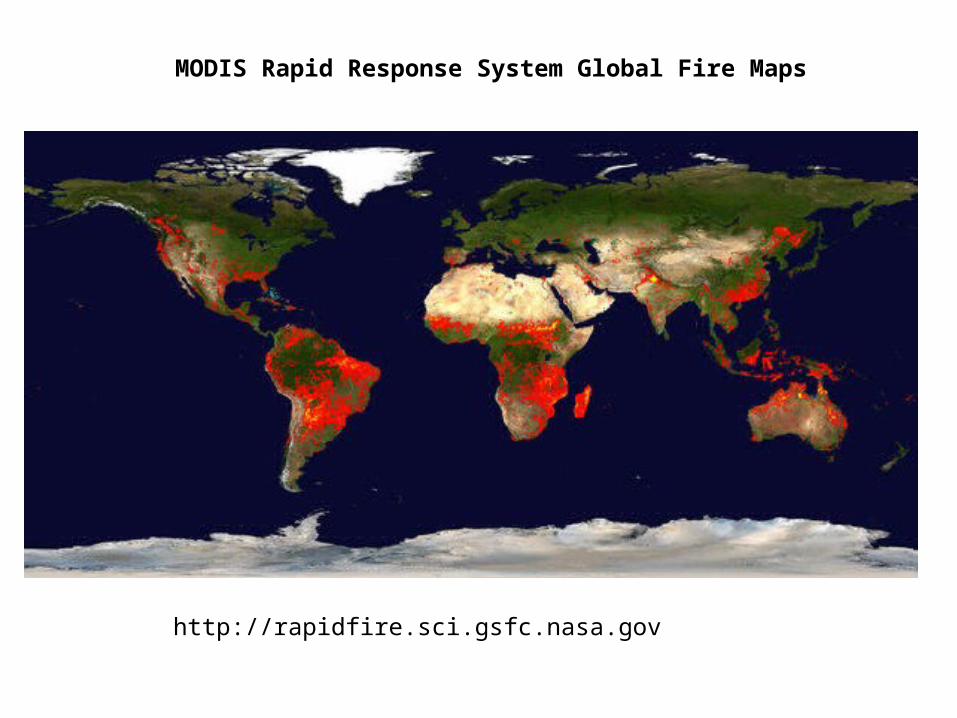
MODIS Rapid Response System Global Fire Maps
http://rapidfire.sci.gsfc.nasa.gov
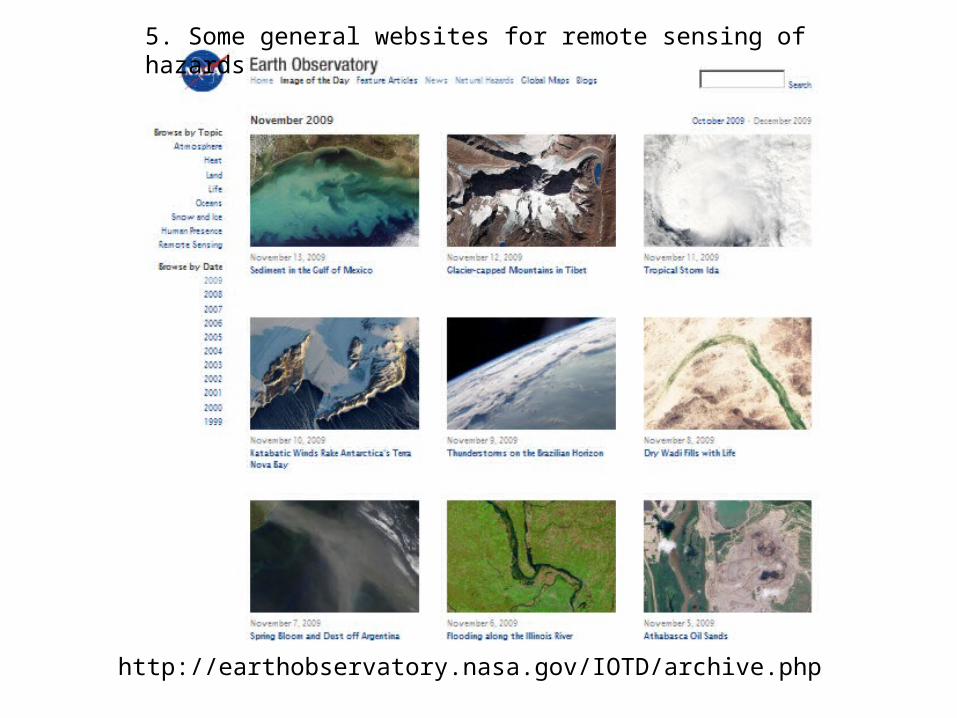
http://earthobservatory.nasa.gov/IOTD/archive.php
5. Some general websites for remote sensing of hazards
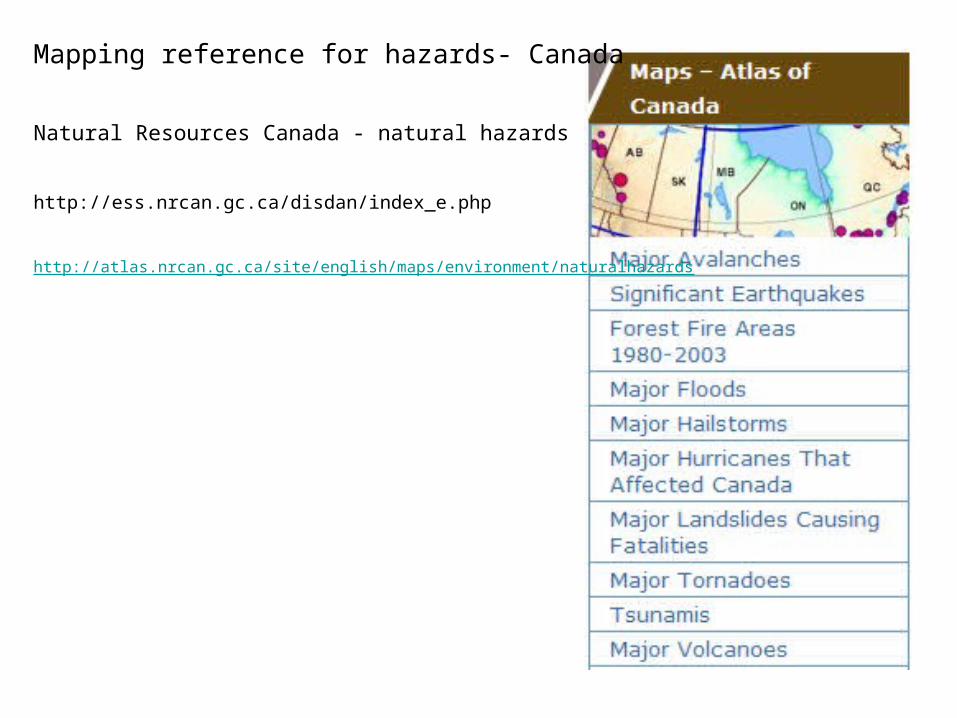
Mapping reference for hazards- Canada
Natural Resources Canada - natural hazards
http://ess.nrcan.gc.ca/disdan/index_e.php
http://atlas.nrcan.gc.ca/site/english/maps/environment/naturalhazards
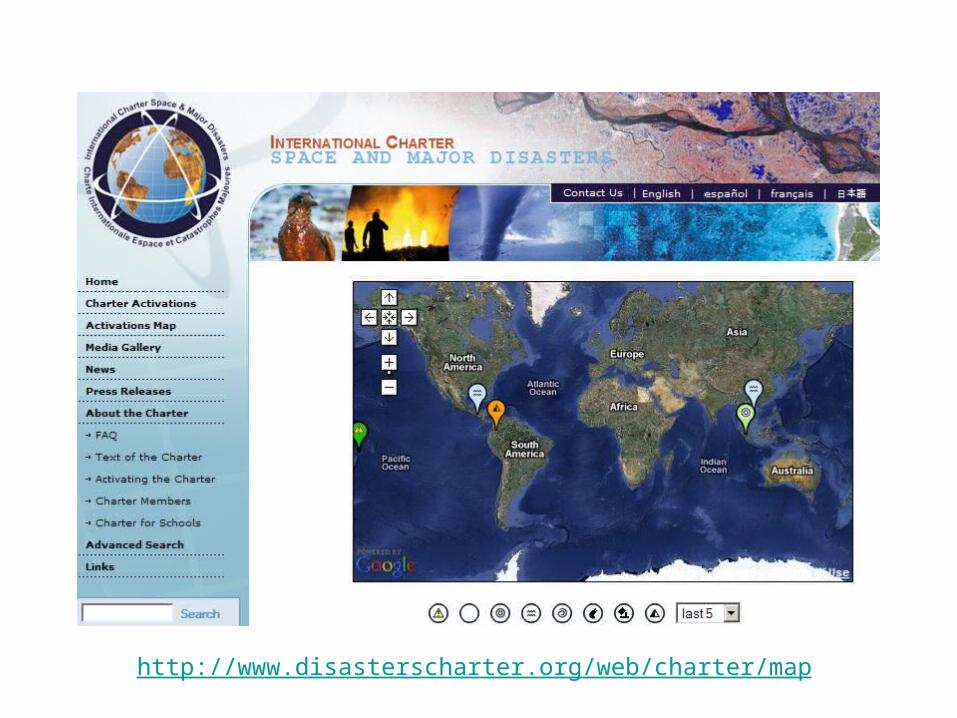
http://www.disasterscharter.org/web/charter/map
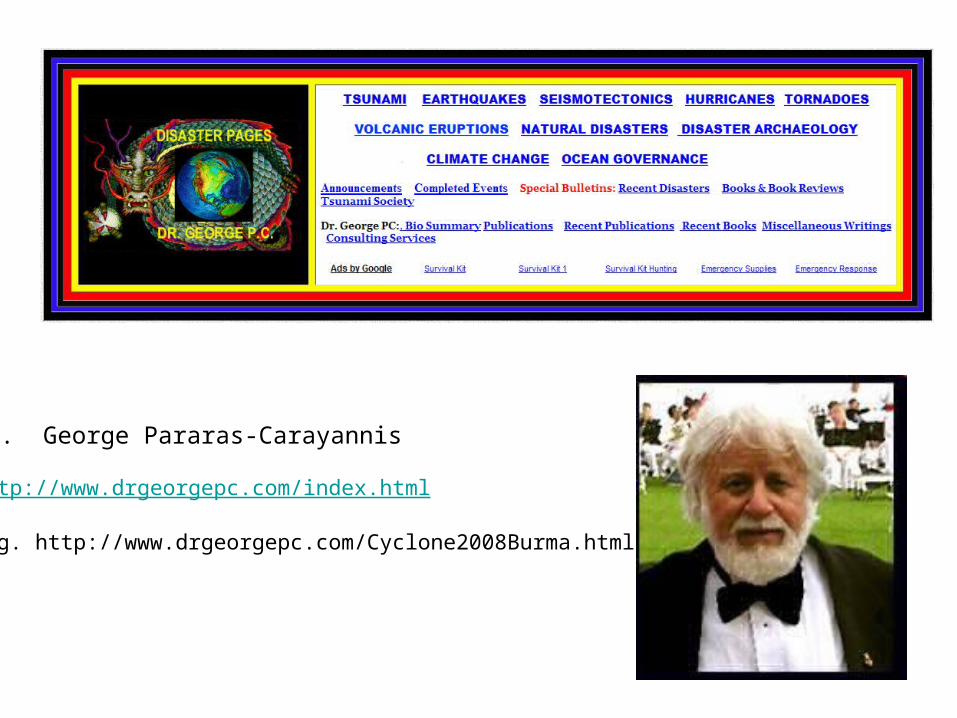
Dr. George Pararas-Carayannis
http://www.drgeorgepc.com/index.html
e.g. http://www.drgeorgepc.com/Cyclone2008Burma.html
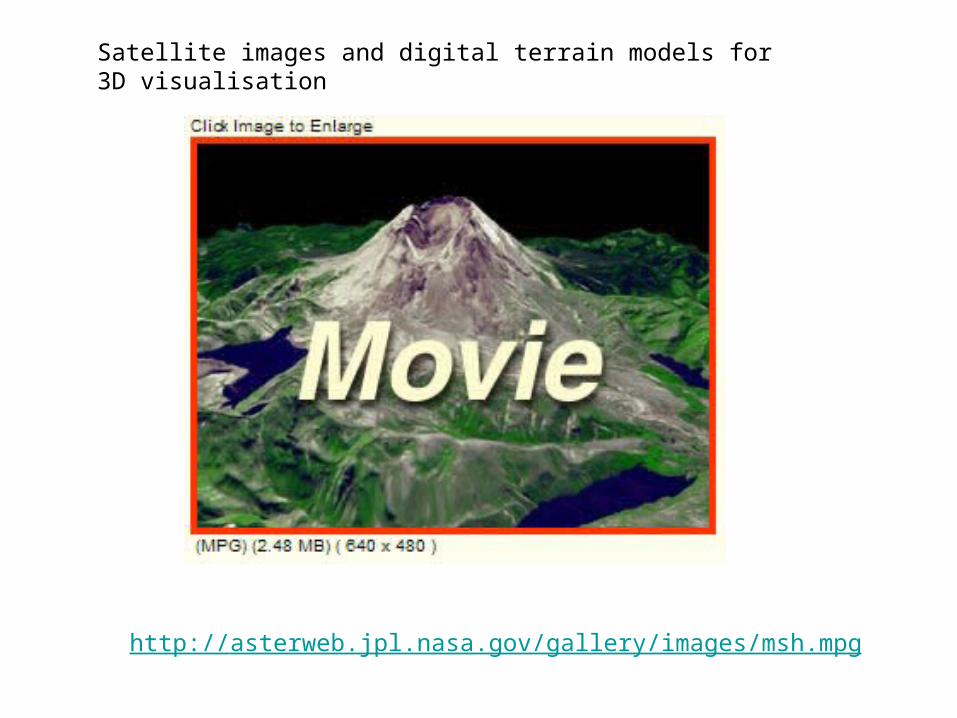
http://asterweb.jpl.nasa.gov/gallery/images/msh.mpg
Satellite images and digital terrain models for 3D visualisation


