
Renewable Energy Outlook and Future R&D Needs
Bryan Hannegan, Ph.D.Vice President, Environment & Renewables
EPRI Climate Research SeminarMay 18, 2010
2© 2010 Electric Power Research Institute, Inc. All rights reserved.
0
20000
40000
60000
80000
100000
120000
140000
160000
180000
2001 2002 2003 2004 2005 2006 2007 2008 2009F 2010F 2011F 2012F 2013F 2014F 2015F
Year
MW
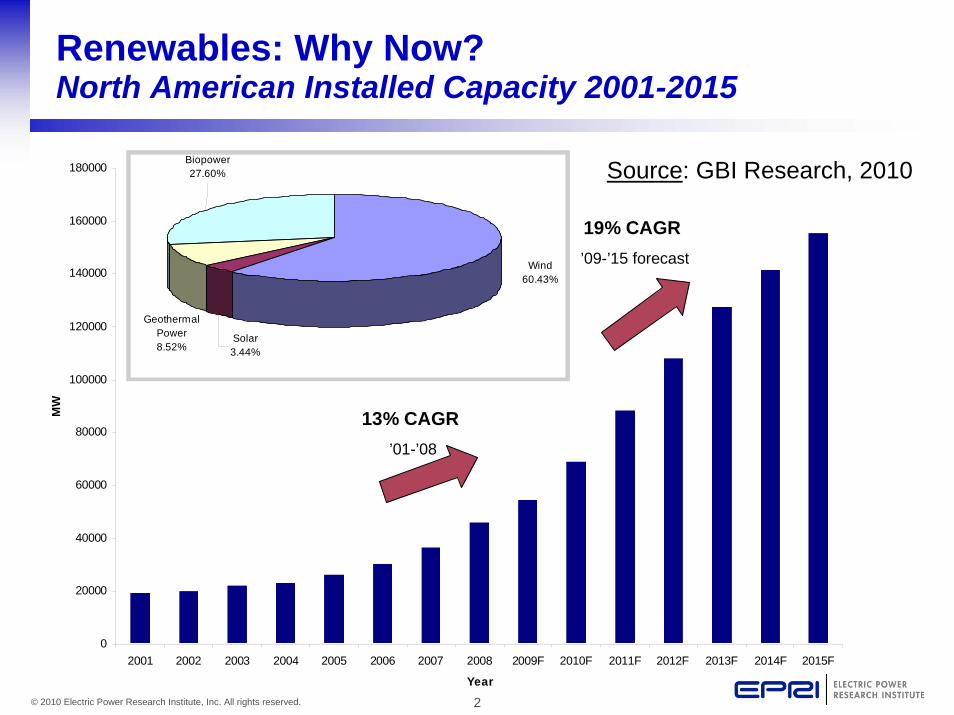
13% CAGR’01-’08
19% CAGR’09-’15 forecast
Biopower27.60%
Geothermal Power8.52%
Solar3.44%
Wind60.43%
Renewables: Why Now?North American Installed Capacity 2001-2015
Source: GBI Research, 2010

3© 2010 Electric Power Research Institute, Inc. All rights reserved.
State renewable portfolio standard
State renewable portfolio goal
www.dsireusa.orgJanuary 2010
*† Extra credit for solar or customer-sited renewables
Includes non-renewable alternative resources
WA: 15% by 2020*
CA: 33% by 2020
☼ NV: 25% by 2025*
☼ AZ: 15% by 2025
☼ NM: 20% by 2020 (IOUs)10% by 2020 (co-ops)
HI: 40% by 2030
☼ Minimum solar or customer-sited requirement
TX: 5,880 MW by 2015
UT: 20% by 2025*
☼ CO: 20% by 2020 (IOUs)10% by 2020 (co-ops & large munis)*
MT: 15% by 2015
ND: 10% by 2015
SD: 10% by 2015
IA: 105 MW
MN: 25% by 2025(Xcel: 30% by 2020)
☼ MO: 15% by 2021
WI: Varies by utility; 10% by 2015 goal
MI: 10% + 1,100 MW by 2015*
☼ OH: 25% by 2025†
ME: 30% by 2000New RE: 10% by 2017
☼ NH: 23.8% by 2025
☼ MA: 15% by 2020+ 1% annual increase(Class I Renewables)
RI: 16% by 2020
CT: 23% by 2020
☼ NY: 24% by 2013
☼ NJ: 22.5% by 2021
☼ PA: 18% by 2020†
☼ MD: 20% by 2022
☼ DE: 20% by 2019*
☼ DC: 20% by 2020
VA: 15% by 2025*
☼ NC: 12.5% by 2021 (IOUs)10% by 2018 (co-ops & munis)
VT: (1) RE meets any increase in retail sales by 2012;
(2) 20% RE & CHP by 2017
KS: 20% by 2020
☼ OR: 25% by 2025 (large utilities)*5% - 10% by 2025 (smaller utilities)
☼ IL: 25% by 2025WV: 25% by 2025*†
Renewables: Why Now?29 States + DC Have Renewable Portfolio Standards
4© 2010 Electric Power Research Institute, Inc. All rights reserved.
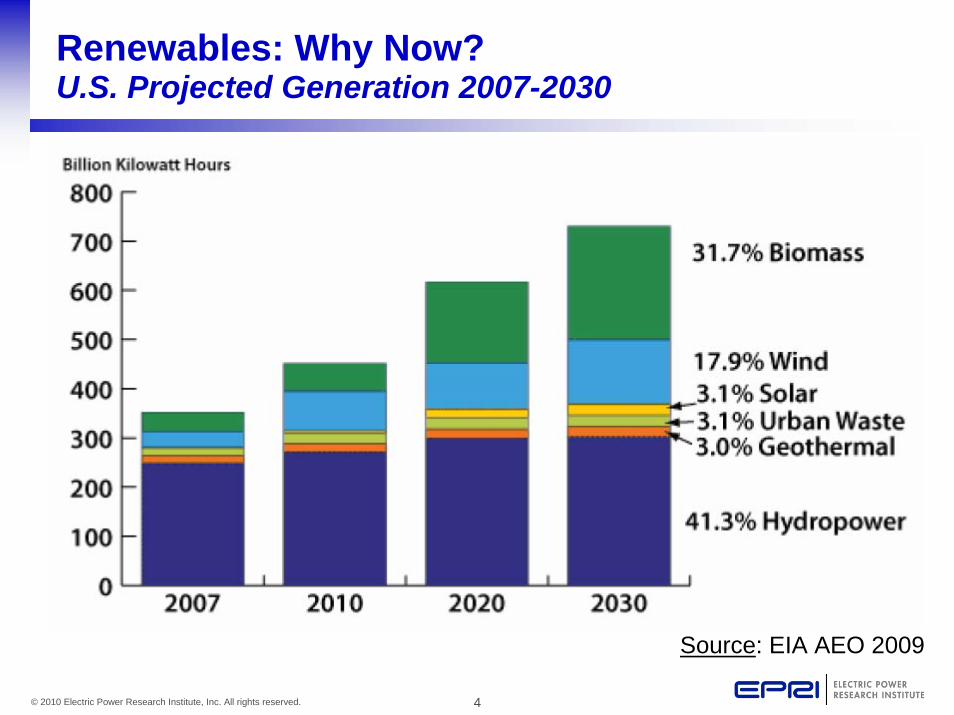
Renewables: Why Now?U.S. Projected Generation 2007-2030
Source: EIA AEO 2009
5© 2010 Electric Power Research Institute, Inc. All rights reserved.
0
1
2
3
4
5
6
7
2000 2010 2020 2030 2040 2050
Trill
ion
kWh
per y
ear
0
1
2
3
4
5
6
7
2000 2010 2020 2030 2040 2050
Trill
ion
kWh
per y
ear
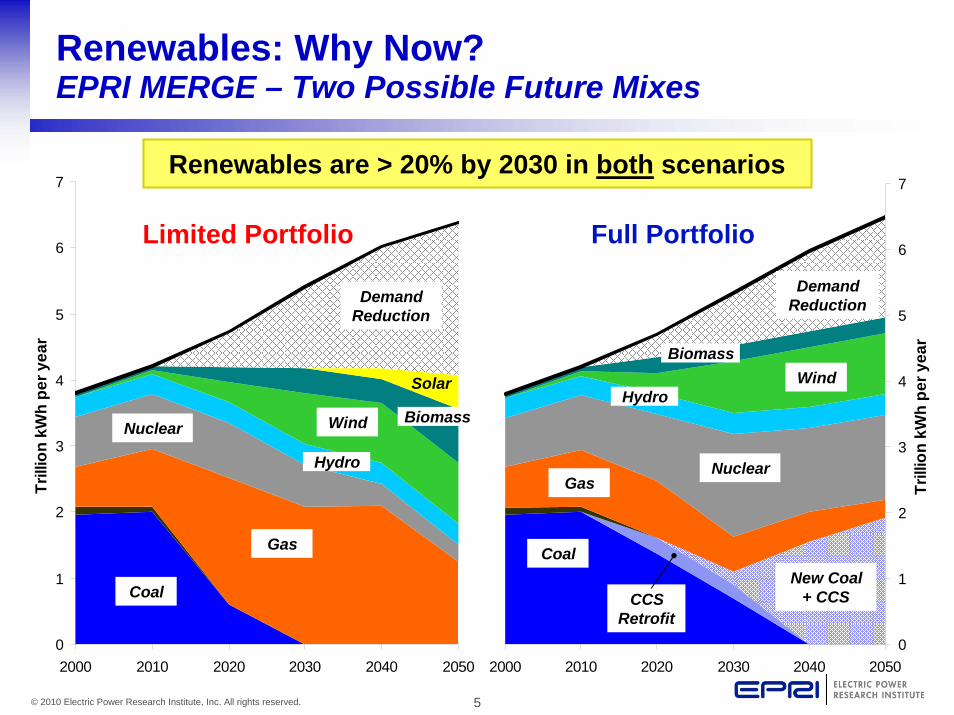
Renewables: Why Now?EPRI MERGE – Two Possible Future Mixes
Coal
Gas
Wind
Demand Reduction
New Coal + CCSCoal
Gas
WindNuclear
Demand Reduction
Nuclear
Limited Portfolio Full Portfolio
Solar
Biomass
Hydro
CCS Retrofit
Biomass
Hydro
Renewables are > 20% by 2030 in both scenarios

6© 2010 Electric Power Research Institute, Inc. All rights reserved.
What are the challenges posed by increasing amounts of renewable energy?

7© 2010 Electric Power Research Institute, Inc. All rights reserved.
IGCC
40
50
60
70
80
90
100
110
120
130
0 10 20 30 40 50
Levelized Cost of Electricity, $/MWh
Cost of CO2, $/Metric Ton
All costs are in December 2008 $
PC
The Cost Challenge
Nuclear ($4860/kW)
Wind (35% CF)
Biomass
No investment or production tax credits are assumed for any technology.
Solar thermal LCOE ranges between $225-$290/MWh
Rev. October 2009
NGCC ($5-8/MMBtu)
Renewables “out of the money” without incentives90% confidence level values based on EPRI Report 1019539

8© 2010 Electric Power Research Institute, Inc. All rights reserved.
The Integration Challenge
High Levels of Variable Wind and Solar PV Will Present an Operating Challenge!

9© 2010 Electric Power Research Institute, Inc. All rights reserved.
• Understanding the interactions– Characterizing the renewable resource– Interactions with species and habitat– Life cycle assessment– Human health and safety
• Advancing improved approaches– Siting methodologies– Technology and operational improvements– Mitigation strategies
• Large scale impacts and limitations– Assess the impacts of “harvesting” renewables at large scales
The Environmental Challenge
10© 2010 Electric Power Research Institute, Inc. All rights reserved.
What are the opportunities to enable increasing amounts of wind energy?

11© 2010 Electric Power Research Institute, Inc. All rights reserved.
Utility-Scale Wind Evaluation• Locations:
– Base Case– California– Texas– Michigan– New York– Offshore NY
• Conceptual design, performance, capital and O&M cost, levelized COE
• Source: EPRI Renewable Energy Technology Guide (1017598, 2/28/10)
Current Wind Project Cost and Performance

12© 2010 Electric Power Research Institute, Inc. All rights reserved.
Current Wind Project Cost and Performance
Levelized COE (4th Quarter 2009 $)
$0
$20
$40
$60
$80
$100
$120
BaseCase
100 MW
California100 MW
Texas 200 MW
Michigan150 MW
New York50 MW
NYOffshore201.6 MW
$/MWhAnnual Capacity Factor
0%
5%
10%
15%
20%
25%
30%
35%
40%
45%
50%
BaseCase
100 MW
California100 MW
Texas 200 MW
Michigan150 MW
New York50 MW
NYOffshore201.6 MW
With 30% Investment Tax Credit

13© 2010 Electric Power Research Institute, Inc. All rights reserved.
Wind Generation R&D Needs
• Wind Power Technology Assessment– Drive train, generators, blades,
towers, sensors and controls
• Wind Power Asset Management– Status of O&M and asset
management technologies• Condition Monitoring and NDE• O&M procedures
– Wind turbine asset management guidebook
14© 2010 Electric Power Research Institute, Inc. All rights reserved.
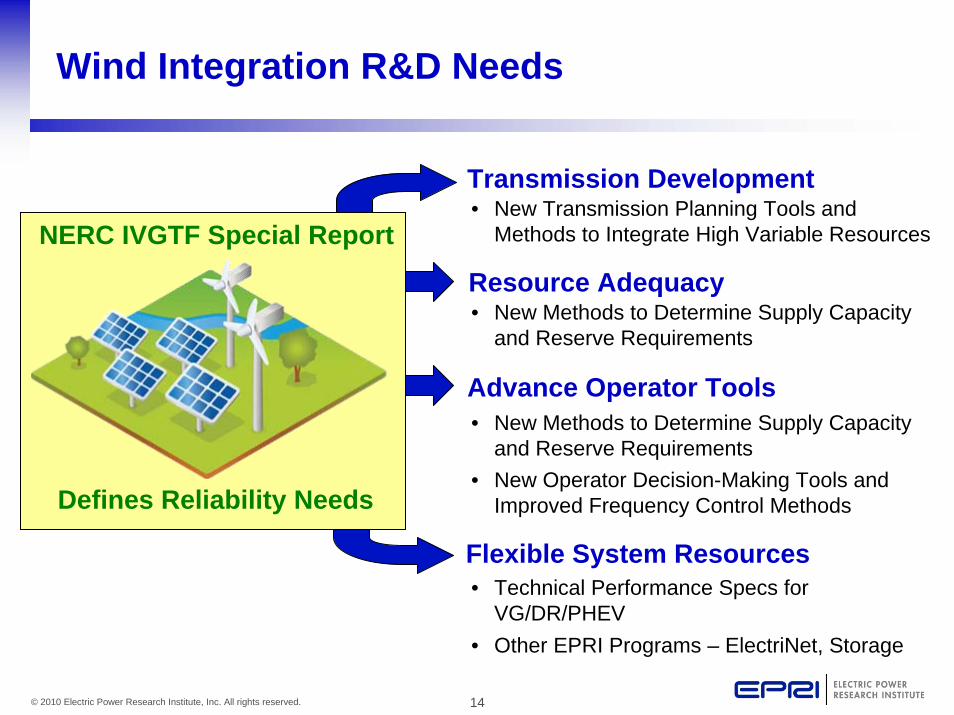
NERC IVGTF Special Report
Defines Reliability Needs
• New Transmission Planning Tools and Methods to Integrate High Variable Resources
• New Methods to Determine Supply Capacity and Reserve Requirements
• New Methods to Determine Supply Capacity and Reserve Requirements
• New Operator Decision-Making Tools and Improved Frequency Control Methods
• Technical Performance Specs for VG/DR/PHEV
• Other EPRI Programs – ElectriNet, Storage
Transmission Development
Resource Adequacy
Advance Operator Tools
Flexible System Resources
Wind Integration R&D Needs

15© 2010 Electric Power Research Institute, Inc. All rights reserved.
What are the opportunities to enable increasing amounts of solar energy?

16© 2010 Electric Power Research Institute, Inc. All rights reserved.
Current Solar PV Cost and Performance
Central Station PV Evaluation• 6 PV Technologies:
– Fixed Flat Plate a-Si– Fixed Flat Plate CdTe– Fixed Flat Plate c-Si– 1-Axis Tracking c-Si– Tilted 1-Axis Tracking c-Si– 2-Axis Tracking CPV
• Four Locations:– Las Vegas, NV– Alamosa, CO– Jacksonville, FL– Columbus, OH

17© 2010 Electric Power Research Institute, Inc. All rights reserved.
Current Solar PV Cost and Performance
Levelized COE (4th Quarter 2009 $)
$0
$50
$100
$150
$200
$250
$300
Fixed a-Si Fixed CdTe Fixed c-Si 1-Axis c-SI Tilted 1-Axis c-Si 2-Axis CPV
PV Technology
Las Vegas, NV Alamosa, CO Jacksonville, FL Columbus, OH
With 30% Investment Tax Credit
$/MWh
18© 2010 Electric Power Research Institute, Inc. All rights reserved.
0
5
10
15
20
21 25 35Capacity Factor (%)
LCO
E (c
ents
/kW
h)
Base Case
15% Hybrid
6 Hours Storage
0
5
10
15
20
27 32 36
Capacity Factor (%)
LCO
E (c
ents
/kW
h)Base Case
15%Hybrid
6 Hours Storage
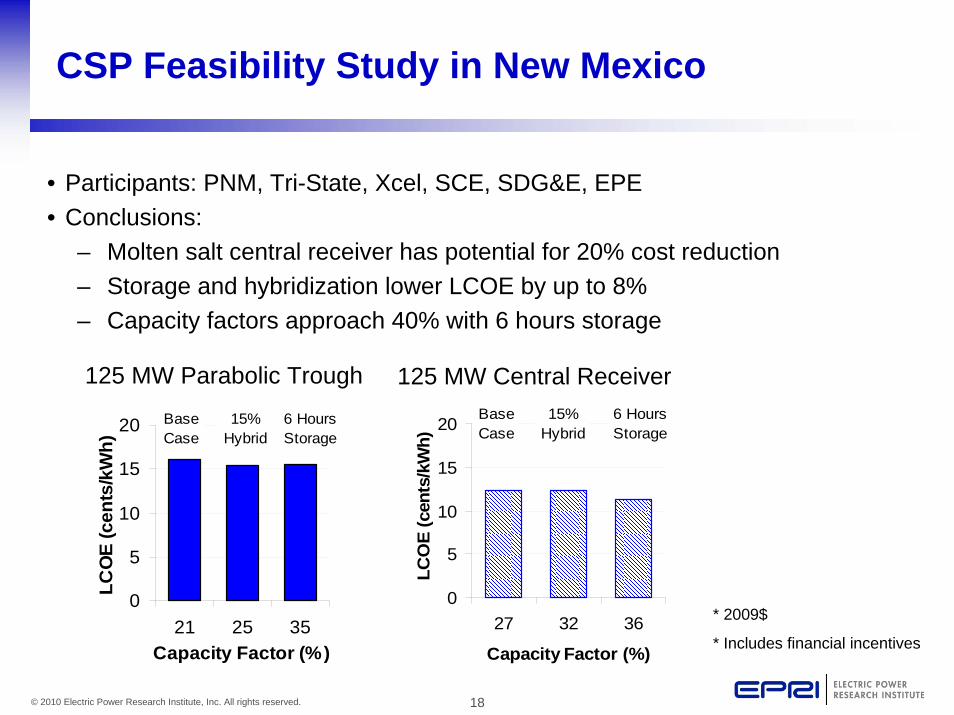
CSP Feasibility Study in New Mexico
• Participants: PNM, Tri-State, Xcel, SCE, SDG&E, EPE• Conclusions:
– Molten salt central receiver has potential for 20% cost reduction– Storage and hybridization lower LCOE by up to 8% – Capacity factors approach 40% with 6 hours storage
125 MW Parabolic Trough 125 MW Central Receiver
* 2009$
* Includes financial incentives

19© 2010 Electric Power Research Institute, Inc. All rights reserved.
Central Station Solar R&D Needs
• Solar Augmented Steam Cycle Applications Analysis– Analyze new applications
• Greenfield• Integration with biomass or
geothermal• Solar Technology Acceleration
Center (SolarTAC)– Benchmark PV/CPV technologies– SolarTAC demo projects
• Solar Thermal Storage Technology Assessment – Field data for installations– Identify hosts for collaborative
evaluations of thermal storage performance

20© 2010 Electric Power Research Institute, Inc. All rights reserved.
Distributed PV Integration R&D Needs
• High Penetration PV Impact on Circuits– Model development and system impact evaluation– Economic Assessment– Demonstration on selected feeders
• Distribution PV Monitoring Project– Understand the performance characteristics under
various environmental and climatic conditions– Large population of units – Monitoring protocol and package
• Operations and Maintenance Needs– Assess maintenance practice– Develop needs, gap analysis– Identify opportunities for improvement

21© 2010 Electric Power Research Institute, Inc. All rights reserved.
Distributed PV Monitoring at Alabama Power
• 4 different arrays (1.1 kW each)• Side-by-side performance comparison• System integration, evaluation using
micro-inverters on each panel• Increased understanding of PV
operations in southeast climate
Panel Type(Silicon)
Panel CostJune ‘09
($/W)
Panel Cost May ‘10
($/W)Polycrystalline $ 3.54 $ 2.42
Monocrystalline $ 3.50 $ 2.74Thin film (flexible) $ 4.22 $ 3.54
Heterojunction with intrinsic thin layer $ 4.60 $ 4.46
as purchased today

22© 2010 Electric Power Research Institute, Inc. All rights reserved.
What are the opportunities to enable increasing amounts of biomass energy?
23© 2010 Electric Power Research Institute, Inc. All rights reserved.
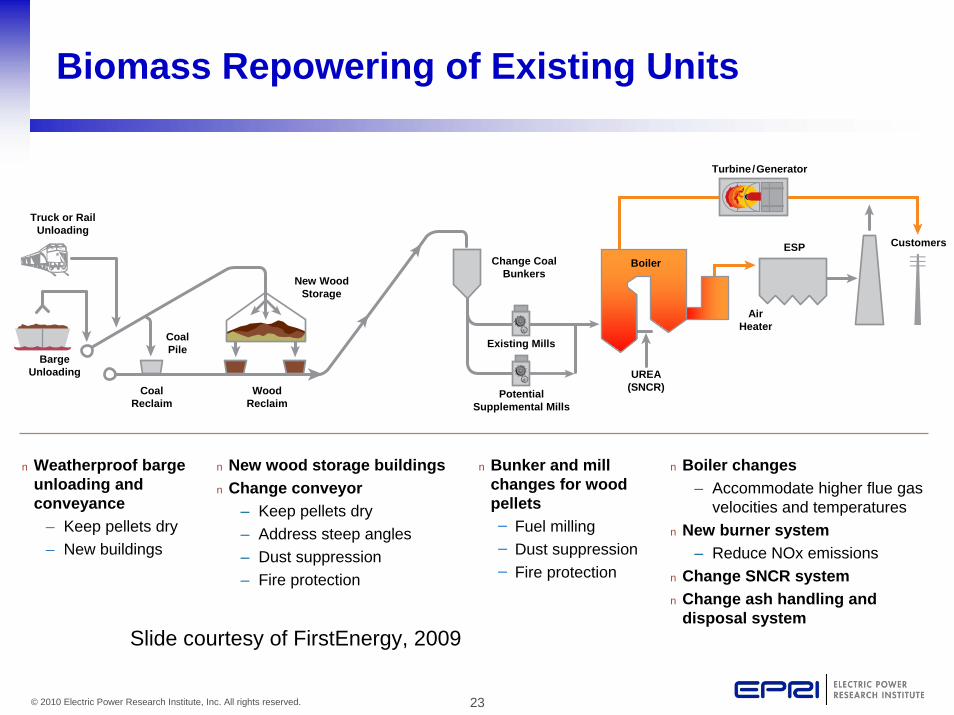
Biomass Repowering of Existing Units
Existing Mills
PotentialSupplemental Mills
Change Coal Bunkers
Boiler
UREA (SNCR)
ESP
Air Heater
Customers
Barge Unloading
Coal Reclaim
Wood Reclaim
Coal Pile
New Wood Storage
n Weatherproof barge unloading and conveyance
– Keep pellets dry– New buildings
n Bunker and mill changes for wood pellets̶ Fuel milling̶ Dust suppression̶ Fire protection
n Boiler changes– Accommodate higher flue gas
velocities and temperaturesn New burner system
– Reduce NOx emissionsn Change SNCR systemn Change ash handling and
disposal system
n New wood storage buildingsn Change conveyor
– Keep pellets dry– Address steep angles– Dust suppression– Fire protection
Truck or Rail Unloading
Turbine/Generator
Slide courtesy of FirstEnergy, 2009

24© 2010 Electric Power Research Institute, Inc. All rights reserved.
Biomass R&D Needs
• Biomass Supply Management– Long-term supply security– Development of multiple supply chains– Assessment of energy plantations
• Power Generation from Biomass– Impact on environmental equipment– Biomass plant cost database– Ash utilization– Torrefied wood full-scale tests– Methods to increase co-firing fraction
• Life Cycle Analysis of Biomass-Based Power– Updated biomass-to-power carbon footprint– Land, water implications of biomass supply– Broad deployment of biomass power plants:
environmental implications

25© 2010 Electric Power Research Institute, Inc. All rights reserved.
What are the opportunities to enable increasing amounts of geothermal energy?

26© 2010 Electric Power Research Institute, Inc. All rights reserved.
Deep EGS Potential Significant, Widespread
Challenges:
1.Resource conversion
2.Injection of fluids
3.Induced seismicity
EGS – Enhanced Geothermal Systems
Slide and data courtesy of NREL, 2010

27© 2010 Electric Power Research Institute, Inc. All rights reserved.
UTCGenerator
Closed Cycle System
Grout
HeatExchanger
HeatNest™
HeatReservoir
High Conductivity Material
Single-Well Technology Developed by GTherm
28© 2010 Electric Power Research Institute, Inc. All rights reserved.
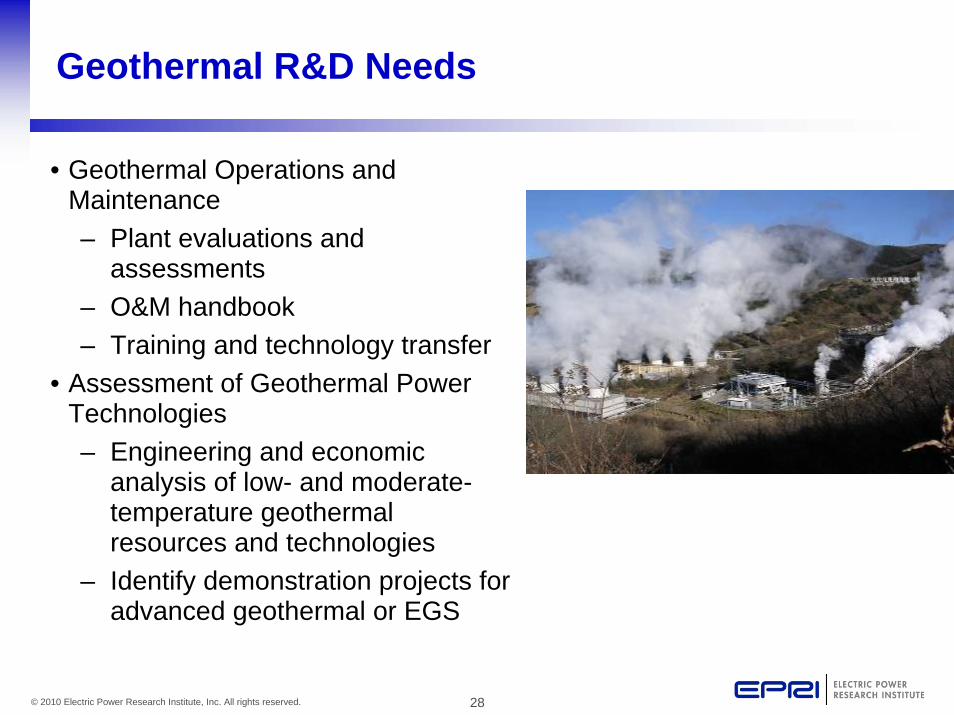
Geothermal R&D Needs
• Geothermal Operations and Maintenance– Plant evaluations and
assessments– O&M handbook– Training and technology transfer
• Assessment of Geothermal Power Technologies– Engineering and economic
analysis of low- and moderate-temperature geothermal resources and technologies
– Identify demonstration projects for advanced geothermal or EGS
29© 2010 Electric Power Research Institute, Inc. All rights reserved.
What are the opportunities to enable increasing amounts of waterpower?

30© 2010 Electric Power Research Institute, Inc. All rights reserved.
What is Waterpower?
• Conventional Hydropower• Pumped Storage• Ocean Energy
– Wave energy conversion– Thermal gradient– Ocean currents
• Instream Energy Conversion– River or inland
hydrokinetics (RISEC)– Tidal hydrokinetics
(TISEC)
31© 2010 Electric Power Research Institute, Inc. All rights reserved.
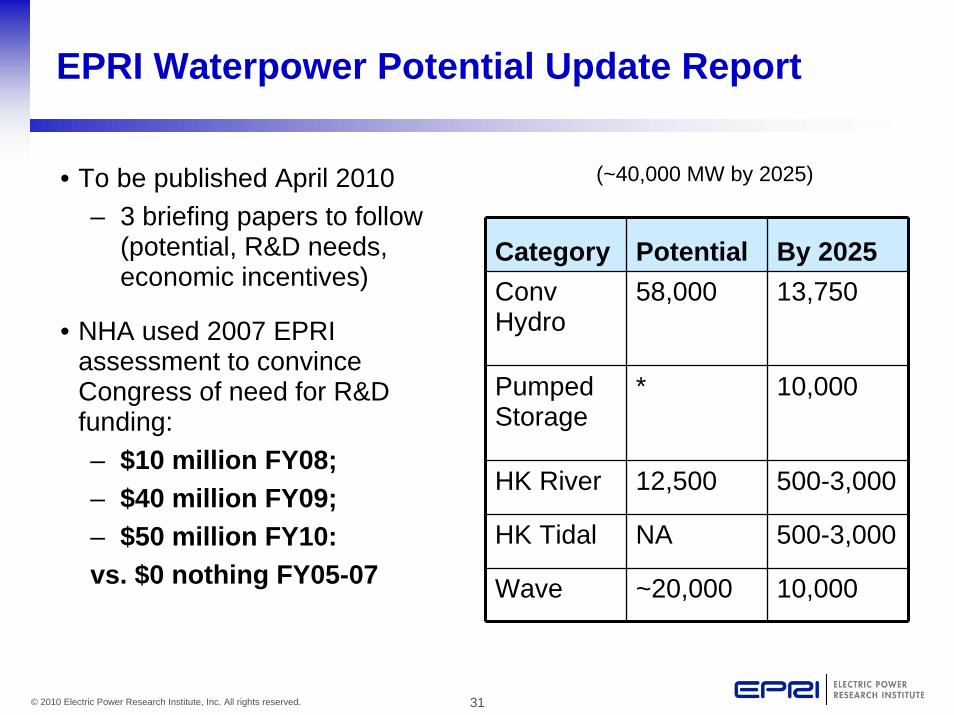
EPRI Waterpower Potential Update Report
• To be published April 2010– 3 briefing papers to follow
(potential, R&D needs, economic incentives)
• NHA used 2007 EPRI assessment to convince Congress of need for R&D funding:– $10 million FY08; – $40 million FY09; – $50 million FY10:vs. $0 nothing FY05-07
Category Potential By 2025ConvHydro
58,000 13,750
Pumped Storage
* 10,000
HK River 12,500 500-3,000
HK Tidal NA 500-3,000
Wave ~20,000 10,000
(~40,000 MW by 2025)

32© 2010 Electric Power Research Institute, Inc. All rights reserved.
Waterpower R&D Needs*
Conventional Priorities:1. Advance turbine development2. Technology deployment and
testing3. Fish passage and protection4. Hydro GHG emissions5. Optimization and efficiency
improvement research6. Resource assessment updates7. Wind-hydropower integration8. Pumped-storage development
and bench-marking
Ocean and HydrokineticPriorities:1. Technology development2. Technology deployment and
testing3. Environmental impact research4. Development of international
standards for design, testing, and performance metrics
*2008 EPRI-DOE Waterpower Industry R&D Prioritization
Workshop
33© 2010 Electric Power Research Institute, Inc. All rights reserved.
How can energy storage and the smart grid enable increasing amounts of renewables?

34© 2010 Electric Power Research Institute, Inc. All rights reserved.
0
1000
2000
3000
4000
5000
6000
0 2 4 6 8 10Discharge Duration (hours)
Cap
ital C
ost (
$/kW
)
0
1000
2000
3000
4000
5000
6000
0 2 4 6 8 10Discharge Duration (hours)
Cap
ital C
ost (
$/kW
)
Pumped Hydro
Aboveground CAES
Lead-Acid Batteries
NaS BatteriesLithium Ion:Most cost-effective for short durations
CAES:Most cost-effective for long durations
0
1000
2000
3000
4000
5000
6000
0 2 4 6 8 10Discharge Duration (hours)
Cap
ital C
ost (
$/kW
)
Lithium Ion:Most cost-effective for short durations
CAES:Most cost-effective for long durations
Lithium Ion (Projected, 2020)
All costs in 2010 DollarsCosts are installed costs and include all necessary power electronics and balance of plant
Underground CAES
Data from Electric Energy Storage: Technology Options(EPRI White Paper to be released December 2009)
Energy Storage Likely to Play a Role

35© 2010 Electric Power Research Institute, Inc. All rights reserved.
Smart Grid Demonstrations Tie It All Together
• Deploying the Virtual Power Plant
• Demonstrate Integration and Interoperability
• Leverage information & Communication Technologies
• Integration of Multiple Types of Distributed Energy Resources (DER):
• Storage• Demand Response
• Renewable Generation• Distributed Generation
• Multiple Levels of Integration - Interoperability

36© 2010 Electric Power Research Institute, Inc. All rights reserved.
Making Renewable Energy Work
• Reduce Cost of Generation Technology Options
• Integrate Variable Generation with Transmission and Distribution
• Optimize with Energy Storage and the Smart Grid
• Understand and Minimize Environmental Impacts
Public/Private Collaboration Needed!

37© 2010 Electric Power Research Institute, Inc. All rights reserved.
Together…Shaping the Future of Electricity


