
Repair of Steel Beam/Girder Ends with Ultra
High-Strength Concrete – Phase II
Prepared by: Arash E. Zaghi, Ph.D., P.E., Kay Wille, Ph.D.,
Kevin Zmetra, Ph.D., Kevin McMullen, Dominic Kruszewski,
and Alexandra Hain
Report Number: CT-2295-1-17-2
Interim Report January 31, 2017
Research Project: SPR-2295
University of Connecticut School of Engineering
Department of Civil and Environmental Engineering
Submitted to: Connecticut Department of Transportation
Bureau of Policy and Planning Roadway Information Systems Unit
Research Section
Michael J. Connors Assistant Director of Policy and Planning

ii
TECHNICAL REPORT DOCUMENTATION PAGE
1. Report No.
CT-2295-1-17-2
2. Government Accession No.
3. Recipients Catalog No.
4. Title and Subtitle Repair of Steel Beam/Girder Ends with Ultra High-Strength Concrete – Phase II
5. Report Date January 2016
6. Performing Organization Code SPR-2295
7. Author(s) Arash Esmaili Zaghi, Kay Wille, Kevin Zmetra, Kevin McMullen, Dominic Kruszewski, and Alexandra Hain
8. Performing Organization Report No. CT-2295-1-17-2
9. Performing Organization Name and Address University of Connecticut Department of Civil & Environmental Engineering 261 Glenbrook Road, Unit 3037 Storrs, CT 06269-7546
10. Work Unit No. (TRIS)
11. Contract or Grant No. CT Study No. 2295
13. Type of Report and Period Covered Interim Report June 2015 – December 2016
12. Sponsoring Agency Name and Address Connecticut Department of Transportation 2800 Berlin Turnpike Newington, CT 06131-7546
14. Sponsoring Agency Code
SPR-2295
15. Supplementary Notes A study conducted in cooperation with the U.S. Department of Transportation and Federal Highway Administration
16. Abstract
A novel repair method has been developed at the University of Connecticut for corroded steel bridge girder ends. The repair method consists of encasing the corroded steel area with UHPC. The UHPC panel is bonded to the steel girder using headed shear studs welded to the uncorroded portions of the web and flange. The repair provides a secondary load path to restore the bearing and shear strength of the girder which was reduced due to corroded section loss. This research project investigates the application and performance of this repair for field implementation. Full-scale experimental tests will be conducted on plate girders with reduced steel sections to simulate corrosion damage. The plate girder specimens will be repaired using various repair geometries. Small-scale push-off tests will be conducted on shear studs welded to the web of a girder when embedded in UHPC. These tests are conducted to analyze the behavior of the shear studs in UHPC and to develop a formulation for the stud capacities. In addition to experimental strength tests, durability test will be conducted on the full-scale plate girders and push-off specimens to determine various field requirements and constraints for the repair. The results of both the large-scale and small-scale test will be used to develop and calibrate finite element models which will be used to test and evaluate the performance of the repair for a variety of different existing conditions and repair geometries for full-scale bridges in need of girder end repairs. A design guide will be developed to allow engineers to develop and implement this repair method for different designs. Collaboration is ongoing to assist CTDOT in a field implementation of the repair for a bridge with extensive corrosion of steel girder ends.
17. Key Words Ultra-High Performance Concrete (UHPC), Steel Girder Repair, Beam end corrosion, Bridge Maintenance Repair method, Concrete encasing
18. Distribution Statement No restrictions. This document is available to the public through the National Technical Information Service, Springfield, VA. 22161
19. Security Classif. (Of this report) Unclassified
20. Security Classif.(Of this page) Unclassified
21. No. of Pages 124
22. Price N/A

iii
DISCLAIMER STATEMENT
This report does not constitute a standard, specification, or regulation. The contents
of this report reflect the views of the authors who are responsible for the facts and the
accuracy of the data presented herein. The contents do not necessarily reflect the views
of the Connecticut Department of Transportation or the Federal Highway Administration.

iv
ACKNOWLEDGEMENT
The research presented in this report was funded by the Connecticut Department of
Transportation (CTDOT) and the Federal Highway Administration Contract number:
SPR-2295. Special thanks are due to Bradley Overturf, Richard Hanley, Timothy Fields,
Rabih Barakat, Anne-Marie McDonnell, and Mary Baker for their strong support and
advice through the course of this project. The significant contribution of Michael Culmo
of CME Associates is highly appreciated.
The authors would like to thank James Mahoney, Carolyn Ward, and Lori Judd of
the Connecticut Transportation Institute for managing the project and funds. The
support of Peter Glaude and Mark Bouley of the UCONN School of Engineering
Machine Shop is also greatly appreciated in preparing experimental specimens. The
tremendous support of Phil Romegialli and United Steel, Inc. in fabricating experimental
samples and manufacturing the test frame is greatly appreciated. The authors would
like to thank Mike Feder and Infra-Metals for donating steel material used for this
research project and Andrew Ross and Lafarge for donating the UHPC. The student
support of Samuel Turek, Ryan Enos, Richard Breitenbach, and Daniel Lubinitsky is
appreciated.

v
METRIC CONVERSION FACTORS
APPROXIMATE CONVERSIONS TO SI UNITS
SYMBOL WHEN YOU KNOW MULTIPLY BY TO FIND SYMBOL
LENGTH
in inches 25.4 millimeters mm
ft feet 0.305 meters m
yd yards 0.914 meters m
mi miles 1.61 kilometers km
AREA
in2 square inches 645.2 square millimeters mm
2
ft2 square feet 0.093 square meters m
2
yd2 square yard 0.836 square meters m
2
ac acres 0.405 hectares ha
mi2 square miles 2.59 square kilometers km
2
VOLUME
fl oz fluid ounces 29.57 milliliters mL
gal gallons 3.785 liters L
ft3 cubic feet 0.028 cubic meters m
3
yd3 cubic yards 0.765 cubic meters m
3
NOTE: volumes greater than 1000 L shall be shown in m3
MASS
oz ounces 28.35 grams g
lb pounds 0.454 kilograms kg
T short tons (2000 lb) 0.907 megagrams (or "metric ton") Mg (or "t")
TEMPERATURE (exact degrees) oF Fahrenheit 5 (F-32)/9
or (F-32)/1.8 Celsius
oC
ILLUMINATION
fc foot-candles 10.76 lux lx
fl foot-Lamberts 3.426 candela/m2 cd/m
2
FORCE and PRESSURE or STRESS
lbf poundforce 4.45 newtons N
lbf/in2 poundforce per square inch 6.89 kilopascals kPa

vi
TABLE OF CONTENT
TITLE PAGE ................................................................................................................................................. i
TECHNICAL REPORT DOCUMENTATION PAGE ..................................................................................... ii
DISCLAIMER STATEMENT ........................................................................................................................ iii
ACKNOWLEDGEMENT .............................................................................................................................. iv
METRIC CONVERSION FACTORS ............................................................................................................. v
TABLE OF CONTENT ................................................................................................................................. vi
LIST OF FIGURES .................................................................................................................................... viii
LIST OF TABLES ......................................................................................................................................... x
1 Introduction ......................................................................................................................................... 1
1.1 Background and Problem Statement ................................................................. 1
1.2 Current Repair Solutions .................................................................................... 3
1.3 History of Encased composite girders ................................................................ 5
1.4 Advantages of UHPC Material ........................................................................... 6
1.5 Methodology....................................................................................................... 7
2 UHPC-Shear Stud Push-off Tests ..................................................................................................... 9
2.1 Introduction ........................................................................................................ 9
2.2 Literature Assessment of Stud Capacity ............................................................ 9
2.3 Push-off Experiments ....................................................................................... 11
2.3.1 Specimen Fabrication ................................................................................ 11
2.3.2 Experimental Program ............................................................................... 15
2.3.3 Results and Discussion ............................................................................. 18
2.4 Durability testing – Electrochemical Corrosion ................................................. 22
3 Full-Scale Plate Girder Testing ....................................................................................................... 26
3.1 Selection of Specimen ..................................................................................... 26
3.2 Preliminary Finite Element Modeling ................................................................ 26
3.3 Design of Plate Girder Specimens ................................................................... 27
3.4 Design of Test Setup and Load Frame ............................................................ 31
3.5 Instrumentation ................................................................................................ 34
4 Bearing Corrosion Analysis ............................................................................................................ 37
4.1 3D Scanner for Corrosion Detection ................................................................ 37
4.2 Importing 3D Scan Data To Finite Element Models ......................................... 38
4.3 Experimental Testing of Corroded steel girder sections ................................... 41
5 Design of Field Repair ..................................................................................................................... 43
5.1 Bridge No. 3094 in New Haven, CT ................................................................. 43
5.2 Design Methods to determine Repair Capacity ................................................ 45
5.3 Design of Girder End UHPC Repair ................................................................. 46

vii
REFERENCES .............................................................................................................. 50
APPENDIX A Experimental Push-Off Data ............................................................. 53
A1 Graph Terminology .......................................................................................... 53
A2 S1-8-2-NS-1/2 – Benchmark Specimen ........................................................... 53
A3 S2-4-2.5-NS-5/8 – 5/8” Studs ........................................................................... 55
A4 S3-8-2-VHS-1/2 – VERTICAL and horizontal STAGGER ................................ 57
A5 S4-8-1.5-NS-1/2 – 3db Stud Spacing ............................................................... 59
A6 S5-8-2-VS-1/2 – Vertical Stagger ..................................................................... 61
A7 S6-8-2-NS-1/2 – Regular Strength Concrete.................................................... 63
A8 S7-8-2-NS-1/2 – Reduced Cover (1/4”) ............................................................ 65
A9 S8-8-2-NS-1/2 – f’c = 28-ksi ............................................................................. 67
Appendix B Shop Drawings of Push-off Specimens .......................................... 69
Appendix C Experimental Plate Girder Specimen Shop Drawings ................... 78
Appendix D Drawings of the Experimental Test Setup ...................................... 88
Appendix E Experimental Load Frame Shop Drawings ..................................... 90
Appendix F UHPC Repair Sample Calculations .................................................. 96
Appendix G UHPC Repair Sample Drawings ..................................................... 102

viii
LIST OF FIGURES
Figure 1.1: Typical corrosion damage of girder ends beneath the expansion joint ...................... 2
Figure 1.2: Corrosion damage and conventional repair method ................................................. 3
Figure 1.3: Conventional Repair Method for corroded girder ends including jacking of the
superstructure during construction ............................................................................ 4
Figure 1.4: Phase 1 – a) Undamaged Girder, b) Damaged Girder, & c) Repaired Girder ........... 5
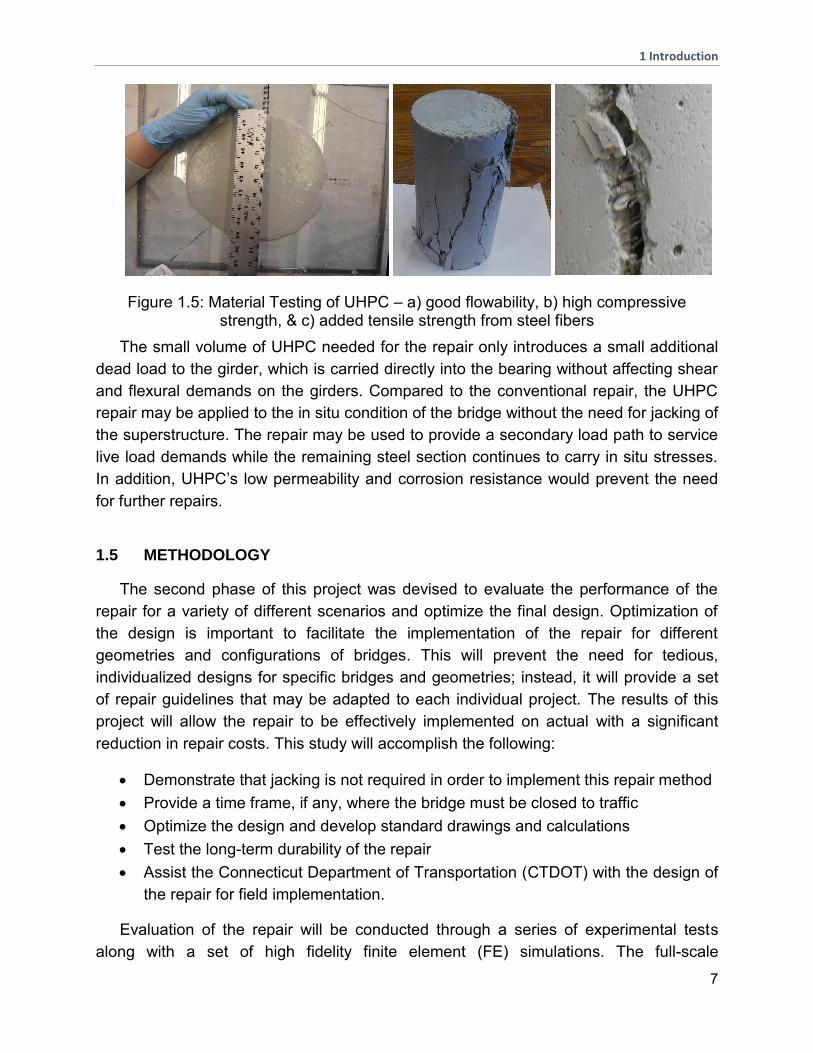
Figure 1.5: Material Testing of UHPC – a) good flowability, b) high compressive strength, & c)
added tensile strength from steel fibers ................................................................... 7
Figure 1.6: 3D rendering of the proposed UHPC repair method -1) Girder End Corrosion, 2)
Welded Shear Studs, & 3) UHPC repair panel ........................................................ 8
Figure 2.1: Force distribution of stud shank and weld collar under pure shear (Hegger et al.
2001) .......................................................................................................................11
Figure 2.2: (a) bend test on studs; (b) welding using stud gun ..................................................12
Figure 2.3: Mixing of (a) dry premix, (b) addition of water and superplasticizer, (c) addition of
chemicals, & (d) addition of steel fibers ....................................................................14
Figure 2.4: (a) spread test of UHPC; (b) Compressive strength development of Ductal JS121214
Figure 2.5: (a) Beam prior to casting; (b) beam installed into forms; (c) completed push-off
sample .....................................................................................................................15
Figure 2.6: Typical experimental setup for push-off test ............................................................15
Figure 2.7: Typical instrumentation assembly for push-off test ..................................................17
Figure 2.8: Typical failure of push-off specimen ........................................................................18
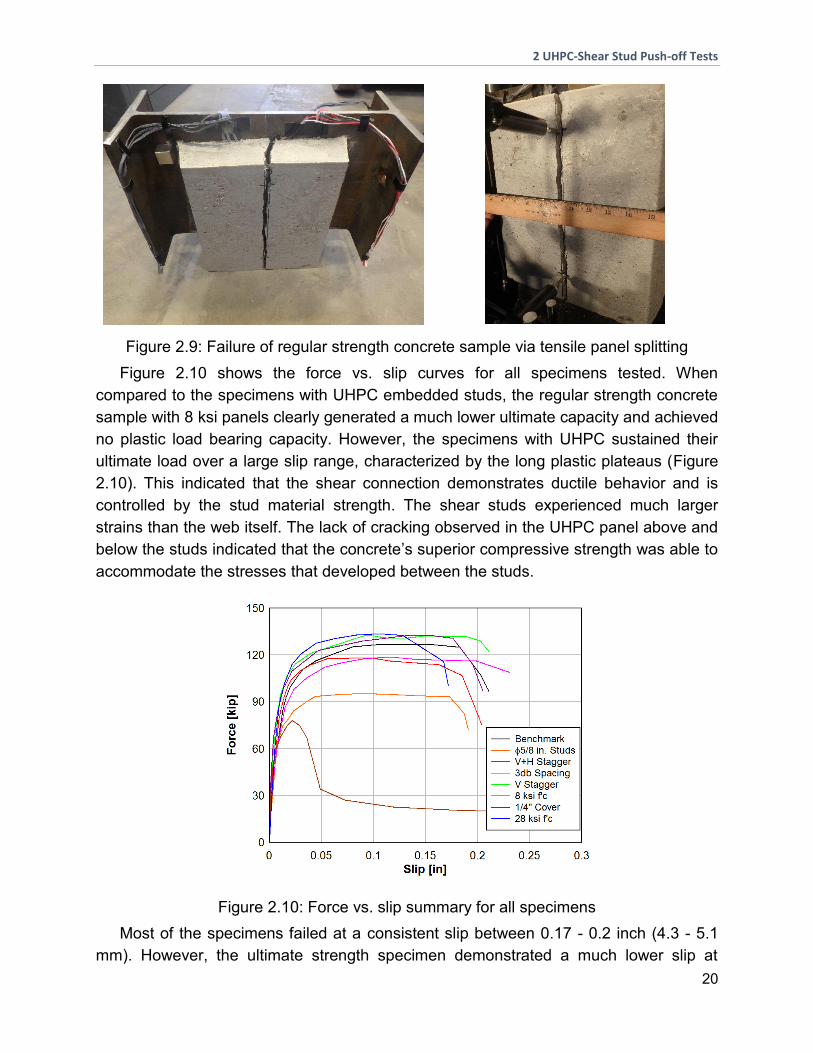
Figure 2.9: Failure of regular strength concrete sample via tensile panel splitting .....................20
Figure 2.10: Force vs. slip summary for all specimens ..............................................................20
Figure 2.11: Panel slip vs. concrete f'c for all UHPC push-off specimens ..................................21
Figure 2.12: Typical strain transfer behavior between the web and shear stud..........................22
Figure 2.13: Experimental assembly of electrochemical corrosion test ......................................23
Figure 2.14: Corrosion at: (a) 0-hrs; (b) 42-Hrs; (c) 186-hrs; (d) 325-hrs ...................................24
Figure 2.15: Steel Thickness vs. Time during Electrochemical corrosion ..................................25
Figure 3.1: Full scale FE models of an interior girder from CT Bridge #818 ...............................27
Figure 3.2: Cross Section of the Plate Girder Specimen ...........................................................28
Figure 3.3: 3D rendering plate girder specimen for experimental testing with splice connection 29
Figure 3.4: Plate girder specimen design for experimental testing ............................................29
Figure 3.5: Fabrication of plate girder specimens by United Steel .............................................30
Figure 3.6: Complete Plate Girder Specimens at United Steel in East Hartford, CT ..................30
Figure 3.7: Simulation of corrosion damage by sandblasting steel beams .................................31
Figure 3.8: Rendering of Phase 1 Test Setup ...........................................................................32
Figure 3.9: Phase 1 completed test setup .................................................................................32
Figure 3.10: Enerpac CLRG-25012 (500-kip) and 50012 (1,000-kip) Hydraulic Cylinder ...........33
Figure 3.11: MTS ASSY-244.41S Hydraulic Actuator for dynamic loading to simulate live load
traffic .....................................................................................................................33
Figure 3.12: Rendering of Full-Scale Experimental Test Setup .................................................33
Figure 3.13: Progress of Experimental Test Setup ....................................................................33
Figure 3.14: New plate girder spreader beams for the experimental test setup .........................34

ix
Figure 3.15: Load frame plate girder assembly with slip resistant paint .....................................34
Figure 3.16: Setup of DIC cameras for experimental testing of corroded girders .......................36
Figure 4.1: Artec Eva 3D Scanner .............................................................................................38
Figure 4.2: 3D Scanning using the Artec Eva ............................................................................38
Figure 4.3: 3D point cloud of corroded girder ............................................................................38
Figure 4.4: Finite Element 3D scanned mesh ............................................................................39
Figure 4.5: Overall deformed shape of the corroded steel girder ...............................................39
Figure 4.6: Stress contour of the corrosion damaged section of the steel girder ........................39
Figure 4.7: FE geometry with the scanned corroded area and the idealized geometry for the
intact rolled-steel shape ...........................................................................................40
Figure 4.8: Deformed shape for corroded rolled-steel girder .....................................................40
Figure 4.9: Experimental test setup for corroded beam ends ....................................................42
Figure 5.1: Bridge No. 03094 in New Haven, CT servicing I-91 over Amtrak Railroad...............43
Figure 5.2: Severe corrosion damage of girder ends .................................................................44
Figure 5.3: Design of potential shear stud layout for a corroded girder end ...............................47
Figure 5.4: Proposed UHPC repair panel for corroded steel girder............................................48
Figure 5.5: Finite Element model of Bridge No. 3094 ................................................................49

x
LIST OF TABLES
Table 2.1: Composition of Ductal JS1212 .................................................................................13
Table 2.2: Summary of Tests ....................................................................................................19
Table 3.1: Selected plate girders (units: kip,in) ..........................................................................26
Table 4.1: Steps for finite element analysis of corroded beams using 3D scanned geometry ....41

1 Introduction
1
1 Introduction
This study documents a novel repair method for corroded steel bridge girder ends
using ultra high performance concrete (UHPC) encasement. The UHPC repair panel is
bonded to the girder through headed shear studs welded to the undamaged steel
portions of the web and flange. This repair may be used to recover bearing and shear
capacity which was lost due to section loss induced by corrosion. The UHPC repair has
several advantages over the competing methods, which are documented in this report.
UHPC was chosen as the repair material because of its proven strength and durability,
which is far superior to conventional concrete. This project is the second phase of a
research program to develop and implement this novel repair method. The first phase
was completed and is documented in CTDOT Report CT-2282-F-15-2; project number
SPR-2282 (Esmaili Zaghi et al. 2015; Zmetra 2015; Zmetra et al. 2015). The information
presented in this report is for the work completed prior to January 1st, 2017. This
includes, but is not limited to preliminary finite element modeling, design and
construction of the experimental load frame for testing, design and construction of full-
scale plate girder test specimens, push-off tests using UHPC-embedded shear studs,
and preliminary design for a pilot implementation of the repair.
1.1 BACKGROUND AND PROBLEM STATEMENT
In 2013, the American Society of Civil Engineers (ASCE) released a Report Card
grading the state of America’s Infrastructure (ASCE 2014). The infrastructure earned a
poor overall grade of a D+. The bridges in the United States were awarded a grade of a
C+. The average age of these bridges was 42 years when this report was released. One
out of nine bridges maintained in the United States has a structurally deficient rating.
FHWA estimated that it would cost approximately $76 billion to repair or replace all of
the structurally deficient bridges across the United States. This overwhelmingly high
estimate is due in part to the current cost of repair methods. New, innovative, and cost
effective repair solutions are necessary to improve the structural integrity and service
life of existing bridges.
In 2015, the total number of structurally deficient bridges maintained in the United
States was 59,000 (FHWA 2014). Many of these bridges have exceeded their 50-year
design life. Corrosion damage is the cause of approximately 15% of the structurally
deficient bridges maintained in the United States. Koch et al. (2002) estimates that the
United states spends $273 billion on corrosion maintenance annually; $8.3 billion of
which goes to repair and replacement of highway bridges. Approximately 50% of the

1 Introduction
2
structurally deficient bridges utilize a steel superstructure. Steel superstructures are
typically used because of their high strength to weight ratio. However, structural steel
corrodes when exposed to oxygen and moisture. The extent of corrosion is dependent
on time, temperature, humidity, exposure, and the presence of chemicals (Albrecht and
Hall Jr 2003). The chief accelerator of corrosion damage in transportation infrastructure
systems is deicer chemicals used to control ice and snow on roadways in cold-climate
regions (Shi et al. 2009).
Extensive corrosion of bridge girders is most commonly found directly beneath deck
expansion joints, which are usually located above girder supports at abutments and
piers as shown in Figure 1.1 (Kayser and Nowak 1989; Usukura et al. 2013; Van de
Lindt and Pei 2006). Purdue University completed an extensive investigation on the
performance of expansion joints. Common problems cited with expansion joint systems
were water leakage and deterioration at bridge bearings (Chang and Lee 2001). Figure
1.2 shows a girder end with corrosion damage beneath the expansion joint and a girder
that has been repair because of corrosion damage.
Figure 1.1: Typical corrosion damage of girder ends beneath the expansion joint

1 Introduction
3
Figure 1.2: Corrosion damage and conventional repair method
Corrosion of steel girder ends can result in significant section loss of the web and
flanges, which reduces the bearing and shear capacity of the member. Several research
projects have been conducted on the performance of steel girders with corrosion
damage. Liu et al. (Liu et al. 2011) studied the effect of corrosion height and thickness
on shear capacity of steel I-girders near bridge supports. The results showed the height
of corrosion had a more significant impact on the capacity of the girder compared to the
length of corrosion. Ahn et al. (2013) performed large scale experiments and extensive
analytical studies on the performance of plate girders with simulated corrosion damage.
The study determined the shear capacity of the plate girders drastically decreased when
the corrosion pattern intersected the tension field in the girder’s end panel. Yamaguchi
and Akagi (2013) completed more analytical studies of the effect of corrosion damage
on the load carrying capacity of I-girders. They found the reduction in load-carrying
capacity was more detrimental if the corroded region had a free boundary. Khurram et
al. (2014b; 2014a) investigated the performance of plate girders with corrosion
damaged webs and bearing stiffeners. Experimental tests and finite element analyses
(FEA) using Abaqus were completed to determine the loss in bearing capacity. The
results indicated that a 50% reduction of the bottom section of the web decreased the
bearing capacity by 39%.
1.2 CURRENT REPAIR SOLUTIONS
Current repair methods for corrosion damage of steel girder ends are expensive and
difficult to implement. The Federal Highway Administration and several Departments of
Transportation (DOTs) have developed standard procedures to repair corroded steel
girder ends: 1) jacking the structure to relieve the load from the bearing, 2) cutting out
the corroded section of steel, 3) welding a new steel section into place, and 4) lowering
the span and remove the jacking equipment (Figure 1.3) (FLDOT 2011; Rossow 2003 ;
Wipf et al. 2003; WisDOT 2015). The conventional repair method requires extensive
1 Introduction
4
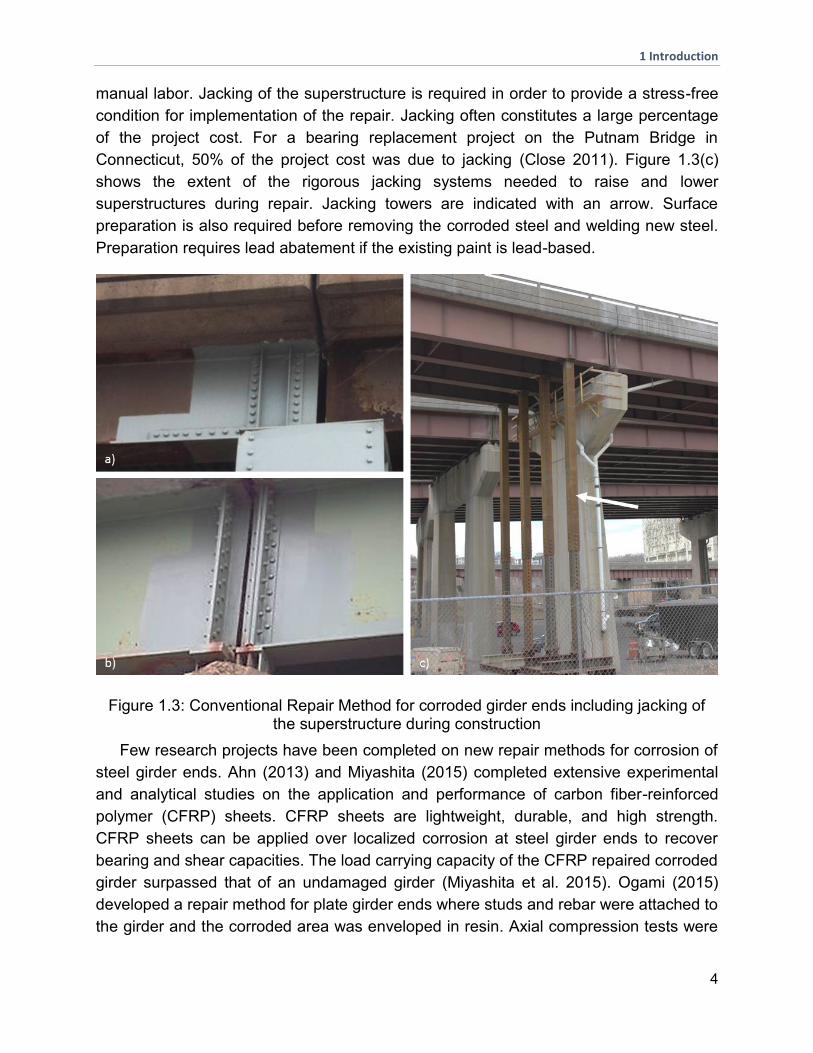
manual labor. Jacking of the superstructure is required in order to provide a stress-free
condition for implementation of the repair. Jacking often constitutes a large percentage
of the project cost. For a bearing replacement project on the Putnam Bridge in
Connecticut, 50% of the project cost was due to jacking (Close 2011). Figure 1.3(c)
shows the extent of the rigorous jacking systems needed to raise and lower
superstructures during repair. Jacking towers are indicated with an arrow. Surface
preparation is also required before removing the corroded steel and welding new steel.
Preparation requires lead abatement if the existing paint is lead-based.
Figure 1.3: Conventional Repair Method for corroded girder ends including jacking of the superstructure during construction
Few research projects have been completed on new repair methods for corrosion of
steel girder ends. Ahn (2013) and Miyashita (2015) completed extensive experimental
and analytical studies on the application and performance of carbon fiber-reinforced
polymer (CFRP) sheets. CFRP sheets are lightweight, durable, and high strength.
CFRP sheets can be applied over localized corrosion at steel girder ends to recover
bearing and shear capacities. The load carrying capacity of the CFRP repaired corroded
girder surpassed that of an undamaged girder (Miyashita et al. 2015). Ogami (2015)
developed a repair method for plate girder ends where studs and rebar were attached to
the girder and the corroded area was enveloped in resin. Axial compression tests were

1 Introduction
5
conducted on the girder ends to measure bearing capacity. Applying the resin repair to
corroded girder ends was able to improve the bearing capacity of the specimen.
New, cost effective rehabilitation designs are necessary to make corrosion repair
projects more viable for bridge owners. New techniques must be structurally effective,
durable, and easy to implement. Repairs should minimize interruptions to traffic,
increase work zone safety, and reduce construction costs. During Phase 1 of this
research project, researchers at the University of Connecticut (UCONN) completed a
proof-of-concept research project to develop a novel repair method for steel girder ends
with significant section loss due to corrosion. The rehabilitation technique used UHPC to
encase corroded steel bridge girder ends. UHPC provides improved tensile strength,
high early strength, good workability, and superior durability, which made it an ideal
repair material over conventional concrete. Half-scale experiments were conducted on
an undamaged, a damaged, and a repaired rolled steel girder shown in Figure 1.4. The
test results were used to: 1) determine the decrease in bearing capacity due to section
loss, 2) demonstrate the ability of the UHPC repair to restore lost girder capacity, and 3)
investigate the constructability of the repair method. The experimental results concluded
that the UHPC repair was easily implemented and succeeded in restoring the bearing
capacity lost due to corrosion damage.
Figure 1.4: Phase 1 – a) Undamaged Girder, b) Damaged Girder, & c) Repaired Girder
1.3 HISTORY OF ENCASED COMPOSITE GIRDERS
Previous research was performed on a similar composite girder system where
concrete was placed on the web of steel girders in between the top and bottom flange.
The concept of concrete-encased steel beams was originally proposed by Elnashai et
al. (1991) as a novel beam-column design for buildings. A small cage of rebar was
welded to the interior section of the girder and was filled with concrete. Nakamura
extended this idea to bridge plate girders and concentrated on the beam’s performance
in shear and bending (Nakamura et al. 2002; Nakamura and Narita 2003). Rebar was
welded between the flanges and stiffeners. Stiffeners were installed at the center
bearing to resist shear and hogging moments. A full web height concrete panel was cast

1 Introduction
6
between the flanges and stiffeners to improve bending and shear strength of the girder.
Hyashi et al (2003) noted this composite beam method could be used to rehabilitate
steel girders which have experienced deformations from buckling. He et al. (2012a;
2012b) extended this method to encase a steel girder with an offset, corrugated web
with concrete on only one side in order to improve the shear strength of the girder.
1.4 ADVANTAGES OF UHPC MATERIAL
UHPC material was chosen as the desired repair material over conventional
concrete because of unique material benefits that it provided to the repair design. The
UHPC mix used in this project has been accepted and tested by FHWA for several
research projects (Graybeal 2014; Russell and Graybeal 2013; Yaun and Graybeal
2014). Russell and Graybeal (2013) document many of the advantages of UHPC
compared to conventional concrete specific to the current application. The UHPC ready
mix used in this research project (Ductal® JS-1212) significantly reduces onsite
complications and inconsistencies with the constructability and performance of the
repair. The flowability of UHPC may allow the repair to be poured or pumped to encase
complex geometries with no concerns of clogging when used with tightly spaced shear
studs. Figure 1.5(a) shows the results of a slump test with UHPC and the good
flowability of the material. The high early strength of UHPC would allow for reduced lane
closures and construction delays, as this particular mix is specified to achieve a
compressive strength of 12-ksi (82.7-MPa) after 12 hours of curing at 120°F. UHPC has
proven durability when exposed to moisture, freeze-thaw conditions, and abrasion. It
has a very low permeability and water absorption capacity, which is approximately 10
and 60 times less than high-performance concrete and normal strength concrete,
respectively (Abbas et al. 2016). Figure 1.5(b) shows a concrete cylinder used to
determine compressive strength after 3 days of curing. The impervious nature of UHPC
would prevent the repair panel or the base steel material of the girder from corroding
further in the future. The crack resistance of UHPC due to its high tensile strength and
ductility eliminate the need for the addition of reinforcing bars. Figure 1.5(c) shows how
the steel fibers bridge micro cracks in the concrete to improve the compressive and
tensile strength of fiber reinforced UHPC. Studies performed on the fatigue resistance of
UHPC and UHPC shear connectors demonstrated the improved resistance compared to
conventional concrete (Classen et al. 2016; Feldmann et al. 2011; Grünberg et al. 2008;
Shaheen and Shrive 2008). The superior characteristics of UHPC may justify the added
costs of the material.
1 Introduction
7
Figure 1.5: Material Testing of UHPC – a) good flowability, b) high compressive strength, & c) added tensile strength from steel fibers
The small volume of UHPC needed for the repair only introduces a small additional
dead load to the girder, which is carried directly into the bearing without affecting shear
and flexural demands on the girders. Compared to the conventional repair, the UHPC
repair may be applied to the in situ condition of the bridge without the need for jacking of
the superstructure. The repair may be used to provide a secondary load path to service
live load demands while the remaining steel section continues to carry in situ stresses.
In addition, UHPC’s low permeability and corrosion resistance would prevent the need
for further repairs.
1.5 METHODOLOGY
The second phase of this project was devised to evaluate the performance of the
repair for a variety of different scenarios and optimize the final design. Optimization of
the design is important to facilitate the implementation of the repair for different
geometries and configurations of bridges. This will prevent the need for tedious,
individualized designs for specific bridges and geometries; instead, it will provide a set
of repair guidelines that may be adapted to each individual project. The results of this
project will allow the repair to be effectively implemented on actual with a significant
reduction in repair costs. This study will accomplish the following:
Demonstrate that jacking is not required in order to implement this repair method
Provide a time frame, if any, where the bridge must be closed to traffic
Optimize the design and develop standard drawings and calculations
Test the long-term durability of the repair
Assist the Connecticut Department of Transportation (CTDOT) with the design of
the repair for field implementation.
Evaluation of the repair will be conducted through a series of experimental tests
along with a set of high fidelity finite element (FE) simulations. The full-scale

1 Introduction
8
experimental test will include several push-off tests to assess the interaction between
shear studs cast into the UHPC repair panel. For the push-off tests, the shear studs will
be welded to the thin web of the girder as opposed to the thick flange, which is most
common. Experimental tests will be conducted on full-scale plate girders to investigate
the performance of different repair geometries. The results for the experimental tests
will be used to calibrate FE models which may then be used to test different
configurations and various parameters. The results from both the experimental and
analytical studies may be used to create a design guide to allow engineers to implement
the design. The team will work with CTDOT to implement the repair in the field for an in-
service bridge. This will include scope, design, construction, and monitoring the repair.
Figure 1.6 shows a rendering of the proposed repair method sequence.
Figure 1.6: 3D rendering of the proposed UHPC repair method -1) Girder End Corrosion, 2) Welded Shear Studs, & 3) UHPC repair panel

2 UHPC-Shear Stud Push-off Tests
9
2 UHPC-Shear Stud Push-off Tests
2.1 INTRODUCTION
In the proposed repair method, the main transfer mechanism that contributes to
increased bearing capacity hinges on the interaction between the web of the old
material, the welded studs, and the panel of UHPC. To generate reliable stud
capacities, the mechanical behavior and failure mechanism must be thoroughly
understood. The most common method to determine stud shear capacity is the “push-
off” test. This test involves pushing the embedded studs against the concrete in pure
shear until failure. The Euro Code (Eurocode-4 2004) provides a standard for the test,
but it involves headed studs welded to the flanges, which are often thicker than the web.
Furthermore, the push-off test specified in EC-4 pertains to headed studs embedded in
regular strength concrete.
The testing method for these experiments will be a modified version of the standard
outlined in the EC-4 with the studs being welded to the web of a rolled girder section
(instead of the flanges) and embedded in UHPC (instead of regular concrete). So far,
the following parameters were investigated through this experimental study:
1. The behavior of studs welded on old, weathered steel
2. The performance of the studs welded to a thin 3/8 inch web
3. The effect of various stud layouts, spacing, diameters, and numbers of studs
4. The durability of the repair by inducing electrochemical corrosion.
2.2 LITERATURE ASSESSMENT OF STUD CAPACITY
Current literature shows that several research groups have investigated the behavior
of headed shear studs embedded in concrete, especially for the purposes of a typical
composite connection between the bridge deck and girders. A vast majority of groups
have reported the interaction between studs and regular strength concrete, citing the
primary modes of failure as conical crushing of surrounding concrete, shear failure of
the stud shank, or a combination of both. Li and Kristen (1996) first reported that the
concrete compressive strength f’c plays a major role in enhancing the strength of the
shear connector, and that an increase from 30 to 81 MPa generates an increase in
maximum shear capacity by about 34%. Lam and El-Lobody (2005) reported that, when
conducting push-out tests with normal strength concrete, a compressive strength of 20
MPa resulted in complete conical failure of the surrounding concrete, with only partial
yielding of the stud. When comparing these results to push-out tests conducted by Kim

2 UHPC-Shear Stud Push-off Tests
10
et al. (2015) using UHPC instead of normal strength concrete, the failure mode was
primarily governed by stud shank failure (with little to no concrete cracking).
Current design codes such as AASHTO-LRFD section 6.10.10.4.3 (AASHTO 2012)
provide equations to define the static strength of a stud shear connector as the
following:
(1)
Similarly, Eurocode-4 provides an estimation of shear capacity as the following:
(2)
Hegger et al. (2001) reported that the presence of a weld collar in headed studs
embedded in UHPC provides an increase in direct shear capacity because of its bearing
contribution onto the concrete, which does not crack. A formula for predicting the shear
capacity of headed studs embedded in high strength concrete was consequently
devised as the following:
(3)
Where Asc is the area of the stud shank, fsu is the ultimate tensile capacity of the
stud, fcu is the compressive strength of the concrete, dwc is the diameter of the weld
collar, lwc is the height of the weld collar, and η is an empirical factor typically taken as
2.5 for UHPC (Kim et al. 2015). A schematic of the mechanical behavior of the stud and
weld collar under a pure shear load is provided in Figure 2.1.

2 UHPC-Shear Stud Push-off Tests
11
Figure 2.1: Force distribution of stud shank and weld collar under pure shear (Hegger et al. 2001)
The influence of UHPC is significant when considering the failure mode of push-out
specimens as the use of typical concrete results in a ductile, plastic behavior of the
headed studs but ultimately failure via compressive crushing of surrounding concrete.
However, since UHPC has a much larger compressive strength, the failure mechanism
is influenced by the quality of the weld and the shear capacity of the headed stud. The
superior compressive strength of the UHPC also generates higher shear capacities due
to direct bearing of the weld collar, which has a slightly larger diameter than the shear
stud (Figure 2.1). The high compressive strength and inclusion of steel fibers to bridge
tensile cracking allows little to no cracking of concrete – at this point, the concrete
confines the stud, resulting in a pure shear failure of the stud shank at the interface of
the two materials.
When applying information from current literature and design codes to determine the
potential of the proposed repair, many questions are still posed. Current literature does
not use older steel with reduced mechanical properties, which may affect the
performance of the composite system. Additionally, no literature was found on the
performance of shear studs when welded onto webs (or flanges thinner than 0.5
inches). Therefore, a comprehensive experimental program was designed to gain
confidence in the mechanical behavior of the studs.
2.3 PUSH-OFF EXPERIMENTS
2.3.1 Specimen Fabrication
Several push-off tests were conducted to evaluate the performance of shear
studs embedded in UHPC. In order to produce results relevant to the envisioned repair,
rolled steel girders were salvaged from the old Pearl Harbor Memorial Bridge in New
2 UHPC-Shear Stud Push-off Tests
12
Haven, CT, which was erected in 1958. According to the American Institute of Steel
Construction, specifications at that time called for grade A7 structural steel, which has a
corresponding yield strength of 32 ksi (Brockenbrough 2002). The girder sections
obtained were W18x55 with a 3/8 inch thick web and a nominal depth between 18 and
21 inches. The steel from these girders served as the base material onto which the
studs would be welded for all push-off experiments.
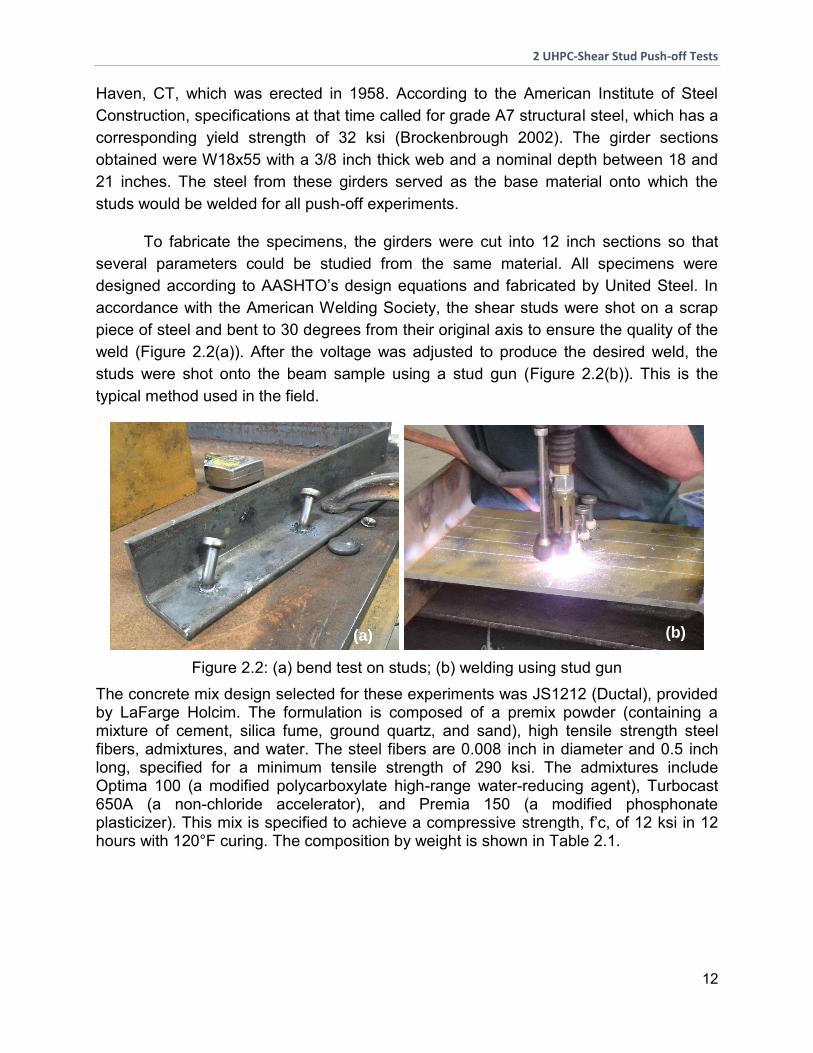
To fabricate the specimens, the girders were cut into 12 inch sections so that
several parameters could be studied from the same material. All specimens were
designed according to AASHTO’s design equations and fabricated by United Steel. In
accordance with the American Welding Society, the shear studs were shot on a scrap
piece of steel and bent to 30 degrees from their original axis to ensure the quality of the
weld (Figure 2.2(a)). After the voltage was adjusted to produce the desired weld, the
studs were shot onto the beam sample using a stud gun (Figure 2.2(b)). This is the
typical method used in the field.
Figure 2.2: (a) bend test on studs; (b) welding using stud gun
The concrete mix design selected for these experiments was JS1212 (Ductal), provided by LaFarge Holcim. The formulation is composed of a premix powder (containing a mixture of cement, silica fume, ground quartz, and sand), high tensile strength steel fibers, admixtures, and water. The steel fibers are 0.008 inch in diameter and 0.5 inch long, specified for a minimum tensile strength of 290 ksi. The admixtures include Optima 100 (a modified polycarboxylate high-range water-reducing agent), Turbocast 650A (a non-chloride accelerator), and Premia 150 (a modified phosphonate plasticizer). This mix is specified to achieve a compressive strength, f’c, of 12 ksi in 12 hours with 120°F curing. The composition by weight is shown in Table 2.1.
(a) (b)

2 UHPC-Shear Stud Push-off Tests
13
Table 2.1: Composition of Ductal JS1212
Component % by
weight
Premix 86.6
Water 5.1
Premia 150 0.7
Optima 100 0.5
TurboCast 0.9
Steel Fibers (2%)
6.2
The mix design was cast and tested several times prior to casting the specimen in
order to gain familiarity with the consistency and mechanical behavior of the material.
All mixing and casting was conducted in the UConn Advanced Cementitious Materials
and Composites Laboratory. The mixing procedure consisted of stirring the dry premix
for approximately 5 minutes to eliminate any clumps (Figure 2.3(a)). Next, water and
superplasticizer were slowly added and allowed to disperse (Figure 2.3(b)). Half of the
water was substituted with ice in order to gain additional workability time. Next, all
chemicals (Premia 150, Optima 100, and TurboCast) were slowly added (Figure 2.3(c)).
Mixing continued until the concrete turned over and a uniform consistency was
achieved. Finally, the steel fibers were slowly added and thoroughly mixed to ensure
optimal dispersion (Figure 2.3(d)). This procedure was strictly adhered to for every
specimen cast to establish consistency.
(a) (b)

2 UHPC-Shear Stud Push-off Tests
14
Figure 2.3: Mixing of (a) dry premix; (b) addition of water and superplasticizer,; (c) addition of chemicals; and, (d) addition of steel fibers
Quality control of UHPC flowability was established by checking the spread of the
concrete immediately after mixing. A spread of 10.125 – 10.375 inches was achieved
consistently (Figure 4a). Additionally, eighteen (18) cylinders were cast from the same
batch to evaluate the concrete compressive strength at 12 hours, 24 hours, and 3, 7,
14, and 28 days. The experimental strength development over time is shown in Figure
4b.
Figure 2.4: (a) spread test of UHPC; (b) Compressive strength development of Ductal JS1212
The forms used to cast each specimen were fabricated by United Steel to ensure
consistency in the concrete panel shape. They consisted of two steel panels resting on
a base plate with a perfectly flat surface. The panels covered both sides of the web with
a clear cover of 0.75 inch from the edge of studs. The steel beam was propped 2.5 inch
above the base plate to allow room for vertical displacement of the beam during testing.
Additionally, a 0.5 -inch gap was left between the concrete panels using collapsible
foam to prevent the web from bearing on the concrete panel. This ensured that the full
load applied was transferred solely from the embedded studs into the UHPC panel.
Prior to casting, the forms were lubricated with a heavy-duty debonding agent to ensure
(c) (d)
10.25”
(a) (b)

2 UHPC-Shear Stud Push-off Tests
15
an easy release. Figure 2.5 shows the push-off specimen before casting, in the
formwork, and after casting.
Figure 2.5: (a) Beam prior to casting; (b) beam installed into forms; (c) completed push-off sample
2.3.2 Experimental Program
All specimens were tested in the UConn Structural Testing Laboratory using the
SATEC 400 kip load frame with a MTS FlexTest-40 controller. Each specimen was
mounted such that the concrete panels were bearing on a 10 inch spherical bearing,
placed on the bottom platen of the machine. Prior to installation, the spherical bearing
was cleaned and lubricated to minimize any friction. The loading was applied on the
flanges and a small portion of the web to ensure a pure shear loading was applied on
the studs. The web was not directly loaded to prevent local buckling between the
concrete panel and the top platen. The experimental setup is shown in Figure 2.6.
Figure 2.6: Typical experimental setup for push-off test
(a) (b) (c)
Loading
point
Spherical
bearing
Loading
point

2 UHPC-Shear Stud Push-off Tests
16
Comprehensive instrumentation was installed on each specimen to extract all
relevant data (Figure 2.7). The studs located on the front side were all instrumented with
uniaxial strain gauges to capture axial deformation during loading. Biaxial strain gauges
were installed just above the top and bottom stud to observe the demand on the web
when the load is transferred to the adjacent studs. The panel was instrumented with
displacement gauges which measured out of plane displacement, which occurs when
the studs start to deform axially. Additionally, slip gauges were installed onto the web
using high strength magnets to monitor the relative vertical displacement between the
steel and the concrete. This movement showed the ductility of the system.

2 UHPC-Shear Stud Push-off Tests
17
Figure 2.7: Typical instrumentation assembly for push-off test
Each specimen was designed to evaluate a parameter of interest, including stud
diameter, stud layout, stud spacing, and varying concrete strengths. Appendix B
contains detailed drawings and dimensions for each specimen. Thus far, the following
samples have been tested:
S1a-8b-2c-NSd-1/2e (Benchmark Specimen) – The benchmark test contained a
total of eight ϕ1/2” studs (four on each side) welded in a straight line relative
to the loading with 2 inch (4db) spacing, per AASHTO specifications.
S2-4-2.5-NS-5/8 (5/8” Studs) – Contained four ϕ5/8” studs (two on each side)
welded in a straight line relative to the loading with 2.5 inch (4db) spacing.
S3-8-2-VHS-1/2 (Vertical and Horizontal Stagger) – Similar to the benchmark
specimen, but the studs were staggered horizontally and vertically to examine
any demand effects on the web.
S4-8-1.5-NS-1/2 (3db Stud Spacing) –The same as the benchmark, but the
studs were spaced at 1.5 inch (3db).
S5-8-2-VS-1/2 (Vertical Stagger) – Designed similar to the benchmark, but
the studs were shot slightly higher on one side of the web than the other to
examine the effect of vertical stagger.
S6-8-2-NS-1/2 (Regular Strength Concrete) – Identical to the benchmark, but
the studs were embedded in regular strength concrete instead of UHPC.
S7-8-2-NS-1/2 (Reduced Cover) – Similar layout to the benchmark specimen,
but the clear cover of the studs was pushed to 1/4 inch (0.5db).
S8-8-2-NS-1/2 (Ultimate Strength UHPC) – Same layout as the benchmark,
but the UHPC was allowed to cure for six months to examine the behavior at
ultimate concrete strength.
aSpecimen number; bNumber of studs; cSpacing of studs (in); dNo Stagger (NS), Vertical
Stagger (VS), Horizontal Stagger (HS); eStud Diameter (in)
Web Strain
Gauge
Stud Strain
Gauge
Panel slip
Flange
displacement Out of plane
displacement

2 UHPC-Shear Stud Push-off Tests
18
Since AASHTO design equations were used to predict the capacity of each
specimen, the machine was set to force control for the first few load cycles. Each
specimen was loaded in 20 kip increments. After each loading, the specimen was
unloaded back down to a baseline of 1 kip, and then loaded again. After 80 kip was
attained, displacement control was used to safely push the studs to failure.
2.3.3 Results and Discussion
The shear connection developed by the studs embedded in the UHPC generated a
significant load bearing capacity even with the old steel as the base material. Excluding
the regular strength concrete specimen, the capacity of the samples with ϕ1/2” studs
ranged between 118-134 kip. The specimen with ϕ5/8” studs generated a load bearing
capacity of 96 kip. The stud layout did not have any significant effect on the load
bearing capacity as every specimen exceeded the theoretical capacity outlined in
AASHTO. All of the specimens (except the regular strength concrete sample) failed via
shear failure of the stud shank directly adjacent to the weld collar (Figure 2.8). There
was little to no cracking observed in the concrete panel. However, a thin portion of the
UHPC sheared off underneath each stud, indicating high shear forces concentrated in
the region due to the weld collar.
Figure 2.8: Typical failure of push-off specimen
Table 2.2 shows a detailed summary of all tests, including experimental capacity,
stiffness of the system, yield points, and maximum slip for all specimens. It was
observed that the specimen with a concrete compressive strength of 28 ksi yielded the
highest capacity of 134 kip. This may be considered the expected behavior of headed
shear studs embedded in UHPC at its ultimate strength. Specimens containing any type
of stagger (vertical, or vertical and horizontal) generated a similar load bearing capacity

2 UHPC-Shear Stud Push-off Tests
19
of 118 kip with a corresponding slip of 0.185 - 0.202 inch (4.7 - 5.1 mm). However, the
specimen with vertically staggered studs demonstrated a much larger elastic stiffness of
3,148 kip/in. Both samples were tested at relatively low compressive strengths of 16-17
ksi, hence a lower capacity was expected per Hegger’s formulation. Consistent
capacities were still achieved even when pushing current design limits, such as tighter
spacing of the studs or applying a reduced cover of 1/4 inch. Both samples generated
capacities between 130 and 132 kip of load bearing capacity.
Table 2.2: Summary of Tests
Description Specimen ID # of
studs f'c
(ksi)
Experimental Capacity
(kip)
Elastic Stiffness of System
(kip/in)
Yield Force (kip)
Max Slip (in)
Slip at Yield (in)
Benchmark A1-8-2-NS-1/2 8 19 126 3202 84 0.183 0.013
5/8” Studs S2-4-2.5-NS-5/8 4 16 96 3391 65 0.173 0.009 V+H
Stagger S3-8-2-VHS-1/2 8 16.5 118 2437 85 0.185 0.011
3db Spacing S4-8-1.5-NS-1/2 8 21 130 2431 82 0.199 0.011
V Stagger S5-8-2-VS-1/2 8 17 118 3148 84 0.202 0.008
RSC S6-8-2-NS-1/2 8 8 86 2230 68 0.029 0.013
Red. Cover S7-8-2-NS-1/2 8 21 132 2344 89 0.176 0.009
28 ksi f’c S8-8-2-NS-1/2 8 28 134 3246 86 0.128 0.007
The regular strength concrete sample showed that conventional concrete materials
was not suitable for the envisioned repair method, as the panels split under tension
when larger loads were applied (Figure 2.9). This demonstrates the need for
reinforcement in the panel, which may be difficult to install. However, the specimens
containing UHPC exhibited almost no cracking, due to the high-strength steels fibers
that are dispersed throughout the matrix. These fibers activate to take on any tensile
action in the panel that may arise when the studs bear on the concrete.
2 UHPC-Shear Stud Push-off Tests
20
Figure 2.9: Failure of regular strength concrete sample via tensile panel splitting
Figure 2.10 shows the force vs. slip curves for all specimens tested. When
compared to the specimens with UHPC embedded studs, the regular strength concrete
sample with 8 ksi panels clearly generated a much lower ultimate capacity and achieved
no plastic load bearing capacity. However, the specimens with UHPC sustained their
ultimate load over a large slip range, characterized by the long plastic plateaus (Figure
2.10). This indicated that the shear connection demonstrates ductile behavior and is
controlled by the stud material strength. The shear studs experienced much larger
strains than the web itself. The lack of cracking observed in the UHPC panel above and
below the studs indicated that the concrete’s superior compressive strength was able to
accommodate the stresses that developed between the studs.
Figure 2.10: Force vs. slip summary for all specimens
Most of the specimens failed at a consistent slip between 0.17 - 0.2 inch (4.3 - 5.1
mm). However, the ultimate strength specimen demonstrated a much lower slip at

2 UHPC-Shear Stud Push-off Tests
21
failure of approximately 0.128 inch (3.25 mm). This was most likely due to the confining
effect of the UHPC as indicated by the increased elastic stiffness. At higher
compressive strengths, confining action of the UHPC around the stud shank prevented
the stud from deforming in a ductile manner. Less axial strain was generated throughout
the length of the stud and a higher shear force was developed in the shank near the
weld collar. Figure 2.11 shows the relationship between experimental panel slip and
compressive strength of the UHPC panels, indicating a reduction in panel slip as
concrete strength increases.
Figure 2.11: Panel slip vs. concrete f'c for all UHPC push-off specimens
Figure 2.12 shows the transfer of strain between the stud and adjacent web on
which it was welded. When initial loads were applied to the system, the web and studs
act together to resist the demands in the elastic range. However, when larger
displacements were induced, the web began to undergo larger plastic deformations
(possibly because it is composed of a weaker grade steel), while the studs just began to
activate. Upon further displacement, the web transferred the load into the studs, which
eventually experienced yielding. At this point, the studs became the weak link in the
system and continued to undergo plastic shear deformation until failure.

2 UHPC-Shear Stud Push-off Tests
22
Figure 2.12: Typical strain transfer behavior between the web and shear stud
Overall, the experiments conducted thus far have generated valuable information
pertaining to design of future repairs. The per-stud capacity for ϕ 1/2 inch studs was
found to be 14.75 – 16.75 kip with a corresponding slip of 0.12 – 0.20 inches. Studs with
5/8 inch diameter generated a per-stud capacity of 24 kip. These values surpass the
capacities given by research formulations and AASHTO and EC-4 design codes, as the
inclusion of UHPC generates a shear capacity due to direct bearing of the weld collar. In
general, the web initially takes on strain at small loadings, and then transfers the load to
the studs once initial yielding occurs. The system is then controlled by the studs, which
typically fail due to ductile shear failure at the stud shank.
2.4 DURABILITY TESTING – ELECTROCHEMICAL CORROSION
One of the parameters of interest for future experiments involves testing a push-off
sample with induced corrosion in the web. This will shed light on how far the web can be
pushed when significant corrosion is present in regions where studs are welded and
actively taking loads. Therefore, measures were taken to explore potential accelerated
corrosion techniques, some of which include salt-fog testing, sand-blasting to reduce
cross sectional area, and electrochemical corrosion. Although salt-fog testing was
strongly considered, the research team decided that electrochemical corrosion was
most suitable since it is easy to control the section loss and it provides a more realistic
degraded surface in a shorter time span. Although electrochemical corrosion was
chosen for push-off testing, other methods may be considered in the future for the large
scale experiments.
Electrochemical corrosion involves deterioration of a charged metal when it
comes into contact with an electrolyte solution. Two half reactions occur during this

2 UHPC-Shear Stud Push-off Tests
23
process; a cathodic and anodic reaction. The cathode, or the material to be corroded, is
submerged in an electrolyte solution (which is typically acidic) during which its atoms
dissolve into a moisture film, exposing the bare surface of the material. Next, a current
must be applied to the target metal to transfer ions into the solution. Corrosion occurs
when the anode, or a cation of a more-noble metal (such as stainless steel or copper),
receives the electrons generated on the sample’s surface (ASM-International 2000;
Revie and Uglig 2008). This method offers a convenient way to achieve a desired
section loss in a particular time frame by adjusting the magnitude of current impressed
on the sample, as derived by Faraday’s law. Equation 4 shows the equation used to
calculate mass loss, where Am is the atomic mass of the sample material (grams), I is
the corrosion current (amperes), t is the required time for corrosion (sec), Z is the
valence (taken as 2 for rust product of iron), and F is Faraday’s constant (96,487
coulombs).
∆𝑤 = 𝐴𝑚𝐼𝑡
𝑍𝐹 (4)
In order to gain confidence with the deterioration process, a formal experiment
was conducted on a sample piece of steel that was also used as the base material for
the push-off experiments. The experimental setup in shown in Figure 2.13. The bottom
flange and lower portion of the web were submerged in a 5% NaCl (sodium chloride)
solution, which served as the electrolyte. A piece of stainless steel, which served as the
cathode, was also submerged in the solution. A positive current of 2 amperes was
impressed onto the sample piece of steel, and the negative wire was attached to the
piece of stainless steel to complete the circuit and allow electrons to flow. The mass
loss and change in web and flange thickness were monitored as a function of time.
Figure 2.13: Experimental assembly of electrochemical corrosion test
20V DC Power
Supply
5% NaCl solution
Sample steel
piece (cathode)
Stainless steel
piece (anode)

2 UHPC-Shear Stud Push-off Tests
24
Figure 2.14 shows the progression of section loss of a rolled-steel girder section due
to electrochemical corrosion. Figure 2.15 shows the extent of corrosion and degree of
section loss as a function of time. Over time, the solution became darker and black
sludge accumulated at the surface, and eventually dropped to the bottom of the
container. This sludge is the oxidized byproduct of the steel, which accumulates at the
surface when in contact with oxygen. Throughout the duration of testing, the web
experienced approximately 30% section loss in about 14 days, while the flanges
thicknesses reduced by about 12%. The difference in section loss between the web and
the flange stems from varying initial thicknesses. The entire specimen, however,
experienced a constant mass loss of about 2.07 grams per hour, which is consistent
with Faraday’s theoretical mass loss of 2.04 grams per hour.
Figure 2.14: Corrosion at: (a) 0-hrs; (b) 42-Hrs; (c) 186-hrs; (d) 325-hrs
(b) (a)
(c) (d)

2 UHPC-Shear Stud Push-off Tests
25
Figure 2.15: Steel Thickness vs. Time during Electrochemical corrosion
Electrochemical corrosion has been found as an effective way to test the durability of
the UHPC repair method compare to steel girder sections. A push-off test will be
conducted on a specimen exposed to electrochemical corrosion to investigate the effect
of corrosion on the performance of the repair and the interaction between the girder
web, the shear studs, and the UHPC repair panel.

3 Full-Scale Plate Girder Testing
26
3 Full-Scale Plate Girder Testing
A series of experiments will be conducted on full-scale plate girders. These tests will
aim to determine the full-scale abilities of the repair method on plate girders with various
repair geometries and configurations. The experimental setup for this test will be
designed to accommodate the capacity of the plate girder specimens, the repair
capacity, and the structures lab load frame. The load frame will be modified to increase
its capacity.
3.1 SELECTION OF SPECIMEN
Complete data from the Connecticut bridge inventory was reviewed and summarized
in Table 3.1. These entries accurately represent the larger selection of bridges, where
the UHPC repair may be applicable. The bridges vary in year built, span length, number
of spans, and ADT. A statistical approach was used to select 35 bridges to accurately
represent the overall population. ProjectWise (CTDOT’s project inventory) was used to
collect drawings from each of the selected bridges. From the drawings, geometric
information and common details were reviewed and summarized to be used in the
creation of standard repair details. Generalized geometries were created for each
structure type by combining the information from all of the selected designs. Typical
plate girder designs were extracted for bridges built between the 1950s and 1960s
which are currently reaching their design life.
Table 3.1: Selected plate girders (units: kip,in)
CT Bridge
Number
Year Built
Web Thick
Beam Depth
D/t Stiffener Spacing
d0/D Kmin Vcr Cel Vp C Vn
58a 1958 0.375 54 144.0 36 0.67 16.25 414 0.892 470 0.845 396.9
104d 1959 0.375 58 154.7 42 0.72 14.54 345 0.692 505 0.692 349.0
250 1958 0.4375 42 96.0 35.76 0.85 11.90 619 1.469 426 1.000 426.3
818 1963 0.375 52 138.7 36 0.69 15.43 408 0.914 452 0.855 386.7
956b 1960 0.375 60 160.0 42 0.70 15.20 349 0.676 522 0.676 352.9
3096 1965 0.375 62 165.3 54 0.87 11.59 257 0.483 539 0.483 260.3
Test 2016 0.375 52 138.67 40 0.77 13.45 356 0.796 452 0.796 360.2
3.2 PRELIMINARY FINITE ELEMENT MODELING
Relevant literature was reviewed on FE simulation of UHPC material and bridge
girders. Literature on UHPC material properties was collected in order to affirm the most

3 Full-Scale Plate Girder Testing
27
accurate material property was used in Phase 1. Research suggests that the UHPC
material from Phase 1 is the most comprehensive, but two additional materials will be
further studied moving forward. Literature on modeling of plate and rolled girders was
collected to provide detail on the elements, contact surfaces, and meshes used as well
as potential limitations of the software.
Different options for the geometry of the full-scale plate girder specimen were
studied based on the existing plate girder bridges from CT discussed in the previous
section. Models were created to analyze performance of each of the designs.
Preliminary controls were performed to verify the adequacy of the capacity of the anchor
holes on the strong floor of the Structure Lab. The design of the experimental setup will
be detailed in a following section.
Multiple modeling methods from Phase I were refined to decrease analysis time and
increase reliability and accuracy. Major changes include how the shear studs, bearings,
and load ram are modeled. These changes were implemented in the Phase I models
and compared against the experimental data for validation. Modeling methods are
currently finalized, but will be adjusted on an as needed basis. Models were created for
the full-scale experimental test setup to verify failure modes and to ensure the limits of
the system remained within the capacity of the load frame and structures lab.
An additional model was also created for CT Bridge #818 as it was the main bridge
studied for the test specimen design. Models have also been created for this bridge with
and without skew. Different designs and methodologies have been studied to ensure
the models are accurate and efficient. Figure 3.1 shows a snap shot of the geometric
model of full scale girders modeled after CT Bridge #818.
Figure 3.1: Full scale FE models of an interior girder from CT Bridge #818
3.3 DESIGN OF PLATE GIRDER SPECIMENS
For the second phase of this study, the UHPC repair will be experimentally tested on
a typical plate girder design. Using the plate girders outlined in the previous section,
dimensions were chosen for the plate girder design. The test specimens are 52 inch

3 Full-Scale Plate Girder Testing
28
deep (D) plate girders with a 3/8 inch web (tw). The width of the flanges (bf) is 18 inch.
The bottom flange has a thickness (tbf) of 1 inch and the top flange has a thickness (ttf)
of 1.5 inch. The top flange had a larger thickness than the bottom flange in order to
provide additional resistance from lateral torsional buckling (LTB), similar to a composite
deck. The flanges were connected to the web with a 5/16 inch weld. The plate girder
specimens have two different size stiffeners. The web stiffeners were 6 inch wide and
3/8 inch thick. The bearing stiffeners were 6 inch wide and 1/2 inch thick. The cross
section of the plate girder specimens is shown in Figure 3.2. Complete shop drawings of
the plate girder specimens may be found in Appendix C.
Figure 3.2: Cross Section of the Plate Girder Specimen
Calculations were completed to determine the shear strength of the specimen
design. AASHTO (2012) Article 6.10.9.3 shear resistance equations for steel I-sections
under flexure were used for the plate girder specimens. Table 3.1 shows the buckling
ratio (K), elastic shear buckling capacity (Vcr), plastic shear resistance (Vp), elastic-
plastic shear strength ratio (Cel), ratio of plastic shear strength (C), and nominal shear
strength (Vn). The shear strength of the plate girder specimens was necessary for
determining the anticipated maximum strength of the entire experimental system. The
results of these calculations were compared to the results of the analytical FE models
detailed in the following section.
In order to improve the efficiency of the experimental testing system, a splice
connection designed to allow testing of multiple panels. This enabled the end test panel
with corrosion damage to be interchangeable for each subsequent experiment, so that
the entire plate girder will not need to be discarded after each test. The splice
connection was placed directly after the web stiffener before the loading location. The
splice was designed to carry the total plastic shear and moment capacity of the plate

3 Full-Scale Plate Girder Testing
29
girder. The splice connection was checked for shear and bearing of the bolts and
yielding, rupture, and block shear of the web and flanges using the AISC Steel
Construction Manual (AISC 2011). Preliminary finite element models were completed
with and without the splice connection to ensure it did not have a detrimental effect on
the performance of the plate girder. The results showed the load transfer through the
end panel was not greatly affected by the splice connection. Figure 3.3 and Figure 3.4
show the design of the full-scale plate girder specimens with the splice connection. The
final shop drawings for the plate girder specimens may be found in Appendix C.
Figure 3.3: 3D rendering plate girder specimen for experimental testing with splice connection
Figure 3.4: Plate girder specimen design for experimental testing
The plate girders were made from new, A36 steel plates purchased from Infra-
Metals Co. in Wallingford, CT. The plate girders were fabricated by United Steel, Inc.
from East Hartford, CT, who has extensive experience with fabrication of plate girders.
Each specimen was fabricated with high quality craftsmanship. The specimens have

3 Full-Scale Plate Girder Testing
30
been delivered and are currently being prepared for testing. Figure 3.5 and Figure 3.6
show the plate girder specimens being fabricated and completed.
Figure 3.5: Fabrication of plate girder specimens by United Steel
Figure 3.6: Complete Plate Girder Specimens at United Steel in East Hartford, CT
Modification of the test specimens will commence beginning with the simulation of
corrosion damage of the girder end. In phase one of this study, the corrosion damage
was simulated by removing a uniform section of steel material through CNC milling.
However, this was a limitation for the study because inspection reports show that
corrosion damage is non-uniform and varies in depth and size. Therefore, for this study,
corrosion section loss will be simulated by sandblasting the material at locations where
corrosion typically occurs in order to create a more relevant experimental test.
Sandblasting has been found as a capable method to remove steel material. It may be
easily performed and is simple to monitor and control. Figure 3.7 shows a test steel
beam end with section loss from sandblasting. Other methods such as electrochemical
corrosion (which is being used for the push-off tests) may be unpredictable to achieve a
desired section loss at precise locations for large-scale samples. Section 4 provides
additional information on experimental and analytical corrosion test.

3 Full-Scale Plate Girder Testing
31
Figure 3.7: Simulation of corrosion damage by sandblasting steel beams
3.4 DESIGN OF TEST SETUP AND LOAD FRAME
The experimental testing for this research project will require more force demand
than previous large-scale experimentation that has taken place at the University of
Connecticut. Therefore, the large-scale test load frame in the UCONN Structures
Laboratory has been modified and strengthened to achieve the desired capacity for this
project. In phase one of this project, half-scale rolled girders were tested until failure.
The existing load frame consisted of four 20-foot tall HP14x89 columns and a single
W36x160 spreader beam; two sets of two columns were connected by welding
HSS8x8x1/2 tubes in K-braces with the spreader beam connecting the two units as
shown in Figure 3.8. Each column was tied into the UCONN Structures Lab with four
11/8 inch anchor rods secured to the 4-foot thick strong floor. This load frame setup was
designed for a 500 kip Enerpac double-acting hydraulic load ram attached to the
spreader beam which spanned 8 foot between two columns. The complete test setup
for phase one is shown in Figure 3.9.

3 Full-Scale Plate Girder Testing
32
Figure 3.8: Rendering of Phase 1 Test Setup
Figure 3.9: Phase 1 completed test setup
The second phase of this research project required a much larger force range for
testing. An Enerpac CLRG-50012 1,000 kip hydraulic load ram will be used for
experimental testing of the plate girder specimens. Figure 3.10 shows the 1,000 kip and
500 kip Enerpac load rams. The controlling element from the existing setup was the
tensile strength of the anchor rods. Since the existing spreader beam spanned between
two columns, they placed a much higher demand on the anchor rods. For the new test
setup three additional spreader beams will be added to the system to equally engage all
four columns and clusters of anchor rods. Two spreader beams will span between the
columns of the two units and a third beam will connect the two spreader beams.
Depending on the desired capacity of the system, the load ram may be placed at
several locations along the middle spreader beam. The static load capacity of the load
frame will be 1,000 kip with a maximum bearing reaction force of 750-800 kips
depending on the length of the test specimen. The load frame will also be modified to
allow an MTS ASSY-244.41S Actuator to be mounted directly over the bearing of the
plate girder to provide a dynamic load to simulate traffic. This actuator may apply a
maximum force of 110 kip. A photo of the MTS Hydraulic Actuator is shown in Figure
3.11. Figure 3.12 shows a rendering of the new load frame design. Figure 3.13 shows
the erected load frame in the UCONN Structures lab. AutoCAD drawings of the
complete experimental test setup are shown in Appendix D.

3 Full-Scale Plate Girder Testing
33
Figure 3.10: Enerpac CLRG-25012 (500-kip) and 50012 (1,000-kip) Hydraulic Cylinder
Figure 3.11: MTS ASSY-244.41S Hydraulic Actuator for dynamic loading to simulate live load traffic
Figure 3.12: Rendering of Full-Scale Experimental Test Setup
Figure 3.13: Progress of Experimental Test Setup
Due to dimensional constraints the spreader beams were designed as plate girders.
In order to improve the overall stiffness of the test setup, the spreader beams needed to

3 Full-Scale Plate Girder Testing
34
be deep while still fitting between the flanges of the columns. The spreader beams
between the columns are 7’10” long and have a depth of 36 inch, a web thickness of 1
inch, a flange width of 11 inch, and a flange thickness of 1.5 inch. The cross spreader
beam connecting the two spreader beams is 7’10” long and has a depth of 36 inch, a
web thickness of 1.25 inch, a flange width of 16 inch, and a flange thickness of 1.5 inch.
During phase I, reduced stiffness of the overall test setup affected the results of the
tests because of slip in the load frame connections. Therefore, for this test, a Sherwin
Williams Protective and Marine Coating was used on the load frame to provide a Class
B slip coefficient with an acceptable coefficient of friction for slip critical condition.
Calculations were completed to ensure that the entire testing system could withstand
the demands of the experimental tests. The capacity of the floor bolts, beam
connections, and spreader beams were designed and checked to provide adequate
stiffness and strength during testing. The new spreader beams are shown in Figure
3.14. Shop drawings for the new load frame members are shown in Appendix E. The
load frame assembly with the slip resistant paint applied is shown in Figure 3.15.
Figure 3.14: New plate girder spreader beams for the experimental test setup
Figure 3.15: Load frame plate girder assembly with slip resistant paint
3.5 INSTRUMENTATION
During the full-scale experimental tests, extensive instrumentation will be used to
monitor the performance of each plate girder specimen. Force, displacement, strain,
and temperature data will be collected for each individual test. The data will be collected
to a single file using a high power and quality data acquisition system. The experimental

3 Full-Scale Plate Girder Testing
35
tests for the full-scale plate girders will require the collection of over 75 channels of
data. To accommodate the increase in data collection, an HBM MGCplus will be used.
This module is a high-channel count data acquisition system (DAQ) which will allow for
the integration of a large number of sensors to collect a variety of different data
parameters. This HBM DAQ is also compatible with other HBM devices such as the
HBM MX1615B which will provide flexibility and versatility for collecting experimental
data. Combining multiple HBM acquisition systems will improve the synchronization and
compatibility of data collection during testing and during data analysis. The HBM
software CatmanEasy will be used to collect the data.
Force will be measured throughout the experimental test using 6 degree of freedom
load cells that have been designed and manufactured at the University of Connecticut
during the first phase. These load cells will provide axial, shear, and moment reactions
from each of the two bearings at each end of the plate girder specimens. Pressure
transducers will be used to measure the pressure of the forward and return lines of the
Enerpac Hydraulic load ram.
Displacement measurements will be collected using rod potentiometers, string
potentiometers, and strain based displacement transducers. Novotechnik LGW series
potentiometers will be widely used to record vertical displacement of the plate girder
specimens, horizontal displacement of the plate girder web, rotation of the bearing, and
other points of interest. String potentiometers will be used to measure and capture
shear deformation of the plate girder specimen end panel. Tokyo Sokki Kenkyujo strain
based displacement transducers will be used to capture the interaction between the
UHPC repair panel and the plate girder web. This includes separation, out of plane
displacement, and displacement of the repair panel.
The strain gauges which will be used are sold by Texas Measurements. These
gauges will be used to measure vertical and shear strain in the web of the steel girder,
flexural strain in the bottom flange, bearing strain in the stiffeners, bearing strain in the
UHPC repair panel, and several other locations. Uniaxial, biaxial, and triaxial gauges
will be used to measure these strain values. Internal bolt gauges will be used to
measure the strain in shear studs connecting the UHPC repair panel to the web.
Strain measurements will also be taken using 3D Digital Image Correlation (DIC) of
one side of the plate girder end panel. DIC is a photographic system with the ability of
precisely tracking the position of a very large number of points (pixels) on a specimen
during load testing. By tracking the movement of these points, DIC systems are capable
of capturing full strain field distributions over the surface of the plate girder specimens
and the UHPC repair panels. This system will significantly benefit the study by providing
valuable information on the performance of the large-scale plate girder specimens

3 Full-Scale Plate Girder Testing
36
before and after the repair is applied. It will provide invaluable understanding regarding
the transfer of load from the plate girder to the repair. 3D DIC systems are capable of
capturing out of plane displacements and protrusions including buckling. The DIC
system consists of two charge-coupled device (CCD) progressive scanner cameras
along with full-spectrum LED lighting, ultra-low distortion lenses, and a mounting
system. The surface of the specimen being tested should be painted with a speckle
pattern in order to improve the software’s ability to track points along the surface. Figure
3.16 shows the test setup of the 3D DIC system for a corroded beam test which will be
explained in the next section.
Figure 3.16: Setup of DIC cameras for experimental testing of corroded girders
Temperature gauges will also be used on the steel plate girder (foil type) and
embedded in the UHPC repair panel (probes). These gauges will be used to monitor
fluctuations in curing temperature from casting to testing.

4 Bearing Corrosion Analysis
37
4 Bearing Corrosion Analysis
4.1 3D SCANNER FOR CORROSION DETECTION
Research was conducted to determine the feasibility of using a 3D scanner to
accurately measure the extent of corrosion damage. Corrosion damage is typically non-
uniform in size, depth, and shape. However, field inspection reports typically record the
maximum length, height, and depth of corrosion damage these may prove to be
extremely conservative and inaccurate. 3D scanning corrosion damage could provide a
precise depiction of the corrosion with millions of data points rather than taking selected
measurements with a caliper and interpolating a surface between them. It allows for
surface mapping of the scanned section to be imported into Finite Element software in
order to create models with an accurate depiction of the geometry. A refined, accurate
model is key to understanding the performance of the structure and determining the
correct way to repair damage.
An Artec Eva 3D scanner was purchased (Figure 4.1). This scanner is capable of
producing a complete 3D rendering of a scanned section with an accuracy of ≤0.5-mm.
The scanner is portable and may be used to measure corrosion damage of deficient, in-
service bridges (Figure 4.2). This will allow engineers to determine the extent and
pattern of corrosion damage in the field. For the experimental testing, this will allow for
the replication of corrosion damage by removing similar volume and patterns of extreme
damage from each of the experimental specimens (Figure 4.3). The damage may then
be imported into finite element models to more accurately represent the specimens and
capture their performance. The loss in section computed by the scanner could be used
to more accurately predict girder capacity loss due to corrosion damage rather than
current methods of field measurements and the assumption of a uniform reduction of
cross sectional area. 3D scanning has the potential to be powerful tool for inspectors in
measuring corrosion damage of structures in the field. The technology is accurate and
provides a thorough understanding of the corrosion damage pattern and depth.

4 Bearing Corrosion Analysis
38
Figure 4.1: Artec Eva 3D Scanner
Figure 4.2: 3D Scanning using the Artec Eva
Figure 4.3: 3D point cloud of corroded girder
4.2 IMPORTING 3D SCAN DATA TO FINITE ELEMENT MODELS
To be able to accurately represent corrosion damage, methods are needed to
accurately model non-uniform corrosion in Finite Element Models. Importing 3D scan
data into finite element programs would provide an accurate geometry of the damaged
section. Scans were taken of sections of corroded steel rolled girders from the old Q-
Bridge in New Haven, CT. Several programs were used to convert the point cloud
collected from the 3D scanner to a finite element mesh. Gmsh is open source software
that was used to obtain finite element geometry from 3D scan data. An example of the
finite element measure is shown in Figure 4.4. A finite element simulation of the
corroded section was run in Abaqus with the proper boundary conditions to determine
the failure mode of the section. The deformed shape of the beam is shown in Figure 4.5
and Figure 4.6. The results of the model were found to be accurate as precise stress
contours and buckling patterns were captured.

4 Bearing Corrosion Analysis
39
Figure 4.4: Finite Element 3D scanned mesh
Figure 4.5: Overall deformed shape of the corroded steel girder
Figure 4.6: Stress contour of the corrosion damaged section of the steel girder
Additional beam sections were also scanned to acquire the exact geometry of the
corroded section. Several changes were made to the finite element models for
advanced analysis. A mass scaling sensitivity study was conducted to compare CPU
time vs. deviation in the model. A parametric study was conducted to investigate
deformed shape and load vs. displacement relationships to compare with upcoming
experiment test that will be completed on the sections of corroded rolled-steel girders.
The study varies element types and FEM characteristics. Hybrid models were also
created for this study, which use only the 3D scanned geometry of the portion of the

4 Bearing Corrosion Analysis
40
girder with corrosion damage. The intact portion was replaced with an idealized model
based on eh geometry of the rolled-steel shape in order to improve computational
efficiency. Figure 4.7 shows the finite element geometry with the scanned corroded area
and the idealized geometry for the intact rolled-steel shape. Figure 4.8 shows the
deformed shape of the girder section. Table 4.1 shows the progression of each of the
four rolled-steel girder sections from the 3D scan to FEM geometry to analysis, and the
results.
Figure 4.7: FE geometry with the scanned corroded area and the idealized geometry
for the intact rolled-steel shape
Figure 4.8: Deformed shape for corroded rolled-steel girder

4 Bearing Corrosion Analysis
41
Table 4.1: Steps for finite element analysis of corroded beams using 3D scanned geometry
4.3 EXPERIMENTAL TESTING OF CORRODED STEEL GIRDER SECTIONS
Experimental Tests will be conducted on the four corroded rolled-steel girder
sections that were salvaged from the old Q-Bridge in New Haven, CT. The results of
these tests will be used to validate the finite element models of the corroded girder
sections. Similar results will show that the 3D scanned geometry of the corroded area
could be used to accurately model to the structural section. The 3D DIC system
explained in Section 3.5 will also be used to capture the strain field on the surface of the
girder under loading. The results from the DIC will be used to compare with the results
of the finite element models. Figure 4.9 shows the layout for the experimental testing of
the corroded girder specimens. A bearing load was applied directly at the location of
maximum corrosion of the beam. Two roller bearings were used to apply the load to the
rolled girder.

4 Bearing Corrosion Analysis
42
Figure 4.9: Experimental test setup for corroded beam ends

5 Design of Field Repair
43
5 Design of Field Repair
Representatives from the University of Connecticut, Connecticut Department of
Transportation, CME Associates, and GM2 Associates are working together to
coordinate and design a field repair for Bridge No. 03094 in New Haven, CT using
UHPC encasement. Several meetings were held to discuss the scope of the project,
delegation of tasks, logistics, and the complete design. It was decided to begin the
preliminary design for the bridge using UHPC to encase the corroded beam ends. The
material presented below details the development of design guidelines, a set of
calculations for the repair capacity and stud strength, and design drawings.
5.1 BRIDGE NO. 3094 IN NEW HAVEN, CT
Bridge No. 3094, constructed in 1965, is located in New Haven, CT. The bridge
carries I-91 Northbound and Southbound over an Amtrak Railroad (AI-Engineers 2016;
CME 2015). The bridge is located between exits 7 and 8. The bridge has a rolled-steel
girder superstructure with a reinforced concrete deck with four simply supported spans.
The span lengths vary due to a variety of different skew angles. The substructure
consists of two reinforced concrete abutments and three reinforced concrete piers. The
bearings are elastomeric expansion bearings and steel fixed bearings. Figure 5.1 shows
Bridge No. 03094.
Figure 5.1: Bridge No. 03094 in New Haven, CT, servicing I-91 over Amtrak Railroad

5 Design of Field Repair
44
Field inspection of the bridge superstructure showed that the girders are in poor
condition as the girder ends exhibit extensive rust. The webs have a maximum section
loss of 5/16 inch and the bottom flange has a maximum section loss of 1/4 inch. This
resulted in a maximum bearing capacity loss of 58.3% and a maximum shear capacity
loss of 21%. Figure 5.2 shows portions of the corrosion damage to girder ends. The
superstructure was deemed structurally deficient and requires extensive repairs for
corrosion damage.
Figure 5.2: Severe corrosion damage of girder ends
Repairs of the I-91 Bridge will occur over night with only temporary lane closures to
minimize traffic disruption. All repair operations will be coordinated with Amtrak. This will
likely limit the duration and extent of closures while work is completed. CME Associates
completed a rehabilitation study to determine the proper course of action for repairing
this structurally deficient bridge. Recommendations were provided to use UHPC
encasement to repair the corroded girder ends. This repair option was recommended
over the conventional method of plated steel repair because of lower cost estimates,
shorter construction duration and lane closures, and lower impact to the railroad traffic.

5 Design of Field Repair
45
5.2 DESIGN METHODS TO DETERMINE REPAIR CAPACITY
Three different design methods were studied for the repair of corroded beam ends
with UHPC encasement: Strength Design, Fatigue Design, and Capacity Design. These
methods were completed to determine the number of shear studs needed to restore
adequate capacity. Complete calculations for all design methods may be found in
Appendix F.
Strength Design
The Strength Design method was used to determine the number of studs needed for
the repair. This could be done for two different situations: 1) Live Load only, HL-93,
where the Dead Load is carried by the remaining steel section, or 2) Strength 1 design
were the studs are designed to carry all gravity loads applied to the beam. For the live
load only case, the total shear carried by the repair panel was taken as the HL-93
loading multiplied by the dynamic load factor of 1.75. This particular design method
generated the lowest design capacity. This method may be used in situations where it is
difficult to weld studs and/or when the repair is only temporary and is not necessary to
over design the repair. The second controlling scenario would follow the Strength I
design where the shear studs are designed to carry all gravity loads applied to the
girder. For this design method, the shear demand on the girder end was calculated for
dead load (both components and wearing components) and live load based on load
factors and load combinations from the AASHTO Bridge Design Code (AASHTO 2012).
The shear demand for strength design was determined based on distribution factors of
both live load and dead load for exterior beams, interior beams, skewed, beams, and
additional components. Shear demands at girder end calculations are shown in
Appendix F.
Fatigue Design
The second method for the design of the repair method was the fatigue design of the
shear studs welded to the web of the girder. The shear studs are designed to carry
shear and bearing forces from the girder to the UHPC repair panel. Due to live load
traffic over the bridge, the shear studs are expected to experience extensive cycles of
loading which may lead to fatigue failure. Based on the number of cycles the shear
studs will experience (based on ADT of the bridge), fatigue design may be used to verify
the strength of the shear studs. AASHTO’s fatigue design for shear connectors was
used to determine the fatigue capacity of each shear stud (AASHTO 2012). The fatigue
demand load was determined according to AASHTO for a fatigue wheel load and the
fatigue truck. The number of studs needed to provide acceptable fatigue strength of the
repair was higher than for basic strength performance of the repair. Therefore, for
situations where the bridge experiences a high volume of traffic or where the repair has

5 Design of Field Repair
46
a longer design life, fatigue strength of the repair is the controlling factor. Fatigue
capacity calculations for shear studs are shown in Appendix F.
Capacity Design
Capacity design may be used to design the UHPC repair to restore the original
as-built bearing and shear capacity of the girder end. For this type of capacity based
design, the bearing and shear capacity of a new, uncorroded girder end must be
determined. The compressive bearing strength of a girder end may be determined by
the cross section of the web and bearing stiffeners at the girder end, as they create an
effective column section which carries bearing loads to the bearing and substructure.
The shear capacity of the girder may be determined by the effective web area and the
end panel shear strength. Capacity design is the most conservative design method.
This method restores the capacity of the corroded girder end to the original capacity of
an uncorroded girder. This design would have the largest number of studs and may lead
to constructability issues for tight spaces. Shear and bearing capacity calculations for
girder ends are shown in Appendix F.
5.3 DESIGN OF GIRDER END UHPC REPAIR
The design for each girder is based on the number of shear studs needed to provide
sufficient capacity. There is no requirement for the pattern or placement of shear studs
on the web of the girders. The only requirement is that the studs be welded to the
uncorroded portions of the web. The studs should not be spaced closer than 3db, where
db is the diameter of the stud shank. This drastically simplifies field application of the
repair because welding contractors do not need to individually measure and mark out
the location of each stud. They only need to verify that the correct numbers of studs are
welded to the web with sufficient spacing. Recommendations may be provided on
placement to avoid back-to-back studs on the web. This would improve the load transfer
path from the web, through the studs, and to the UHPC repair panel. The results of the
push-off tests validate the flexibility of stud spacing and location to generate the desired
stud capacity. Further tests are required to verify this design parameter, but current
results satisfy this design. Figure 5.3 shows the design for the potential shear stud
layout on the web of a corroded girder end. The location and spacing of the studs could
vary for different repairs. Figure 5.4 shows the full height UHPC repair which encases
the bearing stiffeners and the corroded web and flange. Sample Design drawings for the
UHPC repair of Bridge No. 3094 may be found in Appendix G.

5 Design of Field Repair
47
Plan View
Cross Section Elevation View
Figure 5.3: Design of potential shear stud layout for a corroded girder end
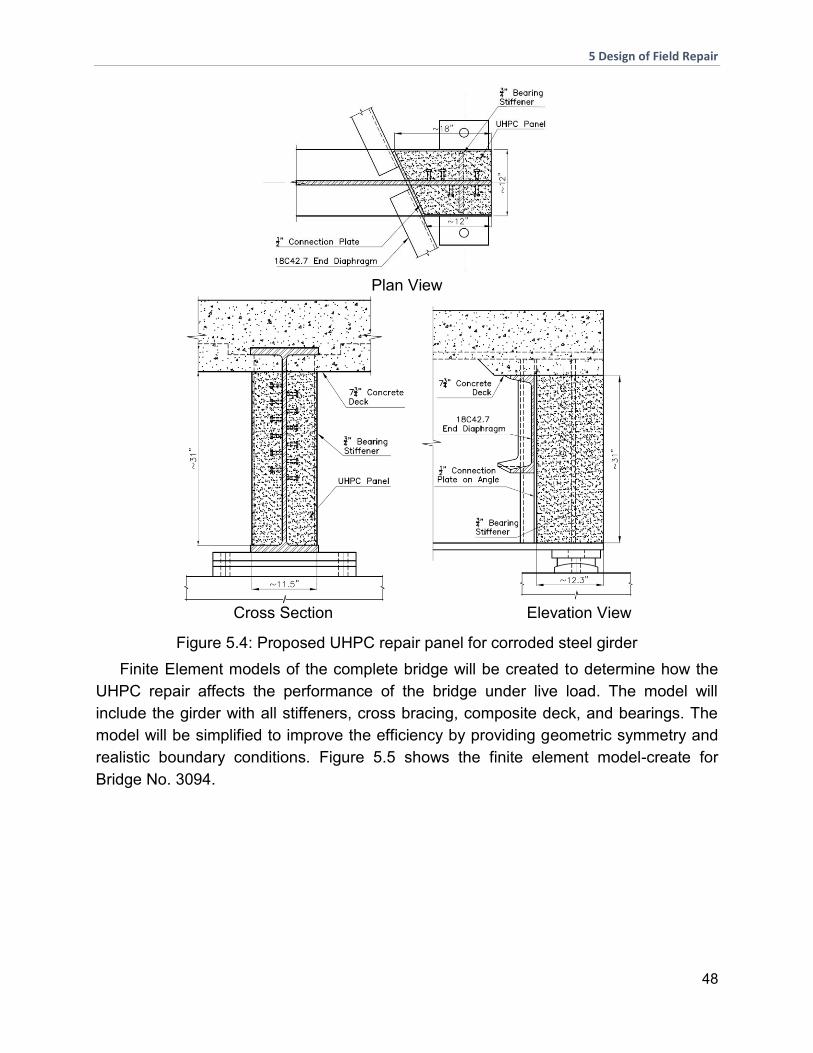
5 Design of Field Repair
48
Plan View
Cross Section Elevation View
Figure 5.4: Proposed UHPC repair panel for corroded steel girder
Finite Element models of the complete bridge will be created to determine how the
UHPC repair affects the performance of the bridge under live load. The model will
include the girder with all stiffeners, cross bracing, composite deck, and bearings. The
model will be simplified to improve the efficiency by providing geometric symmetry and
realistic boundary conditions. Figure 5.5 shows the finite element model-create for
Bridge No. 3094.

5 Design of Field Repair
49
Figure 5.5: Finite Element model of Bridge No. 3094

Reference
50
REFERENCES
AASHTO (2012). AASHTO LRFD Bridge Design Specifiications, American Association of State Highway and Transportation Officials, Washington, DC 20001.
Abbas, S., Nehdi, M. L., and Saleem, M. A. (2016). "Ultra-High Performance Concrete: Mechanical Performance, Durability, Sustainability, and Implementation Challenges." International Journal of Concrete Structures and Materials, 10(3), 271-295.
Ahn, J.-H., Kainuma, S., and Kim, I.-T. (2013). "Shear Failure Behaviors of a Web Panel with Local Corrosion Depending on Web Boundary Conditions." Thin-Walled Structures, 73, 302-317.
Ahn, J.-H., Kainuma, S., Yasuo, F., and Takehiro, I. (2013). "Repair Method and Residual Bearing Strength Evaluation of a Locally Corroded Plate Girder at Support." Engineering Failure Analysis, 33, 398-418.
AI-Engineers (2016). "Routine and Special Inspection: Bridge No. 03094." Connecticut Department of Transportation, New Haven, CT. January 26, 2016.
AISC (2011). "Steel Construction Manual." American Institute of Steel Construction. Fourteenth Edition.
Albrecht, P., and Hall Jr, T. T. (2003). "Atmospheric Corrosion Resistance of Structural Steels." Journal of Materials in Civil Engineering, 15, 2-24.
ASCE (2014). "2013 Report Card for America's Infrastructure." American Society of Civil Engineers.
ASM-International (2000). "Introduction and Overview of Electrochemical Corrosion." Fundamentals of Electrochemical Corrosion.
Brockenbrough, R. (2002). "AISC Rehabilitation and Retrofit Guide." American Institute of Steel Construction, Pittsburgh, PA.
Chang, L. M., and Lee, Y.-J. (2001). "Evaluation and Policy for Bridge Deck Expansion Joints." Indiana Department of Transportation and Federal Highway Administration. Purdue University. SPR-2198.
Classen, M., Gallwoszus, J., and Stark, A. (2016). "Anchorage of Composite Dowels in UHPC Under Fatigue Loading." Structural Concrete, 17(2), 183-193.
Close, J., and Miller, P.C. (2011). "Preliminary Design Report - Putnam Bridge, Bridge NO. 00417."Connecticut Department of Transportation. Glastonbury and Wethersfield. Project No. 53-175.
CME (2015). "Rehabilitation Study Report: Bridge No. 03094 in New Haven." Connecticut Department of Transportation. CME Associates, State Project No. 92-675. New Haven, CT.
Elnashai, A. S., Takanashi, K., Elghazouli, A. Y., and Dowling, P. J. (1991). "Experimental Behaviour of Partially Encased Composite Beam-Columns Under Cyclic and Dynamic." Proceedings Institute of Civil Engineers, 2(91), 259-272.
Esmaili Zaghi, A., Wille, K., Zmetra, K., and McMullen, K. (2015). "Repair of Steel Beam/Girder Ends with Ultra High Strength Concrete (Phase I)." Connecticut Department of Transportation. University of Connecticut. SPR-2282(Report #CT-2282-F-15-2).
Eurocode-4 (2004). "Design of Composite Steel and Concrete Structures." European Committee for Standardization., Brussels, Belgium.
Feldmann, M., Hechler, O., and Hegger, J. (2011). "Fatigue Behavior of Shear Connectors in High Performance Concrete." Composite Construction in Steel and Concrete VI, 310-321.
FHWA (2014). "Bridges By Structure Type." <http://www.fhwa.dot.gov/bridge/struct.cfm>. FLDOT (2011). "Bridge Maintenance and Repair Handbook." Steel Beam & Girder Repair,
Florida Department of Transportation. 4.6, 78-83.

Reference
51
Graybeal, B. (2014). "Design and Construction of Field-Cast UHPC Connections." Federal Highway Administration. FHWA-HRT-14-084.
Grünberg, J., Lohaus, L., Ertel, C. W., and Wefer, M. "M.: Multi-Axial and Fatigue Behaviour of ultra–high–performance concrete (UHPC)." Proc., Proceedings of the 2nd International Symposium on Ultra-High Performance Concrete.
He, J., Liu, Y., Chen, A., and Yoda, T. (2012a). "Shear behavior of partially encased composite I-girder with corrugated steel web: Experimental study." Journal of Constructional Steel Research, 77, 193-209.
He, J., Liu, Y., Lin, Z., Chen, A., and Yoda, T. (2012b). "Shear behavior of partially encased composite I-girder with corrugated steel web: Numerical study." Journal of Constructional Steel Research, 79, 166-182.
Hegger, J., Sedlacek, G., Döinghaus, P., Trumpf, H., and Eligehausen, R. "Studies on the ductility of shear connectors when using high-strength steel and high-strength concrete." Proc., International Symposium on Connections between Steel and Concrete, University of Stuttgart, 1025-1045.
Hyashi, K., Ono, S., and Nakamura, S. (2003). "Experimental Studies on Retrofit by Partially Encased Concrete to the Steel I-Girder Subjected to Buckling Deformation." Technical Memorandum of Public Works Research Institute(3920), 229-236.
Kayser, J. R., and Nowak, A. S. (1989). "Capacity Loss Due to Corrosion in Steel-Girder Bridges." Journal of Structural Engineering, 115(6), 1525-1537.
Khurram, N., Sasaki, E., Katsuchi, H., and Yamada, H. (2014b). "Experimental and Numerical Evaluation of Bearing Capacity of Steel Plate Girder Affected by End Panel Corrosion." International Journal of Steel Structures, 14(3), 659-676.
Khurram, N., Sasaki, E., Kihira, H., Katsuchi, H., and Yamada, H. (2014a). "Analytical Demonstrations to Assess Residual Bearing Capacities of Steel Plate Girder Ends with Stiffeners Damaged by Corrosion." Structure and Infrastructure Engineering, 10, 69-79.
Kim, J. S., Kawark, J., Joh, C., Yoo, W., and Lee, K. (2015). "Headed stud shear connector for thin ultra-high performance concrete bridge deck." Journal of Constructional Steel Research.
Koch, G. H., Brongers, M. P., Thompson, N. G., Virmani, Y. P., and Payer, J. H. (2002). "Corrosion Cost and Preventive Strategies in the United States." Federal Highway Association & CC Technologies Laboratories, Inc. NACE International. FHWA-RD-01-156.
Lam, D., and El-Lobody, E. (2005). "Behavior of Headed Stud Shear Connectors in Composite Beam." Journal of Structural Engineering. ASCE.
Li, A., and Kristen, C. (1996). "Push-out tests on studs in high strength and normal strength concrete." Journal of Constructional Steel Research.
Liu, C., Miyashita, T., and Nagai, M. (2011). "Analytical Study on Shear Capacity of Steel I-Girders with Local Corrosion Nearby Supports." Procedia Engineering, 14, 2276-2284.
Miyashita, T., Wakabayashi, D., Hidekuma, Y., Kobayashi, A., Okuyama, Y., Koide, N., Horimoto, W., and Nagai, M. "CFRP Repair Method for Corroded Steel Girder Ends." Proc., IABSE Symposium Report, International Association for Bridge and Structural Engineering, 1-7.
Miyashita, T., Wakabayashi, D., Hidekuma, Y., Kobayashi, A., Okuyama, Y., Koide, N., Horimoto, W., and Nagai, M. "Repair Method for Corroded Steel Girder Ends using CFRP Sheet." Proc., IABSE-JSCE Conference on Advances in Bridge Engineering, International Association for Bridge and Structural Engineering, 1-7.
Nakamura, S., Momiyama, Y., Hosaka, T., and Homma, K. (2002). "New Technologies of Steel/Concrete Composite Bridges." Journal of Construction Steel Research, 58, 99-130.
Nakamura, S., and Narita, N. (2003). "Bending and Shear Strength of Partially Encased Composite I-Girders." Journal of Constructional Steel Research, 59, 1435-1453.
Reference
52
Ogami, H., Fujii, K., Yamada, T., and Iwashaki, H. (2015). "Renovation of Corroded Girder End in Plate Girder Bridge with Resin and Rebars." Implementing Innovative Ideas in Structural Engineering and Project Management, ISEC Press, 1-6.
Revie, R. W., and Uglig, H. H. (2008). "Corrosion and Corrosion Control: An Introduction to Corrosion Science and Engineering." Wiley Interscience.
Rossow, M. (2003 ). "FHWA Bridge Maintenance: Superstructure." Continuing Education and Development, Inc., Federal Highway Association.
Russell, H., and Graybeal, B. (2013). "Ultra-High Performance Concrete: A State-of-the-Art Report for the Bridge Community." Federal Highway Administration, McLean, VA. FHWA-HRT-13-060.
Shaheen, E., and Shrive, N. (2008). "Cyclic Loading and Fracture Mechanics of Ductal Concrete." Springer Science & Business Media.
Shi, X., Fay, L., Yang, Z., Nguyen, T. A., and Liu, Y. (2009). "Corrosion of Deicers to Metals in Transportation Infrastructure: Introduction and Recent Developments." Corrosion reviews, 27(1-2), 23-52.
Usukura, M., Yamaguchi, T., Suzuki, Y., and Mitsugi, Y. "Strength Evaluation for a Corroded Damaged Steel Girder End Considering its Collapse Mechanism." Proc., Proceedings of the Thirteenth East Asia-Pacific Conference on Structural Engineering and Construction (EASEC-13).
Van de Lindt, J., and Pei, S. (2006). "Buckling Reliability of Deteriorating Steel Beam Ends." Electronic Journal of Structural Engineering(6), 1-7.
Wipf, T. J., Fanous, F. S., Klaiber, F. W., and Eapen, A. S. (2003). "Evaluation of Appropriate Maintenance, Repair, and Rehabilitation Methods for Iowa Bridges." Iowa Department of Transportation. Iowa State University. Project TR-429.
WisDOT (2015). "Bridge Manual: Ch. 40 - Bridge Rehabilitation." Superstructure Inspection, Wisconsin Department of Transportation. 40.14, 24-26.
Yamaguchi, E., and Akagi, T. "Degradation of Load-Carrying Capacity of Steel I-Girder End due to Corrosion." Proc., Proceedings of the Thirteenth East Asia-Pacific Conference on Structural Engineering and Construction (EASEC-13).
Yaun, J., and Graybeal, B. (2014). "Bond Behavior of Reinforcing Steel in Ultra-High Performance Concrete." Federal Highway Administration. FHWA-HRT-14-090.
Zmetra, K. (2015). "Repair of Corrosion Damaged Steel Bridge Girder Ends By Encasement in Ultra-High Performance Concrete." Ph.D., University of Connecticut Storrs, CT.
Zmetra, K., Zaghi, A., and Wille, K. (2015). "Rehabilitation of Steel Bridge Girders with Corroded Ends Using Ultra-High Performance Concrete." Structures Congress 2015, 1411-1422.

Appendix A
53
APPENDIX A Experimental Push-Off Data
A1 GRAPH TERMINOLOGY
Front Side
Back Side
A2 S1-8-2-NS-1/2 – BENCHMARK SPECIMEN
Bottom Web Strain (Horiz. +
Vert.) S1
S2
S3
S4
Top Web Strain
(Horiz. + Vert.)
S5
S6

Appendix A
54

Appendix A
55
A3 S2-4-2.5-NS-5/8 – 5/8” STUDS

Appendix A
56

Appendix A
57
A4 S3-8-2-VHS-1/2 – VERTICAL AND HORIZONTAL STAGGER

Appendix A
58

Appendix A
59
A5 S4-8-1.5-NS-1/2 – 3DB STUD SPACING

Appendix A
60

Appendix A
61
A6 S5-8-2-VS-1/2 – VERTICAL STAGGER

Appendix A
62

Appendix A
63
A7 S6-8-2-NS-1/2 – REGULAR STRENGTH CONCRETE

Appendix A
64

Appendix A
65
A8 S7-8-2-NS-1/2 – REDUCED COVER (1/4”)
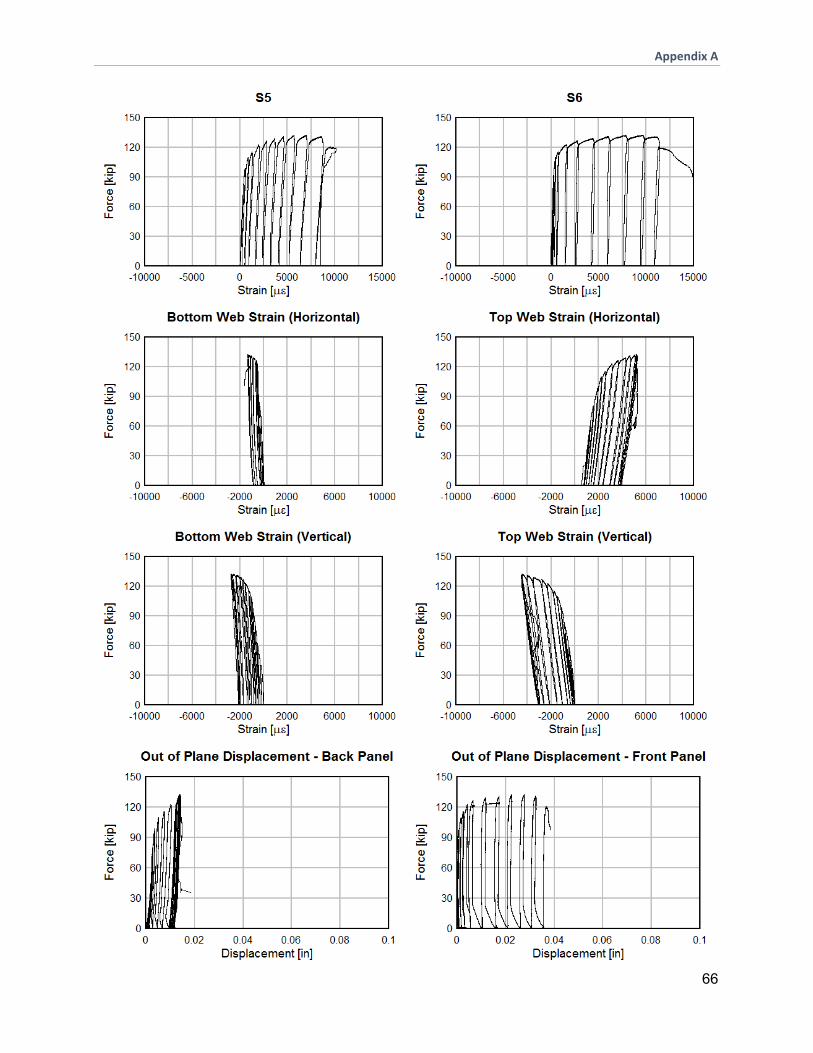
Appendix A
66

Appendix A
67
A9 S8-8-2-NS-1/2 – F’C = 28-KSI

Appendix A
68

Appendix B
69
Appendix B Shop Drawings of Push-off Specimens

2.00
2.00
2.00
2.00
4.00
9
1
8
9
1
8
12.00
18
1
4
Existing W18x55
Ø
1
2
" headed shear stud
(2 inches long)
C
L
University of ConnecticutConnecticut Dept. of Transportation
Project: Girder-End Repair
Title: Push Out Specimen - Benchmark
Drawn by: Dominic Kruszewski Approved by:
Scale: As noted Sheet Number: S1 Date: 04/20/2016
Notes
1. All units in inches.
2. All welding to be performed in
accordance with AWS standards.
3. Stud location tolerance:
1
32
"
4. Number of specimens: 2
S1-1: Benchmark - 4db
Scale - 1:4

2.50
3.75
5.75
9
1
8
9
1
8
12.00
18
1
4
Existing W18x55
Ø
5
8
" headed shear stud
(2 inches long)
C
L
University of ConnecticutConnecticut Dept. of Transportation
Project: Girder-End Repair
Title: Push Out Specimen -
5
8
" Studs
Drawn by: Dominic Kruszewski Approved by:
Scale: As noted Sheet Number: S3 Date: 04/20/2016
Notes
1. All units in inches.
2. All welding to be performed in
accordance with AWS standards.
3. Stud location tolerance:
1
32
"
4. Number of specimens: 1
S3-1: No Stagger Pattern - 5/8" studs
Scale - 1:4

1.00
3.50
5.50
8
5
8
8
5
8
12.00
18
1
4
Existing W18x55
C
L
Ø
1
2
" headed stud spaced 1" C-C
(2 inches long) - back face
Ø
1
2
" headed stud spaced 1" C-C
(2 inches long) - front face
1.00
1.00
1
2
"
1
2
"
1.00
University of ConnecticutConnecticut Dept. of Transportation
Project: Girder-End Repair
Title: Push Out Specimen - V+H Stagger
Drawn by: Dominic Kruszewski Approved by:
Scale: As noted Sheet Number: S4 Date: 04/20/2016
Notes
1. All units in inches.
2. All welding to be performed in
accordance with AWS standards.
3. Stud location tolerance:
1
32
"
4. Number of specimens: 1
S4-1: Horizontal and Vertical Stagger Pattern
Scale - 1:4

1.50
1.50
1.50
2.75
4.75
9
1
8
9
1
8
12.00
18
1
4
Existing W18x55
Ø
1
2
" headed shear stud
(2 inches long)
C
L
University of ConnecticutConnecticut Dept. of Transportation
Project: Girder-End Repair
Title: Push Out Specimen - 3db Stud Spacing
Drawn by: Dominic Kruszewski Approved by:
Scale: As noted Sheet Number: S2 Date: 04/20/2016
Notes
1. All units in inches.
2. All welding to be performed in
accordance with AWS standards.
3. Stud location tolerance:
1
32
"
4. Number of specimens: 1
S2-1: 3db Stud Spacing
Scale - 1:4

1.00
1.00
1.00
4.00
9
1
8
9
1
8
12.00
18
1
4
Existing W18x55
Ø
1
2
" headed stud spaced 2" C-C
(2 inches long) - front face
C
L
Ø
1
2
" headed stud spaced 2" C-C
(2 inches long) - back face
2.00
typ.
University of ConnecticutConnecticut Dept. of Transportation
Project: Girder-End Repair
Title: Push Out Specimen - Vertical Stagger
Drawn by: Dominic Kruszewski Approved by:
Scale: As noted Sheet Number: S5 Date: 04/20/2016
Notes
1. All units in inches.
2. All welding to be performed in
accordance with AWS standards.
3. Stud location tolerance:
1
32
"
4. Number of specimens: 1
S5-1: Vertical Stagger Pattern
Scale - 1:4

2.00
2.00
2.00
2.00
4.00
9
1
8
9
1
8
12.00
18
1
4
Existing W18x55
Ø
1
2
" headed shear stud
(2 inches long)
C
L
University of ConnecticutConnecticut Dept. of Transportation
Project: Girder-End Repair
Title: Push Out Specimen - Benchmark - RSC Sample
Drawn by: Dominic Kruszewski Approved by:
Scale: As noted Sheet Number: S6 Date: 04/20/2016
Notes
1. All units in inches.
2. All welding to be performed in
accordance with AWS standards.
3. Stud location tolerance:
1
32
"
4. Number of specimens: 2
S6-1: Benchmark - RSC Sample
Scale - 1:4

2.00
2.00
2.00
2.00
4.00
10
9
16
12.00
21
1
8
Existing beam
Ø
1
2
" headed stud welded on
both sides of web
(2 inches long)
C
L
10
9
16
University of ConnecticutConnecticut Dept. of Transportation
Project: Girder-End Repair
Title: Push Out Specimen - Reduced Cover
Drawn by: Dominic Kruszewski Approved by:
Scale: As noted Sheet Number: S7 Date: 04/20/2016
Notes
1. All units in inches.
2. All welding to be performed in
accordance with AWS standards.
3. Stud location tolerance:
1
32
"
4. Number of specimens: 1
S7-1: Reduced Cover Specimen
Scale - 1:4

2.00
2.00
2.00
2.00
4.00
9
1
8
9
1
8
12.00
18
1
4
Existing W18x55
Ø
1
2
" headed shear stud
(2 inches long)
C
L
University of ConnecticutConnecticut Dept. of Transportation
Project: Girder-End Repair
Title: Push Out Specimen - Ultimate Strength Specimen
Drawn by: Dominic Kruszewski Approved by:
Scale: As noted Sheet Number: S8 Date: 04/20/2016
Notes
1. All units in inches.
2. All welding to be performed in
accordance with AWS standards.
3. Stud location tolerance:
1
32
"
4. Number of specimens: 1
S8-1: Ultimate Strength Specimen
Scale - 1:4

Appendix C
78
Appendix C Experimental Plate Girder Specimen Shop Drawings
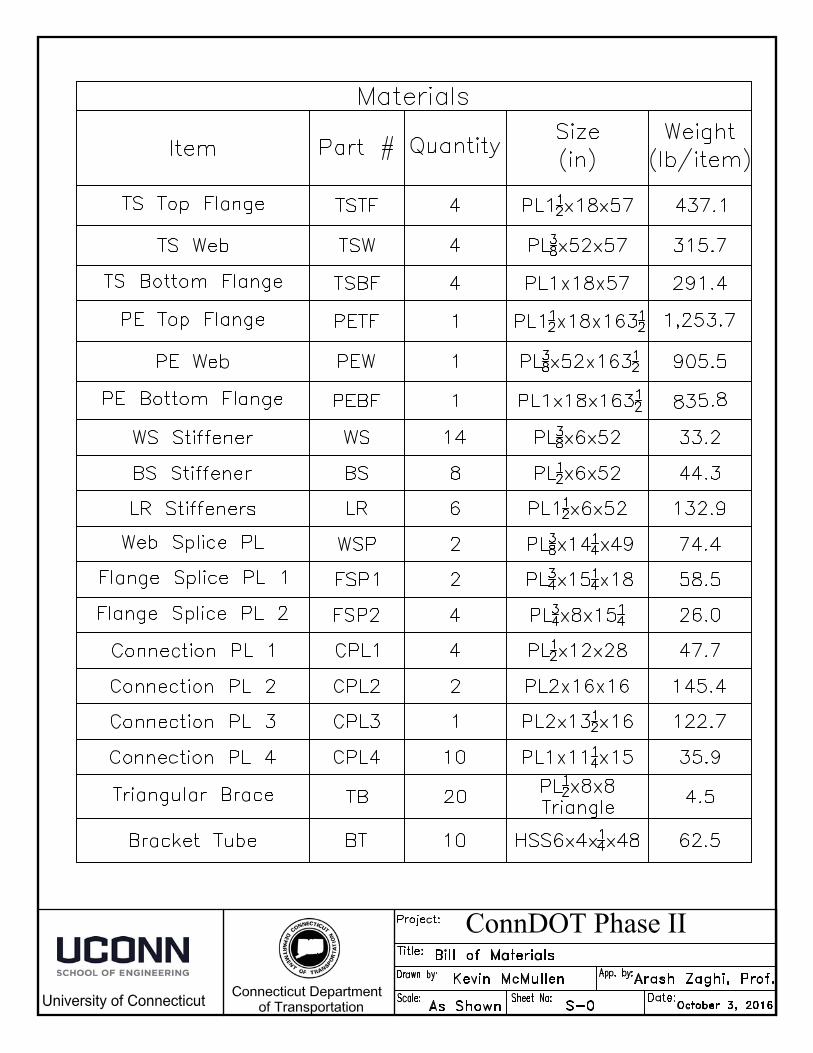


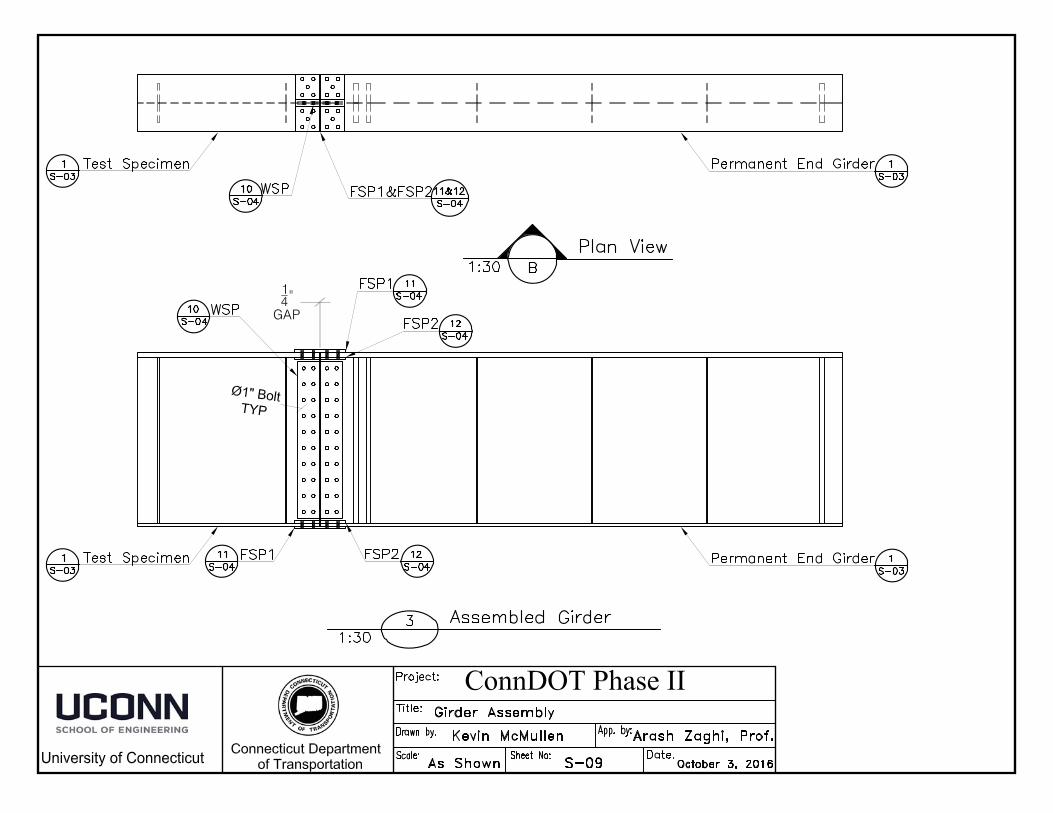

Appendix D
88
Appendix D Drawings of the Experimental Test Setup


Appendix E
90
Appendix E Experimental Load Frame Shop Drawings


Appendix F
96
Appendix F UHPC Repair Sample Calculations

Design Methods for Shear Stud Capacity for UHPC Repair1. Strength Design 2. Fatigue DesignCalculations for Studs Based on HL‐93 Loading and Strength 1 Calculations for Studs Based on Fatigue Calculations
Shear (kips)
Number of 1/2" Studs
Fatigue Resistance (kips)
Number of 1/2" Studs
116 9 HL‐93*1.751 Wheel Load 31.50 23301 22 2 Fatigue Truck 41.16 30
1Assume that Studs only carry Live Load
Calculation for Studs Based on As‐Built StrengthBeams With Bearing Stiffeners
ShapeWeb
Thickness (in)
Web Depth (in)
Total Depth of Beam (in)
Flange Thickness
(in)
Design Based on Bearing
Capacity (kips)
Design Based on Shear
Capacity (kips)
Design based on Controlling
Capacity (kips)
Strength Based on Bearing of Stud on
Web (kips)
1/2" Stud Capacity (kips)
Controlling Stud Capacity
(kips)
Number of 1/2" Studs
36WF135 0.600 34.02 35.60 0.790 500 426 426 41.76 15.80 13.43 3236WF160 0.653 33.96 36.00 1.020 532 463 463 45.45 15.80 13.43 3436WF182 0.726 33.96 36.32 0.725 579 515 515 50.53 15.80 13.43 3836WF245 0.815 33.36 36.06 0.802 640 568 568 56.72 15.80 13.43 4236WF230 0.765 33.36 35.88 0.765 605 533 533 53.24 15.80 13.43 4036WF194 0.770 33.96 36.48 0.770 608 546 546 53.59 15.80 13.43 4136WF170 0.680 33.96 36.16 0.680 549 482 482 47.33 15.80 13.43 3636WF150 0.625 33.96 35.84 0.625 516 443 443 43.50 15.80 13.43 3333WF141 0.625 31.39 33.31 0.960 516 410 410 43.50 15.80 13.43 31
Beams Without Bearing Stiffeners
ShapeWeb
Thickness (in)
Web Depth (in)
Total Depth of Beam (in)
Flange Thickness
(in)
Design Based on Bearing
Capacity (kips)
Design Based on Shear
Capacity (kips)
Design based on Controlling
Capacity (kips)
Strength Based on Bearing of Stud on
Web (kips)
1/2" Stud Capacity (kips)
Controlling Stud Capacity
(kips)
Number of 1/2" Studs
36WF135 0.600 34.02 35.60 0.790 225 426 225 41.76 15.80 13.43 1733WF130 0.580 31.34 33.31 0.855 209 380 209 40.37 15.80 13.43 16* Sample calculations for design demands are presented in the following pages
2Assume studs are designed to carry Strength 1
Final Stud Design
3. Capacity Design
Geometric Properties
Design Demand
Design Demand Final Stud Design
Live Load OnlyStrength 1
Geometric Properties
*Controlling Number ofStuds*

Sample Calculation for Bearing Strength and Shear Capacity of As‐Built 36WF135
Geometric PropertiesWeb Thickness, tw 0.6 inWeb Depth, D D 34.02 inTotal Depth of Beam, d d 35.6 inFlange Thickness, t f tf 0.79 inBearing Stiffener Thickness, t bs tbs 0.75 inWidth of Bearing Stiffener, b bs
bbs 5 inlfree 5.44 in
Nine x Flange Thickness 9tw 5.4 inYield Strength of Stiffeners and Web Fy 36 ksiModulus of Elasticity E 29000 ksi
Girders With Bearing StiffenerAxial Resistance of Bearing Stiffener (6.10.11.2.4a,b, 6.9.4.1.1‐1)
Area of effective column section if 9tw is used 13.98 in2
Area of effective column section if distance to free end is less than 9tw
14.00 in2
Moment of Inertia of Effective Column Section, I
74.44 in4
Radius of Gyration, r s 2.31 in
Slenderness, λ 0.015
1/λ 65.03
Bearing Force to be recoveredP n 500 kipΦ P n 450 kip
Shear Capacity of Girder (6.10.9.2‐2, 6.10.9.3.2‐4)
h/tw 56.7Shear StrengthIf h/tw < 1.10(kvE/Fy).5 426 kip
Nominal Shear Strength 426 kip
Girders Without Bearing StiffenersWeb Local Yielding (D6.5.2, D6.5.3)
Distance from Outer Face of Flange Resisting Bearing Reaction to the Web Toe of the Fillet, k
1.6875 in
Length of Bearing, N 6 inNominal Resistance to Concentrated Loading, R n
221 kip
ΦR n 221 kip
Web CripplingN/d 0.169If N/d ≤ 0.2Nominal Resistance to Concentrated Loading, R n 225 kipΦR n 180 kip
Length of Web from Edge of Stiffener to Free End
/
.658
2 +9twtw)
2 +twlfree+9twtw
212
.9
.58 w
2.5
0.4 1 3.

Sample Calculations of Fatigue Loads for Wheel Loads and the Fatigue Truck
Allowable Shear Force (6.10.10.2‐1)
1/2" Stud Fatigue Capacity 1.375 kips
With Wheel LoadDynamic Load Allowance, IM 1.75Truck Wheel Load 18 kipsShear Force at the Girder End 31.5 kipsNumber of 1/2" Shear Studs 22.9
With Fatigue Truck (3.6.1.4.1)
Multiple Presence Factor, m 1.2 (3.6.1.1.2)
Shear Force from Influence Line, V 59.7 kipsDynamic Load Allowance, IM 1.15Single Lane Distribution Factor, DF 0.72 (Table 4.6.2.2.3a‐1)
Shear Force at the Girder End 41.2 kipsNumber of 1/2" Shear Studs 29.9
(6.13.2.9)
Zr
Stud Load Carrying Capacity
Strength Based on Bearing of Stud on Web
.75
2.4
5.5 ·

Calculations or Shear Demand at Girder Ends Due to Dead Loads
80 ft490 pcf160 pcf140 pcf
Dead Load Due to Steel 245 lb/ft
6.125 ft3
22601 lb2260 lb24861 lb
DL Due to Parapet9.725 ft2
248960 lb10
24896 lb
ftinlb
ftinlb
lblb
kips
kips
Factored Shear Demand at Girder End for Strength 1 Load Combination (Table 3.4.1‐1)
HL‐93 LL 94 116 165 203 70 104 122 183 kipsDC 63 63 79 79 56 56 70 70 kipsDW 13 13 19 19 10 10 15 15 kipsTotal Shear Demand at Girder End 263 301 207 268
Controlling Shear Demand Interior Beams 301 kipsExterior Beams 268 kips
Exterior Beam
1.5
Exterior Beam Shear Demand
Loading Component 1 Lane Loaded
2+ Lanes Loaded
1 Lane Loaded
2+ Lanes Loaded
1 Lane Loaded
2+ Lanes Loaded
1 Lane Loaded
2+ Lanes Loaded
Unfactored Factored
1.751.25
FactoredUnfactoredInterior Beam Shear Demand
7.258
61867
7.253
20300
20300111624
55.81
10.15
Exterior Beam
Exterior Beam
Exterior Beam
25200
Interior Beam
Interior Beam
Interior Beam
25200
98
76800
93
Span LengthUnit Weight of Steel Unit Weight of ConcreteUnit Weight of Wearing Surface
Weight of 36WFx245 GirderVolume of 14"x1"x63' Cover PlateTotal Weight of Girder+10% for diahragmsTotal Weight of Steel
Cross Sectional Area of ParapetTotal Weight of ParapetsTotal Number of Girders in SpanWeight of Parapet/Girder
Tributary Width of DeckDepth of Deck
Dead Load Due to Deck
Total Weight of Deck
Dead Load Due to Wearing Surface
Tributary Width of Wearing SurfaceDepth of Wearing SurfaceTotal Weight of Wearing Surface
Strength 1 Load Combination
Factor
Total Dead Load of Wearing Surface (DW)Total Dead Load (DC)
Shear at Girder End Due to Dead LoadShear at Girder End Due to Wearing Surface
Shear Demand
126557
63.28
12.6
Interior Beam

Calculation for Shear Demand at Girder End Due to HL‐93 Loading
Geometric Properties9 ft80 ft8 in
110.2 kips
8361.2
14812 in4
67.73 in2
21.94 in
0.737
3 ft
Lateral Distribution Factors
Interior Beam
One Design Lane Loaded 0.72
Two or More Design Lanes Loaded 0.884
Exterior Beam
One Design Lane Loaded 0.53
Two or More Design Lanes Loaded 0.795
Skew Correction 1.191
Shear DemandExterior Beam
Single Lane Loaded 70.0 kipsTwo or More Lanes Loaded 104.4 kips
Interior Beam
Moment of Interia of Beam (36WF230), I
Mutipresence Factor (Lever Rule Only)Skew Angle, θn
Max Shear for Simple Span, One Lane, with IM
Slab Depth, t sSpan Length, L
Distance from CL of Exterior Web of Exterior Beam to Interior Edge of Curb, d e
Tangent (θ )
Cross Sectional Area of Beam, ADistance Between the Centers of Gravity of the Beam and deck, e g
Beam Spacing, S
116.0
Lever Rule
(Table 4.6.2.2.3c‐1)
(Table 4.6.2.2.3b‐1)
(Table 4.6.2.2.3a‐1)
94.5
0.3625.0
.212 35
.610
1.0 .2 )tanθ
Kg=

Appendix G
102
Appendix G UHPC Repair Sample Drawings

7

8

9

10
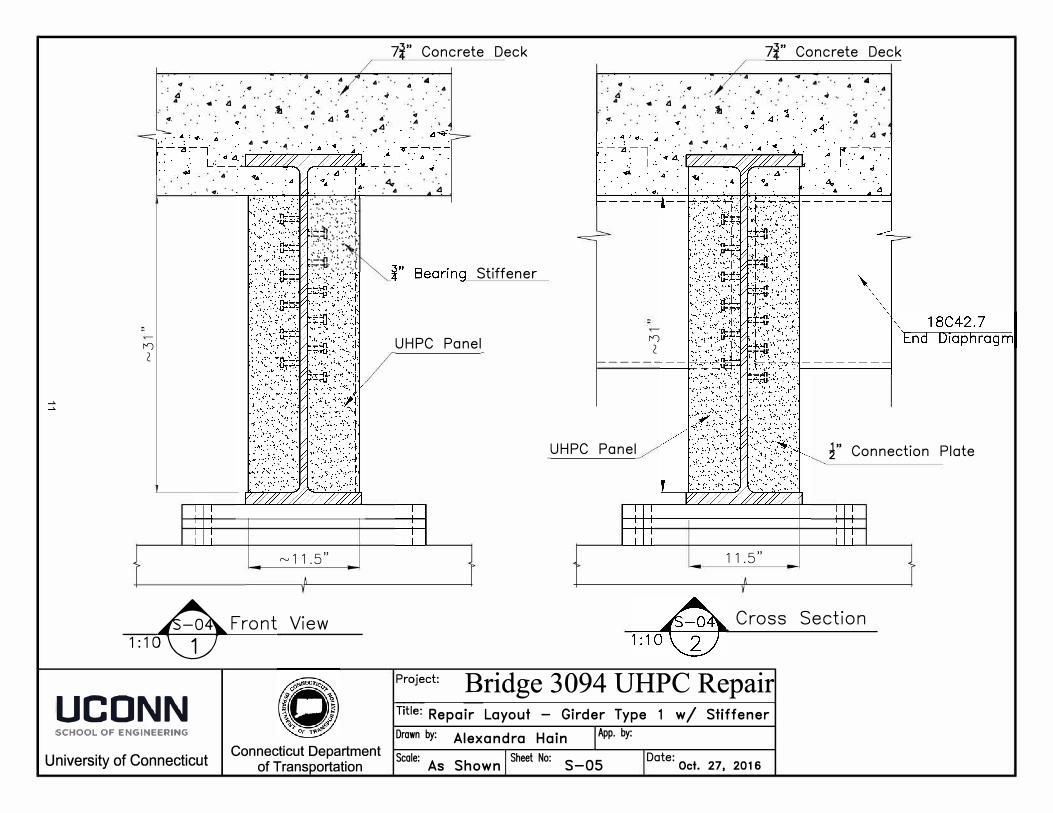
7 ,,
Concrete Deck 7 " Concrete Deck
<I
. . 4 ..
:"·
4 .. .ti
....
.. .., . -�.
<I
.. ... .. 4 <I
:.i: .. ...
4· <I .
. 4.,
·4 ... 4
.. 4 .. .;,
·A :"·
. 4
ti
.., . -� . . ·
. 4 ..,
. . .,;
·4 4
4
;, •A
4 <I
. � ""· : .. 4
n
2
{r.�·x:\.:I '.$t;<;::-.::·,t ti).j..i
,....,11.s"
�Front View 1: 10 1
1UCDNN SCHOOL OF ENGINEERING
University of Connecticut Connecticut Department
of Trans ortation
Stiffener
UHPC Panel
UHPC Panel
n
2
11 .5"
f' Connection Plate
Cross Section
::��ct , �ridge 3094 UHPC RepairRepair Layout - Girder Type 1 w/ St'ff
Drawn by· I ener
· Alexandra Hain App. by:
Scale: As Shown
Sheet No: S-05
Date: Oct. 27, 2016
11

12

13

14

15

7x" Concrete Deck
/ ..,.!(/ .. ••
• ••• •
• • .,• •
• ,4 .
""
4 .· •.. •. �- "' 4 • .
4
. •·. :d •
. ..; : . . .,.· .
..•. .. ·. . 4 ·.·
. . .•
.. ., ·.d· . .
. .• .
', • � . �
�· · .. ·. : • ;' �i�--��i'�n-}:c�i_;; .a .. . ·. ·I I . ll • ·
. .. .,'
. .- • 4
.
t I • 4• · . . .
lI I
I I I
I I II I
(',.Jg"
�Left Side View 1:10�
University of Connecticut Connecticut Department
of Transportation
n 2
Project:
n 2
7x" Concrete Deck
.: �- • 4 .
. "'.
. ·: .,; 4
" •. ,.' • .d I ' ' '• ',flf
•, 4 • .,
• • . • • .,, • • "" •. I', •
••
: 4 •. . . A • • � : • .
: .· ·�.�: �· �.. . . .
. .. "' . . .. 4 .
• 4
. ·. .
""
-'
��·�-�--�-�0�=:��rt�:�=�:-·���·�--��- ': .•."'··4 ...
�� · ·. • · · ,4 .. ·r1 · -� ·. · ... · ·•
··� ·.;,·.
• • I , , , ,· 4
L ; ; J I ! ! I
,....., 12"
�Right Side View1:10 3
Bridge 3094 UHPC Repair Title: Stud Layout - Girder Type 1 w / o StiffenerDrawn by: Alexandra Hain lApp. by: Scale: As Shown I Sheet No: S-10 1Date: Oct. 27, 2016
16


