
0
REPORT ON POLICY AND LEGISLATIVE FRAMEWORK
Feasibility Study on Pasture Use Fee
CENTRE FOR POLICY RESEARCH
2nd floor, Inter-office building, Prime Minister Amar street 4, Sukhbaatar district 8, Ulaanbaatar 14200, Phone: (+976) 70117044 Fax: (+976 ) 70119419, e-mail: [email protected] Web: www.cpr.mn
January 2018
Ulaanbaatar

1
TABLE OF CONTENT
1. Introduction 2
2. Review of laws and regulations related to rangeland management and the
collection of natural resources fee 6
3. Proposal for implementation mechanisms of the grazing fee system at local level,
including capacity development activities & a rational way to redistribute or spend the revenue from grazing fees, options to earmark the revenue for biodiversity conservation purposes 12
4. Estimating the potential revenue from grazing fees for the period of 2018-2022 20
5. Draft the necessary amendments to legislation that would be required to
successfully re-legalize grazing fees 22
6. Policy advocacy strategy to introduce grazing fee 24 Appendix 1 Grazing fee estimates by ecological zones, aimags and soums, 2016 livestock number and price, 2010-2014 grass yield 28 Appendix 2 Records of consultation workshops 48
2
Introduction
The 1997 Law on Land User Payment was the first step in introducing the land use payment system in
Mongolia. To enforce the law, the Government has issued the resolution #152 “Measures to enforce
the Law on Land Use Payment” in 1997, which split the country into 4 regions in terms of land
valuation: Khangai-Khentii mountainous, Altai Mountain, Gobi mountainous and Steppe, and
established base values of land and land use payments. To implement the Land Payment Law, the
Government Resolution No 152 was issued in 1997, which has set minimum payments for the use of
pastures as a percentage from the base values of pastures as follows (MNT):
Khangai-Khentii mountainous- 767.5
Altai Mountain- 466.7
Gobi- 458.9
Steppe- 572.6
The resolution has divided 4 regions further into 22 land evaluation sub-regions with minimum
payments for the use of pastures.
In 2017, the Agency for Land Relations, Geodesy and Cartography (ALRGC) has updated the base value
as well as land use payments for pastures and increased land evaluation sub-regions from 22 to 31.
The base value of pastureland land was estimated using a survey carried out in 2014 in one soum only,
Mandal soum of the Selenge aimag, which can hardly represent the extensive livestock herding in
Mongolia- the most common type of pastureland use. In addition, the survey used cash income of
herders which cannot express the pastureland potential and not acceptable for land evaluation
purposes. The updated proposal was rejected by the Ministry of Food, Agriculture and Light Industry
as not being sufficient to consider the current conditions and policy priorities of the ministry in the
area of pastureland use and livestock development.
The Law on Land Use Payment, the Government resolution #152 and the latest attempts by ALRGC
are focused on estimating monetary values of the pastures based on land productivity and collecting
land use payments from soums as a budget revenue without much considerations of using land use
payments as a tool or incentive mechanism to encourage sustainable use resources at micro or land
users level within a soum. Particularly, they have the following shortcomings:
1. Fail to consider the degree of overgrazing by pastureland users, thus cannot serve as
mechanism to prevent this serious misbehavior by users
2. Fail to differentiate between good and bad pastureland users within land evaluation sub-
regions which flat fees are imposed on
3. Fail to make sure that grazing fee revenues are used back as an incentive mechanism to
address the key problem in the pastureland management area-the herders’ livestock number
maximization behavior
Therefore, the current methodology was developed to meet the existing demand for introducing
grazing fees as a mechanism to promote sustainable use of pastureland as well as local biodiversity
protection in general and to address the shortcomings of the previous efforts in particular. The new
methodology was proposed as:

3
1. Incentive to reconcile animal numbers with pasture carrying capacity
2. Incentive to increase animal sales by improving its quality
3. Mechanism to form an independent funding source to plan & implement pastureland,
livestock risk and environmental management in herders’ participation
4. Based on the tested best practices and lessons learnt in relation to the feasibility of a
grazing fee system and herders willingness to pay
The proposed methodology incentivizes herders towards reconciling animal numbers with pasture
carrying capacity through 2 mechanisms:
1. Overgrazing rate is considered in estimating grazing fees, the higher the overgrazing rate the
higher fee rate and vice versa
2. Making the commitment of herders to reconcile animal numbers with pasture carrying
capacities as a condition for them to access funds established from grazing fee revenues (see
details in section 3.2)
An incentive to increase animal sales by improving its quality is promoted through using a portion
grazing fee revenues as quality premium for each animal meeting quality standards and sold for meat
(see details in section 3.2)
Proposed soum disposal fund and livestock risk management fund will serve as a mechanism to form
an independent funding source to plan & implement pastureland, livestock risk and environmental
management through receiving and financing proposals from herders.
The proposed methodology is based on findings and lessons learnt from pilots and best practices
mostly undertaken and identified by the Center for Policy Research since 2011. They include:
Pilot of a proxy grazing fee system and livestock risk management fund
Munkhkhairkhan soum of Khovd aimag under the WWF project in 2017
8 demo soums of 8 aimags under the SDC’s Green Gold project in 2015
4 soums of Mongolia (Mankhan soum of Khovd aimag representing the high mountain region,
Undur-Ulaan soum of Arkhangai aimag for the forest-steppe region, Tumentsogt soum of
Sukhbaatar aimag for the steppe region, and Khuvsgul soum of Dornogobi aimag for the Gobi
region) under the World Bank’s Sustainable Livelihoods Project, SLP –II in 2011
Pastureland use agreements
2 herder groups in the Munkhkhairkhan soum of Khovd aimag under the WWF assignment
‘Leopard-friendly pastureland management’ in 2017
16 herder groups of 8 demo soums of 8 aimags under the SDC’s Green Gold project in 2015
13 herders partnerships in 3 soums of Dornod and Khentii aimags under the UNDP assignment
“Developing the management structure of Tumen Khan-Shalz local protected area” in 2014-
2015, Mongolia’s network of managed resource protected areas project
384 herder groups of 42 soums from 5 aimags under the Millennium Challenge Corporation’s
Peri-Urban Rangeland Project in 2009-2013
One of the important considerations in developing grazing fee system is the issue of pasture carrying
capacity. At present official estimates of the pasture carrying capacities nationwide are carried out by
4
two major institutions the National Agency of Meteorological and Environmental Monitoring
(NAMEM) under the Ministry of Environment and Tourism Development and the Agency for Land
Relations, Geodesy and Cartography under the Ministry of Construction and Urban Development. The
NAMEM estimates carrying capacities for the winter-spring pastures using grass yield samples of
around 1500 points (one point per bagh) taken in every August annually. However, only 5 points for
grass yield samples is hardly representative of the entire soum territory which averages around
300,000 ha of land mass and covers a wide variety of ecological conditions. Although NAMEM
estimates give a kind of approximation for judging the pasture carrying at the soum level, they are not
sufficient for estimating it at the level pastureland users or herders.
The Agency for Land Relations, Geodesy and Cartography (ALRGC) uses 1:100,000 scale land use and
vegetation maps in estimating pasture carrying capacities. The vegetation maps contain the most
detailed information on vegetation composition, grass yields and feed protein content for each
vegetation type that averages around 3-5 per soum. As the pasture carrying capacities are shown as
a part of the 1:100,000 vegetation maps they provide more representative data of pasture carrying
capacities for every corner of the soum territory and as such can be a basis for decision making at the
level of pastureland users-herders. 1:100,000 vegetation maps have been properly prepared for the
first time under socialism and had to be updated every 5 years. However, since 1990s because funding
shortages updates of these maps have been carried out with less quality control, resulting in the
accuracy of grass yield and vegetation composition boundaries being eroded to some degree. The
last time these maps were updated in 2010.
The key difference between NAMEM and ALRGC methodologies was a way to cut vegetation samples.
NAMEM methodology cut samples at 1 cm from the surface while ALRGC methodology cut them at 3
cm from the surface1. However, ALRGC methodology has been updated since 2016 under the photo-
monitoring method promoted jointly with the SDC’s Green Gold project according to which they
vegetation samples are being cut at the 1 cm from the surface the same as NAMEM methodology.
Thus, two key national institutions use now the same methodology to estimate grass yield. The
rationale for cutting samples at 1 cm height is that animals graze grasses at similar height.
The grass yield is multiplied by pasture areas to estimate the total forage supply and this supply is
compared to the animals’ demand for pasture forages to estimate carrying capacities. The animals’
demand for pasture forages is estimated by multiplying the number of sheep units by the forage
demand for one sheep unit. The forage demand for one sheep unit per year is 470 kg in the regions of
Gobi and Depression of Great Lakes, 560 kg in the High Mountain region, 600 kg in the Forest steppe
region and 620 kg in the Steppe region. The coefficients to convert animal species into sheep units are
5.7 for camel, 6.6 for horse, 6 for local cattle, 0.9 for goat, 1 for local sheep, 8 for pure and cross breeds
of cattle and 1.2 for pure and cross breeds of sheep. The forage demand for sheep unit and coefficients
to convert into sheep units were developed in late 1980s by research institutions of Mongolia and
used for livestock sector and food supply programs2. Since then the substance of these guidelines has
not changed with some minor modifications occurring such as rounding some figures into whole
1 Section 2.2.5 Estimating pasture grass yield, “Temporary rules for undertaking field estimates of the state and
quality of land”, approved by the Head of ALRGC, Order No A/174 dated 28 June 2013 2 Norms and standards used for developing National Food Programme, Ulaanbaatar, 1981, Ministry of
Agriculture

5
numbers like using 6 for camel instead of 5.7. Another issue under debate is the percentage of
converting biomass into animal intakes. Although the international best practices suggest 50% intake,
in Mongolian conditions where overgrazing is severe with animal pressures exceed carrying capacities
2-5 folds in some aimags and soums, the application of 50% intake can be promoted only as a mid-
term goal.
The proposed methodology uses grass yield data from NAMEM, the initial coefficients to convert into
sheep units (5.7 for camel, 6.6 for horse, 6 for cattle, 0.9 for goat, 1 for sheep) and 100% of biomass
to be used by animals as short-term objective and 50-80% intake as mid-term objective. In addition,
the methodology recommends that pasture carrying capacity be estimated for each pastureland user
who will sign the land use agreement with soum Governor. The smallest pastureland user is khot ail
(2-5 households camping together averaging 100-200 khot ails in one soum), therefore, the number
of vegetation samples has to be drastically increased in one soum in order to estimate pasture carrying
capacities at this low levels. The consultation meeting organized at the Ministry of Food, Agriculture
and Light Industry (MOFALI) on 22 January 2018 involving all relevant stakeholders including MOFALI,
NAMEM, ALRGC, Research Institute of Animal Husbandry (RIAH), University of Life Sciences, and
others discussed and supported the proposed methodology and agreed to make joint efforts to review
the existing methodologies for estimating pasture carrying capacities to come up with a unified
version.
Finally livestock income per an average herder household was estimated by ecological regions using
the following indicators:
Average herd size per herder household as the total number of animal species in the region at
the end 2016 from the NSO data inclusive of animals owned by absentee herders divided by the
total number of herders households (the inclusion of animals owned by absentee herders as a
part of herder household animals is dictated by the need to account for total income produced
on any pastures regardless of ownership):
Camel Horse Cattle Sheep Goat Total
Sheep
units
High Mountain 0.34 15.88 28.63
152.4
9 112.67 310.01 620
Forest Steppe 0.11 25.07 35.86
162.9
3 110.39 334.36 728
Steppe 0.89 35.35 26.44
232.9
6 171.27 466.90 966
Gobi 10.73 16.19 8.50
140.1
5 233.66 409.23 804
Depression of Great
Lakes 3.23 16.75 18.80
179.0
0 228.16 445.94 853
Source: Estimated using data from Statistical Yearbook, National Statistics Office, 2016
The national average indicators for animal productivity. Although these indicators may slightly
vary across regions, there is no region-specific reliable data available. In addition, it is assumed
that regional differences in these variables are minor and will not lead to differences in herders
incomes:

6
Output per animal
Wool, kg Milk, liter Meat, carcass weight, kg
Camel 5 220 200
Horse 135
Cattle 240 130
Sheep 1.1 18
Goat 0.29 15
Source: CPR developed model for herd turn over, 2017
The latest national average of livestock and livestock product prices, ‘000 MNT
Wool, kg Milk, liter Hide/skin, piece Meat, carcass weight, kg
Camel 2.64 2 15.7 2.52
Horse 23 2.92
Cattle 1.4 24.5 3.69
Sheep 0.521 0.93 3.21
Goat 48 10.9 2.65
Source: CPR developed model for herd turn over using various sources of price information, 2017
The household income includes income of home consumed products and the value of animal growth
in this sense the estimated income is higher than the income reported by herders during socio-
economic surveys, which mostly use cash income or income of marketed products. It is worth noting
that the cash income does not express the value of all products produced on pastures, therefore not
suitable for the land evaluation purposes. For example, in case of 2 herders one with 500 animals and
the other one 250 animals and the first herder selling 10% of animals (50 animals) for meat and the
second herder 20% of animals (50 animals), In this case the cash income from meat for 2 herders
equals, however, the impact of animals on pastures is twice high for the first herder and this serious
impact difference is not captured by cash income.
2. Review of laws and regulations related to rangeland management and the collection of
natural resources fee
Key laws and regulations related to rangeland management and the collection of natural resources fee
include:
1. Constitution
2. Civil Code
3. Land Law
4. Land Payment Law
5. Budget Law
6. Environmental Protection Law
7. Law on natural plants
8. Law on natural resource use fees

7
Constitution:
Article 5
5. Livestock is national wealth and protected by the state
Article 6
1. The land, its subsoil, forests, water, fauna and flora and other natural resources in Mongolia shall
belong exclusively to the people and be under the State protection.
2. The land, except those given to the citizen of Mongolia for private ownership, as well as the subsoil
with its mineral wealth, forest, water resources and game shall be the property of the State.
3. The State may give for private ownership plots of land, except pastures and areas under public
utilization and special use, only to the citizens of Mongolia. This provision shall not apply to the
ownership of the subsoil thereof. Citizens shall be prohibited to transfer the land in their possession
to foreign nationals and stateless persons by way of selling, bartering, donating or pledging as well as
transferring to others for exploitation without permission from competent State authorities
As stated in the Constitution, the private ownership of pastureland is duly prohibited because of the
need to keep mobility for rotational use and reciprocal grazing rights in emergencies.
Civil Code
Article 327 Contracts for lease of agriculture land
327.1. Agriculture land can be leased with or without residential or business facilities on it
327.2. Unless provided otherwise in this chapter, regulations of leasing contracts shall equally apply
to lease of agriculture land
Article 481 Unregistered union and partnership
481.1. No registration is needed for unions and partnerships formed by several parties based on a
joint action contract, and the participants shall decide their structure and management by mutual
agreement
481.2. Unregistered unions and partnerships shall participate in the civil legal relationships through
appointed representative or members
The Civil Code article provides a basis for establishing herders’ partnerships and in line with
establishing environmental management partnerships under the Environmental Protection Law.
Moreover, it also makes leasing or contractual use of pastureland as a part of agricultural land
possible.
Land Law
6.2. The following [types of] land, regardless of whether they are given into possession or use, shall
be used for common purpose under government regulation:
6.2.1. Pasturelands, water points in pasturelands, and salt licks

8
Naturally formed water sources and saltlicks are regulated as common use land under the draft
pastureland protection law which provides the compatibility with the Law on Land. However, making
the all the pastureland as common use land makes a lot problems. First of all, this provision ignores
the traditional customary rights of herders to the pastureland they use. It contradicts with all three
dimensions of sustainable development - economic growth, ecological sustainability and social
equality. As the existing common use regime leads to declined livestock productivity and increased
losses during emergencies it contradicts with the Constitution’s provision on protecting livestock as
national wealth.
52.1. ..taking into consideration land use traditions, rational land use, conservation and rehabilitation
requirements and specifics of pastureland, shall reflect the general schedule for winter, spring,
autumn and summer grazing
Seasonal rotation of pastureland land use is critical in keeping ecological sustainability. However,
under the current common use regime herders grow animal numbers to the degree that makes the
rotational use no longer possible leading this provision unenforceable. The draft pastureland
protection law proposes the way to recover and enforce the rotational use.
52.2 Summer, autumn and otor reserve pastures shall be …used commonly. .. the Sum Governor shall
establish schedules for herders to move in and out of winter and spring pastures. Bag Governors and
citizens shall be responsible for the implementation of those schedules. .. winter and spring pastures
can be used by herder groups under agreements..
In practice, bag khurals and Governors make decisions on scheduling of seasonal migrations but they
are not followed by herders and not monitored by governors, because herders have no written
obligations to follow these decisions. Secondly, bag is administrative unit but not NRM unit. The
division of the bag membership is based on winter camping and it is very rare that a bag has four
seasonal pastures in 'own territory', usually members of different bags inter-migrate to each other’s
territory. It makes the bag level decision very difficult to enforce and monitor.
52.7. Citizens of Mongolia may jointly possess land under winter and spring camps by khot ail member
households.
Currently, this is only type resource that is more or less recognized and certified. The rights however
are limited to only land under camp sites but not pastures around them; therefore have no effect on
the sustainable use of pastures.
52.8. In cases of the need for movements to territories of other aimags or sums due to natural
disasters or other emergencies, the relevant level governors shall make a decision to reach an
agreement.
The agreement is practiced in cases of emergencies, however, the decisions on timing and quantity of
animals do not properly consider the carrying capacities of pastures often leading to hoof dzud (animal
losses due to forage shortage resulting from in-migrations of too many animals).

9
52.5 Fenced pastureland can be contracted all year round regardless the season to citizens, economic
entities and organizations for the purposes of undertaking intensified livestock husbandry and raising
domestic animals
42.1. The relevant state administrative organization in charge of land issues may, following an
agreement with the land possessor on withdrawing his/her land with or without replacement, with
full or partial compensation, for state special needs, submit such proposal to the Government.
43.6. The compensation shall not apply to citizens, companies and organizations using the land.
The articles specify that only land possessors are entitled for compensations when their land is taken
away by the Government. As for pastureland, only land under winter and spring camps are possessed
and qualify for seeking compensation but the pastureland as a whole does not qualify for
compensations. Because of this serious gap herders are losing their pastureland without any
compensation. In addition, the existing common use regime means that there is no land use
boundaries identified and recognized which makes the identification of displaced people virtually
impossible.
Land Payment Law
8. Exempting land use payment
8.1. The following payment payers shall be exempted from paying land possession/use payment
1/ Herder households from paying for the use of pastures and haymaking areas
The policy may seem favorable for herders at first, but in fact it encourages the misuse of pastures,
thus contradicts the long term interest for securing herders’ livelihoods by ensuring sustainable
livestock sector development. A market economy dictates that user fees for any resource use serve a
good economic mechanism to prevent overuse.
Budget Law
58.4. Soum is responsible for spending its budget on the following functions:
58.4.4. Fight contagious animal diseases, controlling harmful insects, disaster prevention & recovery,
deliver animal health services;
58.4.5. Pastureland management in the soum territory;
58.4.6. Environmental protection in the soum territory;
60.2. Local development fund is composed of the following sources:
60.2.5. Domestic and foreign aid and donations to support local development
The Budget Law makes it clear that soum government is responsible for undertaking pastureland,
livestock risk and environmental protection functions using its budget resources. However, soums
seriously lack financial resources to carry out these tasks and one the key reasons for that are key
resources such pastures are used free.

10
60. Local development fund
60.1. General manager of budget of different levels shall have local development fund to support local
development.
60.2. Local development fund is composed of following sources:
60.2.1. Transfers from the central fund of local development;
60.2.2. Funding as specified in the article 59.2 of the is law;
60.2.4. Additional sources accumulated from increased tax rates or saved expenses;
60.2.5. Foreign and domestic contributions, aid and financial support from donor projects received for
the purposes to support local development;
60.2.6. 10% of the difference between the total revenue of mining royalties (except for those specified
in the article 473 of the Law on Minerals) and the royalties paid by legal bodies implementing large
projects of state importance;
60.2.7. 50% of fees from mining exploration and exploitation licenses;
Environmental Protection Law
3.1.1 Object of protection is land…;
3.2.7 Environmental protection is about sustainable use of resources without damaging natural
recovery and in line with carrying capacities;
3.2.8. Environmental management partnership is about issuing rights to use, protect and recover
natural resources to local citizens to ensure resources are used in a fair and transparent way and
their benefits are distributed equally;
17.1.5 Soum khurals are entitled to grant protection, use and possession rights to partnerships based
on proposals from bagh common khurals
17.2.7 Based on decision by khurals, soum governors are responsible for establishing agreements
with partnerships on protection, use and possession of natural resources and monitoring over their
implementation
The Environmental Protection Law provides key regulations on how land including pastures can be
contracted to partnerships or groups of local people to make sure that it is used in a sustainable,
transparent and equitable manner.
Law on Natural Plants
Article 3 Vegetation fund & its classification
1. The vegetation fund consists of moss, algae, calyx, fungi and microorganisms on the land and water
territory of Mongolia.
2. Plants are assigned to the following classifications based on conservation status and renewability:

11
1/endangered;
2/vulnerable;
3/abundant;
Article 6 Plant use fees
1. All citizens, economic entities and institutions are legally obligated to pay the fee for the use of
plants on land owned by the state.
2. The minimum fee, maximum fee, discounts and exemptions shall all be regulated by the law.
Article 7 Perform the study of vegetation distribution & plant resources and establishing the
ecological and economic evaluation
1. The vegetation distribution and plant resources study of production plants shall be conducted every
5 years by the state administration in cooperation with a scientific institution.
2. The ecological and economic evaluation of vegetation shall be performed by the state
administration.
Article 14 Using hay & vegetation for livestock raising
1 All citizens, economic entities and institutions engaged in livestock herding shall comply with articles
52 & 53 of the Land Law of Mongolia when grazing livestock, haymaking and using the vegetation of
hay fields located in their respective soums or districts.
2. The soum, district khural of citizens’ representatives and bagh, sub district meetings, through the
conclusion of a professional institution, are authorized to prohibit livestock grazing & haymaking on
pastureland for up to 2 years to protect endangered plant species.
3. The soum, district, bagh and sub district governor shall arrange the scheduled adjustment of pasture
& hay field carrying capacity to ensure the protection & recovery of vegetation.
According to the Law on Natural Plants, pastures fall in the class of abundant plants and their use
shall be regulated by the Land Law.
Law on Natural Resource Use Fees
Article 5 Plant use fees through classification
5.1. Fees are applied to the use of plants belonging to the following classifications:
5.1.1. Endangered plants;
5.1.2. Vulnerable plants;
5.1.3. Abundant plants;
Article 9 Indicator for the natural plant use fee
9.1. The indicator for the natural plant use fee shall be established by the ecological and economic
evaluation percentage that determines the quantity or number of a particular plant species per
kilogram of weight on a specified date.
14.1. The natural plant use fee amount shall be paid in MNT as determined by the ecological and
economic evaluation percentage indicator stated in article 9.

12
Natural plant classification Ecological and economic evaluation percentage of the fee indicator
Minimum Maximum
1. Endangered 25 30
2. Vulnerable 15 20
З. Abundant 5 10
18.1. A portion of the fee income stated in article 13.2 shall be used for environmental protection and
the renewal of natural resources. The minimum amount and percentage of the annual budget to be
allocated for the aforementioned spending shall be determined as follows:
Natural resource use fee type
The minimum amount & percentage of the fee income to be
used for environmental protection and the renewal of natural
resources. /By percentage from the total fee income/
1. Natural plant use fee income 15 percent
Article 19 Discount & exemption from the use fee
19.1. Exemption from the plant use fee shall be allowed on the basis of the following circumstance(s):
19.1.3. All citizens, economic entities and institutions using natural plants of pasture & hay fields
located outside crop production regions are allowed exemption from the plant use fee.
Article 23 Payment of natural resource use fee
23.1. The soum and district governor shall appoint the official authorized to collect the natural
resource use fee.
23.2. The natural resource use fee income shall be transferred to the local budget within the 10th of
the upcoming month and the annual report shall be filed with the tax authority within January 10 of
the upcoming year.
The Law on Natural Resource Use Fees provides important regulations on how abundant plans
(pastures included in this category) should be charged a certain fee for their use. However, it exempts
pasture use fees except for crop production regions. As the Land Payment Law has exempted all
herder households from paying the pasture use fees, crop production regions are unlikely to collect
pasture use fees from herders.
Law on Soil Protection and Preventing Desertification
7.1. The following measures shall be undertaken to protect soil and prevent desertification:
7.1.4. Use pastures by ensuring a balance with animal numbers and through seasonal rotations
The law provides an important message that keeping optimum stocking density is crucial for
pastureland soil protection and preventing desertification.
Conclusions
Mongolia has quite comprehensive legal environment for rangeland management and natural
resource fees

13
However, enforcement of these legislations is far from satisfactory with one of the reasons being
a lack funding for soums to perform their functions
The Land Payment Law and the Law on Natural Resource Use Fees have made the use of pastures
free of charge. Unless exemptions of pasture use fees change in these legislations, local
governments will continue to lack financial resources to undertake their pastureland, livestock
risk and environmental management functions properly.
Pastureland use agreements can be enforced based on the Article 327 of the Civil Code, the
Article 52.2 of the Land Law, Articles 17.1.5 and 17.2.7 of the Environmental Protection Law
3. Proposal for implementation mechanisms of the grazing fee system at local level, including
capacity development activities
3.1 Background and lessons learnt
The herd size of Mongolia was more or less constant at around 25 m animals before 1990. At that
time, the wool, cashmere & milk of animals were sorted, collected and sold every year. Moreover, the
animals were able to sustain the livelihood of herders and herders were well protected from droughts
& dzud. In the past years, the number of animals has grown constantly and reached a total of 61.8
million in 2016. The country’s 110 million of ha of pastures’ carrying capacity of around 50 million
sheep units were exceeded by 104%. To make matter worse, pastureland is becoming scarcer as it is
converted to other uses such as mining, road, communication and tourism activities.
If the current trend continues, pasture degradation & scarcity gains ground and the sustainable
development of livestock herding and herders’ livelihood is jeopardized.
Why herders maximize animal numbers, are they guilty?
Competing to maximize own benefits given the existing incentive structures is dictated by a market
economy.
The existing incentive mechanisms imposed on herders are:
Herders use pastures and the resources on them, such as water and salt licks, free of any charge
and without any accountability mechanisms for overgrazing and degradation.
Absence of any incentive mechanisms towards maintaining optimum stocking density
Absence of any incentives stimulating livestock and product quality (Example: cashmere and
meat price are based on purely quantity-kg)
Quality and other standards are not enforced largely due to difficulties of controlling animal and
product sales currently undertaken largely at herders’ camp sites
Thus, the current incentives dictate that herders rationally choose maximizing animal numbers as the
cheapest and easiest way of income generation and it is not herders’ fault.
Are there legitimate ways to control animal numbers?
Keystone of nomadic pastoralism in Mongolia was availability and rotational use of seasonal pastures
and access to reserve areas in emergencies. For centuries this was regulated by customary
arrangements and was effective in ensuring ecological sustainability and minimizing animal losses

14
during natural disasters. However, given the lack of incentive mechanisms, the traditional customary
arrangements have become futile against pressures imposed on herders to increase herd size to
survive economically for the poor and become richer for the rich. The solution is to recover traditional
best practices through formally acknowledging and protecting informal user rights of each herder in
an equitable way - to protect the poor against losing their grazing rights and restrict the rich expanding
their user rights. The only legitimate way to implement it is to introduce enforceable land use
agreements for herder groups or partnerships based on the Land Law and the Environmental
Protection Law. The land use agreements with as much as possible term with inheritable rights will
cherish ownership mentality towards pastures and attached stocking density limits will facilitate the
reconciliation of animal numbers with pasture carrying capacities.
There is a plenty of evidence that pastureland use agreements can be successfully introduced in
Mongolian conditions. In 2009-2012, under the “Peri-urban rangeland” supported by the Millennium
Challenge Corporation CPR has tested the feasibility of land use agreements for 384 herder groups in
the steppe & forest steppe regions based on the existing land use patterns and keeping herders’
mobility across seasonal pastures as a key risk management strategy. Under the project CPR has
developed and applied guidelines to introduce land use agreements for nomadic herders to avoid both
physical and economic resettlement involving education campaign to promote benefits of land use
agreements, herders identifying group memberships and land use boundaries and consulting with all
neighbors to get no objection signatures, bagh meeting discussion and approval of land use
boundaries and a final decision by soum governors to issue land rights to herder groups for a minimum
of 15 years. The pilot was successful in promoting enforceable land use agreements. Out of 384 herder
groups 64.2% have reached the targets to reconcile animal numbers and the carrying capacity within
2 years.
In 2014-2015 under UNDP-funded project “Mongolia’s Network of Managed Resource Protected
Areas” CPR has successfully piloted an integrated community conservation model for 6 herders groups
in Khentii and Dornod aimags with pastureland use agreements and agreements to protect wildlife
on contracted pastures established between herder groups and soum Governors and pastureland
biodiversity offset methodology developed and approved by the local soum khurals (councils).
In 2015-2016 CPR has undertaken the assessment of pasture user groups and associated land use
agreements promoted by Swiss Development Cooperation /SDC/ funded Green Gold project in several
aimags. As a part of assignment CPR has assisted 17 herder groups in developing and implementing
comprehensive 4-year action plans to achieve, among others, the stocking density targets stipulated
by land use agreements. In total 17 herder groups have targeted to reduce the total sheep units from
76620 at the end of 2014 to 58930 in 2018, which is very ambitious as the national herd has a trend
increase by 10% annually for the past 5 years. At the end of 2015, the first year target of reducing
animal numbers has been achieved by 80% with some groups achieving the target by 102.5-131%. The
assessment recommendations also included to decrease the size of pasture user groups into smaller
herder groups as too large groups fail to promote among members ownership mentality towards
pastures and collaboration and collective decision making was difficult to non-existent.
Are there additional incentives needed for herders to reconcile animal numbers with pasture carrying
capacities?

15
The CPR experiences has shown changing herders mentality from the livestock number maximization
to productivity improvements does not happen overnight and needs to be facilitated by additional
economic incentives in addition to land use agreements to make sure that herders are well aware of
benefits of reconciling animal numbers with pasture carrying capacities and potential losses from
restricting the herd size growth is compensated by increased productivity and improved access to
markets. For this purpose, CPR has promoted to use a range of initiatives in a holistic way including (i)
face to face training using clear simple language education materials demonstrating in monetary terms
how herders can benefit from these changes; (ii) soum Livestock Risk Management Fund to finance
herders proposals for improved pastureland, livestock risk management and biodiversity protection
through public-private partnership /PPP/ mechanisms (iii) support in value chain areas to facilitate to
access better markets to realize benefits of improved product quality. For education campaign the
most beneficial tool was CPR-developed herd turn-over model demonstrating superior growth of cash
income under the model to reconcile animal numbers with pasture carrying capacity (herd size
decreased by 6-8% annually) compared to the existing model in which herders increase the herd size
annually by 6-10%. Model estimate is shown in case of an average herder household of Mongolia as
of 2016 (See Table 1).
Table 1 A model to promote herders income generation in an environmentally friendly way, average
herder household of Mongolia as of 2016
Indicators Base
2016
Year 1 Year 2 Year 3 Year 4 Year 5
Total livestock, million (m) 61.8 57.0 52.6 48.5 44.8 41.3
Total livestock sheep units, m 101.9 94.8 88.1 82.0 76.3 71.0
Livestock per average soum 187137 172659 159310 147000 135649 125182
Livestock per soum sheep units 308813 287190 267111 248465 231148 215062
Sheep units per herder household 634 590 549 510 475 442
Household total income, ‘000 MNT 11200 18334 17738 17154 16584 15886
Home consumption, ‘000 MNT 2313 2313 2313 2313 2313 2313
Cash income, ‘000 MNT 8887 16021 15425 14841 14271 13573
Cash value of decreased herd size
‘000 MNT 0 2878 2691 2516 2353 2201
Income per sheep unit, ‘000 MNT 12.9 25.3 26.1 27.0 28.0 28.6
Note:
The total income of herder households increases despite herd size decreases due to the improvement
in forage supply, animal productivity & herd structure. The income does not include the annual 10%
growth rate of livestock product prices since its effect generally nullifies as a result of inflation of
consumer products herders buy. 2 Maintaining or increasing the herd size produces income. Decreasing the herd size is not considered
to produce income since animals are sold off and opportunities to generate further income are lost.
However, cash from sold animals that decrease the herd size can be used for animal productivity
improvements, savings and income diversification activities. In the above case, this opportunity is MNT

16
2.5 million per household, adding up to MNT 25 million for a herder group of 10 households. It is worth
noting that herders’ income at the exiting scenario of increasing the herd size around 10% annually
produces cash income of MNT 10.5 million in 5 years which is 23% lower compared to 13.6 million in
the table above.
Livestock production in Mongolia is highly dependent on harsh and variable weather and resulting
pasture conditions. Small to medium scale risks can be overcome successfully if herders and soum
governments prepare well, however, because of future uncertainties and lack of available funding
herders they are not doing so. Given the lack of access to credit this situation seriously impedes the
capability of herders, especially poor herders in addressing all the challenges herders face in all areas
of their businesses especially in risk management. Therefore, it is seen essential to introduce incentive
mechanisms capable of triggering good winter-spring preparedness regardless of the weather
conditions in a particular year. A potential solution here is, as piloted by CPR in a number of soums
since 2015, soum Livestock Risk Management Fund (LRMF). The local government funds to be used
for risk management are regulated by the Budget Law and Rules for Local Development Fund, Finance
Minister’s Resolution No 43. In practice, these regulations are not enforced well because of low
commitment and lack of funding. LRMF intends to mobilize funds through PPP- herders will pay
contributions in the sum of MNT 500 per sheep unit in accordance with the article 60.2.5 of Budget
Law (62.5% of revenues) and soum government will pay matching fund in the sum of MNT 300 per
sheep unit in accordance with the 58.4.4 of the Budget Law (37.5% of revenues) totaling MNT 800 per
sheep unit. Once having paid their contributions, herders are entitled to get funds for risk
management in the sum of 30% increase of what they have paid (81.75% of expenditure) and the
soum government uses the remaining 18.25% of the fund for soum and bagh level risk management
activities. In this way, the soum fund for risk management is increased by 60% from herders’
contributions and herders are motivated in risk management as they receive 30% more than what
have contributed. Herders use the fund on eligible activities directly linked risk management.
3.2 Proposal for implementation mechanisms of the grazing fee system including capacity
development activities
Based on the past best practices and lessons learnt, a grazing fee system is proposed to be introduced
as a part of comprehensive sustainable livestock development policy aimed at putting the livestock
herding on sustainable path of development with grazing fees playing a key role as a revenue source
and incentive mechanisms for building soum pastureland, livestock risk and environmental
management capacities and changing herders behavior from the livestock number maximization
towards productivity improvements and market competitiveness.
The sustainable livestock development policy is proposed to be implemented through the following
components:
Establish Pastureland use agreement (LUA)s to make sustainable use of pastures a herders’
self-interest, to protect the poor against losing their grazing rights and restrict the rich
unrestrictedly expanding their user rights and to protect herders interests against chaotic
converting of pastures into mining and other uses

17
Collect grazing fees from every animal and use revenues in the sum of around MNT 800 per
sheep unit back on improving pastureland, livestock risk and environmental management
through the following incentive mechanisms:
o MNT 135 for the soum fund to stimulate local government’s participation and finance
soum’s pastureland, livestock risk and environmental management policies (currently
soums lack operational costs for these activities and allocate budget only to pay
salaries of relevant staff)
o MNT 365 for the Soum Livestock Risk Management Fund /LRMF/ to finance proposals
from herders groups on pastureland & livestock risk management
o The remaining part (around MNT 300) for the Livestock Quality Stimulation Fund
/LQSF/- paid to every animal quality certified and sold to the market: a minimum of
around MNT 2000-2600 per sheep unit /as only 13-15% of animals are sold annually
for meat, revenues collected MNT 300 per sheep of all animals grows by around 7-8
folds 100:13-15 folds /
Annually estimate the pasture carrying capacities and in case carrying capacity has been
exceeded, create a system in which animals that exceeded pasture carrying capacity are sold
to increase the income of herders
Encourage herders, who have established LUAs towards protecting wildlife and other natural
resources and benefiting from their sustainable uses through establishing appropriate use
agreements
Organize the value chains of animals and animal products through cooperation of all involved
parties using the LQSF as an incentive mechanism and funding source to enhance market
competitiveness of livestock products and increase income for every involved party
Revenue collection and way herders can benefit. Grazing fees shall be imposed on the total sheep
units based on animal census data at the end of the previous year & shall be collected by 1 June.
Grazing fees from animals belonging to absentee owners shall be collected from herders who look
after these animals. Herders using pastures in other soums for a certain period of time shall pay grazing
fees to that soums, however, shall be freed from paying grazing fees in own soums for that period.
Herders keeping more pastures beyond their needs shall be imposed grazing fees per ha basis to
discourage such attempts. Soum government shall exercise authorities to adjust implementation
arrangements to specific soum conditions such as using own list of eligible activities to be financed
from LRMF, adjustment coefficients to change grazing fees based on location of herders, concessions
on grazing fees in particular conditions such as outbreak of contagious diseases etc.
Herders are entitled to benefit from revenues:
If established pastureland use agreements /PUA/, are entitled to access both LRMF and LQIF
and get funds from LRMF in proportion of the rate of fulfillment duties for reconciling animal
numbers with pasture carrying capacities (if duties are fulfilled for 80% then get 80% of
potential funding from LRMF) and get quality premiums from LQSF for each animal meeting
quality standards
If not established PUA, are entitled to access LQSF only but required to meet the condition of
identifying herder group/environmental management partnership memberships, land use
boundaries in consultation with neighbors and developing and approving by a meeting of all

18
members of a 5-year plan to reconcile animal numbers with pasture carrying capacities with
yearly targets. LQSF quality premiums shall be paid to each animal meeting quality standards
These conditions are to leverage herders changing their behavior. As herders pay significant amount
of fees they will be interested in meeting these conditions to access LRMF and LQSF.
Soum disposal fund. As mentioned in section 2, according to the Budget Law soum governments are
responsible for undertaking pastureland management, livestock risk and environmental protection in
their territories. However, a lack of available funding seriously inhibits local governments’ capacities
to undertake these functions properly. Therefore, a portion of grazing fee revenues in the sum of MNT
135 is proposed to strengthen soum government’s financial capacities to undertake their mandatory
functions. For an average soum this portion of grazing fees accounts for around MNT 50 m (Details are
in the next section 4) which is essential for paying operational costs (currently the soum budget
finances barely more than salaries of relevant staff) associated with the implementation of soum’s
pastureland management, livestock risk and environmental protection policies.
LRMF. As mentioned earlier livestock production in Mongolia is highly risky endeavor. Small to
medium scale risks can be overcome successfully if herders prepare well, however, because of lack of
funding herders are not doing so. Given the lack of access to credit this situation seriously impedes
the capability of herders, especially poor herders in addressing all the challenges herders face in all
areas of their businesses especially in risk management. Therefore, it is seen essential to use a portion
of grazing fee revenues as an incentive mechanism for herders to trigger good winter-spring
preparedness. The proposed amount is MNT 365 per sheep unit capable of forming a fund around
MNT 300 thousand per a herder household (See details in in the next section 4). LRMF is in fact a
mechanism to ensure herders spend an adequate amount of their incomes in risk management
instead of spending all in consumption. Herders will access LRMF by developing a proposal to
undertake pastureland, livestock risk and environmental protection activities chosen from an eligible
list of activities. The soum government (a working group or committee composed of key staff including
AHBU, land officer, environmental inspector and bag governors can be formed) is responsible for
evaluating, endorsing, financing and monitoring over the implementation of herders proposals to
LRMF. It is proposed that 80% of funding provided to upon the proposal approval and the remaining
20% is paid upon the implementation evaluation by the government. All transactions shall be
transparent and are undertaken through bank payments with herder groups/partnerships having own
bank account.
Below is a sample list of eligible activities to be financed from LRMF
1. Manure hay making areas
2. Protect springs, fence its origins
3. Fight against pasture rodents and insects
4. Improve pastures and hay making areas by planting perennials
5. Protect wildlife on pastures under agreement
6. Repair deep well facilities (pump, generator, trough)
7. Build and repair water catchment facilities
8. Plant trees and shrubs for environmental protection purposes
9. Estimate pasture grass yield, carrying capacities

19
10. Monitoring by group/partnership leaders over the implementation of the pastureland use
agreements and sub-projects funded by LRMF
11. Prepare animal feed and establish its reserve fund
12. Repair and upgrade animal shelters
13. Repair hay and fodder storage facilities
14. Make small scale snow breaker
15. Dig and drain hand wells, repair hand well facilities
16. Purchase small-scale hay, fodder making equipment
17. Undertake horticulture activities for income diversification purposes
18. Repair and maintain fencing of hay making areas
19. Purchase breeding animals
20. Measures for animal health improvement
21. Measure for livestock product processing, improving its quality and market linkages
Under the LRMF the biodiversity protection benefits in two ways:
1. Grazing fees will stimulate herders economic behavior change from the livestock number
maximization to adopting productivity oriented strategies, in other words environmentally
friendly ways of income generation, as a result grazing pressures will reduce providing more
space for biodiversity to recover
2. As specified in in the list activities eligible for financing from the LRMF, several activities are
included like protecting wildlife, planting trees, protecting springs. This is not final list and it
can be added with more activities specific in a particular area. The idea of LRMF is to promote
bottom-up initiatives of local citizens so that herders can propose what is most important and
specific wild animal and plant species can be well considered for protection and funded from
the LRMF.
LQSF. A key weaknesses of livestock value chain is lack of organization among herders leading to no
linkage of herders to processors and ‘changers’ dominating the market and accruing the biggest
portion of margins. Most animals are sold from herders’ camp sites often hand-slaughtered leading to
low prices and failures to meet hygiene requirements and export market demands. A solution is to
promote cooperation among herders & across value chain participants to organize livestock collection,
quality certification and sales through one window and formal partnerships with certified processors.
An incentive mechanism is to use a portion of grazing fee revenues (LQSF) to pay herders quality
premium to every animal brought to the soum procurement point and that meets quality
requirements and certified by the relevant soum officials and private vets. In this way, herders and
changers/marketing cooperative will benefit from price increases due to quality improvements and
certification, private animal health service providers can benefit from economies of scale expected
from organizing the soum animal quality certification in a centralized manner, where soum
government/AHBU has a major stake and consumes will benefit from safe food supply coming from
the livestock sector. Animals meeting quality standards at the soum shall be sold through cooperatives
in a bulk to certified processors based on partnership agreements.
The estimates of grazing fee and the distribution of revenues collected are discussed in the next
section.

20
The sustainable livestock development policy is believed to result in the following outcomes:
Fresh and naturally restorable pastures capable of producing ecologically clean animal
products
Better protected against risks and with improved market competitiveness livestock sector
Natural environment, with rich biodiversity and free of any pollution & degradation
Local government capable of guiding local economic, social and environmental development
with long-term vision and in the best interests of local communities
Herder households living in the above environment who cooperate with each other and
ensure their sustainable livelihoods and supporting herder organizations and businesses
Proposed activities for the implementation
Because the policy targets to change the people’s mentality shaped up through many years, the
implementation of sustainable development policy is proposed to be carried out through the following
activities:
1. Organize face to face training and promotion campaign (donors need to provide funding and
technical assistance) to educate stakeholders about the policy goal, benefits and ways they
can participate –within one 1 for the date of re-legalizing a grazing fee system. The most cost-
efficient way of organizing the education campaign is to train at aimag centers soum
governors, land officers, animal health and breeding unit officers as local trainers so that they
could organize the education campaign in own soums. The training should cover as the
following key topics as a minimum:
Content and benefits (economic/income, environmental and social) of sustainable
livestock development policy
Grazing fee as a revenue source and incentive mechanisms for building soum
pastureland, livestock risk and environmental management capacities and changing
herders behavior from the livestock number maximization towards productivity
improvements and market competitiveness
Methodologies to estimate grazing fees in soums, establish and enforce pastureland
use agreements, estimate pasture carrying capacities, promote environmental
management partnerships and marketing cooperatives, grazing fee revenue
collection and revenue distribution mechanisms (soum disposal fund, LRMF, LQSF)
2. Local trainers organize the education campaign in their soums to make sure every herder
household is reached and trained in the policy goal, content, benefits and ways they can
participate and benefit, when necessary local trainers get assistance from qualified
trainers/consultants
3. Herders form partnerships, identify memberships, land use boundaries assisted by local
trainers
4. Soum governments impose and collect grazing fees based on the previous year’s livestock
census data and organize the implementation of its pastureland, livestock risk and
environmental management policies using the enhanced funds from grazing fee revenues
5. Herders partnerships establish pastureland use agreements with soum governors and the
latter monitors over their enforcement including annual estimates of carrying capacities of

21
pastures under agreement and the fulfillment of targets to reconcile animal numbers with
them
6. Herders’ partnerships access LRMF through developing and submitting proposals to the soum
7. Herders’ partnerships access LQSF based on the number of animals meeting the quality
standards
8. Soums undertake the control and certification of animals brought by herders in an organized
and cost-efficient way
9. Herders partnerships work together through a marketing cooperative to sell quality certified
animals to processors (abattoirs) with the longer-term aim to reach high value niche markets
of organic, environmentally-friendly and free-range livestock products. Capacity building of
marketing cooperatives is organized by qualified trainers
10. Governments undertake regular (annual) reviews of the policy implementation and make
required adjustments
4. Estimating the potential revenue from pasture use fees for the period of 2018-2022
The grazing fee was estimated using the developed methodology based on the 2016 livestock number
and livestock product prices, the 5-year average grass yield of 2010-2014 from the National Agency
for Meteorology, Hydrology and Environmental Monitoring (Table 1). The grazing fee estimates by
each soum of Mongolia is provided in Appendix 1.
As shown in Table 2, the grazing fee per sheep unit is MNT 764-845 out of which 135 goes to the soum
disposal fund, 365 to the livestock risk management fund (LRMF) and 264- 345 to the livestock quality
stimulation fund (LQSF). As for an average soum, the grazing fee revenue is MNT 283-334 m, the soum
disposal fund is 47-59 m, LRMF is 126-159 and LQSF is 106-131 m. The total revenue for the nation is
102.2 billion. As for an average herder household, the total income is 14.2-18.7 including home
consumption and livestock growth. The grazing fee per household is MNT 524-739 thousand or 3.7-
4.5% of herders’ annual income. However, herder get back around 80% of fees paid through LRMF
and LQSF, so unreturned fees account for only 0.59-0.75% of herders’ income.
Table 2 Grazing fee estimates, as of 2016
High
Mountain
Forest
steppe
Steppe Gobi Depression
of Great
Lakes
1 Sheep Unit Estimate, MNT
Grazing fee 845 828 764 802 838
Revenue Distribution
Soum disposal fund 135 135 135 135 135
LRMF 365 365 365 365 365
LQSF 345 328 264 302 338
Average soum estimates
Pastureland, ha 257978 167095 336080 604592 369090
Grass yield, kg of dry matter 258 454 380 109 142
Livestock number in sheep units* 382688 367830 436494 353557 344710

22
Number of herder households 617 505 452 440 404
Number of sheep units per household 620 728 966 804 853
Total grazing fee revenues, m MNT 323 305 334 283 289
Revenue Distribution, m MNT
Soum disposal fund 52 50 59 48 47
To herders from LRMF 140 134 159 129 126
To herders from LQSF 131 121 116 106 116
Number of soums 60 82 78 60 51
Regional fee revenues, m MNT 19380 25010 26052 16980 14739
National revenues, MNT billion 102.2
Average herder household estimates
Household livestock income, '000 MNT 14163 16581 18664 14327 16392
Income per sheep unit, MNT 22835 22764 19327 17830 19211
Grazing fee total, '000 MNT 524 603 739 644 716
Benefit from LRMF, '000 MNT 226 266 352 293 311
Benefit from LQSF, '000 MNT 214 239 255 242 289
Benefit total from funds, '000 MNT 440 505 607 536 600
Share of total fee in income, % 3.7 3.6 4.0 4.5 4.4
Share of unreturned fee in income, % 0.59 0.59 0.71 0.75 0.71
*Livestock number includes animals of absentee owners
The grazing fee forecast for 2018-2022 is estimated under the current scenario of increasing animal
numbers 10% annually as well as in the opposite scenario to decrease the herd size 10% annually.
Table 3 Forecasts for national grazing fee estimates, 2018-2022
Scenario to increase herd size 10% annually
Indicators 2016 2017 2018 2019 2020 2021 2022
Livestock number,
million sheep units
126 135 149 164 180 198 218
Grazing fee per sheep
unit, MNT
811 824 840 854 867 879 890
Total grazing fee, MNT
billion
102.2 111.3 124.9 139.7 156.1 174.1 193.9
Scenario to decrease herd size 10% annually
Indicators 2016 2017 2018 2019 2020 2021 2022
Livestock number,
million sheep units
126 135 121.7 109.5 98.6 88.7 79.8
Grazing fee per sheep
unit, MNT
811 824 804 782 758 731 701
Total grazing fee, MNT
billion
102.2 111.3 97.8 85.7 74.7 64.8 56.0

23
As shown in Table 3 at 10% annual increase rate, the livestock number increases from 111.3 million
sheep units in 2017 to 193.9 m in 5 years. This is unlikely scenario as the pasture carrying capacities
are already exceeded. The opposite scenario shows that the livestock number can be decreased to
79.8 m in sheep units or around 39 m in physical units in 5 years. This is a desirable scenario as a move
towards an optimum stocking density will result in increased land, animal productivity, herders’
income and improved biodiversity protection. Grazing fee per sheep unit increases as animal numbers
and the rate of overgrazing increases and vice versa.
5. Draft the necessary amendments to legislation that would be required to successfully re-
legalize grazing fee
As mentioned in section 3, pastureland use agreements are proposed as a key tool to leverage herders
to reconcile animal numbers with pasture carrying capacities in order to get back the most part
(around 80%) of grazing fees paid trough accessing the soum LRMF. Therefore, the legal environment
related to pastureland use agreements is essential. Improving the legal environment for promoting
pastureland possession or use agreements through drafting a separate law or making amendments to
the Land Law has been attempted several times. However, mostly due to political reasons as well a
lack of understanding of the problem, these attempts have not succeeded. Currently, the pastureland
protection law was drafted and the Ministry of Food, Agriculture and Light Industry is attempting to
promote it. It is not clear yet whether this latest attempt will succeed or not. Therefore, it seemed
more practical to look for opportunities to enforce pastureland agreements within the existing legal
framework. The answer is very positive, there is a good scope for introducing pastureland use
agreements using the effective legislation and a few legal amendments are needed to make them
strengthened further. Below are effective laws and proposed amendments.
Applying the Environmental Protection Law for introducing pastureland use agreements
To be based on the following articles:
• Object of protection- land/3.1.1/; environmental protection is about sustainable use of
resources without damaging natural recovery and in line with carrying capacities /3.2.7/;
environmental management partnership is about issuing rights to use, protect and recover
natural resources to local citizens to ensure resources are used in a fair and transparent way
and their benefits are distributed equally /3.2.8/; soum khurals are entitled to grant
protection, use and possession rights to partnerships based on proposals from bagh common
khurals /17.1.5/ based on decision by khurals, soum governors are responsible for establishing
agreements with partnerships on protection, use and possession of natural resources and
monitoring over their implementation/17.2.7/
Make the following amendments to the Land Law:
• 6.2.1. pasturelands, otor reserve areas, pastureland for crossing routes, naturally formed
rivers, springs, lakes, ponds, water-bearing points and salt licks /common use land/;
Where highlighted by strikethrough shows removals and red shows additions.
Rationale is to make land use agreements cover all pastures

24
52.2. In order to prevent pastures from over-grazing, based on land use traditions, pasture capacity
and regional specifics and proposals from bagh khurals, the soum Governor may allow environmental
management partnerships to use land upon relevant agreements and terms.
Where highlighted by strikethrough shows removals and red shows additions.
Rationale is to make land use agreements cover all pastures and make the article compatible with the
Environmental Protection Law.
Legal solution to grazing fees- Amendments to Land Use Payment Law:
8.1.1 Free herder households from paying fee for the use of pastures and hayland /annul/
6.1.1 Impose pastureland use payment, on sheep unit based on or differentiated by livestock product
yield, value, animal species, location and stocking rate (revise)
Where highlighted by strikethrough shows removals and red shows additions.
Rationale is to re-legalize grazing fees and make estimates compatible with the proposed
methodology.
6.2 Coefficients to convert animal species into sheep units horse 8, cattle 6 4, camel 5 3, goat О.9 2
(change coefficients)
Rationale is to make estimates compatible with the proposed methodology.
Article 7 Land use payment rate
(annul and add a new article as follows)
Pastureland use payment shall be established by the Government in accordance with 6.1.1
Rationale is to make estimates compatible with the proposed methodology.
Article 8 Land use payment concessions
8.2. Rules to grant land use payment concessions and rewards to land users engaged in
environmentally-friendly practices to protect and recover land shall be established by the Government
(revise)
Where highlighted by red shows additions
Rationale is to legalize the Livestock Quality Stimulation Fund paying quality premiums to herders.
Article 10 Land use payments except for pastureland use payments shall be paid to the aimag, capital
city, soum and district budget and pastureland use payments shall be paid to the soum and district
budget
Where highlighted by red shows additions
Rationale is to make sure that grazing fees are collected to the soum budget.

25
Budget Law
60. Local development fund
60.2.7 The difference between the total gazing fee revenues and the revenues going to the soum
disposal fund, add new provision
Rationale is to make LRMF and LQSF as a part of local development fund
“Guidelines for local development fund” Resolution No 43, Minister of Finance, March 6, 2014
Four. Principles to be applied in planning projects and measures financed from local development
fund (add new provision)
4.10 Portions of grazing fees shall be used as follows:
4.10.1 MNT 365 for the Soum Livestock Risk Management Fund /LRMF/ to finance proposals
from herders groups on pastureland & livestock risk management (activities specified in
an eligible list of activities)
4.10.2 The remaining part (around MNT 300) for the Livestock Quality Stimulation Fund /LQSF/-
paid to every animal quality certified and sold to the market
Rationale is to make portions of grazing fee be used on specified designations
6. Policy advocacy strategy to introduce grazing fees
The following consultation meetings and workshops have been organized on the developed
methodology and results to get stakeholders’ feedback and recommendations for promoting grazing
fees including potential advocacy strategies:
1. Ministry of Food, Agriculture and Light Industry (MOFALI)
2. Ministry of Environment and Tourism Development (METD)
3. Civil society organizations, researchers and donor projects
4. Ministry of Finance
5. Tuv aimag government
6. Dundgobi aimag government
7. Luus soum (Dundgobi aimag) government and herders representatives
8. Undurshireet (Tuv aimag) government and herders representatives
9. Orkhontuul (Selenge aimag) government and herders representatives
The consultation meeting with MOFALI was organized twice including key ministry officials like Mr.
Choi-Ish, the head of the Department for the Livestock Policy Implementation, Mr. Enkh-Amar, the
head of the Department for Strategic Policy and Planning, G. Battsetseg, head of the Legal Division
and others.
Mr. Choi-Ish delivered the closing statement to conclude the workshop. He emphasized that the
support of grazing fees is not only limited to the Ministry and policy researchers. For instance,

26
throughout the recent animal census meetings, many herders across many locations expressed their
strong support for grazing fees and deemed it necessary that the government take decisive action to
initiate its implementation.
The second meeting with MOFALI was held on 11 January 2018 at the ministry involving Mr. Choi-Ish,
Head, Department for the Livestock Policy Implementation Coordination, Mr. Amgalanbaatar, Head,
the Inter-aimag Otor Pasture Administration, Mr. Byambadorj, Lead Specialist, Department for the
Livestock Policy Implementation Coordination, Ms. Zolzaya, Specialist, Inter-aimag Otor Pasture
Administration. The meeting has discussed the legal solutions proposed by CPR to introduce grazing
fees. Mr. Choi-Ish said that the proposed solutions are valuable and the MOFALI consider them as one
of potential ways to promote the grazing fee system.
The proposed grazing fee methodology and results have been discussed at the workshop organized
on 10 January 2018 by the BIOFIN project for its steering committee members involving Mr. Batjargal,
head of the Public Administration Department of METD, other staff members of METD as well as
representatives from other ministries, agencies and UNDP staff members headed by Ms. Daniela
Gasparikova, DRR UNDP. The presentation on the grazing fee methodology and results has been made
by Mr. Enkh-Amgalan, followed by a few questions and comments. In general, the audience was
supportive of the proposed methodology and key results.
The workshop among civil society organizations, researchers and donor projects was held in the
meeting room of the Center for Policy Research on January 11, 2018. The presentation, on grazing fee
methodology and key results, has been made Mr. Enkh-Amgalan followed by question/answer
sessions and discussions.
Mr. Chimed-Ochir, BIOFIN project advisor gave information about the BIOFIN project and asked for
clarification regarding the some figures in the presentation. He also highlighted the need to consider
the herd size of households, the possibility of differentiating between herder households and
households with livestock and the legal environment in which the grazing fee income is allocated
either to the aimag or the soum budget. Furthermore, her recommended that a NGO organization be
acting as a lead in lobbying the draft legislation like the Mongolian Association for Pasture User groups
as UNDP has limitations in the lobbying process.
Mr. Enkh-Amgalan responded to issues raised by the workshop participants. As for progressive grazing
fee, he said, the idea seems is attractive, however, there are strong arguments against it. First, grazing
is payment for the use of natural resources, but not income tax, sheep of richer herders ears the same
amount of pasture forage as the sheep of poorer herders, so there is no basis to impose higher fee on
animals of richer herders, second, grazing fee is increased if herders overgraze pastures, meaning
increasing herd size beyond pasture carrying capacities is already taken into account, which some
argue that big herds are already taken into account and progressive grazing fee is double counting,
third, because of newly introduced taxes since 2018 the current political situation is to avoid any tax
increases, so increasing fees for richer herders might seem inappropriate in the current situation.
Because of these considerations we recommend that the progressive grazing fee be rejected for the
time being.

27
Mrs. Khishigjargal, UNDP highlighted that the grazing fee proposal has been successfully presented to
the Minister of METD and has received support. It is now important to focus on lobbying in order to
create the necessary legal environment. There is a need for launching rigorous promotion and
advertising, to ensure the participation of donors and other institutions in the lobbying process and
utilize social networks for the purpose of advertising.
The workshop for the Ministry of Finance was organized on 19 January 2018 at the general meeting
hall of the Ministry of Finance. The audience including 11 staff members of the ministry’s budget
revenue, budget expenditure and taxation divisions was very interested in the methodology, potential
revenues collected and distributions schemes and expressed their support as long as a political
decision is made by the Parliament.
Key comments from consultations organized in aimags and soums:
LQSF is a good mechanism to leverage herders selling more animals to the market
It would be good if soums have own slaughter units
Cooperatives need to be strengthened to undertake its animal sales functions properly
Introduce a mechanism to discourage herders keeping more pastures beyond their needs
It is good to have independent source of financing risk pastureland management at soums
Gazing fees need to be imposed on all animals regardless of type of ownership
Simple language explanation materials need to be circulated to herders
Mechanisms to apply in cases of emergencies need to be carefully considered
The current level of around MNT 500 per sheep unit is a good estimate, however, poor
herders may need some types of concessions
Coefficients to convert sheep units may need to be different by ecological regions
Pastureland use agreements have been piloted successfully in the past, so needs to be
further promoted
Make sure that revenues are used by soums rather than going to aimag or state budget
It is good for herders to pay something to the local budget as they face difficulties in
claiming any assistance from the local budget as they have not paid anything in the past
Make sure that herders migrating to other soums because of emergency conditions are not
charged higher fees
Consider concessions in emergency cases such as outbreak of contagious diseases
Consider concessions in cases of high pressures of wildlife on pastures
Detailed information on consultation workshops/meetings is provided in Appendix 2.
Based on the recommendations from the consultation workshops and past experiences in promoting
various legislations the following is proposed.
Lobbying strategy
Given the short timeframe and limited finances, promotion documents to be circulated through mass
and social media, forums and workshops are proposed as the most suitable methods of lobbying.
Promotion documents will make a good starting point for lobbying and provide detailed information
on the proposed grazing fee system. The evidence of support provided by herders and local

28
governments to various elements of the proposed system (proxy grazing fee, LRMF, pastureland use
agreements etc.) as expressed in the surveys organized in the past should be an essential part of the
promotion documents. The documents will be prepared on specific key points of the system and its
benefits to all key stakeholders-the government, local government, herders, others in the private
sector.
There should an effort (by donors and civil society organizations) to facilitate the establishment of a
specific Working Group including representatives from key ministries such as:
Ministry of Food, Agriculture and Light Industry (MOFALI)
Ministry of Environment and Tourism Development
Ministry of Finance
Agency for Land Relations, Geodesy and Cartography, Ministry of Construction and Urban
Development
Representatives from relevant research and civil society organizations (candidates to be
consulted with key ministries)
A forum that can be administered by the Working Group to be led by one of the key ministries, perhaps
MOFALI, will make the lobbying a regular process through on-line promotion and regular meetings
with different interest groups including supporting donors.
Workshops are organized to promote the grazing fee system to different stakeholders including MPs,
ministries and agencies as well as local government representatives depending on the budget
availability.
The lobbying can be proposed to be undertaken through the following circular stages:
Develop lobbying plan
Implement the lobbying plan
Analyze lobbying results and report to the Working Group on a by-weekly basis
Provide feedback to stakeholders
Evaluate the success of the past lobbying activities and reflect in the future planning and
implementation
As suggested by consultation workshops, an appropriate NGO can be selected and contracted by
supporting donors (UNDP and others) to assist the Working Group (member government officials may
not have time for day to day operation) in day-to-day activities including hiring short-term consultants
and administering financial matters.
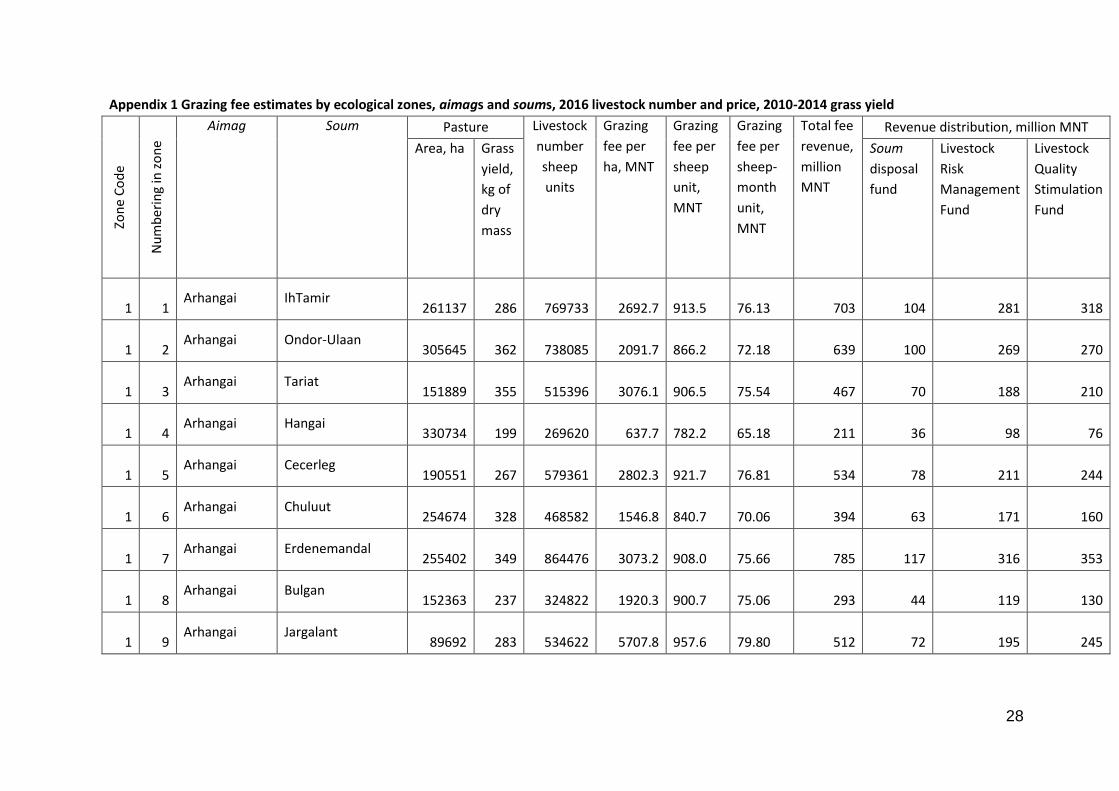
28
Appendix 1 Grazing fee estimates by ecological zones, aimags and soums, 2016 livestock number and price, 2010-2014 grass yield Zo
ne
Co
de
Nu
mb
erin
g in
zo
ne
Aimag Soum Pasture Livestock
number
sheep
units
Grazing
fee per
ha, MNT
Grazing
fee per
sheep
unit,
MNT
Grazing
fee per
sheep-
month
unit,
MNT
Total fee
revenue,
million
MNT
Revenue distribution, million MNT
Area, ha Grass
yield,
kg of
dry
mass
Soum
disposal
fund
Livestock
Risk
Management
Fund
Livestock
Quality
Stimulation
Fund
1 1 Arhangai IhTamir
261137 286 769733 2692.7
913.5
76.13 703 104 281 318
1 2 Arhangai Ondor-Ulaan
305645 362 738085 2091.7
866.2
72.18 639 100 269 270
1 3 Arhangai Tariat
151889 355 515396 3076.1
906.5
75.54 467 70 188 210
1 4 Arhangai Hangai
330734 199 269620 637.7
782.2
65.18 211 36 98 76
1 5 Arhangai Cecerleg
190551 267 579361 2802.3
921.7
76.81 534 78 211 244
1 6 Arhangai Chuluut
254674 328 468582 1546.8
840.7
70.06 394 63 171 160
1 7 Arhangai Erdenemandal
255402 349 864476 3073.2
908.0
75.66 785 117 316 353
1 8 Arhangai Bulgan
152363 237 324822 1920.3
900.7
75.06 293 44 119 130
1 9 Arhangai Jargalant
89692 283 534622 5707.8
957.6
79.80 512 72 195 245
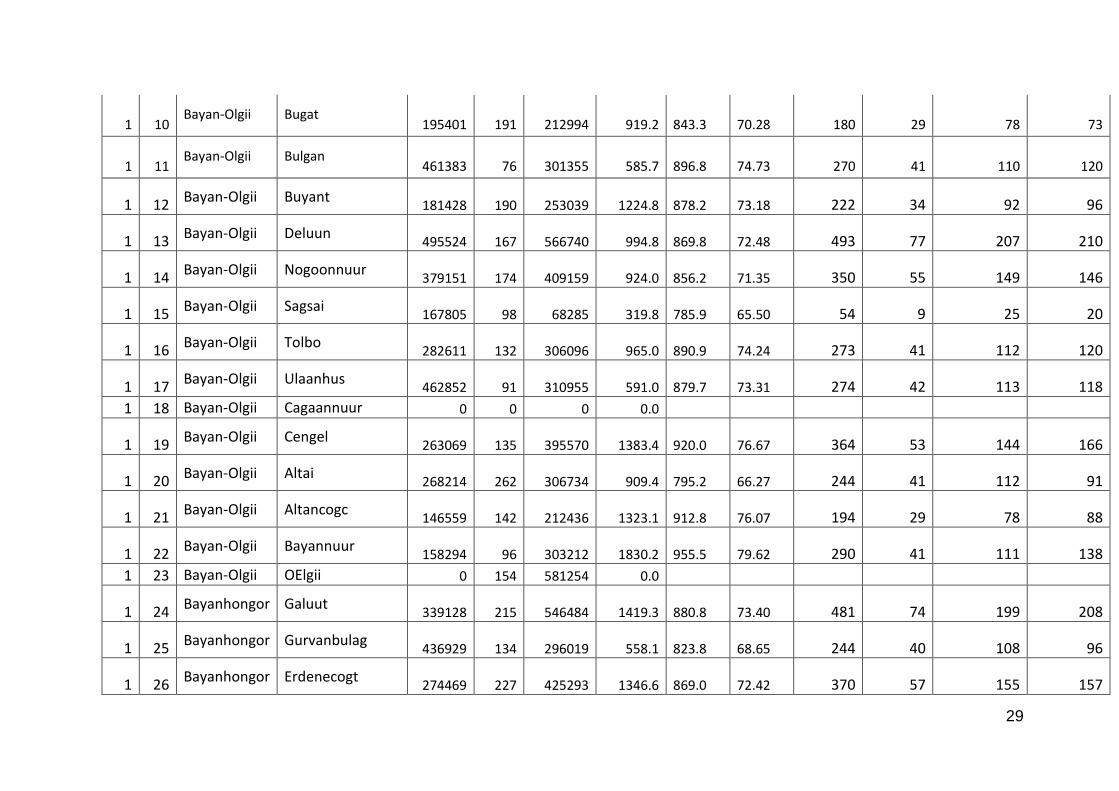
29
1 10 Bayan-Olgii Bugat
195401 191 212994 919.2
843.3
70.28 180 29 78 73
1 11 Bayan-Olgii Bulgan
461383 76 301355 585.7
896.8
74.73 270 41 110 120
1 12 Bayan-Olgii Buyant
181428 190 253039 1224.8 878.2
73.18 222 34 92 96
1 13 Bayan-Olgii Deluun
495524 167 566740 994.8 869.8
72.48 493 77 207 210
1 14 Bayan-Olgii Nogoonnuur
379151 174 409159 924.0 856.2
71.35 350 55 149 146
1 15 Bayan-Olgii Sagsai
167805 98 68285 319.8 785.9
65.50 54 9 25 20
1 16 Bayan-Olgii Tolbo
282611 132 306096 965.0 890.9
74.24 273 41 112 120
1 17 Bayan-Olgii Ulaanhus
462852 91 310955 591.0 879.7
73.31 274 42 113 118
1 18 Bayan-Olgii Cagaannuur 0 0 0 0.0
1 19 Bayan-Olgii Cengel
263069 135 395570 1383.4 920.0
76.67 364 53 144 166
1 20 Bayan-Olgii Altai
268214 262 306734 909.4 795.2
66.27 244 41 112 91
1 21 Bayan-Olgii Altancogc
146559 142 212436 1323.1 912.8
76.07 194 29 78 88
1 22 Bayan-Olgii Bayannuur
158294 96 303212 1830.2 955.5
79.62 290 41 111 138
1 23 Bayan-Olgii OElgii 0 154 581254 0.0
1 24 Bayanhongor Galuut
339128 215 546484 1419.3 880.8
73.40 481 74 199 208
1 25 Bayanhongor Gurvanbulag
436929 134 296019 558.1 823.8
68.65 244 40 108 96
1 26 Bayanhongor Erdenecogt
274469 227 425293 1346.6 869.0
72.42 370 57 155 157

30
1 27 Zavhan Bayanhairhan
226504 230 191745 641.5 757.8
63.15 145 26 70 49
1 28 Zavhan Ider
146203 252 486315 3101.6 932.5
77.70 453 66 178 210
1 29 Zavhan Ih-Uul
172342 327 259327 1212.8 806.0
67.17 209 35 95 79
1 30 Zavhan Nomrog
284788 250 368210 1069.3 827.0
68.92 305 50 134 120
1 31 Zavhan Otgon
570140 403 285977 359.8 717.4
59.78 205 39 104 62
1 32 Zavhan Songino
242694 307 384049 1308.7 827.0
68.92 318 52 140 126
1 33 Zavhan Tosoncengel 220837 247 223169 790.4
782.2
65.18 175 30 81 63
1 34 Zavhan Tuedevtei
250748 154 322740 1149.5 893.1
74.42 288 44 118 127
1 35 Zavhan Telmen 307894 251 234843 538.5
706.0
58.84 166 32 86 48
1 36 Zavhan Tes 62962 359 195406 2782.8
896.7
74.72 175 26 71 78
1 37 Zavhan Cecen-Uul
230442 220 208032 706.2 782.3
65.19 163 28 76 59
1 38 Zavhan Bayantes
376033 176 242905 488.9 756.8
63.07 184 33 89 62
1 39 Zavhan uliastai 0 183 154509 0.0
1 40 Zavhan Yaruu
479632 308 308706 368.5 572.5
47.71 177 42 113 22
1 41 Hovd Duut
212151 112 282137 1229.6 924.6
77.05 261 38 103 120
1 42 Hovd Monhhairhan
167804 86 237460 1338.6 946.0
78.83 225 32 87 106

31
1 43 Hovd Most
387525 78 397332 955.4 931.8
77.65 370 54 145 172
1 44 Hovd Ceceg
255251 66 287406 1066.8 947.5
78.96 272 39 105 129
1 45 Hovsgol Burentogtoh
251668 231 682010 2503.4 923.8
76.98 630 92 249 289
1 46 Hovsgol Galt
231680 161 747569 3082.5 955.3
79.61 714 101 273 340
1 47 Hovsgol Jargalant
120368 397 464540 3505.3 908.3
75.69 422 63 170 190
1 48 Hovsgol Renchinlhumbe
117924 499 374633 2731.2 859.7
71.64 322 51 137 135
1 49 Hovsgol Tomorbulag 182072 147 598430 3155.5
960.1
80.01 575 81 218 275
1 50 Hovsgol Ulaan-uul
242561 204 359334 1299.3 877.1
73.09 315 49 131 135
1 51 Hovsgol Hanh 10728 432 131257 11849.7
968.5
80.71 127 18 48 61
1 52 Hovsgol Hatgal 0 524 0 0.0
1 53 Hovsgol Cagaan-Uul
457434 358 744474 1307.9 803.6
66.97 598 101 272 226
1 54 Hovsgol Cagaan-Uur
4628 939 106340 22139.0 963.5
80.29 102 14 39 49
1 55 Hovsgol Cecerleg
349557 317 554111 1302.1 821.4
68.45 455 75 202 178
1 56 Hovsgol Candman'-Ondor
67286 305 163907 2164.0 888.3
74.03 146 22 60 64
1 57 Hovsgol Shine-Ider
152889 597 401229 2091.0 796.8
66.40 320 54 146 119
1 58 Hovsgol Alag-Erdene
194505 235 453250 2120.5 910.0
75.83 412 61 165 186

32
1 59 Hovsgol Arbulag
315407 177 578734 1677.1 914.0
76.17 529 78 211 240
1 60 Hovsgol Bayanzuerh
166893 368 441552 2317.4 875.9
72.99 387 60 161 166
2 1 Arhangai Tuvshruuleh
82427 870 292251 2820.4 795.5
66.29 232 39 107 86
2 2 Arhangai Hairhan
195487 263 670903 3213.2 936.3
78.02 628 91 245 293
2 3 Arhangai Cahir
271925 69 210594 716.6 925.3
77.11 195 28 77 90
2 4 Arhangai Cenher
135048 505 717975 4895.6 920.8
76.74 661 97 262 302
2 5 Arhangai Batcengel 315163 376 791353 2197.5
875.2
72.93 693 107 289 297
2 6 Arhangai Hotont
179228 595 710089 3465.8 874.8
72.90 621 96 259 266
2 7 Arhangai Cecerleg hot 0 469 438832 0.0
2 8 Bulgan Bureghangai
297388 295 639167 1903.8 885.8
73.82 566 86 233 247
2 9 Bulgan Mogod
241690 227 651705 2507.6 929.9
77.50 606 88 238 280
2 10 Bulgan Orhon
329457 251 778735 2154.8 911.6
75.97 710 105 284 321
2 11 Bulgan Saihan
246086 235 728631 2764.8 933.8
77.82 680 98 266 316
2 12 Bulgan Selenge
85633 442 233077 2353.1 864.5
72.05 202 31 85 85
2 13 Bulgan Teshig
38241 511 210670 5083.5 922.8
76.90 194 28 77 89
2 14 Bulgan Hishig-Ondor
206409 369 531242 2265.9 880.4
73.37 468 72 194 202
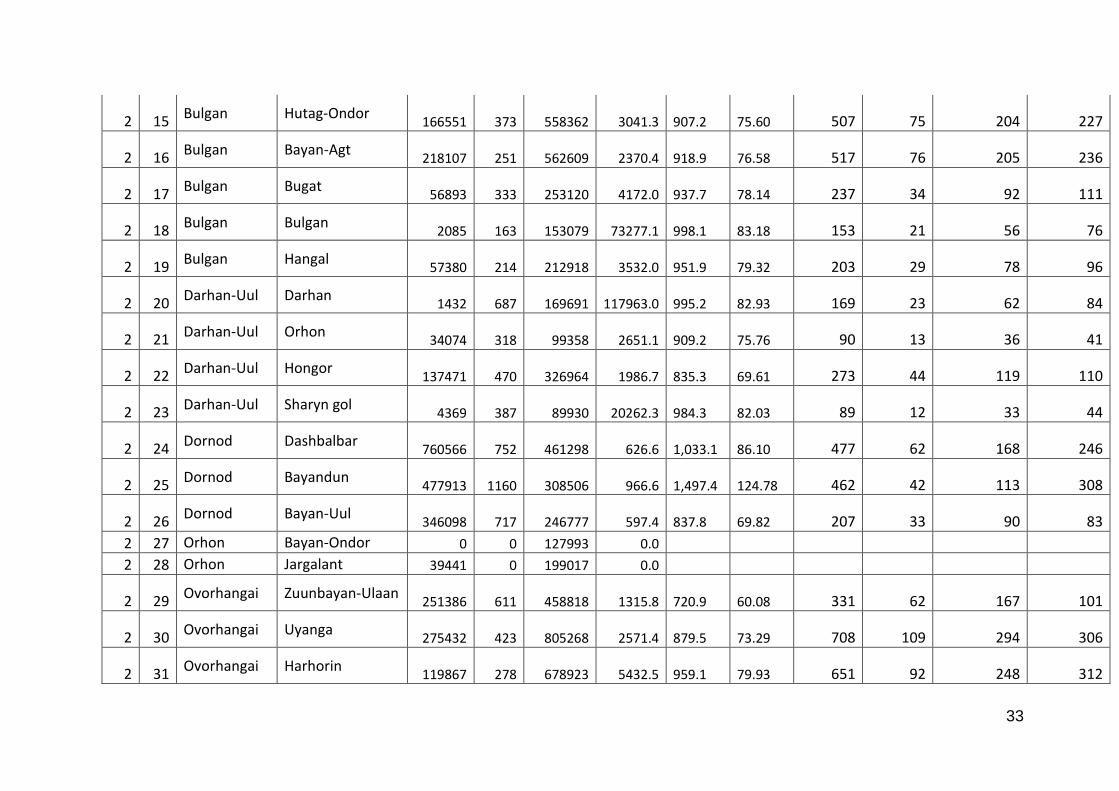
33
2 15 Bulgan Hutag-Ondor
166551 373 558362 3041.3 907.2
75.60 507 75 204 227
2 16 Bulgan Bayan-Agt
218107 251 562609 2370.4 918.9
76.58 517 76 205 236
2 17 Bulgan Bugat
56893 333 253120 4172.0 937.7
78.14 237 34 92 111
2 18 Bulgan Bulgan
2085 163 153079 73277.1 998.1
83.18 153 21 56 76
2 19 Bulgan Hangal
57380 214 212918 3532.0 951.9
79.32 203 29 78 96
2 20 Darhan-Uul Darhan
1432 687 169691 117963.0 995.2
82.93 169 23 62 84
2 21 Darhan-Uul Orhon 34074 318 99358 2651.1
909.2
75.76 90 13 36 41
2 22 Darhan-Uul Hongor
137471 470 326964 1986.7 835.3
69.61 273 44 119 110
2 23 Darhan-Uul Sharyn gol 4369 387 89930 20262.3
984.3
82.03 89 12 33 44
2 24 Dornod Dashbalbar 760566 752 461298 626.6
1,033.1
86.10 477 62 168 246
2 25 Dornod Bayandun
477913 1160 308506 966.6 1,497.4
124.78 462 42 113 308
2 26 Dornod Bayan-Uul
346098 717 246777 597.4 837.8
69.82 207 33 90 83
2 27 Orhon Bayan-Ondor 0 0 127993 0.0
2 28 Orhon Jargalant 39441 0 199017 0.0
2 29 Ovorhangai Zuunbayan-Ulaan
251386 611 458818 1315.8 720.9
60.08 331 62 167 101
2 30 Ovorhangai Uyanga
275432 423 805268 2571.4 879.5
73.29 708 109 294 306
2 31 Ovorhangai Harhorin
119867 278 678923 5432.5 959.1
79.93 651 92 248 312

34
2 32 Ovorhangai Hujirt
122562 472 591545 4432.8 918.4
76.54 543 80 216 248
2 33 Ovorhangai Arvaiheer
5469 104 491692 89825.3 999.0
83.25 491 66 179 245
2 34 Ovorhangai Bat-Olzii
32672 698 596922 17688.4 968.2
80.68 578 81 218 279
2 35 Selenge Hushaat
125213 397 149089 859.8 722.1
60.17 108 20 54 33
2 36 Selenge Yroo
151616 867 174432 722.9 628.3
52.36 110 24 64 22
2 37 Selenge Javhlant
73528 523 194538 2209.6 835.2
69.60 162 26 71 65
2 38 Selenge Zuunburen 77451 664 154035 1435.1
721.6
60.13 111 21 56 34
2 39 Selenge Mandal
106131 830 328894 2407.3 776.8
64.73 255 44 120 91
2 40 Selenge Orhon 87132 258 228909 2412.1
918.2
76.51 210 31 84 96
2 41 Selenge Orhontuul 234405 565 447489 1438.0
753.3
62.77 337 60 163 113
2 42 Selenge Saihan
88362 347 206100 2043.5 876.1
73.01 181 28 75 78
2 43 Selenge Sant
95421 414 169886 1435.2 806.1
67.18 137 23 62 52
2 44 Selenge Tueshig
46789 631 111526 1858.0 779.5
64.96 87 15 41 31
2 45 Selenge Cagaannuur
188665 309 312576 1399.6 844.7
70.40 264 42 114 108
2 46 Selenge Saamar
16717 233 60563 3428.3 946.3
78.86 57 8 22 27
2 47 Selenge Altanbulag
44 250 104443 0.0 999.9
83.33

35
2 48 Selenge Baruunbueren
145247 487 366090 2114.5 838.9
69.91 307 49 134 124
2 49 Selenge Bayangol
134357 491 309203 1891.8 822.0
68.50 254 42 113 100
2 50 Selenge Suhbaatar
890 204 55717 62447.0 997.3
83.11
2 51 Selenge Huder
44773 1044 87165 1077.1 553.2
46.10 48 12 32 5
2 52 Tov Batsuember
82325 610 207275 2009.2 798.0
66.50 165 28 76 62
2 53 Tov Bayandelger
166222 458 386480 1943.8 836.0
69.67 323 52 141 130
2 54 Tov Bayancogt 105218 505 223458 1702.9
801.8
66.82 179 30 82 67
2 55 Tov Bayanchandman'
40782 465 117803 2501.1 865.8
72.15 102 16 43 43
2 56 Tov Jargalant 99396 361 335639 3076.1
911.0
75.91 306 45 123 138
2 57 Tov Zaamar 238169 551 548053 1842.3
800.6
66.72 439 74 200 165
2 58 Tov Mongonmor't
86878 327 227594 2347.2 896.0
74.67 204 31 83 90
2 59 Tov Sumber
22541 378 90505 3700.0 921.5
76.79 83 12 33 38
2 60 Tov Sergelen
347121 400 378116 756.0 694.1
57.84 262 51 138 73
2 61 Tov Ceel
107609 318 288227 2413.4 901.0
75.09 260 39 105 116
2 62 Tov Erdene
131697 368 433102 2981.9 906.7
75.56 393 58 158 176
2 63 Tov Altanbulag
480522 465 634365 933.1 706.8
58.90 448 86 232 131

36
2 64 Tov Argalant
84408 324 212467 2247.2 892.8
74.40 190 29 78 83
2 65 Tov Bornuur
62874 393 275259 4050.6 925.2
77.10 255 37 100 117
2 66 Tov Zuunmod 0 215 178242 0.0
2 67 Tov Ugtaal
104428 538 270314 2140.5 826.9
68.91 224 36 99 88
2 68 Hovsgol Ih-Uul
112096 584 561290 4520.8 902.9
75.24 507 76 205 226
2 69 Hovsgol Rashaant
120077 499 439105 3240.9 886.2
73.85 389 59 160 170
2 70 Hovsgol Tarialan
150794 526 439052 2473.6 849.6
70.80 373 59 160 153
2 71 Hovsgol Tosoncengel
162276 448 567557 3124.4 893.3
74.44 507 77 207 223
2 72 Hovsgol Erdenebulgan
147 619 201276 999.6
83.30 201 27 73 101
2 73 Hovsgol Moron
8065 383 406499 50084.7 993.7
82.81 404 55 148 201
2 74 Hovsgol Tunel
229622 290 443509 1689.7 874.8
72.90 388 60 162 166
2 75 Hentii Binder
389686 462 450261 770.1 666.5
55.54 300 61 164 75
2 76 Hentii Dadal
162883 616 123477 513.4 677.3
56.44 84 17 45 22
2 77 Hentii Norovlin
390618 569 284800 474.5 650.8
54.24 185 38 104 43
2 78 Hentii Omnodelger
506844 420 960163 1544.4 815.2
67.94 783 130 350 303
2 79 Hentii Cenhermandal
186798 468 427824 1900.4 829.8
69.15 355 58 156 141

37
2 80 Hentii Batshireet
126109 539 176730 952.0 679.3
56.61 120 24 65 32
2 81 Hentii Bayan-Adraga
253860 336 264180 760.3 730.6
60.88 193 36 96 61
3 1 Bulgan Bayannuur
76091 153 253966 3214.3 963.0
80.25 245 34 93 118
3 2 Arhangai Ogiinuur
158768 107 571894 3515.7 976.0
81.33 558 77 209 272
3 3 Arhangai Olziit
161702 323 557675 3188.4 924.5
77.04 516 75 204 237
3 4 Arhangai Hashaat
251003 155 629701 2383.6 950.1
79.18 598 85 230 283
3 5 Bayanhongor Bayan-Ovoo 321726 127 445529 1282.7
926.3
77.19 413 60 163 190
3 6 Bayanhongor Bombogor
292377 94 518022 1695.8 957.1
79.76 496 70 189 237
3 7 Bayanhongor Zag 251710 122 292029 1061.5
915.0
76.25 267 39 107 121
3 8 Bayanhongor Olziit 382388 105 531297 1304.8
939.1
78.26 499 72 194 233
3 9 Bayanhongor Huereemaral
424420 201 364577 696.8 811.2
67.60 296 49 133 113
3 10 Bayanhongor Bayanbulag
315700 172 211789 532.5 793.7
66.14 168 29 77 62
3 11 Bayanhongor Bayanhongor
4783 67 372123 77755.0 999.3
83.28 372 50 136 186
3 12 Bayanhongor Jargalant
402765 249 334596 629.5 757.8
63.15 254 45 122 86
3 13 Bulgan Gurvanbulag
213971 225 669908 2949.5 942.1
78.51 631 90 245 296
3 14 Bulgan Dashinchilen
206097 167 514210 2360.0 945.9
78.82 486 69 188 229

38
3 15 Bulgan Rashaant
72443 184 392666 5271.8 972.6
81.05 382 53 143 186
3 16 Gov'suember Bayantal
83998 225 119169 1237.3 872.1
72.68 104 16 43 44
3 17 Gov'suember Suember
300462 167 561681 1734.7 928.0
77.33 521 76 205 240
3 18 Gov'suember Shiveegov'
81844 184 78701 813.2 845.7
70.47 67 11 29 27
3 19 Dornogov' Ihhet
409445 156 59305 126.2 871.3
72.61 52 8 22 22
3 20 Dornogov' Dalanjargalan
370875 141 287071 660.6 853.5
71.12 245 39 105 101
3 21 Dornod Bulgan 672244 752 271521 606.1
1,500.5
125.04 407 37 99 272
3 22 Dornod Gurvanzagal
388566 903 270494 728.2 1,046.1
87.18 283 37 99 148
3 23 Dornod Matad 1943453 672 355497 542.1
2,963.7
246.98 1054 48 130 876
3 24 Dornod Sergelen 241130 821 343875 763.7
535.5
44.62 184 46 126 12
3 25 Dornod Halhgol
828837 849 180148 684.9 3,150.9
262.58 568 24 66 478
3 26 Dornod Holonbuir
241511 960 263921 773.8 708.1
59.01 187 36 96 55
3 27 Dornod Cagaan-Ovoo
353219 769 387846 620.0 564.6
47.05 219 52 142 25
3 28 Dornod Choibalsan
687746 881 281090 710.7 1,738.8
144.90 489 38 103 348
3 29 Dornod Bayantuemen
651291 549 354244 443.1 814.6
67.88 289 48 129 111
3 30 Dornod Herlen 0 1171 419774 0.0
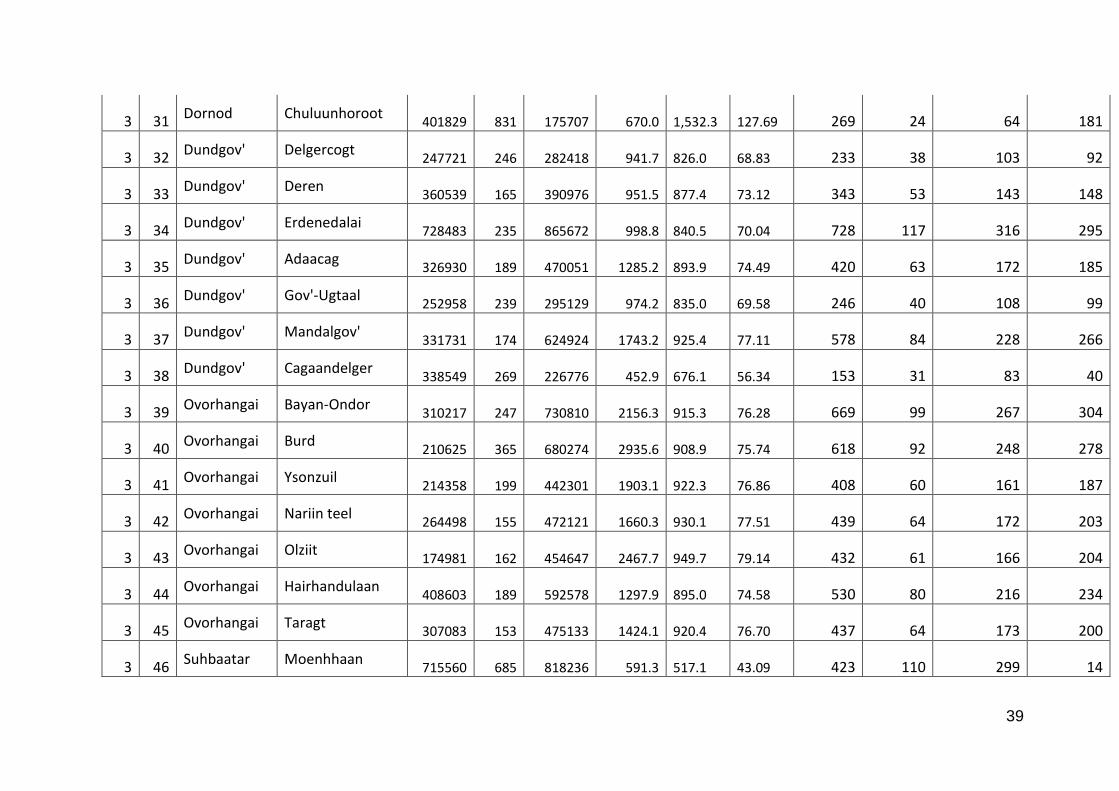
39
3 31 Dornod Chuluunhoroot
401829 831 175707 670.0 1,532.3
127.69 269 24 64 181
3 32 Dundgov' Delgercogt
247721 246 282418 941.7 826.0
68.83 233 38 103 92
3 33 Dundgov' Deren
360539 165 390976 951.5 877.4
73.12 343 53 143 148
3 34 Dundgov' Erdenedalai
728483 235 865672 998.8 840.5
70.04 728 117 316 295
3 35 Dundgov' Adaacag
326930 189 470051 1285.2 893.9
74.49 420 63 172 185
3 36 Dundgov' Gov'-Ugtaal
252958 239 295129 974.2 835.0
69.58 246 40 108 99
3 37 Dundgov' Mandalgov' 331731 174 624924 1743.2
925.4
77.11 578 84 228 266
3 38 Dundgov' Cagaandelger
338549 269 226776 452.9 676.1
56.34 153 31 83 40
3 39 Ovorhangai Bayan-Ondor 310217 247 730810 2156.3
915.3
76.28 669 99 267 304
3 40 Ovorhangai Burd 210625 365 680274 2935.6
908.9
75.74 618 92 248 278
3 41 Ovorhangai Ysonzuil
214358 199 442301 1903.1 922.3
76.86 408 60 161 187
3 42 Ovorhangai Nariin teel
264498 155 472121 1660.3 930.1
77.51 439 64 172 203
3 43 Ovorhangai Olziit
174981 162 454647 2467.7 949.7
79.14 432 61 166 204
3 44 Ovorhangai Hairhandulaan
408603 189 592578 1297.9 895.0
74.58 530 80 216 234
3 45 Ovorhangai Taragt
307083 153 475133 1424.1 920.4
76.70 437 64 173 200
3 46 Suhbaatar Moenhhaan
715560 685 818236 591.3 517.1
43.09 423 110 299 14

40
3 47 Suhbaatar Naran
189230 488 243786 894.6 694.4
57.87 169 33 89 47
3 48 Suhbaatar Ongon
542558 458 495440 544.0 595.7
49.64 295 67 181 47
3 49 Suhbaatar Suhbaatar 1239659 782 513459 630.7
3 50 Suhbaatar Tumencogt
178276 824 276481 886.1 571.4
47.61 158 37 101 20
3 51 Suhbaatar Uulbayan
490220 330 468453 689.6 721.6
60.13 338 63 171 104
3 52 Suhbaatar Halzan
373715 412 304335 482.3 592.2
49.35 180 41 111 28
3 53 Suhbaatar Erdenecagaan
1294013 544 700563 438.6 810.1
67.51 568 95 256 217
3 54 Suhbaatar Asgat
703526 676 324402 545.3 1,182.6
98.55 384 44 118 221
3 55 Suhbaatar Baruun-Urt 0 489 821831 0.0
3 56 Suhbaatar Dar'ganga
318490 418 428940 1009.4 749.5
62.46 321 58 157 107
3 57 Hentii Bayanmonh
244183 471 349065 1050.1 734.6
61.21 256 47 127 82
3 58 Hentii Bayan-Ovoo
220172 717 345390 990.5 631.4
52.61 218 47 126 45
3 59 Hentii Bayanhutag
550882 528 752886 941.0 688.5
57.38 518 102 275 142
3 60 Hentii Bor-Ondor 0 0 144908 0.0
3 61 Hentii Galshar
648093 301 600812 684.2 738.0
61.50 443 81 219 143
3 62 Hentii Darhan
399835 529 440659 675.7 613.1
51.09 270 59 161 50
3 63 Hentii Delgerhaan 191211 449 1270989 6284.6
945.5
78.79 1202 172 464 566

41
3 64 Hentii Jargalthaan
242573 443 425690 1397.7 796.5
66.37 339 57 155 126
3 65 Hentii Batnorov
475245 473 758879 1215.2 761.0
63.42 578 102 277 198
3 66 Hentii OElziit
197596 657 373646 1361.1 719.8
59.98 269 50 136 82
3 67 Hentii OEndoerhaan 324598 607 0 0.0
3 68 Tov Bayan
266585 317 336640 1006.9 797.4
66.45 268 45 123 100
3 69 Tov Bayanjargalan
233046 352 421893 1526.3 843.1
70.26 356 57 154 145
3 70 Tov Bayan-Onjuul
470897 276 681869 1225.5 846.3
70.53 577 92 249 236
3 71 Tov Bayanhangai
54135 211 181515 3182.8 949.2
79.10 172 25 66 82
3 72 Tov Bayancagaan
641808 279 521109 586.8 722.7
60.23 377 70 190 116
3 73 Tov Bueren
372001 419 659054 1434.0 809.4
67.45 533 89 241 204
3 74 Tov Delgerhaan
208770 265 346363 1445.5 871.3
72.61 302 47 126 129
3 75 Tov Lun
232573 253 499781 1945.3 905.2
75.44 452 67 182 203
3 76 Tov Ondorshireet
253974 324 494137 1684.1 865.6
72.13 428 67 180 181
3 77 Tov Erdenesant
251384 395 839383 3020.8 904.7
75.39 759 113 306 340
3 78 Tov Arhust
54482 520 132137 2006.2 827.2
68.93 109 18 48 43
4 1 Bayanhongor Bayanlig
690332 63 458663 597.8 899.8
74.98 413 62 167 183

42
4 2 Bayanhongor Bayan-Ondor
610775 47 363324 544.9 916.0
76.33 333 49 133 151
4 3 Bayanhongor Bayancagaan
538217 91 494409 821.7 894.5
74.54 442 67 180 195
4 4 Bayanhongor Bogd
383356 116 487928 1149.0 902.8
75.23 440 66 178 197
4 5 Bayanhongor Buucagaan
537253 139 591727 953.7 865.9
72.16 512 80 216 217
4 6 Bayanhongor Jinst
522884 83 415090 705.3 888.5
74.04 369 56 152 161
4 7 Bayanhongor Shinejinst
990491 57 371715 314.1 837.0
69.75 311 50 136 125
4 8 Bayanhongor Baacagaan 715555 55 717016 943.5
941.5
78.46 675 97 262 317
4 9 Bayanhongor Bayangov'
424512 113 422560 875.0 879.0
73.25 371 57 154 160
4 10 Gov'-Altai Hohmor't 467584 94 466302 897.0
899.5
74.96 419 63 170 186
4 11 Dornogov' Delgereh 478568 148 345063 563.4
781.4
65.12 270 47 126 97
4 12 Dornogov' Zamyn-Uud
14790 59 59305 3947.0 984.3
82.03 58 8 22 29
4 13 Dornogov' Mandah
1216671 46 278260 180.1 787.6
65.64 219 38 102 80
4 14 Dornogov' Orgon
837859 81 270811 237.3 734.1
61.18 199 37 99 63
4 15 Dornogov' Saihandulaan
940917 68 227930 170.1 702.2
58.52 160 31 83 46
4 16 Dornogov' Ulaanbadrah
1035732 59 271718 199.8 761.7
63.47 207 37 99 71
4 17 Dornogov' Hatanbulag
904910 33 433689 444.5 927.4
77.29 402 59 158 185

43
4 18 Dornogov' Hovsgol
754038 39 230037 263.5 863.8
71.98 199 31 84 84
4 19 Dornogov' Airag
698776 115 236804 216.4 638.6
53.21 151 32 86 33
4 20 Dornogov' Altanshiree
703951 76 217455 227.7 737.2
61.44 160 29 79 52
4 21 Dornogov' Sainshand
121447 54 198688 1578.3 964.7
80.39 192 27 73 92
4 22 Dornogov' Erdene
746684 88 265223 261.8 737.0
61.42 195 36 97 63
4 23 Dundgov' Gurvansaihan
514805 68 370517 647.9 900.2
75.02 334 50 135 148
4 24 Dundgov' Delgerhangai 617693 138 286810 318.0
684.8
57.07 196 39 105 53
4 25 Dundgov' Luus
313059 135 282545 759.1 841.1
70.09 238 38 103 96
4 26 Dundgov' Olziit 1288877 51 427652 277.5
836.3
69.69 358 58 156 144
4 27 Dundgov' Ondorshil 482462 172 258067 351.9
657.9
54.82 170 35 94 41
4 28 Dundgov' Saihan-Ovoo
400683 164 292221 554.7 760.6
63.39 222 39 107 76
4 29 Dundgov' Huld
602980 161 408929 506.7 747.1
62.26 306 55 149 101
4 30 Dundgov' Bayanjargalan
307073 96 181405 488.2 826.4
68.87 150 24 66 59
4 31 Zavhan Dorvoljin
702996 150 237083 177.3 525.9
43.82 125 32 87 6
4 32 Zavhan Urgamal
345967 253 237378 417.3 608.2
50.68 144 32 87 26
4 33 Ovorhangai Bogd
960421 77 800095 751.1 901.6
75.14 721 108 292 321

44
4 34 Ovorhangai Guchin-Us
463607 85 400536 773.8 895.6
74.63 359 54 146 158
4 35 Ovorhangai Sant
254286 97 486715 1811.4 946.4
78.86 461 66 178 217
4 36 Ovorhangai Toegroeg
531070 329 338148 349.9 549.6
45.80 186 46 123 17
4 37 Ovorhangai
Baruun bayan-Ulaan 387219 86 393300 924.7
910.4
75.87 358 53 144 161
4 38 Ovorhangai Bayangol
351202 142 635157 1657.6 916.5
76.38 582 86 232 265
4 39 Omnogov' Gurvantes
1411408 50 380051 215.8 801.6
66.80 305 51 139 115
4 40 Omnogov' Mandal-Ovoo
578965 45 326010 515.1 914.7
76.23 298 44 119 135
4 41 Omnogov' Manlai
1017193 93 343535 239.1 707.9
58.99 243 46 125 71
4 42 Omnogov' Noyon
931043 47 246703 214.7 810.2
67.52 200 33 90 77
4 43 Omnogov' Nomgon
1020161 88 539298 435.5 823.8
68.65 444 73 197 175
4 44 Omnogov' Sevrei
138385 41 328400 2329.6 981.7
81.81 322 44 120 158
4 45 Omnogov' Hanbogd
1104628 41 345096 268.6 859.8
71.65 297 47 126 124
4 46 Omnogov' Hanhongor
815625 96 407954 398.3 796.3
66.36 325 55 149 121
4 47 Omnogov' Hurmen
1054637 80 305193 204.6 707.0
58.92 216 41 111 63
4 48 Omnogov' Cogtcecii
684951 52 217545 262.2 825.6
68.80 180 29 79 71
4 49 Omnogov' Bayandalai
691590 86 372052 446.5 829.9
69.16 309 50 136 123

45
4 50 Omnogov' Bayan-Ovoo
518239 56 261230 444.8 882.4
73.53 231 35 95 100
4 51 Omnogov' Bulgan
489170 81 322188 572.7 869.5
72.45 280 43 118 119
4 52 Omnogov' Dalanzadgad
39072 136 189085 4695.1 970.2
80.85 183 26 69 89
4 53 Omnogov' Cogt-Ovoo
577219 77 209260 280.3 773.3
64.44 162 28 76 57
4 54 Suhbaatar Tovshinshiree
431819 319 534889 899.2 725.9
60.49 388 72 195 121
4 55 Suhbaatar Bayandelger
726382 317 662473 575.1 630.6
52.55 418 89 242 86
4 56 Uvs Zavhan 275102 61 220147 735.7
919.3
76.61 202 30 80 92
4 57 Uvs Zuungov'
188329 176 221301 987.7 840.5
70.04 186 30 81 75
4 58 Uvs Naranbulag 505725 92 366598 627.1
865.0
72.09 317 49 134 134
4 59 Uvs Olgii 229978 66 207200 831.1
922.5
76.87 191 28 76 88
4 60 Uvs Omnogov'
272166 137 346913 1128.5 885.3
73.78 307 47 127 134
5 1 Gov'-Altai Bugat
728258 57 280125 324.3 843.1
70.26 236 38 102 96
5 2 Gov'-Altai Taishir
380691 136 308565 665.6 821.2
68.43 253 42 113 99
5 3 Gov'-Altai Darvi
302607 226 369428 980.3 803.0
66.91 297 50 135 112
5 4 Gov'-Altai Delger
655604 87 484060 645.4 874.1
72.85 423 65 177 181
5 5 Gov'-Altai Jargalant
320735 118 404612 1136.1 900.5
75.05 364 55 148 162

46
5 6 Gov'-Altai Tonhil
516026 65 221443 359.8 838.5
69.87 186 30 81 75
5 7 Gov'-Altai Togrog
291578 158 432600 1316.0 887.0
73.91 384 58 158 167
5 8 Gov'-Altai Haliun
277891 182 303855 899.7 822.8
68.57 250 41 111 98
5 9 Gov'-Altai Ceel
513230 116 525237 899.8 879.2
73.27 462 71 192 199
5 10 Gov'-Altai Chandman'
460178 138 382767 684.8 823.3
68.61 315 52 140 124
5 11 Gov'-Altai Sarga
488753 160 367851 582.9 774.5
64.54 285 50 134 101
5 12 Gov'-Altai Erdene 406544 83 335192 736.2
893.0
74.41 299 45 122 132
5 13 Gov'-Altai Ajbogd
865835 140 214392 149.3 602.8
50.23 129 29 78 22
5 14 Gov'-Altai Bayan-Uul 495488 196 460043 719.7
775.2
64.60 357 62 168 127
5 15 Gov'-Altai Biger 351109 84 349090 905.0
910.2
75.85 318 47 127 143
5 16 Gov'-Altai Altai
208635 103 478198 2182.6 952.2
79.35 455 65 175 216
5 17 Gov'-Altai Cogt
603786 52 325824 483.8 896.6
74.72 292 44 119 129
5 18 Zavhan Zavhanmandal
291533 202 255740 662.6 755.4
62.95 193 35 93 65
5 19 Zavhan Santmargac
230100 221 189343 588.2 714.8
59.57 135 26 69 41
5 20 Zavhan Cagaanhairhan
253230 323 175408 349.4 504.4
42.03 88 24 64 1
5 21 Zavhan Cagaanchuluut
252142 281 252115 700.7 700.8
58.40 177 34 92 51

47
5 22 Zavhan Shiluustei
266624 178 333133 1059.6 848.1
70.67 283 45 122 116
5 23 Zavhan Erdenehairhan
408889 251 308706 488.4 646.9
53.91 200 42 113 45
5 24 Zavhan Aldarhaan
563460 268 521077 639.5 691.5
57.62 360 70 190 100
5 25 Uvs Zueuenhangai
209357 147 282543 1193.7 884.5
73.71 250 38 103 109
5 26 Uvs Malchin
354657 147 248945 545.7 777.4
64.79 194 34 91 69
5 27 Uvs Ondorhangai
311239 171 354035 955.5 840.0
70.00 297 48 129 120
5 28 Uvs Sagil 255421 74 272796 989.1
926.1
77.18 253 37 100 116
5 29 Uvs Turgen
163136 43 220690 1307.2 966.3
80.52 213 30 81 103
5 30 Uvs Tes 151231 244 786534 4941.3
950.1
79.17 747 106 287 354
5 31 Uvs Hovd 260081 125 280027 943.8
876.6
73.05 245 38 102 105
5 32 Uvs Hyargas
291890 145 295898 859.9 848.2
70.69 251 40 108 103
5 33 Uvs Cagaanhairhan
329264 77 278478 763.4 902.7
75.22 251 38 102 112
5 34 Uvs Baruunturuun
38175 175 151008 3769.0 952.8
79.40 144 20 55 68
5 35 Uvs Boehmoeroen
310492 85 219988 618.5 873.0
72.75 192 30 80 82
5 36 Uvs Davst
162435 105 128769 680.8 858.7
71.56 111 17 47 46
5 37 Uvs Tarialan
224063 113 223031 875.6 879.6
73.30 196 30 81 85

48
5 38 Uvs Ulaangom
183811 59 343401 1805.9 966.7
80.55 332 46 125 160
5 39 Hovd Darvi
492837 177 435459 695.3 786.9
65.57 343 59 159 125
5 40 Hovd Dorgon
373423 63 272359 661.9 907.5
75.63 247 37 99 111
5 41 Hovd Zereg
247327 181 370876 1306.6 871.3
72.61 323 50 135 138
5 42 Hovd Manhan
358299 196 560349 1355.9 867.0
72.25 486 76 205 206
5 43 Hovd Myangad
309195 151 492775 1433.3 899.3
74.95 443 67 180 197
5 44 Hovd Uyench 300148 91 273643 815.1
894.1
74.51 245 37 100 108
5 45 Hovd Chandman'
525739 108 530770 894.9 886.4
73.87 470 72 194 205
5 46 Hovd Erdenebueren 160990 130 410958 2414.9
946.0
78.83 389 55 150 183
5 47 Hovd Altai 830037 77 308117 289.8
780.6
65.05 241 42 112 86
5 48 Hovd Bulgan
269736 173 523125 1755.2 905.0
75.42 473 71 191 212
5 49 Hovd Buyant
187626 163 423858 2085.7 923.3
76.94 391 57 155 179
5 50 Hovd Jargalant 0 40 244850 0.0
5 51 Hovd Hovd
231642 122 368113 1459.6 918.5
76.54 338 50 134 154
Zone code 1 1 High Mountain Data are missing for mostly aimag center soums which have no or very little pastureland
2 Forest Steppe
3 Steppe
4 Gobi

49
5 Depression of Great Lakes

48
Appendix 2 Records of consultation workshops
1. MOFALI Workshop 1
The consultation workshop titled “Establishing grazing fees as a sustainable green development mechanism for livestock husbandry” was held in the meeting hall of the MOFALI on January 4, 2018, starting at 15:00 and ending at 16:45.
The following individuals participated in the workshop: 1. Mr. Choi-Ish – Head, Department for the Livestock Policy Implementation
Coordination 2. Mr. Enkh-Amar – Head, Department for Strategic Policy and Planning 3. Mrs. Battsetseg –Head, Legal Division 4. Mrs. Suvd – Lead Specialist, Department for Strategic Policy and Planning 5. Mr.Amgalanbaatar – Head, the Inter-aimag Otor Pasture Administration 6. Mr. Byambadorj –Lead Specialist, Department for the Livestock Policy
Implementation Coordination 7. Mr. Munkhnasan- Specialist, Department for the Livestock Policy Implementation
Coordination 8. Mr. Munkhgerel – Specialist, Department for the Livestock Policy Implementation
Coordination 9. Ms. Zolzaya – Specialist, Inter-aimag Otor Pasture Administration 10. Mr. Enkh-Amgalan – Director, Center for Policy Research (CPR) 11. Mr. Erdenebaatar –Expert, CPR
A total of 11 individuals were present at the workshop. Discussion: A.Enkh-Amgalan, Director of the Center for Policy Research, introduced the workshop content titled “Establishing grazing fees as a sustainable green development mechanism for livestock husbandry” which is implemented under the scope of the “Biodiversity Funding Initiative” program of UNDP. The content was presented at this workshop to receive feedback from representatives of the MOFALI, a state organization overseeing pasture related issues. Mr.Amgalanbaatar, Enkh-Amar, L.Choi-Ish, Munkhnasan and G.Suvd asked questions to which the presenter responded.
Proposals issued by participants: Mr. Amgalanbaatar: There can be numerous requirements for establishing the grazing fee. Although one could argue that the more the requirements the better the coherence among the requirements may be, it is possible to set fewer and simpler requirements this time. If the soum pasture is to be distributed among herder organizations, it may be a good idea to increase the pasture area. However, this cannot be done among herder households; thus, herder groups are necessary.

49
Mr. Munkhnasan: It is wrong to cut the area size of pasture. Instead, it is better to distribute pasture among baghs and cause fewer potential disputes.
Mr. Enkh-Amar: I do not have any objections to the introduction of grazing fees. Since we may need to adjust the base rate of grazing fees depending on local pasture characteristics, it is important to carefully consider soum pasture quality conditions before finalizing any changes to the base rate. Again, I am in full support of the proposal.
Mrs. Suvd: As “The Animal Genetic Resources Protection” law passed shorty before New Year obligates all herders, livestock owners & economic entities to adapt their herd size and animal type to pasture carrying capacity, it is essential that the ministry prioritizes the implementation of this task. Although we are addressing this issue in a timely manner, herders face the risk of not fulfilling their legal obligations if we do not proceed quickly with the task at hand. Generally speaking, it is better to initiate a new legislation since the outcome of the “Pasture Protection” law is unpredictable at best and even if the law is passed, it is not possible to establish grazing fees as we currently aim to do so.
Mr. Choi-Ish delivered the closing statement to conclude the workshop. He emphasized that the support of grazing fees is not only limited to the Ministry and policy researchers. For instance, throughout the recent animal census meetings, many herders across many locations expressed their strong support for grazing fees and deemed it necessary that the government take decisive action to initiate its implementation. The following remarks were made regarding the points discussed at the workshop:
It is of utmost importance to discuss all factors affecting the establishment of grazing fees as well as the distribution and budget spending of grazing fee income before reaching a consensus.
As Mongolian herders value migration, including seasonal migration, as an important part of their cultural heritage, it is the right approach to consider this cultural aspect in the decision-making process.
The establishment of herder groups and the requirements of membership must be taken into account on both a communal & individual basis. It is important to avoid giving the wrong impression that group membership forces herders to settle and crowd together. As mentioned before, herder migration must remain a common practice.
Since there was no objection to the establishment of grazing fees from any of the workshop participants, MOFALI expects the issue to advance to the next stage of discussions.
It is better to assume that the proposal of grazing fees was initiated by MOFALI and presented by the government.
It is the correct approach to discuss how to integrate the matter into The “Pasture Protection” law which is still in the legislative drafting process.
The legal phrasing of the grazing fee must be formulated accurately to integrate the content produced by this workshop. If necessary, we may arrange another workshop session with MOFALI. This workshop concludes that the workshop participants support the proposal titled “Establishing grazing fees as a sustainable green development mechanism for livestock husbandry”
2. MOFALI Meeting 2

50
The meeting was held on 11 January 2018 at 15.30 at the room of Mr. Choi-Ish, Head, Department for the Livestock Policy Implementation Coordination and attended by Mr.Amgalanbaatar, Head, the Inter-aimag Otor Pasture Administration, Mr. Byambadorj, Lead Specialist, Department for the Livestock Policy Implementation Coordination, Ms. Zolzaya, Specialist, Inter-aimag Otor Pasture Administration and Mr. Enkh-Amgalan from CPR. The meeting objective was to discuss the legal solutions proposed by CPR to introduce grazing fees. Mr. Enkh-Amgalan has presented on the CPR proposal on legal solutions and others commented on it. Mr. Choi-Ish said that the proposed solutions are valuable and the MOFSLI consider them as one of potential ways to promote the grazing fee system. Mr. Amgalanbaatar commented that he has no objections against proposed solutions, however, other alternatives need to be discussed as well.
3. Workshop for the Ministry of Environment and Tourism Development (METD) The proposed grazing fee methodology and results have been discussed at the workshop organized on 10 January 2018 by the BIOFIN project for its steering committee members involving Mr. Batjargal, head of the Public Administration Department of METD, other staff members of METD as well as representatives from other ministries, agencies and UNDP staff members headed by Ms. Daniela Gasparikova, DRR UNDP. The presentation on the grazing fee methodology and results has been made by Mr. Enkh-Amgalan, followed by a few questions and comments. In general, the audience was supportive of the proposed methodology and key results.
4. Workshop among civil society organizations, researchers and donor projects The meeting was held in the meeting room of the Center for Policy Research on January 11, 2018. The presentation, on grazing fee methodology and key results, has been made Mr. Enkh-Amgalan followed by question/answer sessions and discussions. The following proposals were delivered by the participants: Mr. Munkh-Ireedui, Economic Research Institute (ERI) of the National University of Mongolia– It is advisable to further explain the methodology used to determine the income of herder households and the factors affecting the livelihood of herders. Some herders overstate the number of livestock they own in order to access bank loans. The income of herder households are higher than the income we determined in our study. Mrs. Bayarmaa, SDC Green Gold & Animal health Project –The Livestock Risk Management Fund fees are paid very well in the first year of the project implementation. However, we have noticed that the local administration tends to fall back on its duties. Hence, it is recommended to improve the implementation of the Livestock Risk Management Fund rules. Mrs.Urantulkhuur, Human rights development center, NGO– The proposals have been based on precise & specific research. Thus, the implementation of this work should continue. Mrs.Tserennadmid, Leopard Protection Fund– We specialize in cashmere projects. Most of the income of herders is attributed to cashmere. Today’s presentation seems to overstate the

51
income from meat. We propose that you consider the interest of herders to raise goats when adapting to the optimal pasture carrying capacity. Mr.Gankhuyag, TNC – I support the proposals that have been presented. In particular, I view it as the correct approach to implement the task at hand by utilizing the collaborative natural resource management partnership. As such, the legal environment should be reformed for implementation to take place. Name of list of participants, METD workshop
Mrs.Enkhee, WWF– Households with many livestock should pay more while households with fewer livestock should pay less for the grazing fee (progressive fee). Mrs.Oyuntulkhuur, UNDP Project Coordinator– Support views by Mrs. Enkhee. We must work to integrate the Risk Fund rules and the Livestock Risk Management Fund rules into one. . Mr. Ykhanbai, Jasil Association, NGO– I agree with the grazing fee methodology and the findings that have been presented. It is correct that grazing fees should be valued on the basis of the environmental impact livestock exert.

52
Mr. Chimed-Ochir, BIOFIN project advisor– We would like to give some information about the BIOFIN project and some clarification regarding the figures in the presentation. For instance, the herd size of households, the possibility of differentiating between herder households and households with livestock, and the legal environment in which the grazing fee income is allocated either to the aimag or the soum budget are all important points to consider. Furthermore, as we acknowledge the benefit of cooperation, preferably a NGO organization should act as a lead in lobbying the draft legislation. For example, the Mongolian Association for Pasture User groups comes to mind. On the other hand, UNDP has limitations in the lobbying process. Mr. Gankhuyag, Executive Director, Mongolian Association for Pasture User Groups: I support the aforementioned ideas. We will not insist to use a different terminology for “pasture user groups”. As of now, we are using the term “herder groups” in the draft legislation. We are willing to integrate the 2 terminologies if needed.
Mr. Enkh-Amgalan responded to issues raised by the workshop participants. As form income of herder households it is based on the herd turnover model and 2016 livestock number and prices. The detailed methodology for estimating herders income can be presented separately for interested parties including economists. There was suggestion to impose higher grazing fees on herders with many livestock. This is about introducing progressive grazing fee. The idea seems to be attractive at first sight, however, there are strong arguments against it. First, grazing is payment for the use of natural resources, but not income tax, sheep of richer herders ears the same amount of pasture forage as the sheep of poorer herders, so there is no basis to impose higher fee on animals of richer herders, second, grazing fee is increased if herders overgraze pastures, meaning increasing herd size beyond pasture carrying capacities is already taken into account, which some argue that big herds are already taken into account and progressive grazing fee is double counting, third, because of newly introduced taxes since 2018 the current political situation is to avoid any tax increases, so increasing fees for richer herders might seem inappropriate in the current situation. Because of these considerations we recommend that the progressive grazing fee be rejected for the time being. Mrs. Khishigjargal, UNDP
1. The grazing fee proposal has been successfully presented to the Minister of METD and we have received support. It is now important to focus on lobbying in order to create the necessary legal environment. We will reflect on the practical options discussed today; for instance, further assessing the possibility of charging a higher fee from herders with many livestock.
2. Launch rigorous promotion and advertising 3. Ensure the participation of donors and other institutions in the lobbying process 4. Coordinate the proposal with the draft Pastureland Protection Law working group’s
activities 5. Instead of using many interchangeable terms like groups or pasture user groups, it is
simpler to use the term “collaborative natural resource management partnership”. 6. Utilize social networks for the purpose of advertising
Name of list of participants, Workshop among civil society organizations, researchers and donor projects

53
No Name Organization Position
1 Mr.Munkh-Ireedui ERI of the National University of Mongolia
Researcher
2 Ms.Unurjargal ERI of the National University of Mongolia
Research
3 Mr.Chimed-Ochir BIOFIN project advisor Specialist
4 Mr.Lkhagvasuren Zulgen sor beef farm from Dornod aimag
Owner
5 Mrs.Urantulkhuur Human rights development center, NGO
Specialist
6 Mr.Gankhuyag Mongolian Association for Pasture User Groups
Executive Director
7 Ms.Tserennadmid Leopard Protection Fund Specialist
8 Ms.Munkhchuluun Leopard Protection Fund Specialist
9 Ms.Enkhtuvshin Leopard Protection Fund Specialist
10 Mrs. Bayarmaa SDC Green Gold & Animal Health Project
Specialist
11 Mr.Gankhuyag TNC Specialist
12 Mrs. Enkhee WWF Advisor
13 Ms.Khishigjargal UNDP Co Programme Analyst
14 Ms.Oyuntulkhuur UNDP Project Coordinator
15 Ms. Onon WCS Staff
16 Mr. Ykhanbai Jasil Association Director
17 Mr. Enkh-Amgalan Center for Policy Research Director
18 Mr. Boldsukh Center for Policy Research Staff
19 Mr.Ulambayar Center for Policy Research Staff
5. Ministry of Finance The workshop was organized on 19 January 2018 at the general meeting hall of the Ministry of Finance at 11.30-12.30. The attendants’ list is shown below. Mr. Enkh-Amgalan has introduced on the proposed grazing fee methodology and key results followed by questions/answers and discussions (presentation is attached in Annex 1). The Ministry of Finance audience was very interested in the methodology, potential revenues collected and distributions schemes and expressed their support as long as a political decision is made by the Parliament. Name of list of participants, Ministry of Finance
No Name Position 1. O.Khuyagtsogt Head, Budget Expenditure Division
2. T.Zolboo Specialist, Finance Policy and Planning Department
3. R.Myagmarjaw Specialist, Finance Policy and Planning Department

54
4. B.Bilguun Adviser, Finance Policy and Planning Department
5. B.Amartuvshin Specialist, Tax Management and Cooperation Department
6. G.Enkhdalai Specialist, Tax Revenue Department
7. N.Urantsetseg Specialist, Budget Expenditure Department
8. E.Enkhbat Specialist, Finance Policy and Planning Department
9. P.Bat-Erdene Specialist, Finance Policy and Planning Department
10. O.Otgontsetseg Specialist, Finance Policy and Planning Department
11. A.Enkh-Amgalan Director, CPR
12. Ts.Volodya Expert, CPR
13. A.Boldsukh Expert, CPR
14. O.Ulambayar Expert, CPR
15. B.Erdenebaatar Expert, CPR
Key comments from consultations organized in aimags and soums:
LQSF is a good mechanism to leverage herders selling more animals to the market
It would be good if soums have own slaughter units
Cooperatives need to be strengthened to undertake its animal sales functions properly
Introduce a mechanism to discourage herders keeping more pastures beyond their needs
It is good to have independent source of financing risk pastureland management at soums
Gazing fees need to be imposed on all animals regardless of type of ownership
Simple language explanation materials need to be circulated to herders
Mechanisms to apply in cases of emergencies need to be carefully considered
The current level of around MNT 500 per sheep unit is a good estimate, however, poor herders may need some types of concessions
Coefficients to convert sheep units may need to be different by ecological regions
Pastureland use agreements have been piloted successfully in the past, so needs to be further promoted
Make sure that revenues are used by soums rather than going to aimag or state budget
It is good for herders to pay something to the local budget as they face difficulties in claiming any assistance from the local budget as they have not paid anything in the past
Make sure that herders migrating to other soums because of emergency conditions are not charged higher fees
Consider concessions in emergency cases such as outbreak of contagious diseases
Consider concessions in cases of high pressures of wildlife on pastures
Name of list of participants, local governments and herders: Orkhontuul soum, Selenge aimag
Name Position
Soum Khural, Governor’s Office

55
Tuv aimag
No Name Position
1 Kh.Тuvshinjargal Division Head, Aimag Food & Agriculture
2 B.Nyamkhuu Local Coordinator
3 B.Ganbaatar Livestock Specialist
4 J.Rentsenbaatar Specialist for animal contagious diseases
5 М.Tsogjavkhaa Specialist, Aimag Land Agency
6 B.Zanabazar Specialist, Aimag Environmental Office
7 Bo. Byambatsogt Head, Strategic Policy and Planning Department, Aimag Governor’s Office
8 М.Tuya Livestock specialist
9 S.Saranmandal Livestock specialist
Undurshireet soum, Tuv aimag
1 B.Оtgontsetseg Secretary, Soum Khural
2 R.Davaa-Ochir Bag Governor
3 Ts.Sampilnorov Bag Governor
4 А.Delgersuren AHBU specialist
5 D.Lkahmsuren Treasury head
6 B.Byambadorj Environmental inspector
7 B.Sumyasugar Land officer
8 Ts.Оyun Head, Soum Pasture Users’ Association
1. L.Batbaatar Soum Governor
2.S.Jamsran Secretary, Soum Khural
3.P.Otgonbaatar Vice Governor
4.P.Tsagaan Head, AHBU
5.B.Oyunbold Land Officer
6.Sh. Ankhbayar Environmental Inspector
7.B.Batchimeg Public Relations Officer
8.G.Munkhtuya Ranger
9.D.Naranbaatar Bag Governor
10.L.Nyamdorj Bag Governor
11.Unurbayar Head, Governor’s Office
Herders
1.Ts.Tserenchimed Shar-Us bagh
2.Т.Nyamdavaa Khongor-Ovoo bagh
3.D.Nergui Khongor-Ovoo bagh
4.J.Dugerjav Shar-Us bagh
5.Ts.Nyamjav Shar-Us bagh
6.Ts. Ganzorig Bayantsogt bagh
7.B.Yanjmaa Bayantsogt bagh
8.D.Ganbat Shar-Us bagh
9.G.Osorjav Shar-Us bagh
10.G.Batsukh Bayantsogt bagh
11. E.Oyun Khongor-Ovoo bagh

56
9 U.Densmaa AHBU specialist
10 E.Таmjid Herder, 3rd bagh
11 B.Badamsuren Herder, 2nd bagh
12 А.Chimgee Herder, 2nd bagh
13 L.Oyuntsetseg Herder, 2nd bagh
14 I.Ganzorig Herder, 1st bagh
15 B.Nergui Herder, 3rd bagh
16 G.Chinbat Herder, 1st bagh
17 М.Burenzevseg Herder, 4th bagh
18 S.Narantsesteg Herder, 1st bagh
Dundgobi aimag
No Name Position
T.Munkhbat Head, Livestock Division, Aimag Food and Agriculture Agency
J.Baatarbileg Specialist, Aimag Food and Agriculture Agency
B.Bolortuya Specialist, Aimag Meteorology Office
L.Togzolmaa Luus soum Governor
M.Bayanjargal Luus soum AHBU specialist
Sh.Oinbayar Head, private veterinary service provider, Luus soum Sh.Enkhtuvshin Herder, Luus soum
Kh.Tuul Herder, Luus soum
N.Erdenetsesteg Herder, Luus soum
P.Otgonchimeg Herder, Luus soum


