
Report on the impact of R1 climate correction
factor on the Waste-to-Energy (WtE) plants
based on data provided by Member States
Hrvoje Medarac, Nicolae Scarlat
Fabio Monforti-Ferrario, Katalin Bódis
2 0 1 4
Report EUR 26720 EN

European Commission
Joint Research Centre
Institute for Energy and Transport
Contact information
Hrvoje Medarac and Nicolae Scarlat
Joint Research Centre, Institute for Energy and Transport
Via E. Fermi, 2749 I-21027. Ispra (VA), Italy
E-mail: [email protected], [email protected]
http://iet.jrc.ec.europa.eu/remea/
Legal Notice
This publication is a Science and Policy Report by the Joint Research Centre, the European Commission’s in-house science
service. It aims to provide evidence-based scientific support to the European policy-making process. The scientific output
expressed does not imply a policy position of the European Commission. Neither the European Commission nor any person
acting on behalf of the Commission is responsible for the use which might be made of this publication.
All images © European Union 2014,
JRC90270
EUR 26720 EN
ISBN 978-92-79-39133-0 (PDF)
ISBN 978-92-79-39134-7 (print)
ISSN 1831-9424 (online)
ISSN 1018-5593 (print)
doi: 10.2790/28629
Luxembourg: Publications Office of the European Union, 2014
© European Union, 2014
Reproduction is authorised provided the source is acknowledged.
Abstract
Data on Waste to Energy plants provided by EU Member States are analysed and the consequences of different values
and formulations for the climate correction factor to be applied to the R1 formula following the Directive 2008/98/EC are
assessed.

1
Report on the impact of R1 climate correction factor on the Waste-to-Energy (WtE) plants based on data provided by
Member States
1 Background
This report was prepared according to the conclusions of the Meeting of the Committee for the
adaptation to scientific and technical progress and implementation of the Directives on waste
established under article 39 of Directive 2008/98/EC (Waste Framework Directive- WFD) which took
place in Brussels on 18th October 2013.
Within the conclusion of the meeting, Member States were asked to provide data for all of their
Waste-to-energy plants (WtE) which are eligible for the application of R1 formula for the purpose of
completing the analysis of the impact of various options for the climate correction factor carried over
based on conclusions from technical meetings organized by DG JRC and DG ENV in July and
September 2013. Member states were asked to provide data on R1 value, type of plant (Electricity
only, Heat only and Combined Heat and Power-CHP), size and location or HDD for each eligible plant
located in their territory. The deadline for providing the data by Member States was set to
30th November 2013. Waste to Energy State of the Art Report prepared by the International Solid
Waste Association (ISWA)1 was used as a benchmark for the number of plants for which the data was
delivered.
2 Data quality
The response from Member States within the initial deadline was very limited and partial data were
received for only 56 plants from 9 out of 28 Member States and complete data were received for
only 31 plants from 6 out of these 9 Member States. In order to ensure the collection of data in the
amount which would be needed to make the analysis, a reminder was sent to Member States and a
new deadline was proposed to submit the missing data by end January 2014.
By middle March 2014, complete data were delivered by 24 Member States. Germany, Slovenia,
Sweden and UK delivered partial data meaning that data were delivered for just a small number of
1
ISWA - International Solid Waste Association. Waste to Energy State of the Art Report Statistics 6th
Edition, August 2012, Revision November 2013. Available on-line on www.iswa.org

2
plants or the data were not accurate enough. The Figure 2.1 provides an overview of the quality of
data which were provided by Member States. In the case of Sweden, it is important to mention that
according to information available, 34 plants produce energy and use untreated MSW as fuel. From
the ruling by the Court in the Gävle Case (C-251/07) follows that all the units at these 34 plants are to
be regarded as co-incineration plants and 38 plants produce energy and use waste as fuels but do
not use untreated MSW as fuel.
Figure 2.1: Data provided by Member States
According to the data received, in EU there are 425 plants on which R1 formula could be applied.
Complete2 data were delivered for 240 plants which represents 56% of all plants.
The number of plants included in the analysis increases to 316, which represents 74% of all plants,
considering the plants for which incomplete data were delivered, but still allowing such evaluation.
The Figure 2.2 shows the number of plants for which at least partial data were delivered and number
of plants for which no data was delivered by Member States.
From the Figure 2.2 it is visible that almost 30% of all European WtE plants are located in France
(126). Germany follows with 79 plants (18.6%), Italy with 53 (12.5%), Sweden with 38 (8.9%), UK with
30 (7%), Denmark with 27 (6.4%), Belgium with 16 (3.8%), The Netherlands 14, Austria 11 and Spain
10 plants. Other Member States have less than 10 plants installed. A number of New Member States
do not have any WtE plants (Bulgaria, Croatia, Latvia, Poland and Romania), as well as Greece.
2
Here “complete” is meant in the sense that all the data listed in Section 1 were provided for at least one reference year

3
Figure 2.2: Number of WtE plants by Member States
As two member states have provided data for R1 values for two consecutive years, 2011 and 2012,
for reasons of uniformity, only the data for 2012 have been considered in this analysis. Nevertheless
this even partial data set has evidenced a non-negligible inter-annual R1 variability, broadly ranging
between ±5% and ± 10% on average.
For this reason, a general warning about the interpretation of the results of the following analysis has
to be stated, as these results regard the situation for the specific time slice for which data were
provided. Given the demonstrated variability of R1 values in different, even consecutive, years, these
results, including the numbers of plants and the plant cumulative capacity expected to change status
under the different options reported in Chapter 4, could be not fully consistent with the actual
situation in years different to the baseline considered here.
3 Current status of European WtE plants
The total annual incineration capacity for the incineration of Municipal Solid Waste in Member States
depends on waste management strategies and ranges from 0 in countries with no WtE plants, up to
more than 600 kg/capita in Denmark and around 500 kg/capita in The Netherlands and Sweden (see
Figure 3.1).
As it can be seen from the Figure 3.1, western countries have larger capacities than eastern countries
which are still at the beginning of the usage of energy from waste. The following analysis shows the
current status of WtE plants according to the data which were delivered by EU Member States.

4
Figure 3.1: Waste Incineration Capacities by Member States
3.1 Size of European WtE plants
European WtE plants are located in areas between 612 and 5209 Heating Degree Days (HDD
hereafter)3. The size (or capacity) of the plants, all plants considered, ranges from 9 000 to 1 300 000
tonnes of waste possible to be processed per year with an average value of around 200 000 t/year.
The relation between the size of European WtE plants and HDD is presented in Figure 3.2.
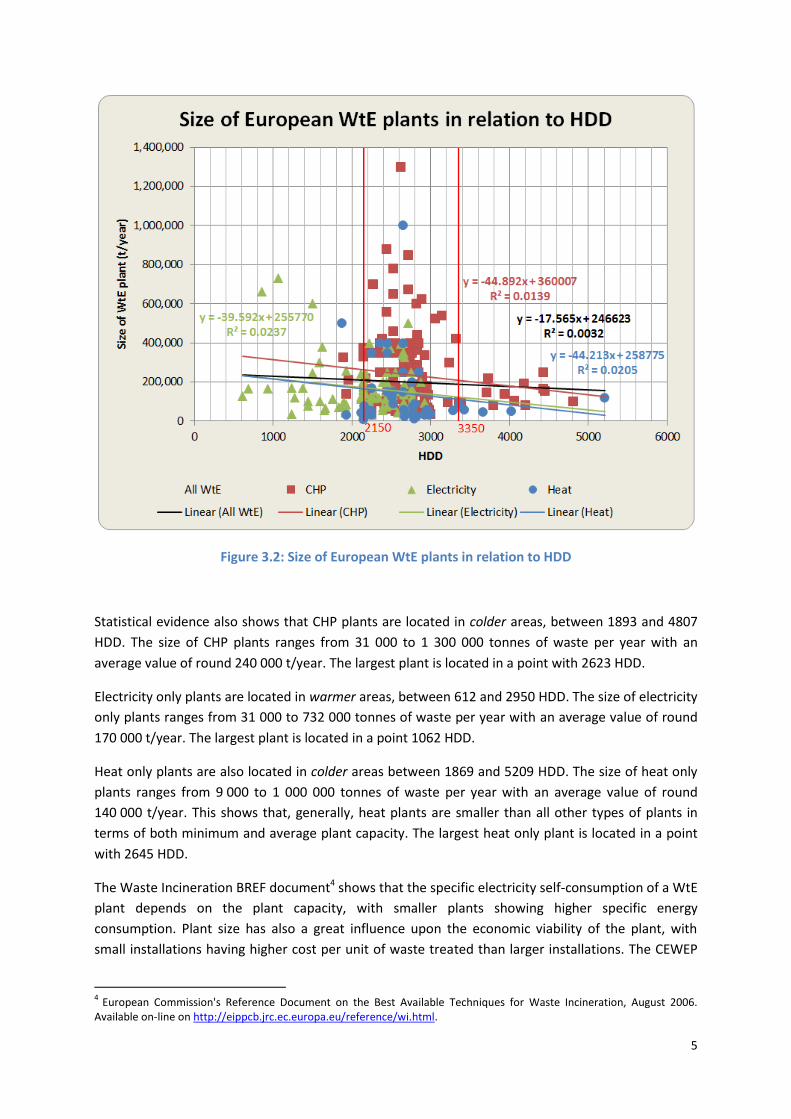
Figure 3.2 shows that most of plants are located in intermediate climate area (between 2150 and
3350 HDD). In warmer climate conditions (HDD < 2150) mainly electricity only (EO) plants are present
while in colder areas (HDD > 3350) only CHP and heat only (HO) plants are found. Despite of the data
scattering, all trend lines relating the size of WtE plants to HDD are decreasing with the increase of
HDD, meaning that in warmer areas WtE plants tend to be larger than in colder areas regardless the
type of the plant (Electricity only, Heat only and Combined Heat and Power).
3
Eurostat defined the following method for the calculation of heating degree days (HDD): (18 °C - Tm) x d if Tm is lower than or equal to 15 °C (heating threshold) and are nil if Tm is greater than 15 °C, here Tm is the mean (Tmin + Tmax / 2) outdoor temperature over a period of d days. Calculations are to be executed on a daily basis (d=1), added up to a calendar month -and subsequently to a year- and published for each Member State separately. (Eurostat, http://epp.eurostat.ec.europa.eu/cache/ITY_SDDS/EN/nrg_esdgr_esms.htm#unit_measure1392278670627)
5
Figure 3.2: Size of European WtE plants in relation to HDD
Statistical evidence also shows that CHP plants are located in colder areas, between 1893 and 4807
HDD. The size of CHP plants ranges from 31 000 to 1 300 000 tonnes of waste per year with an
average value of round 240 000 t/year. The largest plant is located in a point with 2623 HDD.
Electricity only plants are located in warmer areas, between 612 and 2950 HDD. The size of electricity
only plants ranges from 31 000 to 732 000 tonnes of waste per year with an average value of round
170 000 t/year. The largest plant is located in a point 1062 HDD.
Heat only plants are also located in colder areas between 1869 and 5209 HDD. The size of heat only
plants ranges from 9 000 to 1 000 000 tonnes of waste per year with an average value of round
140 000 t/year. This shows that, generally, heat plants are smaller than all other types of plants in
terms of both minimum and average plant capacity. The largest heat only plant is located in a point
with 2645 HDD.
The Waste Incineration BREF document4 shows that the specific electricity self-consumption of a WtE
plant depends on the plant capacity, with smaller plants showing higher specific energy
consumption. Plant size has also a great influence upon the economic viability of the plant, with
small installations having higher cost per unit of waste treated than larger installations. The CEWEP
4
European Commission's Reference Document on the Best Available Techniques for Waste Incineration, August 2006. Available on-line on http://eippcb.jrc.ec.europa.eu/reference/wi.html.

6
Energy Report III5 provides statistical evidence that small plants show also a lower efficiency in
comparison with larger ones. According to this report, the average R1 value for plants with capacity
smaller than 100.000 t/year is 0.63, while for plants between 100.000 and 250.000 t/year R1
averages to 0.7 and for plants with the capacity of more than 250.000 t/year the average R1 is 0.77.
Nevertheless, even if plant size has an unquestionable influence on the efficiency of the plant,
efficiency is not the only driver in dimensioning a plant. On the contrary, plant size strongly depends
on local circumstances such as population density and the local strategy for achieving the principles
of self-sufficiency and proximity treatment of waste. Moreover, being often located in sparsely
populated places, small plants also often suffer from lacking or restricted opportunities to export
heat, as it is not always economically feasible to build District Heating networks.
3.2 R1 value of European WtE plants
The Waste Framework Directive 2008/98/EC (WFD), defines an energy efficiency criterion, often
referred to as the "R1 criterion" or the "R1 formula", which sets the condition for a municipal solid
waste incineration facility to be considered as a Recovery operation (R1, Annex II) or as a Disposal
operation (D10, Annex I). The R1 formula is the following:
( )
( )
where
- the threshold value is 0.6 for existing plants and 0.65 for new plants (i.e. a plant that started
to be operational after 31/12/2008).
- Ep: annual energy produced as heat or electricity. It is calculated with energy in the form of
electricity being multiplied by 2.6 and heat produced for commercial use multiplied by 1.1;
- Ef: annual energy input to the system from fuels contributing to the production of steam;
- Ei: annual energy imported excluding Ew and Ef;
- Ew: annual energy contained in the treated waste.
The main objective of the R1 formula is to promote the efficient use of energy from waste in Waste
to Energy (WtE) plants. It takes into account the plant’s effectiveness in recovering the energy
contained in waste but also the effective uses of energy as electricity, heating and cooling or
processing steam for industry.
The Article 38.1 of the Waste Framework Directive provides that regarding the R1 formula, local
climatic conditions may be taken into account, such as the severity of the cold and the need for
heating insofar as they influence the amounts of energy that can be technically used or produced in
the form of electricity, heating, cooling or processing steam.
5 Reimann, D. O. (2012) CEWEP Energy Report III (Status 2007-2010) Results of Specific Data for Energy, R1 Plant Efficiency
Factor and NCV of 314 European Waste-to-Energy (WtE) Plants, CEWEP, Bamberg, Germany, December 2012. Available on-line on http://www.cewep.eu/m_1069.

7
Various climate conditions exist in Europe (see Figure 3.3). The effect of climate on electricity
production has been quantified through a relation between ambient air temperature and electricity
generation and a correlation has been established between the observed and prospective heating or
cooling demand in various regions and their Heating Degree Days (HDDs). Eurostat provides long
term (30 year) HDDs and JRC can provide interpolated data for any location in the EU based on own
meteorological model for the spatial interpolation of temperature data on a finer grid
(50 km x 50 km).
Figure 3.3: Köppen-Geiger climate classification map of Europe
There is proven technical evidence that temperature influences electricity production in reference to
the electricity generated by a theoretical Waste-to-Energy plant cooled all year long by air at a
constant temperature of 10°C. Nevertheless, the direct effect of air temperature on the
thermodynamics of the plant is not the only climate-related impact and the efficiency of a WtE plant
can be much more undermined by the lack of external heat demand than by the physical reduction
of electricity production.
Cold climates can provide a substantial and long-lasting heating demand in buildings, often met by
District Heating networks, calling for a significant supply of waste originated heat. Warmer locations
imply smaller demands in heating and for District Heating networks, if available, leaving WtE plants
with little or no use for their heat. When available, industrial heat demand provides a favourable
opportunity because the industrial heat use is regular and evenly distributed over the year.
Nevertheless, the plant location, along with lingering contractual uncertainties, often limits the
industrial heat use, thus making it unattractive to investors. WtE plants located in regions with large
heating demand seem to benefit from the double opportunity for the use of industrial heat and
heating in buildings, and plants in regions with weak or insignificant heating needs for which the only
opportunity is the use of industrial heat.

8
3.2.1 Electricity generation according to climate conditions
The production of electricity by a steam turbine depends in particular on the enthalpy drop in the
turbine and higher air temperatures have a negative impact on energy efficiency. A climate
correction factor taking into account the electricity generation ‘handicap’ is therefore needed to
maintain a level playing field among European WtE plants.
The impact of higher temperatures on electricity production was calculated with accuracy by using
hour-by-hour data. This “handicap” is expressed in reference to the electricity generated by a
theoretical WtE plant cooled all year long by air at a constant temperature of 10°C. It is possible to
(indirectly) correlate the ‘handicap’ with this yearly average temperature as well as with HDDs. A
mathematical correlated function was established to approximate the accurate calculated values and
the HDDs.
3.2.2 Heat demand according to climate conditions
When possible, it is valuable to export heat or process steam from a WtE plant, as it improves the
overall energy efficiency and economic performances of the plant. As explained above, cold climates
provide a substantial and long-lasting heat demand in buildings, often met by District Heating
networks, besides the opportunity for selling industrial heat. Temperate and warm locations imply
smaller demand for heating, hence affecting the possibilities for a plant to export heat. A synergy
with industrial heat customers constitutes a favourable situation, as industry could have large
consumption, mostly constant around the year. However, it is not always possible to ensure
industrial demand extensively. Industrial infrastructures are sometimes located in the vicinity of
areas with high population densities, where building a WtE plant may face public unacceptance.
Moreover, many industries have their own heat supply facilities not necessarily based on waste
incineration
Due to the equivalence (multiplication) factors (1.1 and 2.6 respectively) in the R1 formula, which
compare produced heat and produced electricity to primary fuels R1 formula is more favourable to
heat than to electricity generation. This is because the calculation of multiplication factors assumes
implicitly an efficiency of electricity production of 38.5% (1/2.6) and the efficiency of heat production
of 90.9% (1/1.1). Such efficiency of electricity production is attainable with other technologies (such
as coal, oil or gas) but seems clearly to be too high for a waste incineration plant. Since the impact of
climate on heat demand and on the R1 value is much more important than it is on electricity
production, a climate correction factor that could help in taking into account the differences in heat
demand is therefore needed so as to maintain a level playing field among European WtE plants.
3.2.3 Cooling according to climate conditions
The local production of cold from heat provided by a District Heating network can be of interest
when this network already exists. However, the cooling demand is usually much shorter in time
(around 3 months per year) than the heating demand (6 to 8 months). This makes building a District
Cooling network less attractive when there is no parallel demand for heat. On the contrary, the long-
lasting cooling demand for industrial use (food preservation, computer cooling, etc.) shows similar
features everywhere in Europe.

9
Cold is more difficult to transport on long distances than heat, because the temperature gradient is
smaller in cold networks than in heat distribution. WtE plants are rarely located in places where the
demand for cooling (and/or heating) is high (high population density areas). Higher initial capital
expenditure, coupled with much smaller demand for Cooling than for Heating networks, have
prevented so far the development of large District Cooling networks. The conclusion of the analysis
of the cooling demand situation in Europe was that cooling demand is still small if not negligible and
could be ignored in designing a correction factor.
3.2.4 Climatic zones
Europe features 3 broad climatic zones (warm, temperate, cold), which have been identified
depending on the heating demand and subsequently by HDDs (Figure 3.4). The limits between these
three zones were set in the ESWET study6 based on the HDD values: 3350 between the North Eastern
zone and the Intermediate one, 2150 between this one and the Southern Europe one. These
thresholds identify three main zones within Europe as shown in the Figure 3.4:
• North Eastern Europe features cold climate that provides optimal conditions for the use
of energy for heating. District Heating systems are well developed to provide heat to
buildings, as result of higher heating demand and planning decision. No climate
correction factor is needed for this area.
• Intermediate zone: features moderate climate conditions, where heating demand is
limited both in quantity and time, affecting proportionally the electricity production and
the opportunities to export heat. A correction factor is needed to cope with the
electricity production reduction due to temperature, and to compensate the smaller
heating demand.
• Southern Europe: features a warm climate, physically hampering the electricity
production and low heating demand, which is an impediment to heat export for heating
and to develop District Heating networks. A correction factor is needed to take into
account unfavourable electricity production conditions and the lack of heat demand.
The Figure 3.4 also shows the locations and types of WtE plants for which the data were delivered. It
is important to mention that this map was prepared only for visualisation purposes and does not
represent the official basis for calculation of HDD value in specific locations. The presented map is
the HDD values based on the ECHAM5 Global Circulation Model and HIRHAM5 Regional Climate
Model from the Danish Meteorological Institute for the period 2010-20407. Moreover, in the cases of
France and Germany, the data delivered did not allow identification of plant locations and for this
reason in these two Member States plants locations have to be considered approximated.
6 ESWET, Energy recovery efficiency in Municipal Solid Waste-to-Energy plants in relation to local climate conditions, 2012.
7 Hiederer, R., 2012, Processing Indices of Change and Extremes from Regional Climate Change Data. Luxembourg:
Publications Office of the European Union. EUR 25339 EN. 29pp. ISBN 978-92-79-24994-5, doi: 10.2788/27516.

10
Figure 3.4: Three zones according to HDDs and WtE plants in Europe
3.2.5 Analysis of R1 values
The analysis of the data delivered shows that out of the 316 plants included in the evaluation, 46
plants are located in the Southern European warmer area, 252 plants are located in Central Europe
(the intermediary zone), and 18 plants are located in North-Eastern Europe, in colder area according
to the HDD classification.
The Table 3.1 shows the total number of WtE plants for which the data were delivered. As it can be
seen, most of the analysed plants are located in central Europe and almost half of all the analysed
WtE plants consist in CHP plants located in Central Europe.
11
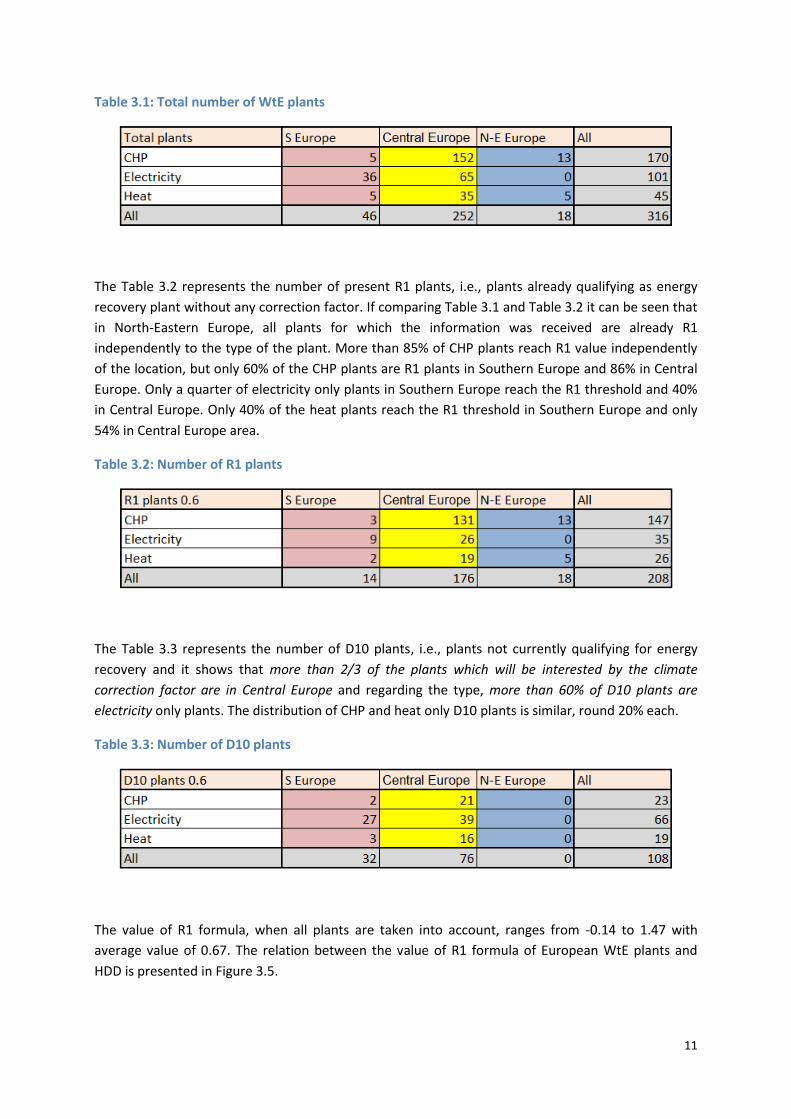
Table 3.1: Total number of WtE plants
The Table 3.2 represents the number of present R1 plants, i.e., plants already qualifying as energy
recovery plant without any correction factor. If comparing Table 3.1 and Table 3.2 it can be seen that
in North-Eastern Europe, all plants for which the information was received are already R1
independently to the type of the plant. More than 85% of CHP plants reach R1 value independently
of the location, but only 60% of the CHP plants are R1 plants in Southern Europe and 86% in Central
Europe. Only a quarter of electricity only plants in Southern Europe reach the R1 threshold and 40%
in Central Europe. Only 40% of the heat plants reach the R1 threshold in Southern Europe and only
54% in Central Europe area.
Table 3.2: Number of R1 plants
The Table 3.3 represents the number of D10 plants, i.e., plants not currently qualifying for energy
recovery and it shows that more than 2/3 of the plants which will be interested by the climate
correction factor are in Central Europe and regarding the type, more than 60% of D10 plants are
electricity only plants. The distribution of CHP and heat only D10 plants is similar, round 20% each.
Table 3.3: Number of D10 plants
The value of R1 formula, when all plants are taken into account, ranges from -0.14 to 1.47 with
average value of 0.67. The relation between the value of R1 formula of European WtE plants and
HDD is presented in Figure 3.5.

12
Figure 3.5: Value of R1 formula of European WtE plants in relation to HDD
From the Figure 3.5 it is visible that the all trendlines show an increase of R1 value with the increase
of HDD which means that R1 value is higher in colder areas. The extremely low R1 values reported
can be explained both by an old, outdated technology which is used or even by the fact that some of
these plants were designed with the main purpose of waste incineration rather than energy
recovery.
The values of R1 formula of CHP plants range from 0.11 to 1.47 with an average value of 0.78. The
CHP plant with the highest R1 value is located in a point with 4059 HDD and this plant has the highest
R1 value among all WtE plants. The values of R1 formula of electricity only plants range from 0.03 to
0.94 with an average value of 0.51. The electricity only plant with the highest R1 value is located in a
point with 2715 HDD. A significant number of electricity only plants have an R1 factor above the
threshold, even in the warmer area in Southern Europe.
The values of R1 formula of heat only plants range from -0.14 to 1.06 with average value of 0.61 and
the trend line increases with the increase of HDD. The heat only plant with the highest R1 value is
located at the location with 3278 HDD. A large number of heat only plants have R1 values well below
the threshold, although it is expected that heat only plants should be able to reach this threshold, if
they are in the category of Best Available Technologies (BAT).
It can be noticed that some electricity only plants have higher R1 factor than some CHP plants,
although it is expected CHP plants to perform better than electricity only plants. This fact reflects the

13
differences in the specific plant performances related to the technology level of that plants and
operating mode.
The Table 3.4 shows the average R1 value based on location and type of the plant. As it can be seen
from this table, when looking at average values by European climate conditions, the average R1 value
in southern Europe is 0.49, in central Europe 0.68 and in North- Eastern Europe 1.01.
Table 3.4: Average R1 values according to location and type of the plant
When taking into the consideration the type of the plant, it is clearly visible that the lowest average
value of 0.46 is reached in heat only plants in Southern Europe while electricity only plants in the
same area have similar average value of 0.48. But it is also visible that even CHP plants in the same
area hardly meet R1 criteria with an average R1 value of 0.58. Electricity only and heat only plants
face problems of meeting R1 threshold even in Central Europe, where the average R1 factor is just
below the threshold.
3.3 Relations between the size and R1 value of European WtE plants
When looking at trendlines of R1 values and the size of plant in relation to HDD, it can be noticed
that in all cases R1 values increase with the increase of HDD. Figure 3.6 shows on the contrary the
relation between plant size and R1 values.
This figure shows that, in general, despite the large scattering of data, the R1 value of a WtE plant
tends to increase with size. More in detail, in the case of the CHP plant, when looking at the
trendline, the R1 value is almost constant, round 0.8, with a loose dependency on the size, while in
the cases of heat only and electricity only plants the R1 value increases more clearly with the
increase of plant capacity. However, the fact that the figure reveals a large scattering of data and
that values of R2 are very small has to be underlined.
The plant with the highest R1 value of all is a CHP plant with the size of around 100 000 t/year, which
shows a strong influence of technology and operating conditions too. On the other hand, in the case
of heat only plants, the plant with the biggest size also has the highest R1 value, while in the case of
electricity only plants the plant with the highest R1 value is also one of the biggest plants of this type.
Thus, the data show a clear dependence of the plant size on the R1 factor for the electricity only and
heat only plants, while this dependence is loose for CHP plants.

14
Figure 3.6: Value of R1 formula of European WtE plants in relation to size
4 The influence of various options of climate correction factor on
values of R1 formula
During the TAC (Technical Adaptation Committee) meeting of 1st July 2011, it was announced that
the Commission was considering three options for a climate correction factor: one of zero correction,
one only including a compensation for the climatic impact on the electricity production and one
considering the impacts of climate on electricity production and the lack of heat demand.
Subsequently, three options were discussed in the TAC meeting held on 9th July 2012 and in the
Technical Working Group8 (TWG) meetings held on 2nd July 2013 and 17th September 2013 at the JRC
premises in Ispra, Italy:
Option A addresses the climatic impact on the electricity production;
Option B cumulates the climatic impact on the electricity production as well as the impact of
climate on production and heat demand.
Option C is formulated in a two-stage process: Option B for a period of time (to be
determined) with a phase-out clause leading to the eventual application of Option A.
8 The main objective of the TWG was to discuss the available options for the climate correction factor and to provide
information and acceptable technical proposals. The TWG included representation from stakeholders, including experts and
representatives of Member States.
15
4.1 Definition of Options
The footnote (*) in Annex II to the WFD provides that the R1 formula shall be applied in accordance
with the reference document on Best Available Techniques (BAT) for waste incineration. The Waste
Incineration BREF (WI-BREF, 2006) provides reference values for efficiencies which can be achieved
when using BATs in the case of a Waste-to-Energy plant dedicated to the use of CHP and/or the heat
and/or steam (BAT 61) and in the case of a WtE plant not in conditions to export much heat and
dedicated to electricity generation (BAT 62).
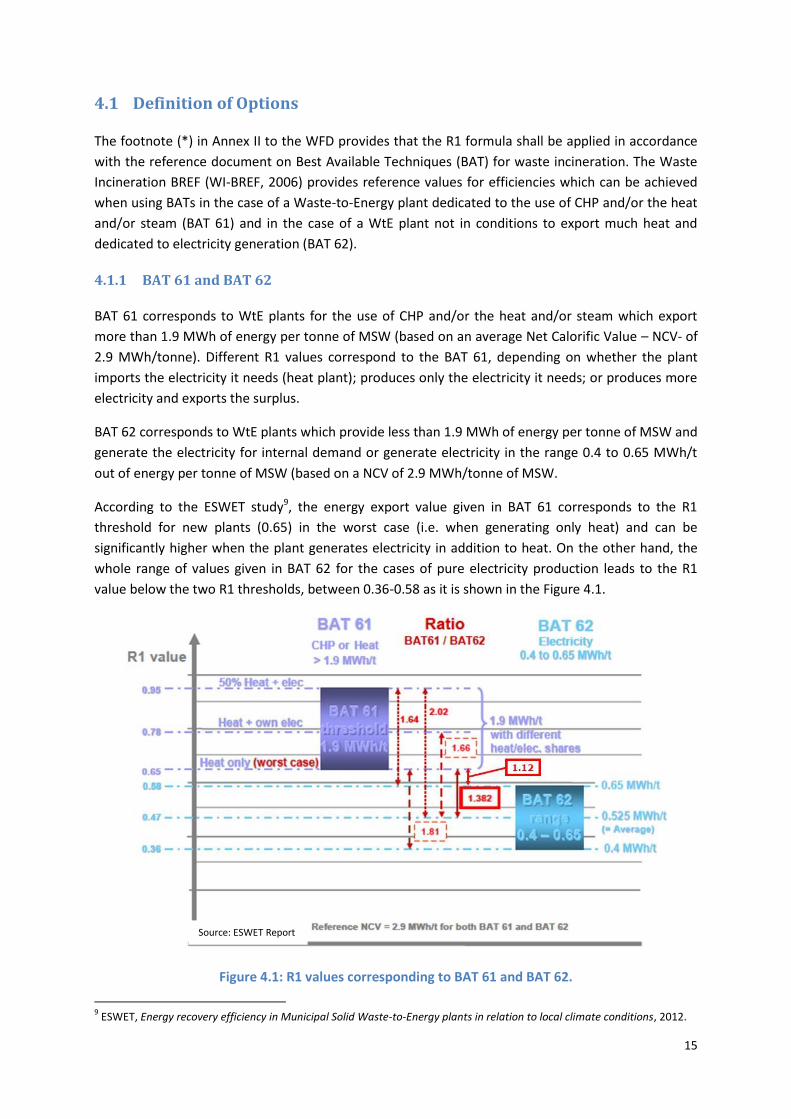
4.1.1 BAT 61 and BAT 62
BAT 61 corresponds to WtE plants for the use of CHP and/or the heat and/or steam which export
more than 1.9 MWh of energy per tonne of MSW (based on an average Net Calorific Value – NCV- of
2.9 MWh/tonne). Different R1 values correspond to the BAT 61, depending on whether the plant
imports the electricity it needs (heat plant); produces only the electricity it needs; or produces more
electricity and exports the surplus.
BAT 62 corresponds to WtE plants which provide less than 1.9 MWh of energy per tonne of MSW and
generate the electricity for internal demand or generate electricity in the range 0.4 to 0.65 MWh/t
out of energy per tonne of MSW (based on a NCV of 2.9 MWh/tonne of MSW.
According to the ESWET study9, the energy export value given in BAT 61 corresponds to the R1
threshold for new plants (0.65) in the worst case (i.e. when generating only heat) and can be
significantly higher when the plant generates electricity in addition to heat. On the other hand, the
whole range of values given in BAT 62 for the cases of pure electricity production leads to the R1
value below the two R1 thresholds, between 0.36-0.58 as it is shown in the Figure 4.1.
Figure 4.1: R1 values corresponding to BAT 61 and BAT 62.
9 ESWET, Energy recovery efficiency in Municipal Solid Waste-to-Energy plants in relation to local climate conditions, 2012.
Source: ESWET Report
1.12

16
The reference energy efficiencies set by the Waste Incineration BREF give much higher R1 values for
BAT plants dedicated to heat than for plants without heat export and dedicated only to electricity
generation. This reflects the efficiency of energy production for heat only and CHP plants, on one
side, and electricity only plants on the other side. In order to compensate for the lack of heat in
warm areas, it was considered reasonable to propose a factor based on the ratio between the R1
values corresponding to BAT 61 and BAT 62 plants, while maintaining an incentive to achieve high
efficiency of energy productionClimate appears as factor influencing the potential R1 value of a WtE
plant. The technical and statistical data clearly shows that there is an uneven playing field at EU level
in respect of the R1 formula and that, in spite of the equivalence factors already applicable, the R1
formula is much more favourable to heat than to electricity.
The R1 formula must in any case remain an incentive for operators to increase the overall efficiency
of their plants and, in particular, to increase the heat export where possible. The climate factor must
not aim at fully compensate the effect of lack of heat demand but should aim at making the R1
formula workable in warmer areas, thus setting all European WtE plants on an equal footing.
4.1.2 Option A
In Option A, the formula is proposed to correct ONLY the impact on electricity generation. In this
option, no low threshold is set for the electricity correction: the highest correction being therefore
reached in a theoretical place where HDD = 0. The maximum correction factor is 1.05 for the
European conditions. The climate factor for electricity would compensate the differences due to
climate over the 2 affected zones (Intermediate and Southern Europe), i.e. in areas where
HDD < 3350.
Option A
Proposal for a climate factor KClimateElec correcting ONLY the impact on electricity:
KClimateElec = 1 if HDDlong term local > 3350
KClimateElec = 1.1105 – 32.97 10-6
x HDD long term local if HDD long term local < 3350
4.1.3 Option B
In the Option B, a formula is proposed to correct the climate impact on electricity production and
heat demand. This formula was built on the following principles:
- It should not aim at totally offsetting the handicap of plants generating electricity;
- The factor should have a ceiling, corresponding to maximum compensation for the situations
where the heating demand is low and there are no opportunities to use industrial heat;
- Be appropriate and progressive to incentivise heat use whenever possible.
Since BAT 61 and BAT 62 provide information on efficiencies which can be achieved when using Best
Available Techniques, it was proposed to build the maximum climate correction factor on the ratio
between the efficiency requested by BAT 61 (for WtE plants dedicated to the export of heat, worst
case) and the efficiency recognised as BAT in a plant exporting electricity only. The resulting ratio is
used as the maximum multiplicative factor used in the hot zone (HDD > 2150) and then gradually

17
reduced to 1 as HDDs increase from 2150 to 3350, thus motivating export of heat as heat demand
increases. The schematic representation of the options available is given in Figure 4.2.
This factor cumulates the impact of the two issues and uses the local long term average HDD as
single input. The use of HDDs deals in an acceptable manner both with the ‘handicap’ on electricity
production and the reduced or lack of heat demand. Reference data are available in official
databases (Eurostat, JRC for interpolation). Three possibilities for the maximum multiplicative factor
were discussed, based on the BAT61 and BAT62 reference values:
Option B: ratio between the lowest performances of BAT 61 and the average performances of
BAT62. The proposed maximum climate factor will then be 1.382.
Option B+: ratio between the lowest performances of BAT 61 and top performances of BAT62.
The proposed maximum climate factor will then be 1.12. This option has the merit that is
sounder, as being based only on the gap between the BAT61 and BAT 62, and thus compensating
for the R1 factor in the two types of plants and leaving enough incentives for the use of heat.
Option B++: ratio between the average performances of BAT 61 and average performances of
BAT62. The proposed maximum climate factor will then be 1.66. This option provides a high
correction factor, which overcompensate for the climate correction leaving little or no incentives
for the use of heat.
Option B
Proposal for a factor KClimateHeat&Elec correcting the impact on BOTH electricity production AND heat demand:
KClimateHeat&Elec = 1 if HDDlong term local > 3350
KClimateHeat&Elec = 1.382 if HDDlong term local < 2150
KClimateHeat&Elec = - (0.382/1200) x HDDlong term local + 2.0665 when 2150 < HDDlong term local < 3350
Option B +
Proposal for a factor KClimateHeat&Elec correcting the impact on BOTH electricity production AND heat demand:
KClimateHeat&Elec = 1 if HDDlong term local > 3350
KClimateHeat&Elec = 1.12 if HDDlong term local < 2150
KClimateHeat&Elec = - 0.0001 x HDDlong term local + 1.3350 when 2150 < HDDlong term local < 3350
Option B ++
Proposal for a factor KClimateHeat&Elec correcting the impact on BOTH electricity production AND heat demand:
KClimateHeat&Elec = 1 if HDDlong term local > 3350
KClimateHeat&Elec = 1.66 if HDDlong term local < 2150
KClimateHeat&Elec = - 0.00055 x HDDlong term local + 2.8425 when 2150 < HDDlong term local < 3350
The Figure 4.2 represents the proposed climate factors: Option A addressing only the electricity
impact (line in blue), Option B, Option B+ and Option B++ addressing the heat AND electricity (line in
green, red and light green).

18
Figure 4.2: Proposed options for climate correction factors
4.1.4 Option C
The Option C, consisting in the adoption of B for a first period of time, followed by the adoption of A
option, was no longer taken into consideration regarding this research since during technical
meetings the conclusions were made that this option would require higher investment costs for
existing WtE plants.
4.2 Analysis of various options and their impact on R1 factor of existing
plants
The various options available were analysed and their impact was quantified on the R1 factor of the
plants located in various climatic zones, based on the data received on 316 WtE plants. The Table 4.1
shows the average R1 value based on the location and type of the plant for the current status and
various options addressed.
Table 4.1: Average R1 values in present situation and after the Options applied

19
The Table 4.1 shows that in the case of the Option A the R1 threshold for the average WtE CHP plant
would be already met in all European climate conditions, but the average R1 values for electricity
only plants in all climate conditions and heat only plants in Southern Europe would not be at the level
of the threshold. In Southern Europe, CHP plants would show an average R1 value just above the
threshold. In Central Europe, the R1 value would increase by a limited extent and on average, heat
only plants would reach the R1 threshold. From the Figure 4.3 which shows calculated R1 values for
European WtE plants in the case of the Option A it is evident that all trendlines still show an increase
of R1 values with the increase of HDD which means that there could be the need for stronger
correction.
Figure 4.3: Calculated R1 values for European WtE plants in the case of the Option A
In the case of the Option A the maximum correction would be 1.09 at the location of a little bit more
than 600 HDD, the average R1 values for WtE plants would increase by an overall factor of 1.03; in
the Southern Europe, the average R1 would increase by 1.05, in Central Europe it would increase by
1.02. In Southern Europe, CHP plants would pass, on average, above the threshold. In Central
Europe, on average, CHP plants and heat only plants would pass above the R1 threshold and
electricity only plants would still be under the threshold.
In the case of the Option B+ 1.12 the maximum correction would be 1.12 in Southern Europe while in
Central Europe the correction factor would be 1.07 in average. The Figure 4.4 shows calculated R1
values for European WtE plants in the case of the Option B+ 1.12: it is obvious that all trendlines still
show the increase of R1 values with the increase of HDD which means that there could be a need for
stronger correction.

20
Figure 4.4: Calculated R1 values for European WtE plants in the case of the Option B+ 1.12
In the case of the Option B 1.38, on average, all plants would meet the R1 threshold independently to
the climate zone or type of the plant. The average R1 values for WtE plants would increase by a
factor of 1.23; while in the Southern Europe, the average R1 would increase by 1.38, in Central
Europe would increase by 1.23. The Figure 4.5 shows calculated R1 values for European WtE plants in
the case of the Option B 1.38.where the trendline for electricity only plants now shows a decrease of
R1 values with the increase of HDD which means that this correction might already be too high for
electricity only plants. The trendlines for R1 factor for heat only and CHP plants still show an increase
with the increase of HDD.
In the cases of the Option B++ 1.66, all plants would meet on average the R1 threshold
independently to the climate zone or type of the plant. In this case, the average R1 values for WtE
plants would increase by 1.39; while in the Southern Europe, the average R1 would increase by 1.66,
in Central Europe would increase by 1.40. The Figure 4.6 shows calculated R1 values for European
WtE plants in the case of the Option B+ 1.66.
From the Figure 4.6 it is obvious that the trendline for electricity only plants now shows a strong
decrease of R1 values with the increase of HDD. This proves that this correction is definitely too high
for electricity only plants. In this case, the trendline for CHP plants is almost horizontal.

21
Figure 4.5: Calculated R1 values for European WtE plants in the case of the Option B 1.38
Figure 4.6: Calculated R1 values for European WtE plants in the case of the Option B++ 1.66
When the number of plants reaching the R1 status is taken into consideration, the situation is as
presented in the Table 4.2.

22
Table 4.2: Number of D10 plants and number of plants changing status depending on Options
As it is visible from the Table 4.2, the Option A changes the status from D10 to R1 for only 2
electricity only plants in Central Europe. There would be no changes in the status of the WtE plants in
other areas in Europe.
In the case of the Option B+ 1.12, 18 plants would change the status: 5 CHP plants, 12 electricity only
plants and 1 heat plant. Out of these 18 plants, 6 are in Southern Europe and 12 in Central Europe
and there would be no change in the status of heat only plants in Southern Europe.
In the case of the Option B 1.38, 47 plants from all categories would change the status: 9 CHP plants,
31 electricity only plants and 7 heat plants. Out of these, 18 plants would be from Southern Europe
and 29 from Central Europe.
In the case of the Option B++ 1.66, 65 plants would change the status: 13 CHP plants, 44 electricity
plants and 8 heat only plants; 25 plants would be from Southern Europe and 40 from Central Europe.
The impact of Option B 1.38 and Option B++ 1.66 on heat plants would be almost the same, which
means that 7 heat only plants would change status in Option B+ as compared to 8 heat only plants
changing status in Option B++ have very low R1 factor. This is explained by the very low R1 factor of
such heat only plants.
The Figure 4.7 shows the number of plants which would change the status by plant type in cases of
different options.
The Table 4.3 shows the percentage of plants currently classified as D10 per climate zones and
categories which would meet the thresholds in the new situation, then changing status, depending
on the options considered.
23
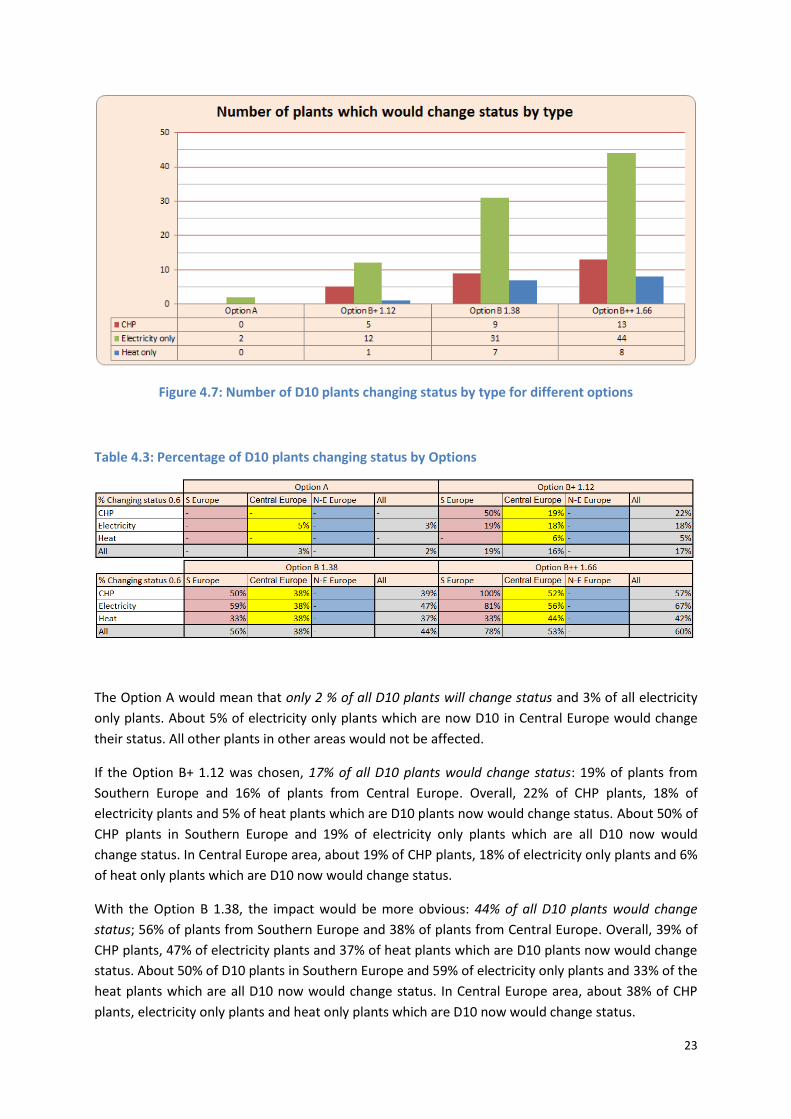
Figure 4.7: Number of D10 plants changing status by type for different options
Table 4.3: Percentage of D10 plants changing status by Options
The Option A would mean that only 2 % of all D10 plants will change status and 3% of all electricity
only plants. About 5% of electricity only plants which are now D10 in Central Europe would change
their status. All other plants in other areas would not be affected.
If the Option B+ 1.12 was chosen, 17% of all D10 plants would change status: 19% of plants from
Southern Europe and 16% of plants from Central Europe. Overall, 22% of CHP plants, 18% of
electricity plants and 5% of heat plants which are D10 plants now would change status. About 50% of
CHP plants in Southern Europe and 19% of electricity only plants which are all D10 now would
change status. In Central Europe area, about 19% of CHP plants, 18% of electricity only plants and 6%
of heat only plants which are D10 now would change status.
With the Option B 1.38, the impact would be more obvious: 44% of all D10 plants would change
status; 56% of plants from Southern Europe and 38% of plants from Central Europe. Overall, 39% of
CHP plants, 47% of electricity plants and 37% of heat plants which are D10 plants now would change
status. About 50% of D10 plants in Southern Europe and 59% of electricity only plants and 33% of the
heat plants which are all D10 now would change status. In Central Europe area, about 38% of CHP
plants, electricity only plants and heat only plants which are D10 now would change status.

24
Finally, if the Option B 1.66 was chosen, 60% of all D10 plants would change status: 78% of plants
from Southern Europe and 53% of plants from Central Europe. Overall, 57% of CHP plants, 67% of
electricity plants and 42% of heat plants which are all D10 plants now would change status. All CHP
plants (100%) in Southern Europe, 81% of electricity only plants and 33% of the heat plants which are
D10 now would change status. In Central Europe area, about 52% of CHP plants, 56% of electricity
only plants and 44% of heat only plants which are D10 now would change status.
The Figure 4.8 shows the percentage of D10 plants of certain type which would change the status in
cases of different options.
Figure 4.8: Percentage of D10 plants changing status by type for different options
A similar analysis involving the installed capacity of plants changing status under a different option is
reported in the Appendix.
5 Positions of Member States
The analysis of the climate correction factor which would be needed for all of the plants to change
their status shows that the range of the factor which would be needed would be between -46.98 and
34.42. This shows extremely wide ranges for a correction factor which would be needed to reach the
R1 threshold for certain plants and it also shows that there are D10 plants which were not built for
energy recovery but only for waste incineration and they have no possibilities to reach R1 threshold
without major improvements.
For a relevant analysis, to consider only plants which were built for energy recovery, 5% of extreme
values (15 plants), were excluded from the analysis of the climate correction factor which would be
needed by the plants in order to meet the R1 threshold. The first step in this analysis was to find out
which would be the ratio 0.6/R1 which represents the needed correction if it was applied in the full
amount on all locations (without considering the HDDs of each specific plant location). As the result
of this analysis the diagram in the Figure 5.1 was made.

25
Figure 5.1: Needed CFF for all plants
The diagram in the Figure 5.1 shows which plants would be below the lines for certain Options and
thus would be considered as energy recovery plants or R1 and which plants would stay above and
would be considered as waste incineration plants or D10.
Since in intermediate zone, the correction for the Option B is not applied in the full amount but
decreases from the defined value at 2150 HDD to 1 at 3350 HDD, the calculation of real climate
correction factor for the Option B was also made. With excluding 5% of extremes as explained
before, the needed climate correction factor for all plants stands now between 1 and 3.3. In this case
the diagram which shows the exact values of climate correction factor for different coefficients in the
case of the Option B is shown in the Figure 5.2:
From the Figure 5.2 it is visible that plants which reach R1 value above 0.6 without correction and
plants which are in North-Eastern Europe have the needed climate correction factor (CCF) 1. For
plants in Southern Europe which do not meet R1 value without correction, the needed CCF is
calculated as ratio 0.6/R1. And in the end, for the plants in Central Europe which do not meet R1
value without correction, the needed CCF is calculated as the value for the Option B needed to reach
the 0.6 threshold.

26
Figure 5.2: Needed CFF for all plants excluding 5% of extreme values
The average climate correction factor for all plants to reach the R1 threshold would be for the case of
the Option B with the correction value of 1.162. The average climate correction factor for CHP plants
to reach the R1 threshold would be for the case of the Option B with the correction value of 1.069.
The average climate correction factor for heat only plants to reach the R1 threshold would be in for
the case of the Option B with the correction value of 1.236. The average climate correction factor for
electricity only plants to reach the R1 threshold would be for the case of the Option B with the
correction value of 1.295.
During the Meeting of the Committee for the adaptation to scientific and technical progress and
implementation of the Directives on waste established under article 39 of Directive 2008/98/EC
which took place in Brussels on 18th October 2013, but also in the e-mail exchange and during the
other meetings Member States gave their preferred positions on the options for climate correction
factor (Figure 5.3).

27
Figure 5.3: Options for climate correction factor supported by Member States
As it can be seen from the Figure 5.3, Southern countries (Portugal, Spain, France, Italy and Greece)
asked for higher level of correction (Option B 1.38 or Option B++ 1.66), Northern countries (Belgium,
Netherlands, Germany, Austria, Denmark, Finland and Sweden) ask for lower level of correction
(Option A or Option B+ 1.12), while Eastern countries and UK and Ireland do not have a preferred
option yet. The Netherlands and Finland support the Option B+ 1.12 and stated that the value could
be even higher, but not 1.38.
If the positions of various Member States and the number of plants in respective countries are
considered, the share of WtE plants by position taken by Member States is shown in Figure 5.4.
Regarding the installed capacities for waste incineration by Member States, the share of installed
capacities by position taken by Member States is shown in Figure 5.5. This figure shows that 55% of
installed capacities come from Member States which search for lower correction factor and 33%
from Member States which search for higher correction factor.

28
Figure 5.4: Number of WtE plants by the position taken by Member States
Figure 5.5: Installed capacities (t/year) of WtE plants by the position taken by Member States
When looking at R1 plants, the Figure 5.6 shows that only 20% of R1 plants come from Member
States which ask for higher climate correction factor, while in the same time 3/4 of R1 plants come
from Member States which ask for lower climate correction factor. The situation is almost the same
when comparing the size of R1 plants for which the data was delivered as it is shown in the
Figure 5.7.

29
Figure 5.6: Number of R1 plants according to the position taken by Member States
Figure 5.7: Installed capacities (t/year) of R1 plants according to the position taken by Member States
On the other hand, when looking at the Figure 5.8, it is clearly visible that almost all D10 plants come
from Member States which asked for higher climate correction factors and once again the situation is
almost the same when comparing the size of D10 plants for which the data was delivered as it is
shown in the Figure 5.9.

30
Figure 5.8: Number of D10 plants according to position taken by Member States
Figure 5.9: Installed capacities (t/year) of D10 plants according to position taken by Member States
It is also important to mention that out of 4 Member States which provided partial data, two of them
are among Member States which ask for low correction factor and two among Member States which
still did not take any position. On the other hand, all Member States which ask for higher correction
factor provided all or sufficient data for the purpose of the analysis. The data on size was delivered
for more plants than the data on R1 values and HDD.

31
6 Additional considerations on statistical properties of R1 values for
the European WtE plants
Data provided have also allowed some additional analysis on the actual situation of the state of the
art of technologies in WtE plants in Europe. More in detail, a statistical analysis was performed on
the overall population of existing WtE plants and on its subpopulations of CHP or Heat Only
(CHP&HO) plants and electricity only (EO) plants, corresponding to technologies described by BAT 61
and BAT 62 respectively.
It is worth mentioning that, as Figures 3.4 and 3.5 show and as it was already discussed in the
present report, CHP plants are almost only deployed in moderate and cold climate areas while EO
plants are deployed only in warm and moderate climate areas in Europe and HO plants are deployed
in moderate climate areas and to a lesser extent in warm and cold climate areas.
Table 6.1 shows statistical descriptors of the R1 distributions for the whole WtE population and for
the two subpopulations of Electricity only (EO) and CHP and Heat Only (CHP&HO) plants, while
Figure 6.1 shows the full distribution of R1 values for the two data sets. As in the Chapter 5, 5% of
extreme values were excluded from the analysis.
Table 6.1: Statistical descriptors for R1 distribution for all plants, CHP&HO plants and EO plants according to data received. 5 % extreme values have been excluded.
Type Average R1
Median R1
Mode Standard Deviation
Variance n
All Plants 0.699 0.660 0.66 0.238 0.057 301
EO 0.539 0.543 0.66 0.129 0.017 95
CHP&H 0.773 0.750 0.84 0.240 0.058 206
Figure 6.1: Distribution of R1 values for EO plants (green) and CHP&HO plants (red). 5 % extreme values have been excluded
32
Both the statistical descriptors and the visual analysis of the distributions confirm that existing EO
plants show a lower value for the average, median and the modal R1 value compared to CHP&HO
plants, a fact that it is well evident even from the comparison of BAT technologies discussed in
Chapter 4.1.1 and for which an effect of geographical location has been demonstrated.
For further analysis of R1 distributions, some key percentile values of R1 of both EO and CHP&HO
plants has been elaborated and shown in Table 6.2 and in Figure 6.2 in graphical format.
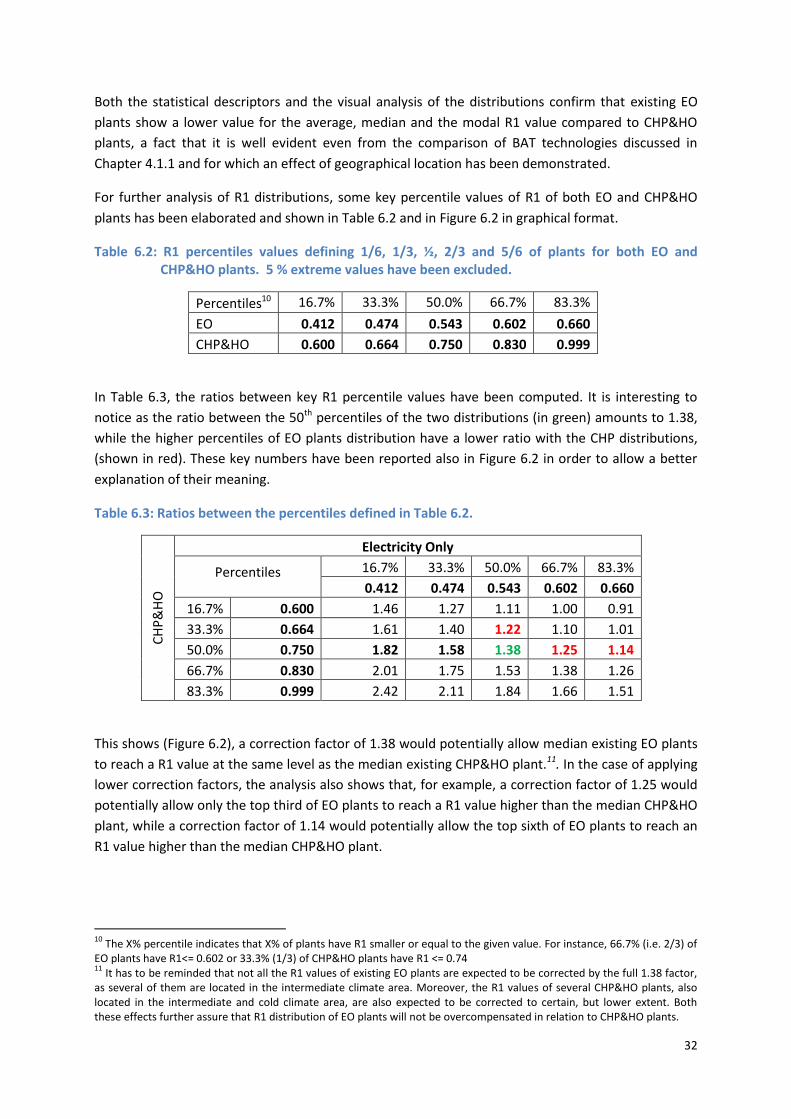
Table 6.2: R1 percentiles values defining 1/6, 1/3, ½, 2/3 and 5/6 of plants for both EO and CHP&HO plants. 5 % extreme values have been excluded.
Percentiles10 16.7% 33.3% 50.0% 66.7% 83.3%
EO 0.412 0.474 0.543 0.602 0.660
CHP&HO 0.600 0.664 0.750 0.830 0.999
In Table 6.3, the ratios between key R1 percentile values have been computed. It is interesting to
notice as the ratio between the 50th percentiles of the two distributions (in green) amounts to 1.38,
while the higher percentiles of EO plants distribution have a lower ratio with the CHP distributions,
(shown in red). These key numbers have been reported also in Figure 6.2 in order to allow a better
explanation of their meaning.
Table 6.3: Ratios between the percentiles defined in Table 6.2.
CH
P&
HO
Electricity Only
Percentiles 16.7% 33.3% 50.0% 66.7% 83.3%
0.412 0.474 0.543 0.602 0.660
16.7% 0.600 1.46 1.27 1.11 1.00 0.91
33.3% 0.664 1.61 1.40 1.22 1.10 1.01
50.0% 0.750 1.82 1.58 1.38 1.25 1.14
66.7% 0.830 2.01 1.75 1.53 1.38 1.26
83.3% 0.999 2.42 2.11 1.84 1.66 1.51
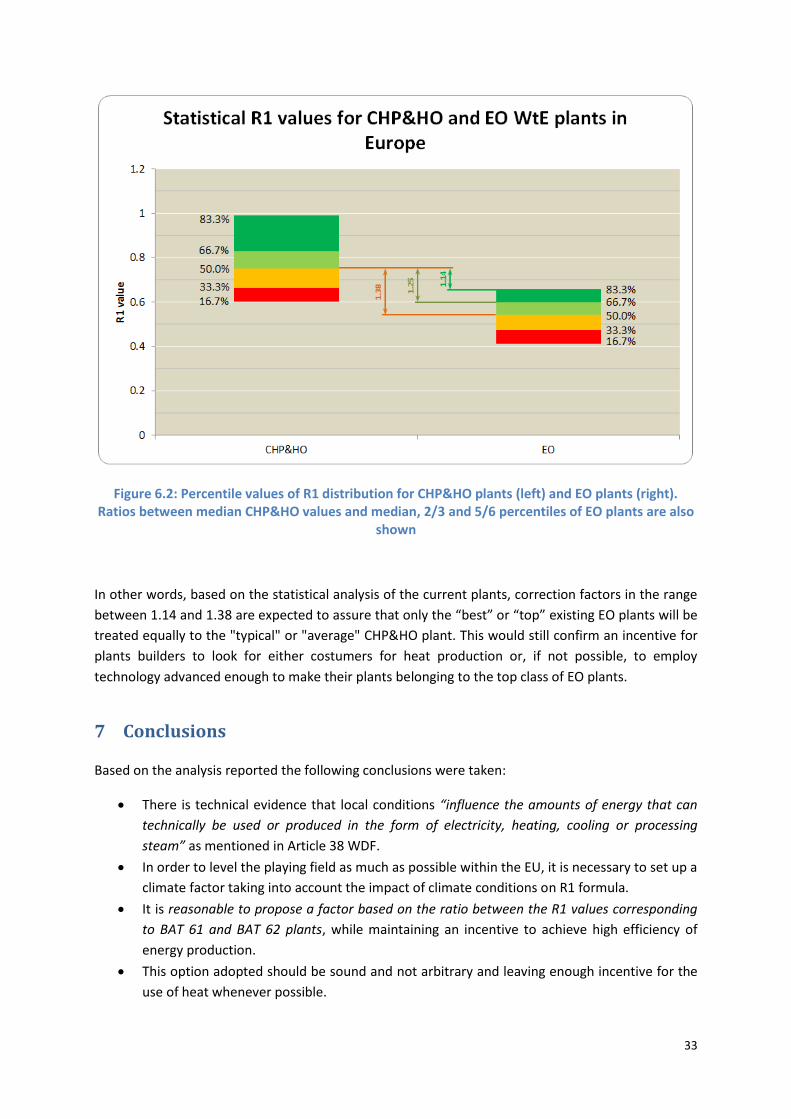
This shows (Figure 6.2), a correction factor of 1.38 would potentially allow median existing EO plants
to reach a R1 value at the same level as the median existing CHP&HO plant.11. In the case of applying
lower correction factors, the analysis also shows that, for example, a correction factor of 1.25 would
potentially allow only the top third of EO plants to reach a R1 value higher than the median CHP&HO
plant, while a correction factor of 1.14 would potentially allow the top sixth of EO plants to reach an
R1 value higher than the median CHP&HO plant.
10
The X% percentile indicates that X% of plants have R1 smaller or equal to the given value. For instance, 66.7% (i.e. 2/3) of EO plants have R1<= 0.602 or 33.3% (1/3) of CHP&HO plants have R1 <= 0.74 11
It has to be reminded that not all the R1 values of existing EO plants are expected to be corrected by the full 1.38 factor, as several of them are located in the intermediate climate area. Moreover, the R1 values of several CHP&HO plants, also located in the intermediate and cold climate area, are also expected to be corrected to certain, but lower extent. Both these effects further assure that R1 distribution of EO plants will not be overcompensated in relation to CHP&HO plants.
33
Figure 6.2: Percentile values of R1 distribution for CHP&HO plants (left) and EO plants (right). Ratios between median CHP&HO values and median, 2/3 and 5/6 percentiles of EO plants are also
shown
In other words, based on the statistical analysis of the current plants, correction factors in the range
between 1.14 and 1.38 are expected to assure that only the “best” or “top” existing EO plants will be
treated equally to the "typical" or "average" CHP&HO plant. This would still confirm an incentive for
plants builders to look for either costumers for heat production or, if not possible, to employ
technology advanced enough to make their plants belonging to the top class of EO plants.
7 Conclusions
Based on the analysis reported the following conclusions were taken:
There is technical evidence that local conditions “influence the amounts of energy that can
technically be used or produced in the form of electricity, heating, cooling or processing
steam” as mentioned in Article 38 WDF.
In order to level the playing field as much as possible within the EU, it is necessary to set up a
climate factor taking into account the impact of climate conditions on R1 formula.
It is reasonable to propose a factor based on the ratio between the R1 values corresponding
to BAT 61 and BAT 62 plants, while maintaining an incentive to achieve high efficiency of
energy production.
This option adopted should be sound and not arbitrary and leaving enough incentive for the
use of heat whenever possible.

34
Data availability
1. The data for this report were delivered by all Member States: 24 Member States delivered
complete or sufficient data, while 4 Member States delivered only partial data. Germany
delivered data which was not accurate enough to allow an analysis as detailed as the other
countries, while Slovenia, Sweden and UK delivered data for less than half of their WtE
plants.
2. At least partial data were delivered for 316 plants of which complete data was delivered for
240 out of 425 WtE plants existing in Europe.
3. France itself has almost 30% of all European WtE plants while France, Germany and Italy
together have 60% of all European WtE plants.
4. According to the data available, Member States with the highest waste incineration
capacities per capita in Europe like Denmark, Sweden and The Netherlands are supporting
lower correction factor, while France, the Member State with the highest number of plants
and Italy, the third country according to number of plants, support higher correction factor.
5. The size of European WtE plants generally decreases with the increase of HDD
6. Almost 1/2 of WtE plants which were considered in the research are CHP plants from Central
Europe.
7. 80% of WtE plants which were considered in the research are located in Central Europe.
8. 208 or around 2/3 of WtE plants which were considered in the research are R1 plants and
1/3 or 108 plants are D10 plants, out of which 76 plants are from Central and 32 from
Southern Europe.
9. The plants considered in this research located in Member States supporting higher correction
factors and in MS supporting lower correction are almost equal in number. Some Member
States did not express any preference for any of the options.
10. Almost all D10 plants are located in Member States supporting higher climate correction
factors.
R1 factor of WtE plants and trends
11. The calculation of R1 factor and the relation with BREF Incineration document referred to in
the WFD shows that all BAT 61 plants should have a R1 factor above 0.60.
12. The calculation of R1 factor and the relation with BREF Incineration document referred to in
the WFD shows that the top of BAT 62 plants have a R1 factor below 0.60.
13. More than 85% of CHP plants currently reach R1 value independently of the location, but
only 60% of the CHP plants are R1 plants in Southern Europe and 86% in Central Europe.
14. Only a quarter of electricity only plants in Southern Europe currently reach the R1 threshold
and 40% in Central Europe.
15. Only 40% of the heat plants currently reach the R1 threshold in Southern Europe and only
54% in Central Europe climate area.
16. A large number of heat only plants show R1 values well below the threshold, although it is
expected that heat only plants based on BAT should be able to reach this threshold.
17. All trendlines for European WtE plants shows an increase of R1 factor with the increase of
HDD.
18. Average R1 value for all WtE plants is currently below the 0.6 threshold only in Southern
Europe.

35
19. In the case of CHP plants and heat only plants average R1 value is currently above the
threshold, but in the case of electricity only plants average R1 value is below the 0.6
threshold.
20. More than 2/3 of the plants which will be affected by the climate correction factor are in
Central Europe and more than 60% of D10 plants are electricity only plants.
21. Some electricity only plants show higher R1 factor than some CHP plants, although it can be
expected that CHP plants perform better than electricity only plants.
22. The data available show an increase of the R1 value of heat only and electricity only plants
with increasing size.
23. The data dependence of R1 factor from the size for CHP plants demonstrates a strong
influence of technology and operating conditions too.
24. As two Member States have provided data for R1 values for two consecutive years, a non-
negligible inter-annual variability in the R1 values, broadly ranging between ±5% and ± 10%
on average has been notified.
Impact of the climate correction factors
25. Average WtE plant in Europe would need a correction value of 1.162 in order to meet R1
threshold.
26. Average CHP WtE plant in Europe would need a correction value of 1.069 in order to meet R1
threshold.
27. Average heat only WtE plant in Europe would need a correction value of 1.236 in order to
meet R1 threshold.
28. Average electricity only WtE plant in Europe would need a correction value of 1.295 in order
to meet R1 threshold.
29. The statistical analysis of existing plants shows that a R1 correction factor of 1.38 would
broadly equalize the medians of the current R1 distributions of EO and CHP&HO plants.
30. A correction factor of 1.25 would potentially allow only the top third of EO plants to reach a
R1 value higher than the median CHP&HO plant
31. A correction factor of 1.14 would potentially allow only the top sixth of EO plants to reach an
R1 value higher than the median CHP&HO plant.
Impact of different options
32. In the case of the Option A, only 2 plants will change the status from D10 to R1 and these
plants are electricity only plants from Central Europe.
33. The Option A would mean that only 2% of all plants will change status and 3% of all
electricity only plants. All other plants in other areas would not be affected.
34. In the case of the Option B+ 1.12, 18 plants would change the status and 2/3 of them would
be electricity only plants.
35. With the Option B+ 1.12, 17% of all D10 plants would change status. Overall, 22% of CHP
plants, 18% of electricity plants and 5% of heat plants which are D10 plants now would
change status.
36. In the case of the Option B 1.38, 47 plants would change the status and the average R1 value
would be above 0.6 in all climate areas.

36
37. With the Option B 1.38, 44% of all D10 plants would change status. Overall, 39% of CHP
plants, 47% of electricity plants and 37% of heat plants which are D10 plants would change
status.
38. In the case of the Option B++ 1.66, 65 plants would change the status and almost 2/3 of
them would be from Central Europe.
39. With the Option B++ 1.66, 60% of all D10 plants would change status. Overall, 57% of CHP
plants, 67% of electricity plants and 42% of heat plants which are all D10 plants now would
change status.
40. In the case of the Option B++ 1.66, climate correction would clearly over-compensate the
climate effect on the R1 values for WtE plants in favour of plants in warmer areas and leaving
no incentives for higher energy recovery from waste.
41. The cumulate capacity of current D10 plants for which data were reported amounts to
11,692,544 t/year of which 3,213,660 t/year in CHP plants 7,287,444 t/year in electricity only
plants and 1,191,640 t/year in heat only plants. In the Appendix a detailed analysis is
reported about the amount of waste processing capacity of current D10 plants that would
change status under the different options considered.
42. In the case of the Option B 1.12, 23% of the capacity of D10 CHP and electricity only plants
would change the status and 3% of the capacities of D10 heat only plants.
43. In the case of the Option B 1.25, 46% of capacity of D10 electricity only plants would change
the status, 32% of capacity from CHP plants and 33% of the capacity of D10 heat only plants.
44. In the case of the Option B 1.38, 60% of the capacity of D10 electricity only plants would
change the status, 37% of the capacity of CHP plants and 36% of the capacities of D10 heat
only plants.
45. In the case of the Option B 1.66, 79% of the capacity of D10 electricity only plants would
change the status, 58% of the capacity of CHP plants and 41% of the capacity of heat only
plants.
Based on this analysis, the suggestion for the climate correction factor for European Waste to Energy
plants is the Option B with the coefficient between 1.12 and 1.38. The average value between these
two technically justifiable options is 1.25. In this case, 37 plants would reach the R1 threshold, which
represents 34% of all D10 plants.

37
8 Appendix: Analysis of the size of D10 plants which would change
the status in the case of different options of R1 climate correction
factor
The diagram in the Figure 8.1 shows the total incineration capacity (size) of the 316 plants for which
data were provided. It has to be noted that Germany did not provide the exact data on the capacity,
but as ranges. In this case, the central values of the declared ranges were used as best estimate for
this analysis.
Figure 8.1: Total waste incineration capacities of the plants which took part in the research (t/year)
Out of waste incineration capacities of 63.8 million tonnes for which data have been provided, R1
plants have a capacity of 52.1 million tonnes, while D10 plants have a total capacity of 11.7 million
tonnes.
The Figure 8.2 shows the declared capacities by types of plants (electricity only, CHP and heat only
plants). From the diagram it is visible that most of capacities come from CHP plant, followed by
electricity only plants in the case of WtE plants as a whole plants and only R1 plants. The heat only
plants have the smallest total capacity of waste incineration. On the other hand, in the case of D10
plants, most of capacities come from electricity only plants, which is followed by CHP and heat only
plants.
As the status of R1 plants is not expected to be affected by Climate Correction Factor (CCF), the rest
of this analysis focuses on the changing status of D10 plants under different options for the Climate
Correction Factor. The overall capacity of D10 plants reported equal to 11,692,544 t/year has been
taken as the basis of the calculation.
Figure 8.3 shows the total size of D10 plants that would change the status depending on the CCF
option chosen, while Figure 8.4 shows the same quantities expressed in terms of percentage of the
total size of D10 plants analysed.

38
Figure 8.2: Capacities of WtE plants which took part in the research by types
In absolute terms, Figure 8.3 shows that the cumulated capacity of D10 plants that would change the
status in the case of the Option A would amount to 0.3 million tonnes of waste per year. In the case
of the Option B-1.12 the size of plants which would change the status would reach 2.4 million
tonnes, while in the case of the Option B-1.25 an incineration capacity of 4.7 million tonnes per year
would change status. In the case of the Option B-1.38 the total capacity involved would reach 6
million tonnes and in the case of the Option B-1.66 the total capacity would increase to 8.1 million
tonnes out of the total 11.7 million tonnes per year of D10 installed capacity will change status.
Figure 8.3: Size of D10 plants from the research which would change the status (t/year)
In terms of percentage of installed capacity, as it can be seen from the Figure 8.4, in the case of the
Option A, 2% of the overall installed capacity of D10 plants would change the status, while in the
case of the Option B-1.12 this share increases to 21%. With Option B-1.25 the share of the capacity of

39
D10 plants that would change the status reaches 41%; finally, with Option B-1.38 it increases to 51%
and to 69% in the case of the Option B-1.66.
Figure 8.4: Share of size of D10 plants which would change the status depending on the option chosen
The Figure 8.5 provides further insight in the waste incineration capacity of certain types of plants
which would change the status by different options. The Figure shows that in the case of the Option
B-1.12, out of the 2.4 million tonnes per year of D10 plants which would change the status, 1.6
million tonnes per year would come from electricity only plants and the rest would be CHP plants. In
the similar way, it can be seen that the capacity of electricity only plants have the major part in the
total capacity of all D10 plants which would change the status following all other Options.
Figure 8.5: Size of D10 plants which would change the status by type
40
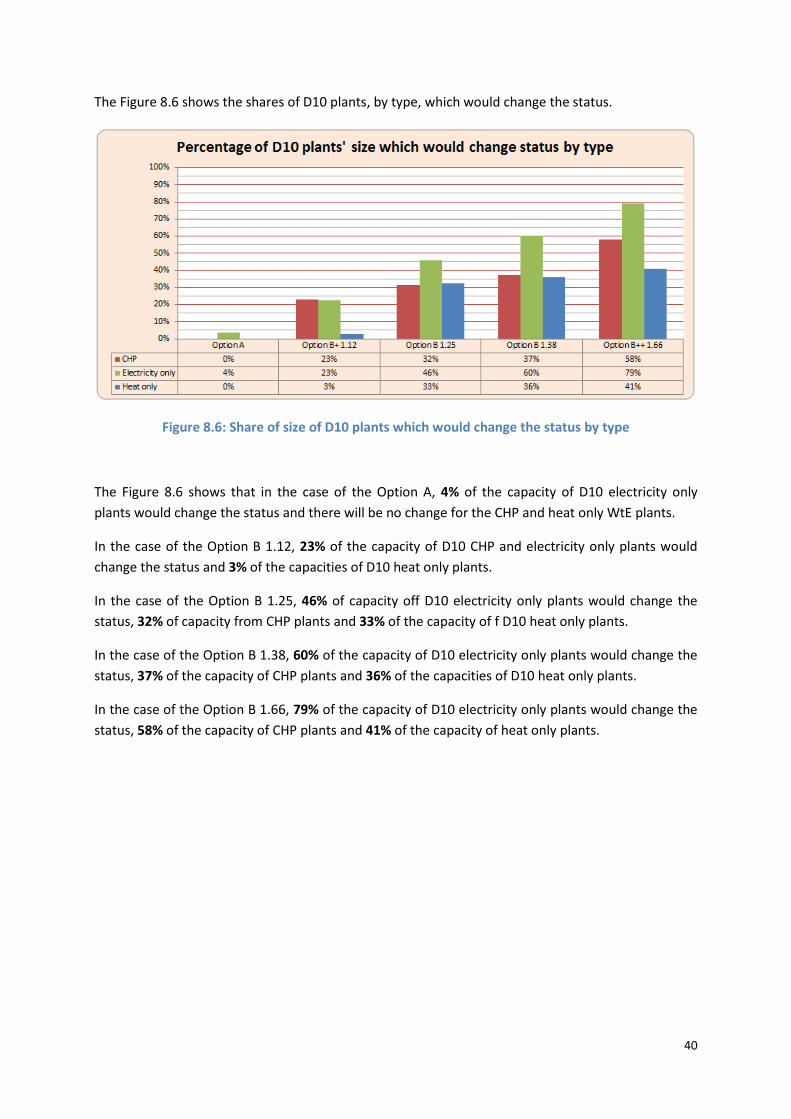
The Figure 8.6 shows the shares of D10 plants, by type, which would change the status.
Figure 8.6: Share of size of D10 plants which would change the status by type
The Figure 8.6 shows that in the case of the Option A, 4% of the capacity of D10 electricity only
plants would change the status and there will be no change for the CHP and heat only WtE plants.
In the case of the Option B 1.12, 23% of the capacity of D10 CHP and electricity only plants would
change the status and 3% of the capacities of D10 heat only plants.
In the case of the Option B 1.25, 46% of capacity off D10 electricity only plants would change the
status, 32% of capacity from CHP plants and 33% of the capacity of f D10 heat only plants.
In the case of the Option B 1.38, 60% of the capacity of D10 electricity only plants would change the
status, 37% of the capacity of CHP plants and 36% of the capacities of D10 heat only plants.
In the case of the Option B 1.66, 79% of the capacity of D10 electricity only plants would change the
status, 58% of the capacity of CHP plants and 41% of the capacity of heat only plants.
Europe Direct is a service to help you find answers to your questions about the European Union
Freephone number (*): 00 800 6 7 8 9 10 11
(*) Certain mobile telephone operators do not allow access to 00 800 numbers or these calls may be billed.
A great deal of additional information on the European Union is available on the Intern
et.
It can be accessed through the Europa server http://europa.eu.
How to obtain EU publications
Our publications are available from EU Bookshop (http://bookshop.europa.eu),
where you can place an order with the sales agent of your choice.
The Publications Office has a worldwide network of sales agents.
You can obtain their contact details by sending a fax to (352) 29 29-42758.
European Commission
EUR 26720 EN – Joint Research Centre – Institute for Energy and Transport
Title: Report on the impact of R1 climate correction factor on the Waste-to-Energy (WtE) plants based on data
provided by Member States
Author(s): Hrvoje Medarac, Nicolae Scarlat, Fabio Monforti-Ferrario, Katalin Bódis
Luxembourg: Publications Office of the European Union
2014 – 44 pp. – 21.0 x 29.7 cm
EUR – Scientific and Technical Research series – ISSN 1831-9424 (online), ISSN 1018-5593 (print)
ISBN 978-92-79-39133-0 (PDF)
ISBN 978-92-79-39134-7 (print)
doi: 10.2790/28629
doi:xx.xxxx/xxxxx

LD
-NA
-26
72
0-E
N-N
JRC Mission As the Commission’s in-house science service, the Joint Research Centre’s mission is to provide EU policies with independent, evidence-based scientific and technical support throughout the whole policy cycle. Working in close cooperation with policy Directorates-General, the JRC addresses key societal challenges while stimulating innovation through developing new methods, tools and standards, and sharing its know-how with the Member States, the scientific community and international partners.
Serving society Stimulating innovation Supporting legislation
doi: 10.2790/28629
ISBN 978-92-79-39133-0


