REPORT ON THE SURVEY ON LEVIES ADMINISTERED BY GOVERNMENT REGULATORY BODIES
i|P a g e
Table of Contents
Abstract......................................................................................................................................................ii
Introduction...............................................................................................................................................iii
Objectives of the Study............................................................................................................................iii
CHAPTER ONE..........................................................................................................................................1
1.0: Introduction......................................................................................................................................1
1.1: Sources of funding............................................................................................................................1
1.2: Current levy charges per regulatory body visited:............................................................................2
1.3: Levies Charge Reviews....................................................................................................................3
1.4: Reasons for review of the charges....................................................................................................4
1.5: Impact of the levy percentage review:..............................................................................................4
1.6: Levy collection growth curve...........................................................................................................5
1.7: Procedures in collection of levies.....................................................................................................6
1.8: Compliance Levels of the levies.......................................................................................................7
1.8.1: NCA Levy Compliance.............................................................................................................7
1.8.2: For the other regulatory bodies:.................................................................................................8
1.9: Non-Compliance...............................................................................................................................8
Levies Vs Impact on Growth.................................................................................................................10
Other Relevant Information...................................................................................................................11
CHAPTER TWO.......................................................................................................................................12
Conclusion and Recommendations.........................................................................................................12
2.0: Conclusion......................................................................................................................................12
2.2: Recommendations...........................................................................................................................12
Challenges Encountered............................................................................................................................13
ii|P a g e
Abstract
This survey was carried out by members of the research team as requested by the Research
Department. The field survey conducted on government regulatory institutions was in an effort to
benchmark the operations of the authority. Detailed information was collected from the
institutions on sources of revenue during the survey exercise, delving more on the levies as a
revenue source. This was in line with the mandate of the National Construction Authority of
undertaking or commissioning research into any matter relating to the construction industry and
doing all other things that may be necessary for the better carrying out of its functions under the
authority’s Act. The research was triggered by relevant stakeholders in the construction industry
due to the feedback received from various clients on the levy charges currently being
administered as per the NCA Act i.e. “the levy shall be in an amount not exceeding an equivalent
of 0.5% of the value of any contract whose value exceeds five million shillings”. The survey
findings are through various methodologies. Research questions were formulated and data
gathered from various government institutions, i.e. National Environmental Management
Authority (NEMA) and National Industrial Training Authority (NITA), Kenya Civil Aviation
Authority (KCAA), Kenya Airport Authority (KAA), Communication Authority (CA), Insurance
Regulatory Authority (IRA) and the Energy Regulatory Commission (ERC). The objectives of
the survey is to find out on levies charged by other government regulatory bodies and their
implementation over time. The analysis of the data gathered in the field will enable concrete
conclusions to be made and thereafter feasible recommendations done as per the conclusions in
relation with the objectives of this survey.
iii|P a g e
Introduction
The National Construction Authority (NCA) is a state corporation established by an Act of
Parliament – National Construction Authority Act No. 41 of 2011. Its overall mandate is to
oversee construction industry and coordinate its development. One of its other functions is to
undertake or commission research into any matter relating to the construction industry and to do
all other things that may be necessary for the better carrying out of its functions under the Act.
The National Construction Authority currently imposes a levy whose amount does not exceed an
equivalent of 0.5% of the value of any contract whose value exceeds five million shillings.
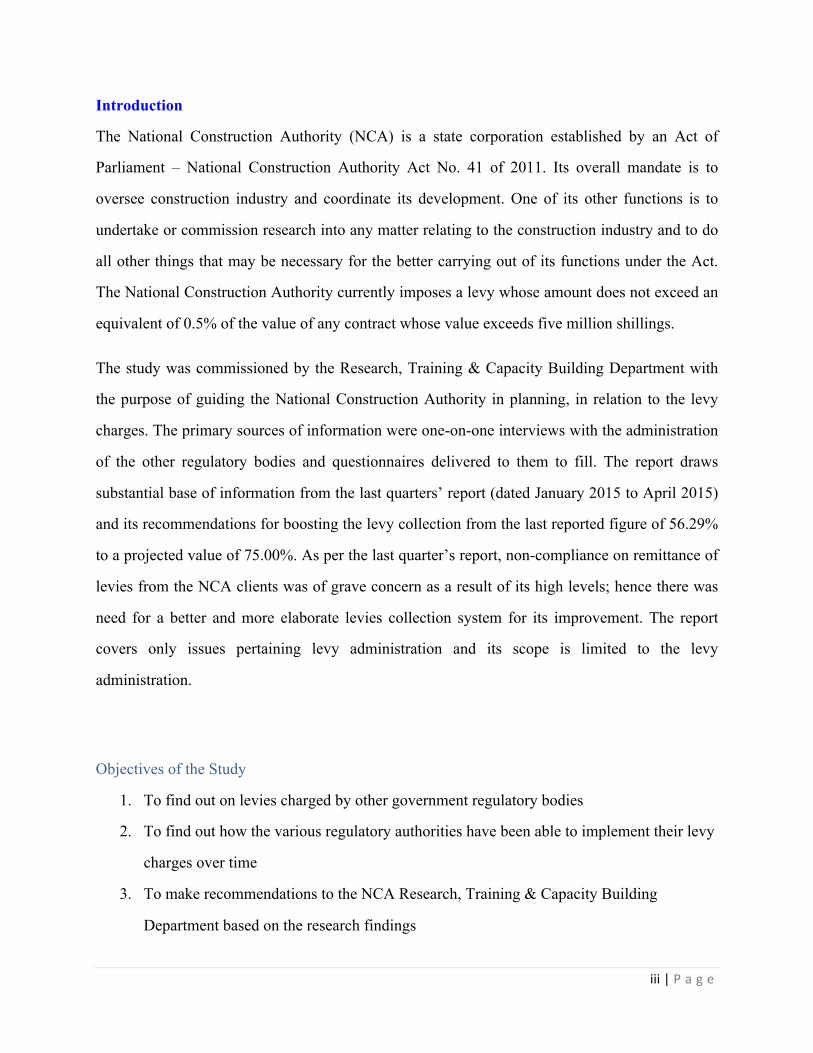
The study was commissioned by the Research, Training & Capacity Building Department with
the purpose of guiding the National Construction Authority in planning, in relation to the levy
charges. The primary sources of information were one-on-one interviews with the administration
of the other regulatory bodies and questionnaires delivered to them to fill. The report draws
substantial base of information from the last quarters’ report (dated January 2015 to April 2015)
and its recommendations for boosting the levy collection from the last reported figure of 56.29%
to a projected value of 75.00%. As per the last quarter’s report, non-compliance on remittance of
levies from the NCA clients was of grave concern as a result of its high levels; hence there was
need for a better and more elaborate levies collection system for its improvement. The report
covers only issues pertaining levy administration and its scope is limited to the levy
administration.
Objectives of the Study
1. To find out on levies charged by other government regulatory bodies
2. To find out how the various regulatory authorities have been able to implement their levy
charges over time
3. To make recommendations to the NCA Research, Training & Capacity Building
Department based on the research findings
1|P a g e
CHAPTER ONE 1.0: Introduction
This chapter presents the summary of main findings of the survey research. It similarly does a
comparison between the field findings from the other regulatory bodies and that from the
National Construction Authority. Some of the statistical data gathered are presented in tables and
graphs to give a more elaborate picture of the comparison. Analysis of the graphs and the table
values are done also in a bid to explain their cause of variation.
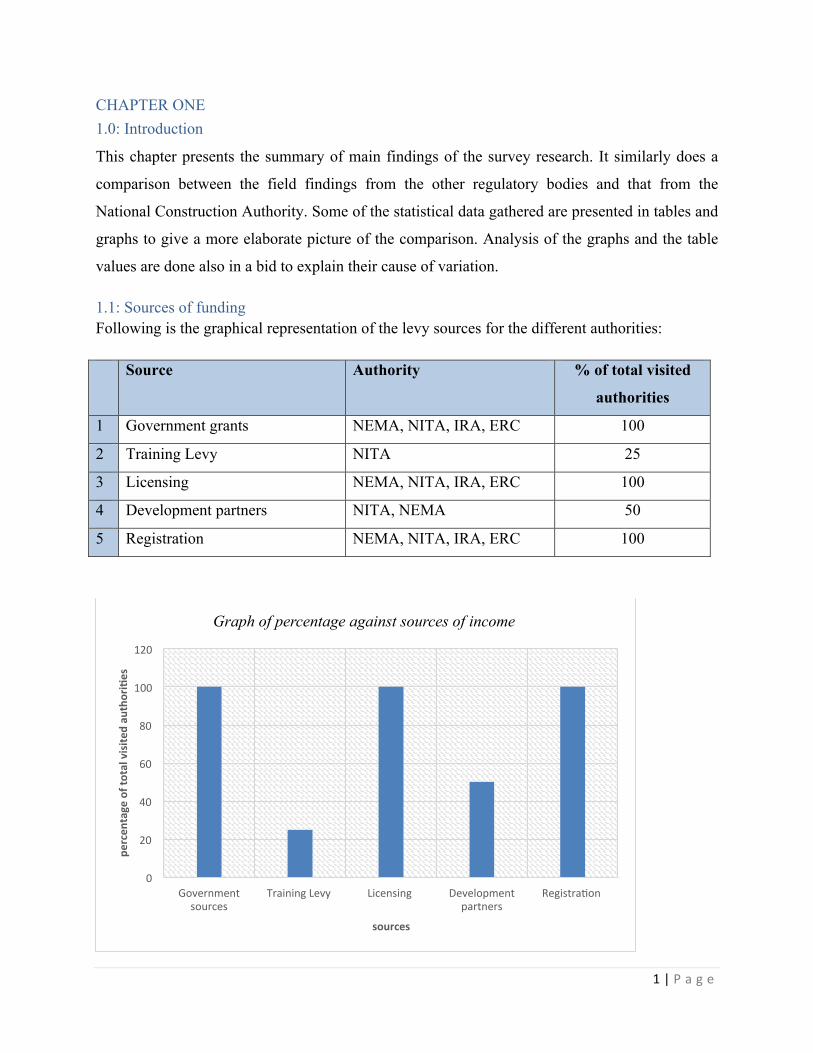
1.1: Sources of funding Following is the graphical representation of the levy sources for the different authorities:
Source Authority % of total visited
authorities
1 Government grants NEMA, NITA, IRA, ERC 100
2 Training Levy NITA 25
3 Licensing NEMA, NITA, IRA, ERC 100
4 Development partners NITA, NEMA 50
5 Registration NEMA, NITA, IRA, ERC 100
0
20
40
60
80
100
120
Governmentsources
TrainingLevy Licensing Developmentpartners
RegistraCon
perc
enta
ge o
f tot
al v
isit
ed a
utho
ri3
es
sources
Graph of percentage against sources of income
2|P a g e
From the graph above, the predominant sources of funding for the entire regulatory bodies
visited is that from the government, licensing and registration fees. Others include funds from
trainings, donors, sponsors and well-wishers. The government source is provided for by
parliament for the purposes of the authorities, and given in form of grants. The training, licensing
and the registration levies are moneys that accrue to the authorities during the performance of
their functions under their respective Acts. The funds from the development partners are moneys
from other sources that are provided for, donated or lent to the authorities. Of the total visited
regulatory bodies, only a quarter of them charged training levies. These are the levies that are
given for training purposes, ensuring that their clients are up-to-date with the current trends
either from the technological point of view or their clients gain practical knowledge required of
them.
1.2: Current levy charges per regulatory body visited: All the visited regulatory bodies had varied percentage levy charges as indicated in the table
below:
S/No. Name of
Body
Levy Charges
1 NEMA 0.1% of the total project cost
2 NITA KShs. 50 per trainee per month
3 CA
4 IRA 1.0% Insurance Premium Levy
5 ERC Between 0.11% and 0.20% depending on category and units of consumption
6 KAA
7 KCAA
8 WRMA
Table 2: Current levy charges as per the institution visited
Levy Charges as Per Various Authorities’ Act
S/No. Name of
Body
Levy Charges As Per Act
1 NEMA 10% of the total project cost
3|P a g e
2 NITA 0.25% of the total project cost
3 CA
4 IRA
5 ERC
6 KAA
7 KCAA
8 WRMA
Table 3: Initial levy charges as per the institution visited
Considering each Act of Parliament that created the bodies aforementioned, it is apparent that the
charges levied above have been reviewed over time from their original values.
1.3: Levies Charge Reviews It was apparent that most of the regulatory bodies had imposed a definite levy percentage on the
clients, based on the total project cost. Some had monthly fixed charges on the clients,
disregarding the project costs. Further, the research established that all the bodies began upon
their establishment, to charge a fixed rate percentage on the project costs as per their respective
Acts. However, with time, there was a review of their charges based upon prevailing
circumstances mentioned herein.
Authorities % of the Total Visited
Reviewed their levy charges NEMA, NITA, IRA, ERC 100
Never Reviewed since formation - 0
Table 4: Percentage number of bodies that have reviewed their levy charges since their formation
Resulting graphical illustration of the above table:
4|P a g e
1.4: Reasons for review of the charges Varied reasons were given for the reviews, which included:
• To aid in funding implementation of new strategic plan objectives/activities in line with
expanded mandate
• The public outcry by the relevant stakeholders, who felt that the previous levy charges
were high
• Too much pressure from the stakeholders to revise levy.
• For ease of operations/doing business.
• Improve compliance
1.5: Impact of the levy percentage review: It was noted that over 100% of the regulatory bodies visited had at one point reviewed their levy
charges, because of the reasons mentioned above. After their reviews were made, there has been
generally a positive feedback from their relevant stakeholders. With their reviews in place there
has also been an annual steady increase in the total levies collected, as tabulated below:
S/No. Name of Regulatory Body Annual % Increase on the total levies
1 National Environmental Management Authority
(NEMA)
20
100
0
% AUTHORITIES THAT HAVE R E V I E W E D T H E I R L E V Y C H A R G E S
Reviewedtheirlevycharges NeverReviewedsinceformaCon
5|P a g e
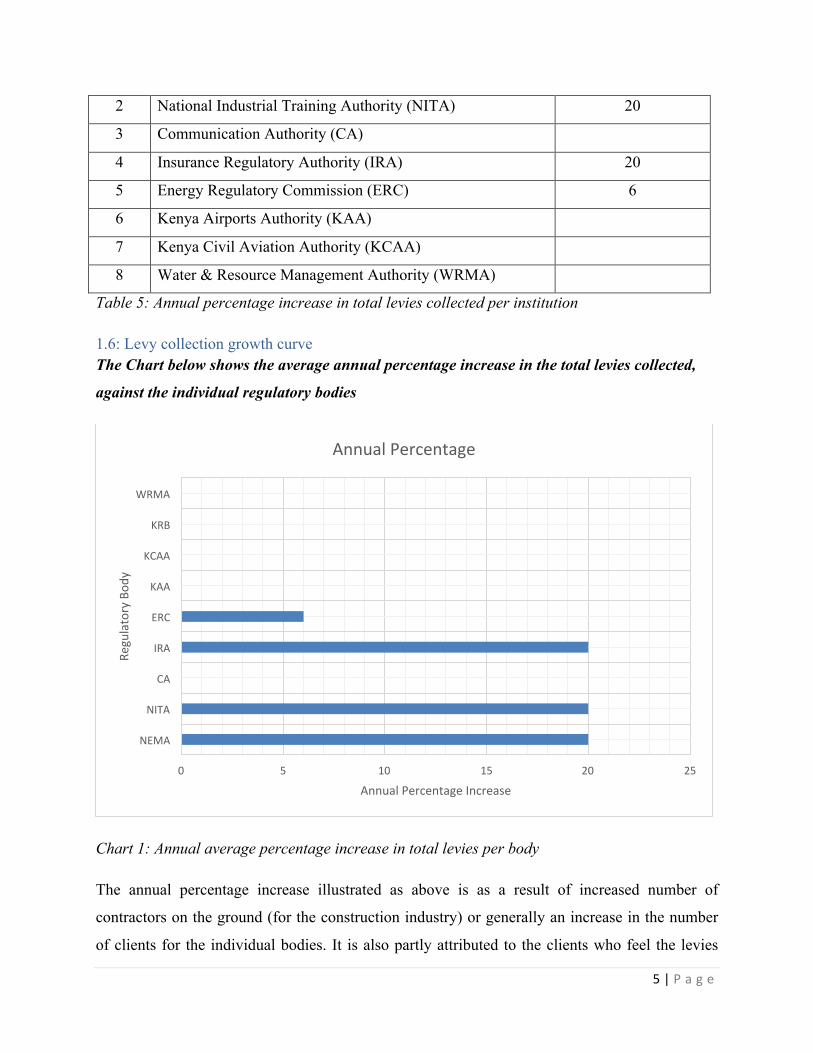
2 National Industrial Training Authority (NITA) 20
3 Communication Authority (CA)
4 Insurance Regulatory Authority (IRA) 20
5 Energy Regulatory Commission (ERC) 6
6 Kenya Airports Authority (KAA)
7 Kenya Civil Aviation Authority (KCAA)
8 Water & Resource Management Authority (WRMA)
Table 5: Annual percentage increase in total levies collected per institution
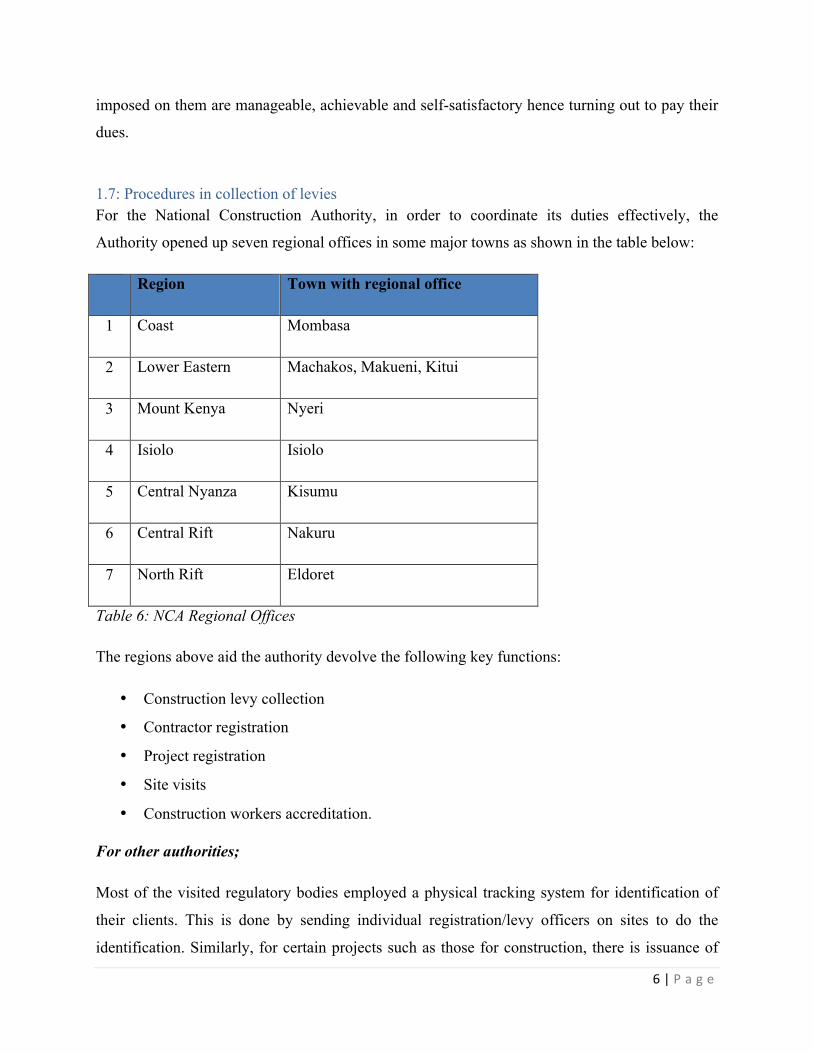
1.6: Levy collection growth curve The Chart below shows the average annual percentage increase in the total levies collected,
against the individual regulatory bodies
Chart 1: Annual average percentage increase in total levies per body
The annual percentage increase illustrated as above is as a result of increased number of
contractors on the ground (for the construction industry) or generally an increase in the number
of clients for the individual bodies. It is also partly attributed to the clients who feel the levies
0 5 10 15 20 25
NEMA
NITA
CA
IRA
ERC
KAA
KCAA
KRB
WRMA
AnnualPercentageIncrease
RegulatoryBod
y
AnnualPercentage
6|P a g e
imposed on them are manageable, achievable and self-satisfactory hence turning out to pay their
dues.
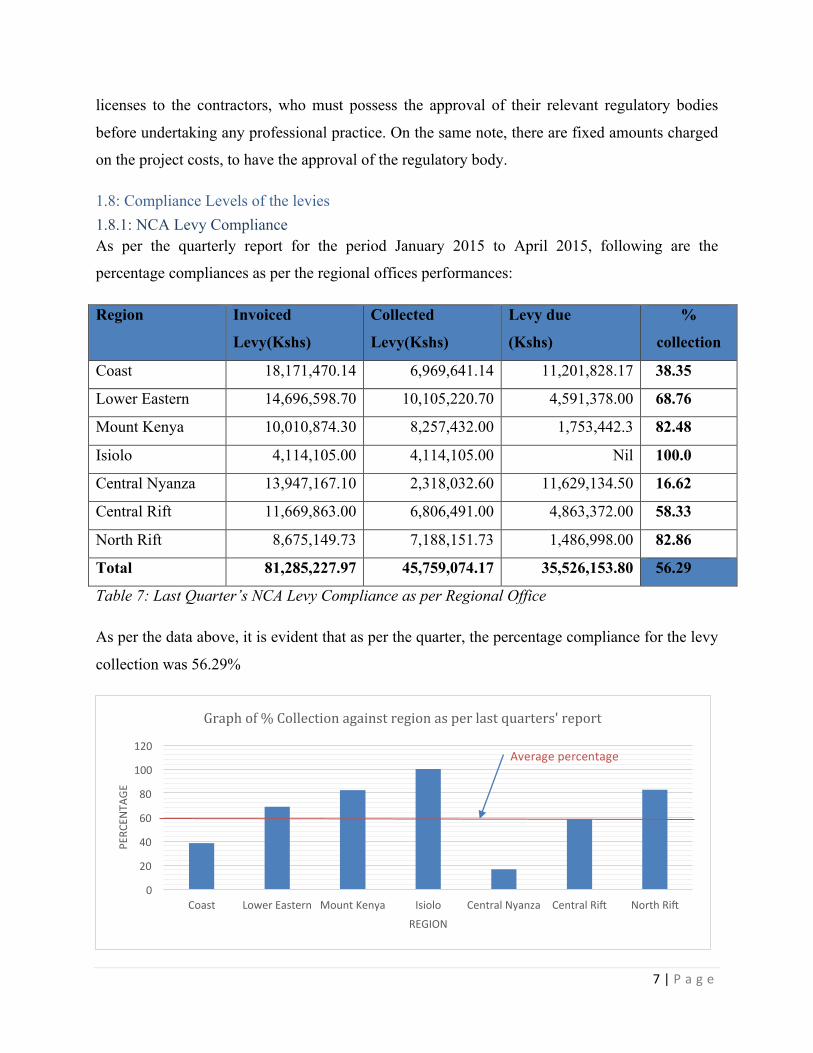
1.7: Procedures in collection of levies For the National Construction Authority, in order to coordinate its duties effectively, the
Authority opened up seven regional offices in some major towns as shown in the table below:
Region Town with regional office
1 Coast Mombasa
2 Lower Eastern Machakos, Makueni, Kitui
3 Mount Kenya Nyeri
4 Isiolo Isiolo
5 Central Nyanza Kisumu
6 Central Rift Nakuru
7 North Rift Eldoret
Table 6: NCA Regional Offices
The regions above aid the authority devolve the following key functions:
• Construction levy collection
• Contractor registration
• Project registration
• Site visits
• Construction workers accreditation.
For other authorities;
Most of the visited regulatory bodies employed a physical tracking system for identification of
their clients. This is done by sending individual registration/levy officers on sites to do the
identification. Similarly, for certain projects such as those for construction, there is issuance of
7|P a g e
licenses to the contractors, who must possess the approval of their relevant regulatory bodies
before undertaking any professional practice. On the same note, there are fixed amounts charged
on the project costs, to have the approval of the regulatory body.
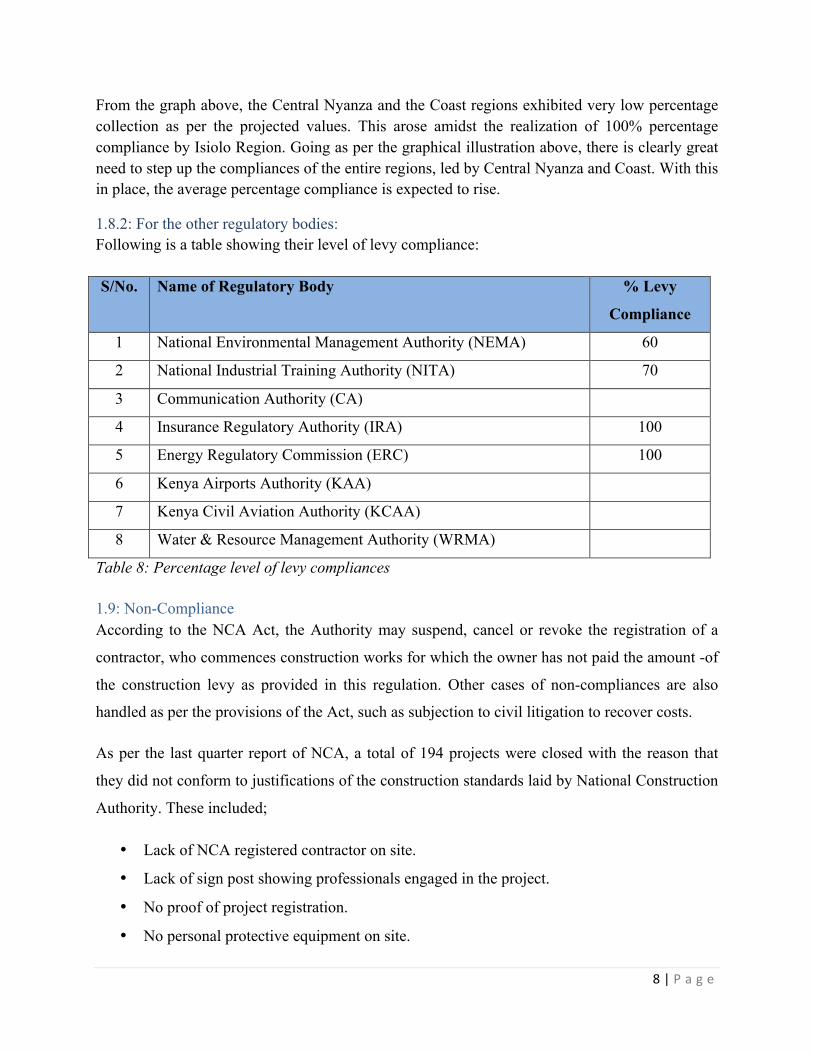
1.8: Compliance Levels of the levies 1.8.1: NCA Levy Compliance As per the quarterly report for the period January 2015 to April 2015, following are the
percentage compliances as per the regional offices performances:
Region Invoiced
Levy(Kshs)
Collected
Levy(Kshs)
Levy due
(Kshs)
%
collection
Coast 18,171,470.14 6,969,641.14 11,201,828.17 38.35
Lower Eastern 14,696,598.70 10,105,220.70 4,591,378.00 68.76
Mount Kenya 10,010,874.30 8,257,432.00 1,753,442.3 82.48
Isiolo 4,114,105.00 4,114,105.00 Nil 100.0
Central Nyanza 13,947,167.10 2,318,032.60 11,629,134.50 16.62
Central Rift 11,669,863.00 6,806,491.00 4,863,372.00 58.33
North Rift 8,675,149.73 7,188,151.73 1,486,998.00 82.86
Total 81,285,227.97 45,759,074.17 35,526,153.80 56.29
Table 7: Last Quarter’s NCA Levy Compliance as per Regional Office
As per the data above, it is evident that as per the quarter, the percentage compliance for the levy
collection was 56.29%
0
20
40
60
80
100
120
Coast LowerEastern MountKenya Isiolo CentralNyanza CentralRiR NorthRiR
PERC
ENTA
GE
REGION
Graphof%Collectionagainstregionasperlastquarters'report
Averagepercentage
8|P a g e
From the graph above, the Central Nyanza and the Coast regions exhibited very low percentage collection as per the projected values. This arose amidst the realization of 100% percentage compliance by Isiolo Region. Going as per the graphical illustration above, there is clearly great need to step up the compliances of the entire regions, led by Central Nyanza and Coast. With this in place, the average percentage compliance is expected to rise.
1.8.2: For the other regulatory bodies: Following is a table showing their level of levy compliance:
S/No. Name of Regulatory Body % Levy
Compliance
1 National Environmental Management Authority (NEMA) 60
2 National Industrial Training Authority (NITA) 70
3 Communication Authority (CA)
4 Insurance Regulatory Authority (IRA) 100
5 Energy Regulatory Commission (ERC) 100
6 Kenya Airports Authority (KAA)
7 Kenya Civil Aviation Authority (KCAA)
8 Water & Resource Management Authority (WRMA)
Table 8: Percentage level of levy compliances
1.9: Non-Compliance According to the NCA Act, the Authority may suspend, cancel or revoke the registration of a
contractor, who commences construction works for which the owner has not paid the amount -of
the construction levy as provided in this regulation. Other cases of non-compliances are also
handled as per the provisions of the Act, such as subjection to civil litigation to recover costs.
As per the last quarter report of NCA, a total of 194 projects were closed with the reason that
they did not conform to justifications of the construction standards laid by National Construction
Authority. These included;
• Lack of NCA registered contractor on site.
• Lack of sign post showing professionals engaged in the project.
• No proof of project registration.
• No personal protective equipment on site.
9|P a g e
• Lack of sufficient fencing.
• No proof of statutory approvals.
The other regulatory bodies that were part of the survey also had varied levels of non-
compliances. Their modes of dealing with their cases are explicitly laid down as per their
respective acts.
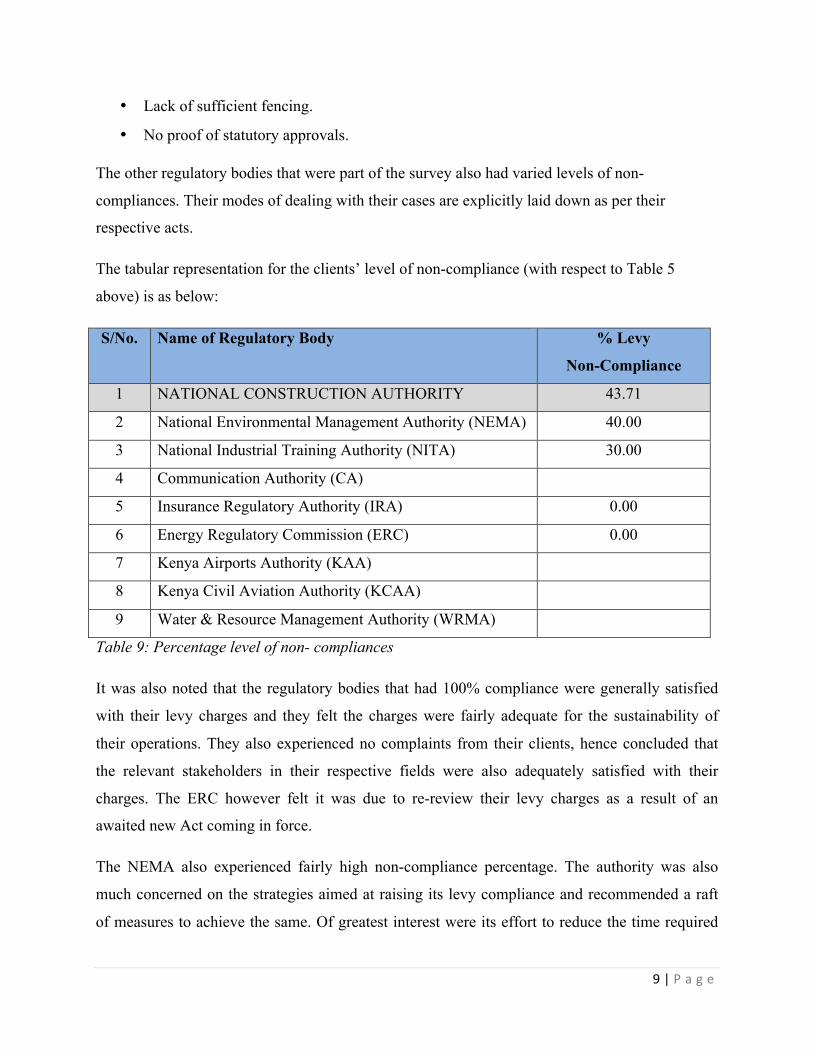
The tabular representation for the clients’ level of non-compliance (with respect to Table 5
above) is as below:
S/No. Name of Regulatory Body % Levy
Non-Compliance
1 NATIONAL CONSTRUCTION AUTHORITY 43.71
2 National Environmental Management Authority (NEMA) 40.00
3 National Industrial Training Authority (NITA) 30.00
4 Communication Authority (CA)
5 Insurance Regulatory Authority (IRA) 0.00
6 Energy Regulatory Commission (ERC) 0.00
7 Kenya Airports Authority (KAA)
8 Kenya Civil Aviation Authority (KCAA)
9 Water & Resource Management Authority (WRMA)
Table 9: Percentage level of non- compliances
It was also noted that the regulatory bodies that had 100% compliance were generally satisfied
with their levy charges and they felt the charges were fairly adequate for the sustainability of
their operations. They also experienced no complaints from their clients, hence concluded that
the relevant stakeholders in their respective fields were also adequately satisfied with their
charges. The ERC however felt it was due to re-review their levy charges as a result of an
awaited new Act coming in force.
The NEMA also experienced fairly high non-compliance percentage. The authority was also
much concerned on the strategies aimed at raising its levy compliance and recommended a raft
of measures to achieve the same. Of greatest interest were its effort to reduce the time required
10|P a g e
for a client to acquire a license, introduce an online payment for licenses and its forecasted plan
to digitize the licensing process (including payment) to reduce the time taken to bank money for
licensing. It is their hope that once this is achieved, their goal of raising their levy compliance
will be achieved.
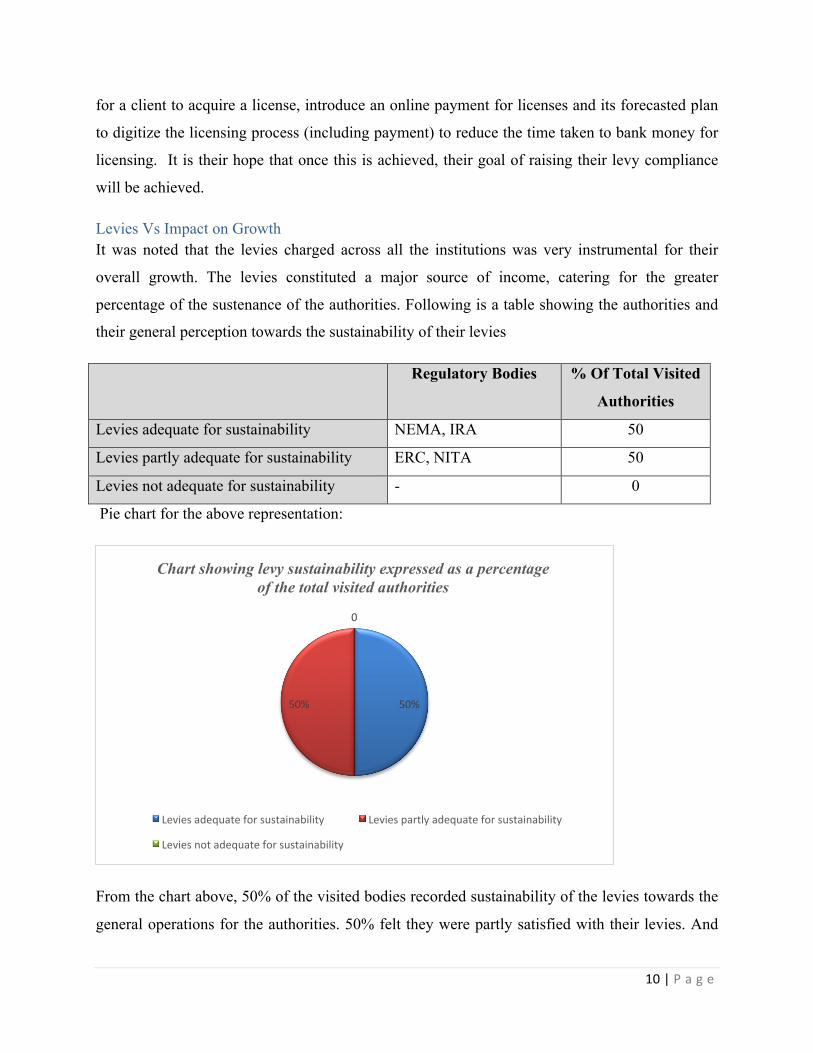
Levies Vs Impact on Growth It was noted that the levies charged across all the institutions was very instrumental for their
overall growth. The levies constituted a major source of income, catering for the greater
percentage of the sustenance of the authorities. Following is a table showing the authorities and
their general perception towards the sustainability of their levies
Regulatory Bodies % Of Total Visited
Authorities
Levies adequate for sustainability NEMA, IRA 50
Levies partly adequate for sustainability ERC, NITA 50
Levies not adequate for sustainability - 0
Pie chart for the above representation:
From the chart above, 50% of the visited bodies recorded sustainability of the levies towards the
general operations for the authorities. 50% felt they were partly satisfied with their levies. And
50%50%
0
Chart showing levy sustainability expressed as a percentage of the total visited authorities
Leviesadequateforsustainability Leviespartlyadequateforsustainability
Leviesnotadequateforsustainability
11|P a g e
none felt the levies were not adequate for their sustainability. The 50% that recorded partial
satisfaction expressed their need for further revision of their levies either in accordance with their
new act coming in place, or generally with the approval of their board stakeholders (which
included Federation of Kenya Employers (FKE), Central Organization of Trade Union (COTU)
and the Kenya Government). For the NITA, despite their partial satisfaction, both their
administration and their clients felt that the levies imposed were low.
Other Relevant Information The general feeling from 50% of the regulatory bodies visited was that the NCA levies were
high. This, as per their perception, is one of the factors behind non-compliance on levies
collection. During the interviewing process, the CA expressed the need for NCA to come up with
a database on the licensed contractors and their categories. This was as a result of them being
unable to verify the licensed contractors from the NCA website.
The NITA interviewee recommended addition of more value to the NCA levies imposed on
clients, i.e. by conducting regular trainings to clients, offering certificates and awards to clients
and improving of timely delivery of services such as digitization of payments. This, to them, was
to win clients’ satisfaction and in the long run result into greater levels of levy compliance.
With the partial satisfaction of NITA with its levy charges, it resolved to improve its compliance
levels also by employment of sensitization via the media. The interviewee explained that several
of its clients may not be aware of NITA operations and with this resolution, it forecasted to reach
a larger audience about its operations.
12|P a g e
CHAPTER TWO
Conclusion and Recommendations 2.0: Conclusion
From the discussions above, it is evident that the percentage compliance of the levies received by
the National Construction Authority is lowest, in comparison to other bodies. Of all the visited
regulatory authorities, it was established that only NCA has strictly adhered to their provisions as
per their Act and has never done any amendment on the levies section.
The level of compliance in the collection process of the levy is partly attributed to the manual
system of the fund’s collection. For the authorities that employed a computerized system for
their levy collections, their compliance level was 100% such as the ERC and the IRA.
All the regulatory authorities visited had a forecasted plan to re-revise their levies. This is true
both for those that exhibited 100% compliance and those with lower compliance levels
2.2: Recommendations From the previous discussions on the main findings, following are the recommendations for
consideration by the NCA administration:
1. More human resources to be availed on the different regions to aid in tracking of levies from
defaulters
2. That there is need for revision of the levies to achieve more affordability to the NCA clients
and construction projects. In the revision, lower limits and upper limits need to be clearly
defined as per the total project costs
3. There is also need to add more value on the levies collected by the NCA, e.g. by conducting
regular trainings to clients, issuance of certificates/awards and having timely service delivery
to boost satisfaction
4. That to curb defaults of levy payments, more stringent measures need to be subjected to
defaulters. This will ensure greater adherence to NCA regulations on the side of the clients
5. There is need to create more awareness on the levy charges to the public. This is to be done
by forecasting on increased sensitization via the media, on the various NCA operations as
outlined in the NCA Act
13|P a g e
6. That there is need for digitalization of payments. This will hasten the process of remittance of
the levies and in return boost the percentage of compliance
7. Generally, the NCA regional offices are fairly vibrant as per the last quarter’s report with the
56% compliance in their levies collection. With more resourcing, there is great potential of
boosting their performance and thus enhanced attainment of NCA’s mandate.
Challenges Encountered During the survey process, following are the challenges that the researchers encountered:
1. Reluctance in giving full and in-depth information by the government regulatory bodies
during the interview and questionnaire filling process
2. Conducting of follow-ups to the administration heads left with the questionnaires to fill,
as some took longer to submit the questionnaire forms to relevant departmental
representatives for filling
3. There was delay in submission of the report as a result of delay in filling of the
questionnaires and their subsequent submission