
RR EE PP OO RR TT TT OO TT HH EE LL EE GG II SS LL AA TT UU RR EE PP UU RR SS UU AA NN TT TT OO
PP EE NN AA LL CC OO DD EE SS EE CC TT II OO NN 11 11 77 00 ..44 55
The Disposition of Criminal Cases According to the Race and Ethnicity of the Defendant
May 2001
Prepared by
Administrative Office of the Courts
Research and Planning Unit

Table of Contents Background ................................................................................................................1
Limitations of the Findings ......................................................................................1
Data Information and Limitations ...........................................................................1 Source of data.................................................................................................1 Limitations ......................................................................................................2
Findings ......................................................................................................................4 Demographics of felony defendants............................................................4 Disposition by race/ethnicity........................................................................7
Conclusions ..............................................................................................................13
Appendix...................................................................................................................16 Text of penal code section 1170.45...........................................................16 Methodology ................................................................................................16 Frequencies...................................................................................................17
Figures
Figure 1: Gender ........................................................................................................4
Figure 2: Age..............................................................................................................5
Figure 3: Race/ethnicity............................................................................................6
Figure 4: Prior criminal record ................................................................................7
Figures 5A–5F: Sentence classification by race/ethnicity................................ 8-9
Figures 6A and 6B: Sentence classification by race/ethnicity, controlling for prior record.....................................................................................10
Figures 7A–7C: Type of sentence by race/ethnicity...........................................11
Figures 8A–8C: Type of sentence by race/ethnicity, controlling for prior record.....................................................................................12

1
BACKGROUND In 1997 the California Legislature enacted Penal Code section 1170.45, which directs the Judicial Council to report annually on the disposition of criminal cases statewide according to the race and ethnicity of the defendant. The complete text of Penal Code section 1170.45 can be found in the appendix. The statute does not specify which types of criminal cases to use for the study that is the basis for this report. The Research and Planning Unit of the Administrative Office of the Courts analyzed felony cases for this study. The data used in the analysis are from 1997, the last year for which complete annual data are available from the California Department of Justice (DOJ). LIMITATIONS OF THE FINDINGS The lack of data on sentence length and specific type of prior record limits the conclusions one can confidently make about any observed differences in sentencing by race or ethnicity of the defendant. Having more detailed information in these categories would control for a wider array of factors and, thus, enable a more precise comparison of sentencing outcomes for different racial and ethnic groups. As a result, the findings contained in this report cannot be used on their own as an indication of bias or to identify the cause for differences in sentences within the California criminal justice system. In addition, a sentencing outcome is the consequence of many intermediate and interdependent steps within the criminal justice system from arrest to sentencing. Therefore, studies of sentencing outcomes involve extremely complex issues that are dependent on a variety of factors external to the courts such as federal policies (e.g., border interdictions), local policing activities, and district attorney practices. Under California’s determinate sentencing law, sentencing itself is among the least discretionary stages in the adjudication of a criminal case. DATA INFORMATION AND LIMITATIONS Source of Data
The Criminal Justice Statistics Center (CJSC) of the DOJ is responsible for maintaining the Offender-Based Transaction Statistics (OBTS) report file, which tracks the processing of an individual offender from the point of entry into the criminal justice system to the point of exit. The data used for this study were obtained from the OBTS file.

2
Two major source documents are combined to make up the OBTS file: (1) fingerprint cards (FD249), which represent official arrests, and (2) Disposition of Arrest and Court Action (JUS 8715) forms, referred to hereinafter as dispositions. Approximately 1,200 agencies reported dispositions of adult felony arrests in 1997. Those agencies include law enforcement, prosecutor, and other court agencies in all 58 counties. Limitations
The CJSC highlighted the following limitations for consideration in using their OBTS data file:
Ø OBTS data are based upon the year of disposition regardless of when the felony arrest occurred, and may be reported a year or more after the actual arrest.
Ø The data do not represent the total number of adult felony arrests or total number of dispositions made during a given year. In 1992, for example, JUS 8715 reports (dispositions) were received for only about 60 percent of adult felony arrests that received dispositions during the calendar year.
Ø In December 1998, the Santa Barbara County District Attorney requested that the DOJ include a letter with the released Santa Barbara County data, reflecting the district attorney’s “long-standing and deep concerns about the accuracy of this [arrest and disposition] information” contained in the OBTS file.
Ø Despite this underreporting, the CJSC is confident that the arrest dispositions received generally describe statewide processing of adult felony arrestees.
Ø Comparisons of county and local data should be made with caution, since the level of reporting may vary between jurisdictions and from year to year.
Ø Only the final disposition of an arrest event is included in the OBTS file; intermediate dispositions, such as diversion programs, suspended proceedings, reopenings, retrials, and subsequent actions, are not included.
Ø OBTS data on state institutional commitments may vary from data compiled and reported by other state agencies because of differences in the data collection systems and criteria. For example, the California Department of Corrections (CDC) counts the number of defendants actually admitted to CDC institutions, even though a defendant may have been convicted and sentenced in two or more counties. The CJSC counts each commitment as a separate disposition.
Ø If a person is arrested for multiple offenses, the OBTS file contains only the most serious offense, based on the severity of possible punishment. If there
3
are multiple court dispositions, the OBTS file contains only the most serious court disposition and the associated offense.
Ø The OBTS file contains only information on the type of sentence (e.g., felony sentence, misdemeanor sentence, infraction) and a broad sentence classification (e.g., probation, jail, prison) for each conviction; there is no measure of sentence severity (e.g., length of prison sentence).
Ø Caution should be used when comparing conviction and nonconviction dispositions, since budget constraints necessitated the processing of conviction dispositions on the basis of priority.
Ø Information on prior records is incomplete since it is computed only for “new offenders,” those who had a first arrest after August 1982.

4
FINDINGS The OBTS file for 1997 contains a total of 326,768 records; in other words, 326,768 adults arrested for felony-level offenses in calendar year 1997 or earlier received dispositions in calendar year 1997. Again, we emphasize that this number represents only about 60 percent of adult felony arrests receiving dispositions in 1997. The appendix contains a brief description of the methodology used and presents the frequencies of all the data represented in the charts and graphs of this report. Demographics of Felony Defendants
Following is a demographic profile of the population of felony defendants in the OBTS file who received dispositions in 1997. Gender
Males made up 81.1 percent of the defendants reported to have received dispositions in 1997; females made up 18.9 percent (Figure 1). These proportions are consistent with those reported by other agencies, such as the U.S. Department of Justice in its 1996 study of felony sentences in state courts. Males make up a disproportionately high number of the felony defendants in the OTBS file compared to their proportion in the general population of California1.
1 United States Census Bureau, 1997 estimates.
Figure 1: Gender
Female 18.9%
Male 81.1%

5
Age
The OBTS file contains the date of birth and date of arrest for each felony defendant. Values for “age” therefore represent the age at the time of arrest. These values were classified into the following age categories used by the U.S. Department of Justice: ages 13–19, 20–29, 30–39, 40–49, 50–59, and 60 or greater. The average age of a felony defendant at the time of arrest was 31 years, with persons aged 20–29 (38 percent) and 30–39 (33 percent) being arrested most frequently. Figure 2 shows the complete distribution by age of all felony defendants in the OBTS file. Compared to the California population as a whole, persons aged 20–29 and 30–39 were arrested for felony-level offenses at a disproportionately high rate, whereas persons aged 50–59 and 60 or greater were arrested at a disproportionately low rate. Persons aged 13–19 and 40–49 years were arrested at rates slightly lower than their proportions in the general population. Race/Ethnicity
Racial/ethnic data on criminal defendants were reclassified according to the categories used by the Census Bureau of the U.S. Department of Commerce. These categories are “Asian/Pacific Islander,” “Black,” “Caucasian,” “Hispanic,” and “Native
Figure 2: Age
10%
38%
33%
14%
3%1%
0%
5%
10%
15%
20%
25%
30%
35%
40%
13–19 30–39 40–49 50–59 20–29 60+

6
American” (Figure 3). Those persons identified as “other” or “unknown” in the OBTS file were grouped into a single “Other/unknown” category. Caucasians made up the greatest percentage of reported felony defendants in 1997 (35 percent), followed by Hispanics (31 percent) and Blacks (22 percent). Asians/Pacific Islanders (2 percent) and Native Americans (1 percent) represent only a small proportion of the 1997 felony arrest population. Of the approximately 10 percent of the felony defendant population classified as “Other/unknown,” the vast majority were identified as belonging to an “unknown” racial/ethnic group in the OBTS file. Hispanics and Blacks were arrested for felony-level offenses at rates significantly greater than their proportions in the general population. Conversely, Asians/Pacific Islanders and Caucasians were arrested at a disproportionately low rate compared to their proportion in the general population. Native Americans were arrested at a rate comparable to their proportion in the state’s population. Prior Criminal Record
The OBTS file contains a field that identifies the type of prior record, if any, for each felony arrestee.
Figure 3: Race/ethnicity
0%
5%
10%
15%
20%
25%
30%
35%
40%
Asian/ Pacific
Islander
Black Caucasian Hispanic Native American
Other/ Unknown
2%
22%
35%
31%
1%
10%

7
Information is limited to whether the arrestee has prior prison commitments, a miscellaneous prior record, or no prior record. A significant percentage of records (28 percent) were missing information for the prior record field. Of those that contained valid information, almost two-thirds (63 percent) had “miscellaneous prior records” while only 8 percent had one or more prior prison commitments. The remaining 29 percent of felony arrestees in the OBTS file had no identified prior records. In addition to these limitations, the reader is reminded that information on prior records is available only for those who had a first arrest after August 1982. Disposition by Race/Ethnicity
The following section addresses the report mandated by Penal Code section 1170.45 – the disposition of felony cases according to the race/ethnicity of the defendant. Our analysis is based on two types of sentencing information: a broad sentence classification (e.g., prison, jail, probation) and the type of sentence (e.g., felony sentence, misdemeanor sentence) handed down for each conviction. We have no data on sentence length, so we can rank the available sentencing information by severity in a general manner only.
Figure 4: Prior criminal record
No prior record–29%
Miscellaneous prior record–63%
One or more prior prison
commitments–8%

8
Sentence Classification
The OBTS file contains a field that provides a broad sentence classification for each conviction. In order to achieve sufficient sample sizes to make statistically sound comparisons, only the most frequent sentence categories were used for this study. The following sentence categories, which together represent less than 1 percent of the total, were excluded from analysis: “CRC [California Rehabilitation Center],” “CYA [California Youth Authority],” “Death,” “Prison term suspended,” and “Other.” Defendants in the OBTS file with missing sentence information due to dismissed or acquitted cases were classified in a new sentence category, “Dismissed/acquitted.” The reader should exercise caution when drawing comparisons using Asian/Pacific Islander and Native American populations due to their small sample sizes in the OBTS file. Because of this, the analysis contained in this report focuses on defendants from the Black, Caucasian, and Hispanic racial/ethnic groups. The graphs in this section, Figures 5A through 5F, illustrate the proportion of defendants from each racial/ethnic group who received each sentence category.
Figures 5A-5F: Sentence classification by race/ethnicity2
2 Each figure illustrates the proportion of felony defendants from each racial/ethnic group who received a particular sentence. For each racial/ethnic group, the proportions represented in the six graphs of sentence classifications add up to 100 percent.
Asian/PacificIslander
Black
Caucasian
Hispanic
Native American
0% 5% 10% 15% 20% 25%
13%
12%
23%
15%
20%
Figure 5A: Prison Scale: 0 to 25 percent
Asian/PacificIslander
Black
Caucasian
Hispanic
Native American
0% 10% 20% 30% 40% 50% 60% 70%
53%
60%
51%
54%
57%
Figure 5B: Probation and jail Scale: 0 to 70 percent
Asian/PacificIslander
Black
Caucasian
Hispanic
Native American
0% 1% 2% 3% 4% 5%
4.7%
2.0%
3.1%
3.5%
3.0%
Figure 5C: Jail Scale: 0 to 5 percent

9
There are some statistically significant 2 differences in the sentences received by Blacks, Caucasians, and Hispanics. Caucasians were less likely to receive the most severe sentence studied (prison) than were Blacks or Hispanics. Almost one-quarter of Blacks received prison sentences compared to 20 percent of Hispanics and only 15 percent of Caucasians. Conversely, Caucasians were more likely to receive less severe sentences (i.e., dismissal/acquittal, probation, and fine) than were Blacks or Hispanics. This is especially true of probation, where the differences are significant. Blacks and Hispanics received similar proportions of “Probation” and “Fine” sentences, although Hispanics were less likely to have their cases dismissed or be acquitted than Blacks. There were no major differences among Blacks, Caucasians, and Hispanics in the proportions of sentences involving jail combined with probation or jail.
2 See appendix for a brief description of the statistical methods used in this report.
Asian/PacificIslander
Black
Caucasian
Hispanic
Native American
0% 5% 10% 15% 20%
19%
16%
16%
18%
13%
Figure 5F: Dismissed/acquitted Scale: 0 to 20 percent
Asian/PacificIslander
Black
Caucasian
Hispanic
Native American
0% 2% 4% 6% 8% 10%
9.2%
9.4%
6.0%
8.5%
6.2%
Figure 5D: Probation Scale: 0 to 10 percent
Asian/PacificIslander
Black
Caucasian
Hispanic
Native American
0.0% 0.5% 1.0% 1.5% 2.0%
1.0%
0.6%
0.4%
0.7%
0.5%
Figure 5E: Fine Scale: 0 to 2 percent

10
Sentence Classification–Controlling for Prior Record A separate analysis was conducted to control for any effect prior record could have on differences in sentencing according to the race/ethnicity of the defendant. Figures 6A and 6B represent this analysis for only the least severe sentence (dismissal/acquittal) and the most severe sentence (prison). As might be expected, defendants with more serious prior records were less likely to have their cases dismissed or be acquitted and more likely to receive prison sentences. Caucasians were more likely than Blacks or Hispanics to have their cases dismissed or be acquitted when they had no prior record. For defendants with “miscellaneous” prior records, there were no differences between Caucasians and Blacks; however, Hispanics had their cases dismissed or were acquitted less frequently. Blacks with one or more prior prison commitments were more likely to have their cases dismissed or be acquitted than were Caucasians, who in turn were more likely to experience these outcomes than were Hispanics.
Figures 6A and 6B: Sentence classification by race/ethnicity, controlling for prior record
0% 20% 40% 60% 80%
Black
Caucasian
Hispanic
No prior record
Miscellaneousprior record
One or more prior prison
commitments
Figure 6A: Prison sentence
6%
4%
8%
17%
13%
19%
57%
61%
65%
0% 5% 10% 15% 20% 25% 30%
Black
Caucasian
Hispanic
No prior record
Miscellaneousprior record
One or more prior prison
commitments
Figure 6B: Dismissed/acquitted
20%
25%
16%
16%
16%
12%
15%
11%
9%

11
Type of Sentence
Figures 7A through 7C provide the distribution by racial/ethnic group for the three most frequent types of sentences in the OBTS file: “felony conviction, felony sentence,” “felony conviction, misdemeanor sentence,” and “misdemeanor conviction” (along with an assumed misdemeanor sentence). Blacks were more likely to receive the most severe type of outcome (felony conviction, felony sentence) than were defendants from any other racial/ethnic group. Hispanics convicted of felonies were given felony sentences at a slightly higher rate than were Caucasians convicted of felonies. Caucasians convicted of felonies were given misdemeanor sentences more often than were Blacks convicted of felonies. Hispanics were significantly less likely than either Caucasians or Blacks to receive a misdemeanor sentence when convicted of a felony. Caucasians received the least severe type of sentence, “misdemeanor conviction,” more often than Hispanics. Blacks were significantly less likely than either Caucasians or Hispanics to receive only a misdemeanor conviction along with its associated misdemeanor sentence.
Figures 7A-7C: Type of Sentence by
race/ethnicity
Asian/PacificIslander
Black
Caucasian
Hispanic
Native American
0% 10% 20% 30% 40% 50% 60% 70%
43%
48%
63%
53%
57%
Figure 7A: Felony conviction, felony sentence Scale: 0 to 70 percent
Asian/PacificIslander
Black
Caucasian
Hispanic
Native American
0% 1% 2% 3% 4% 5% 6%
5.3%
3.8%
3.5%
3.8%
2.6%
Figure 7B: Felony conviction, misdemeanor sentence Scale: 0 to 6 percent
Asian/PacificIslander
Black
Caucasian
Hispanic
Native American
0% 10% 20% 30% 40% 50% 60%
51%
47%
33%
43%
40%
Figure 7C: Misdemeanor conviction Scale: 0 to 60 percent

12
Type of Sentence–Controlling for Prior Record Again, a separate analysis was conducted to control for any effect prior record could have on the types of sentences given to different racial/ethnic groups. As expected, defendants with more serious prior records were more likely to receive a felony sentence and less likely to receive a misdemeanor sentence or even a misdemeanor conviction. Blacks with no prior record were the most likely to receive a misdemeanor sentence for a felony conviction. At the same time, Blacks with one or more prior prison commitments were the least likely to receive a misdemeanor sentence when convicted of a felony. Caucasians were more likely than Hispanics to receive a misdemeanor sentence regardless of prior record, although the gap narrows considerably as the prior record becomes more serious. The pattern for defendants convicted of a misdemeanor is similar to the pattern observed among defendants who received a felony sentence when convicted of a felony. Differences in the proportions of Blacks, Caucasians, and Hispanics receiving misdemeanor convictions were greater among defendants with either no prior record or a miscellaneous prior record than among those with one or more prior prison commitments.
Figures 8A–8C: Type of sentence by
race/ethnicity, controlling for prior record
0% 20% 40% 60% 80% 100%
Black
Caucasian
Hispanic
No prior record
Miscellaneousprior record
One or more prior prison
commitments
Figure 8A: Felony conviction, felony sentence
47%
39%
46%
60%
53%
58%
81%
81%
81%
0% 2% 4% 6% 8%
Black
Caucasian
Hispanic
No prior record
Miscellaneousprior record
One or more prior prison
commitments
Figure 8B: Felony conviction, misdemeanor sentence
6.3%
4.9%
3.0%
3.5%
3.9%
2.6%
1.2%
2.0%
1.7%
0% 10% 20% 30% 40% 50% 60%
Black
Caucasian
Hispanic
No prior record
Miscellaneousprior record
One or more prior prison
commitments
Figure 8C: Misdemeanor conviction
46%
55%
50%
36%
43%
40%
17%
17%
18%

13
CONCLUSIONS The lack of data on sentence severity and specific type of prior record limits the conclusions one can confidently make about any observed differences in sentencing by race or ethnicity of the defendant. Having more detailed information of these types would enable a more precise comparison of sentencing outcomes for different racial and ethnic groups, controlling for a wider array of factors. As a result, the findings contained in this report cannot be used on their own as an indication of bias in the California criminal justice system. The findings only summarize the broad sentencing information that is available in the OBTS file maintained by the California DOJ. Because of these limitations and those highlighted by the CJSC, the reader should exercise caution in attempting to identify causes for the observed differences in sentencing among various racial/ethnic groups. In addition, a sentencing outcome is the consequence of many intermediate and interdependent steps within the criminal justice system from arrest to sentencing. Therefore, studies of sentencing outcomes involve extremely complex issues that are dependent on a variety of factors external to the courts such as federal policies (e.g., border interdictions), local policing activities, and district attorney practices. With the limitations of the data currently available, it is not possible to identify whether sentencing differences are attributable to one portion or another of the criminal justice system. This report is only intended to be descriptive in nature, and the authors emphasize the need for additional research to help explain some of the findings. The following sections summarize the major findings of this study. Sentence Classification
There were some statistically significant differences in the sentences received by Blacks, Caucasians, and Hispanics. Ø Caucasians were less likely than Blacks or Hispanics to receive the most
severe sentence (prison)–see Figure 5A, page 8.
Ø It follows that Caucasians were more likely than Blacks or Hispanics to receive sentences of lesser severity (i.e., dismissal/acquittal, probation, and fine)–see Figures 5D through 5F, page 9.
Ø There was no clear pattern between Blacks and Hispanics in the sentence received.
Ø Both Blacks and Hispanics were significantly more likely to receive a prison sentence than to have the case dismissed or be acquitted (for Blacks 23 percent prison sentences versus 16 percent dismissals and acquittals; for
14
Hispanics 20 percent prison sentences versus 13 percent dismissals and acquittals). Defendants from all other racial/ethnic groups were more likely to have their case dismissed or be acquitted than to receive a prison sentence–see Figures 5A and 5F, pages 8 and 9.
Sentence Classification Controlling for Prior Record
Defendant prior records appear to have had a greater effect on the sentences given to both Caucasians and Hispanics than on the sentences given to Blacks. Ø For Caucasians and Hispanics, the more serious the prior record, the less
likely it was that the defendant would have his or her case dismissed or be acquitted, and the more likely it was that the defendant would receive a prison sentence–see Figures 6A and 6B, page 10.
Ø Although this same pattern was observed for Blacks, there were much smaller differences in the types of sentences received by Black defendants with no prior record, those with miscellaneous prior records, and those with serious prior records–see Figures 6A and 6B, page 10.
Ø For example, Blacks with serious prior records had their cases dismissed or were acquitted at a rate similar to Blacks with only miscellaneous prior records, and at a rate only slightly less than Blacks with no prior record–see Figure 6B, page 10.
Type of Sentence
There were also some statistically significant differences among racial/ethnic groups in the types of sentences received. Ø Caucasians were less likely than Blacks or Hispanics to receive the most
severe type of outcome (“felony conviction, felony sentence”)–see Figure 7A, page 11.
Ø Caucasians were more likely than Blacks or Hispanics to receive sentences of lesser severity (“felony conviction, misdemeanor sentence” and “misdemeanor conviction”)–see Figure 7B, page 11.
Ø Unlike sentence classification, there were some differences between Blacks and Hispanics in the types of sentences received. Blacks were significantly more likely than Hispanics to receive a felony conviction (with either a felony sentence or a misdemeanor sentence)–see Figures 7A and 7B, page11.
Ø Blacks were convicted of only a misdemeanor at a rate far below that of any other racial/ethnic group–see Figure 7C, page 11.

15
Type of Sentence Controlling for Prior Record
Many of the differences in sentencing observed among racial/ethnic groups disappeared when the defendants had some kind of prior record, especially a serious one. Ø Still, Caucasians with no prior record received the most severe type of
outcome (“felony conviction, felony sentence”) less frequently than did Blacks or Hispanics with no prior record–see Figure 8A, page 12.
Ø In addition, Caucasians with no prior record received the least severe type of outcome (“misdemeanor conviction”) more frequently than did Blacks or Hispanics with no prior record–see Figure 8C, page 12.
Ø However, these differences among racial/ethnic groups in the types of sentences received disappeared if the defendants had one or more prior prison commitments–see Figures 8A through 8C, page 12.

16
Appendix TEXT OF PENAL CODE SECTION 1170.45
Collection of Data and Report to the Legislature Relating to Disposition According to Race and Ethnicity of Defendant.
The Judicial Council shall collect data on criminal cases statewide relating to the disposition of those cases according to the race and ethnicity of the defendant, and report annually thereon to the Legislature beginning no later than January 1, 1999. It is the intent of the Legislature to appropriate funds to the Judicial Council for this purpose.
METHODOLOGY
The chi-square test was the statistical method used in this report to analyze the sentencing outcomes of felony cases by race/ethnicity of the defendant. The chi-square test measures whether any relationship exists between a pair of categorical variables. It is the most appropriate test to use when both variables are measured on a nominal scale; i.e., there is no inherent order or ranking to the variables. Even though the two sentencing variables (sentence classification, type of sentence) were described in this report in a ranked order by severity, this order was more a construct of the authors and not inherent in the variables to a degree that would warrant a different statistical test. Differences in sentencing among racial/ethic groups identified as statistically significant in this report were based on a chi-square test at p < .05 level of significance. In other words, the reader can be at least 95 percent (0.95, or 1.0 – p) confident that the differences observed in this report are real and cannot be attributed to chance alone.

17
FREQUENCIES
Figure 1: Gender
Male 264,908
Female 61,738
Figure 2: Age
13–19 33,542
20–29 125,400
30–39 108,685
40–49 46,645
50–59 9,754
60+ 2,731
Figure 3: Race/ethnicity
Asian/Pacific Islander 7,261
Black 71,858
Caucasian 113,639
Hispanic 101,296
Native American 1,652
Other/unknown 31,062
Figure 4: Prior criminal record
No prior record 69,054
Miscellaneous prior record 147,876
One or more prior prison commitments 19,058
18
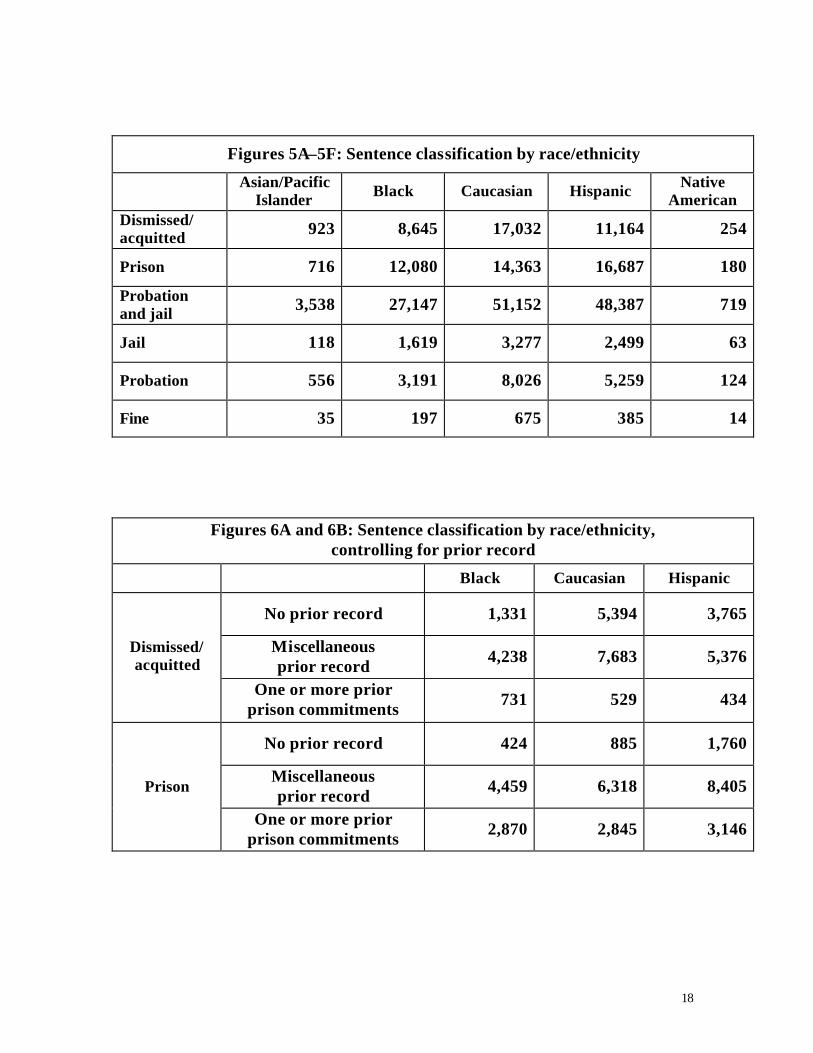
Figures 5A–5F: Sentence classification by race/ethnicity
Asian/Pacific Islander
Black Caucasian Hispanic Native
American Dismissed/ acquitted
923 8,645 17,032 11,164 254
Prison 716 12,080 14,363 16,687 180
Probation and jail
3,538 27,147 51,152 48,387 719
Jail 118 1,619 3,277 2,499 63
Probation 556 3,191 8,026 5,259 124
Fine 35 197 675 385 14
Figures 6A and 6B: Sentence classification by race/ethnicity, controlling for prior record
Black Caucasian Hispanic
No prior record 1,331 5,394 3,765
Miscellaneous prior record
4,238 7,683 5,376 Dismissed/ acquitted
One or more prior prison commitments
731 529 434
No prior record 424 885 1,760
Miscellaneous prior record
4,459 6,318 8,405 Prison
One or more prior prison commitments
2,870 2,845 3,146
19
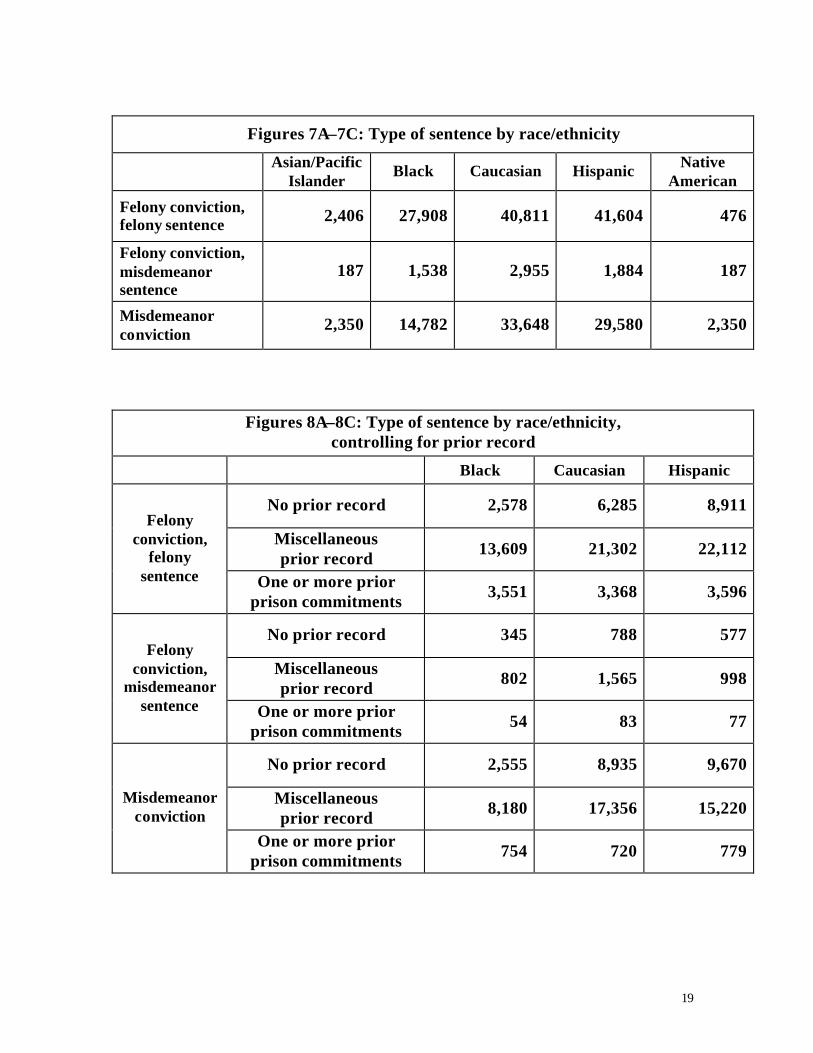
Figures 7A–7C: Type of sentence by race/ethnicity
Asian/Pacific Islander
Black Caucasian Hispanic Native
American
Felony conviction, felony sentence
2,406 27,908 40,811 41,604 476
Felony conviction, misdemeanor sentence
187 1,538 2,955 1,884 187
Misdemeanor conviction
2,350 14,782 33,648 29,580 2,350
Figures 8A–8C: Type of sentence by race/ethnicity, controlling for prior record
Black Caucasian Hispanic
No prior record 2,578 6,285 8,911
Miscellaneous prior record
13,609 21,302 22,112
Felony conviction,
felony sentence One or more prior
prison commitments 3,551 3,368 3,596
No prior record 345 788 577
Miscellaneous prior record
802 1,565 998
Felony conviction,
misdemeanor sentence One or more prior
prison commitments 54 83 77
No prior record 2,555 8,935 9,670
Miscellaneous prior record
8,180 17,356 15,220 Misdemeanor
conviction
One or more prior prison commitments
754 720 779


![PENAL CODE BOOK ONE GENERAL PART CHAPTER ONE THE PENAL · PDF fileBOOK ONE GENERAL PART . CHAPTER ONE . THE PENAL LAW [] II. Territorial limits of penal laws . ... Relation of the](https://cdn.vdocument.in/doc/165x107/5a9412f37f8b9a30358bf5c7/penal-code-book-one-general-part-chapter-one-the-penal-one-general-part-chapter.jpg)


