
REPUBLIC OF THE MARSHALL ISLANDS
PUBLIC FINANCIAL MANAGEMENT PERFORMANCE REPORT
AND PERFORMANCE INDICATORS
FINAL REPORT
Alfred Alfred, Jr, MoF
Kayo Yamaguchi-Kotton, MoF Boris Anni, MoF
Clarence Samuel, MoF Itibo Tofinga, MoF
Ron Hackett, PFTAC Sanjesh Naidu, PIFS
Mary Betley, Consultant
October 2012

Republic of the Marshall Islands – PEFA Public Financial Management Performance Report Page ii
Republic of the Marshall Islands – PEFA Public Financial Management Performance Report Page iii
Acknowledgements
The PEFA assessment has relied on the generosity of a large number of stakeholders in providing
information and documents to assist in assessing the indicators in this report, not to mention giving up
their time to meet with members of the team. The assessment also benefited from discussions during
both the opening and the closing stakeholder consultations. The team would like to thank all of those
who participated in the assessment in any way.
Special thanks go to the Minister of Finance, the Financial Secretary, his Assistant Secretaries, and
the staff at the Ministry of Finance, and to Development Partners for financial and logistical support
during the exercise.
Notes
1. Fiscal year: 1 October-30 September. Fiscal year 2010 refers to 1 October 2009 - 30 September
2010.
2. Assessment period for many of the indicators covers fiscal years (FY) 2008/09 (FY09), 2009/10
(FY10), and 2010/11 (FY11).
3. Currency Unit: US dollar (US$).

Republic of the Marshall Islands – PEFA Public Financial Management Performance Report Page iv
Republic of the Marshall Islands – PEFA Public Financial Management Performance Report Page v
Table of Contents
MAIN REPORT
Acronyms and Abbreviations .................................................................................................viii
Summary Assessment .............................................................................................................viii
1. Introduction ........................................................................................................................ 1
2. Background ......................................................................................................................... 2 2.1 Description of Country Economic Situation .............................................................................. 2 2.2 Budgetary Outcomes ................................................................................................................. 3 2.3 Legal and Institutional framework for PFM .............................................................................. 4
3. Assessment of PFM System, Processes and Institutions .................................................... 6 3.1 Budget Credibility ..................................................................................................................... 6 3.2 Transparency and Comprehensiveness .................................................................................... 10 3.3 Policy-based Budgeting ........................................................................................................... 21 3.4 Predictability and Control in Budget Execution ...................................................................... 25 3.5 Accounting, recording and reporting ....................................................................................... 43 3.6 External scrutiny and audit ...................................................................................................... 46 3.7 Donor Practices ........................................................................................................................ 51
4. Government Reform Process ............................................................................................ 54 4.1 General Description of Recent and On-Going Reforms .......................................................... 54 4.2 Institutional Factors Supporting Reform Planning and Implementation ................................. 55
ANNEXES
Annex A: List of stakeholders met
Annex B: List of documents consulted
Annex C: Evidence used for indicators
Annex D: Background data for PI to PI-3
Annex E: Terms of reference

Republic of the Marshall Islands – PEFA Public Financial Management Performance Report Page vi

Republic of the Marshall Islands – PEFA Public Financial Management Performance Report Page vii
Acronyms and Abbreviations
ADB Asian Development Bank
BCC Budget Co-ordinating Committee
CAP Comprehensive Adjustment Program (Government expenditure control program)
CG Central Government
CM Cabinet Minute (documenting a decision taken by Cabinet)
CRP Comprehensive Recovery Plan
CP Cabinet Paper (Proposal presented to Cabinet)
EPPSO Economic Policy, Planning and Statistics Office (under the President’s Office)
FY Fiscal year
GPPO Government Public Procurement Office
GRMI Government of the Republic of the Marshall Islands
IAS International Accounting Standards
IFRS International Financial Reporting Standards
IMF International Monetary Fund
ISSAI International Standards for Supreme Audit Institutions
KALGOV Kwajalein Atoll Local Government
LG Local government
LRA Land Registration Authority
MALGOV Majuro Atoll Local Government
MDA Management Discussion and Analysis (as used in GRMI audit reports)
MDA Ministries, Departments and Agencies (as used in PEFA Guidelines)
MEC Marshall Islands Electricity Company
MICNGOs Marshall Islands Council of NGOs
MIRC Marshall Islands Revised Code
MISSA Marshall Islands Social Security Administration
MoF Ministry of Finance
MTBIF Medium Term Budget and Investment Framework
NDP National Development Plan
NA Not applicable
N/A Not available
NR Not rated
OCI Office of Compact Implementation
ODA Official Development Assistance (as used by OECD-DAC)
OIDA Office of International Development and Assistance (co-division, with Budget, of MoF)
OIEDF Outer Islands Economic Development Fund
PA Personnel Action
PC Procurement Code
PEFA Public Expenditure and Financial Accountability
PFM Public Financial Management
PFM-PR Public Financial Management Performance Report
PFTAC Pacific Financial Technical Assistance Centre (of the IMF)
PIFS Pacific Islands Forum Secretariat
PO Purchase order
PR Purchase requisition
PSC Public Service Commission
PSCROP Public Sector Comprehensive Reform Program
RMI Republic of the Marshall Islands
RMITC Republic of Marshall Islands Trust Company (Ship Registry)
ROC Republic of China (Taiwan)
SN Sub-national (government)
SOE State-owned enterprise
SOP Standard Operating Procedures
SPC Secretariat of the Pacific Community
TA Technical assistance
TCMI Trust Company of the Marshall Islands, Inc. (Ship Registry)
TRAM Tax and Revenue Reform and Modernisation Commission
WAM Waan Aelon in Majel (Canoes in the Marshall Islands) – NGO
Republic of the Marshall Islands – PEFA Public Financial Management Performance Report Page viii
Summary Assessment
The purpose of this assessment has been to evaluate the current status of the Public Financial
Management (PFM) systems in the Republic of the Marshall Islands (RMI) in terms of the main
systemic strengths and weaknesses and in accordance with the PEFA framework. It is important to
underline that the purpose has not been to assess different institutions or responsible individuals in the
Government but to focus on the PFM systems themselves.
(i) Integrated assessment of PFM performance
The PFM system is centered on a basic legislative framework for financial management, summarized
in the RMI Code. There is not yet in place an up-to-date set of financial management regulations to
accompany the Financial Management Act. In general, there is a lack of accompanying regulations to
support PFM legislation (e.g. in taxation, procurement, and expenditure management), and this serves
to undermine the overall clarity and comprehensiveness of the underlying processes.
Measured along the 6 core dimensions of public financial management, the PFM systems in the
Marshall Islands may be summarized as follows:
Credibility of the budget
Over the last three years, domestic revenue receipts were for the most part higher than projected in the
budget, reflecting an appropriately conservative approach. In line with accurate domestic revenue
projections and stable levels of external support (mainly reflecting the stability of Compact and other
US funding flows), aggregate expenditures over the past three years have been largely in line with the
levels planned in the budget.
However, at the level of line ministries and agencies, actual expenditures have differed significantly
from those planned in the budget. This is likely to reflect weaknesses in expenditure controls, as well
as unclear rules for moving expenditures between appropriations, both of which were found by the
assessment.
Comprehensiveness and transparency of the budget
Limited fiscal information is available to the public in the form of audited annual financial statements
and compliance audits available on the Nitijela’s website. In addition, while the PAC hearings are
open to the public, their reports on the subject of the hearings (i.e. the audit reports) are not published.
However, in the absence of widespread use of websites (e.g. for MoF), it has been difficult to provide
easy access for the public to key fiscal information. In particular, it is not possible for members of the
public to get copies of the budget documents or audit reports without specifically requesting a copy
from government staff. In addition, the budget documents are not comprehensive, with key
information lacking, including macroeconomic assumptions and fiscal policy objectives, and at least a
three-year run of budget data (e.g. data on the previous year’s actual spending, followed by revised
spending estimates for the current year, as well as that for the proposed budget).
Another key issue affecting accountability is the fact that the highest level for budget appropriation is
the source of funding rather than the relevant agency (administrative classification). This undermines
ministry/agency-level accountability for the use of these funds by not clearly conveying in an
integrated manner how all funds may come together to finance particular services.
Furthermore, significant amounts of public resources are not included in the budget information
provided to the Nitijela (Parliament) for their scrutiny. The budget discussed with the Nitijela does
not include all government spending from extra-budgetary funds (e.g. social security) or any
discussion of potential fiscal risks from public enterprises, other off-budget operations, or sub-
national government over the medium-term.

Republic of the Marshall Islands – PEFA Public Financial Management Performance Report Page ix
Policy-based budget
On the positive side, the budget process has been relatively disciplined, with the Appropriation Act
promulgated before the beginning of the fiscal year, and with Cabinet having a role early on during
budget preparation.
On the other hand, the assessment found weak links between sector plans and budgets, and budgets
are, in the main, not actively planned within a multi-year framework. Some line ministries (e.g. the
Ministry of Health) have prepared supplemental budget submissions on the basis of policy objectives
and have included forward estimates. However, those ministries are the exception. With separate
institutional responsibilities for recurrent and investment budgets, there is no explicit linkage between
the two processes.
Predictability and control in budget execution
The use of paper-based information systems (e.g. for tax administration) and limited staffing levels
contribute to weaknesses in tax compliance and enforcement.
On the expenditure side, the lack of a regular and timely routine for reconciling data (payroll, other
expenditures, and banking data), combined with limited segregation of duties for controls, potentially
weaken the effectiveness of expenditure controls. While a formal commitment control system is in
place, in practice, there is a greater reliance on more informal procedures. Formalizing internal
control procedures (e.g. through publishing and disseminating a comprehensive Standard Operations
Manual) would provide a framework within which to enforce controls.
The lack of an operational internal audit function (meeting international standards) means that
management does not have access to its own mechanism to monitor and provide assurance on the
performance of internal control and other systems. As with tax appeals, there is no independent
review process or body established to enable respondents to a tender to appeal procurement decisions
prior to the signing of a contact.
Formal criteria for identifying and assessing fiscal risk are not yet in place.
Accounting, recording and reporting
Over the past few years, only limited in-year budget execution reports have been issued, thereby
providing insufficient information to management to monitor budget performance.
GRMI does not prepare its own completed unaudited annual financial statements; the externally-
contracted audit firm does the final preparation of the statements, based on the trial balances provided
by MoF, which the audit firm subsequently audits. This represents an important weakness in the
chain of accountability and is inconsistent with international auditing standards relating to the
separation of duties.
While a financial management information system (FMIS) is in place, it is not used to provide
comprehensive information, e.g. on arrears, even though it appears to be technically capable of doing
so.
External scrutiny and audit
While audit coverage is comprehensive, severe staffing constraints in the Audit Office limit its ability
to perform many of its own audits, including special investigations and other non-statutory audits.
Republic of the Marshall Islands – PEFA Public Financial Management Performance Report Page x
The Nitijela plays a relatively structured role in scrutiny of the budget and of audit reports. Standing
Committees (Appropriations and Public Accounts) hold public hearings on their reviews of the draft
Appropriation Bill and on audit reports, respectively.
However, in the absence of a more policy-oriented basis for the budget, scrutiny by the Nitijela is
limited to reviewing line items, and they spend relatively limited time doing so. The Appropriations
Committee does not get involved prior to the detailed preparation of Estimates.
Follow-up actions taken by the audited entities to address findings and recommendations in both audit
and PAC reports are very limited.
Donor practices
US Compact and Federal funding dominate development partner support to GRMI. While data on
Compact funding and some Federal grants administered through the Department of the Interior are
comprehensive, information on the value of external support from other donors, as well as some US
programs administered directly by other Federal agencies, is not.
Development partner agencies do not report to GRMI on the disbursements provided, and this,
combined with the lack of comprehensive information on the total amount of US support, makes
reporting on, and reconciling of, government data with that from the US difficult. Comprehensive
reports from each donor reflecting all aid they provide to all RMI entities are particularly important
because of the current weak reporting to the central GRMI from SOEs and sub-national governments.
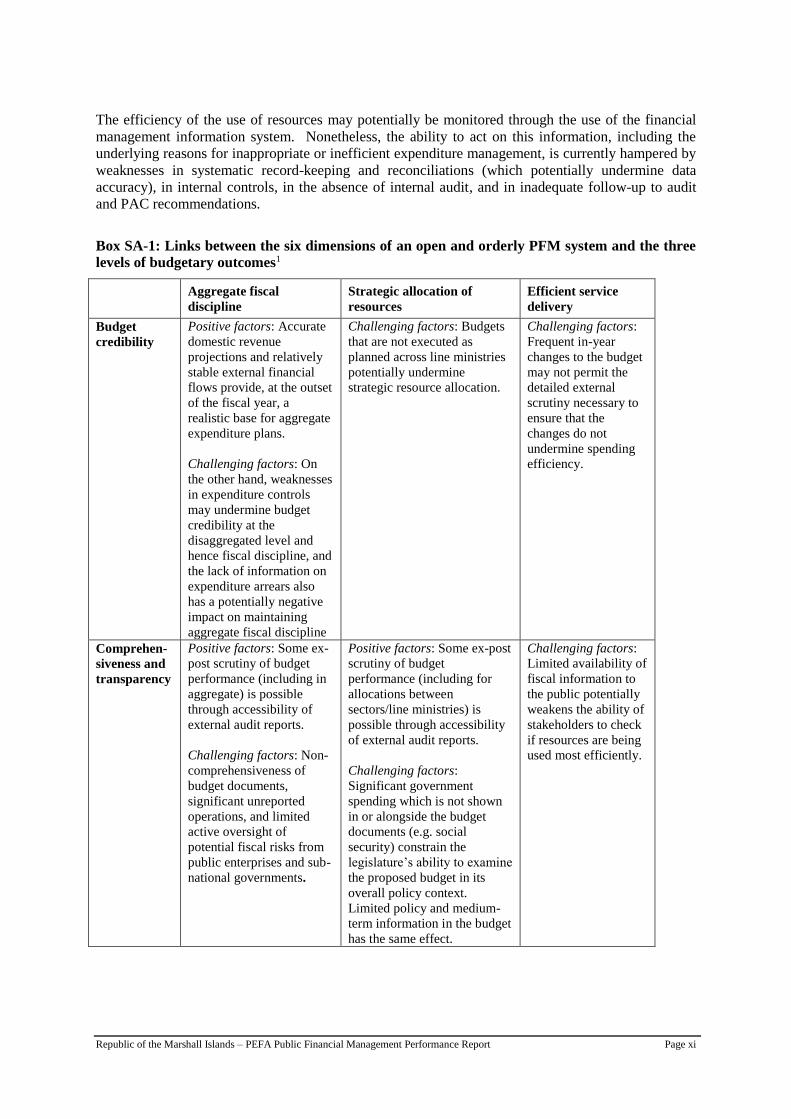
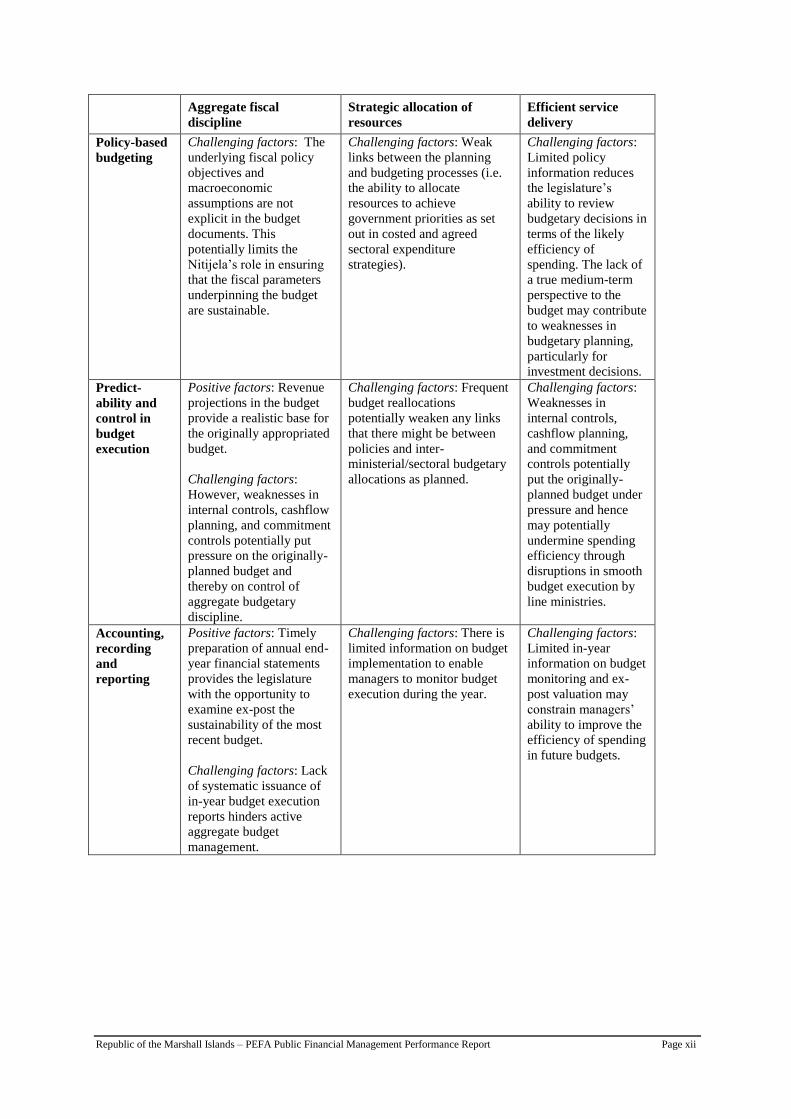
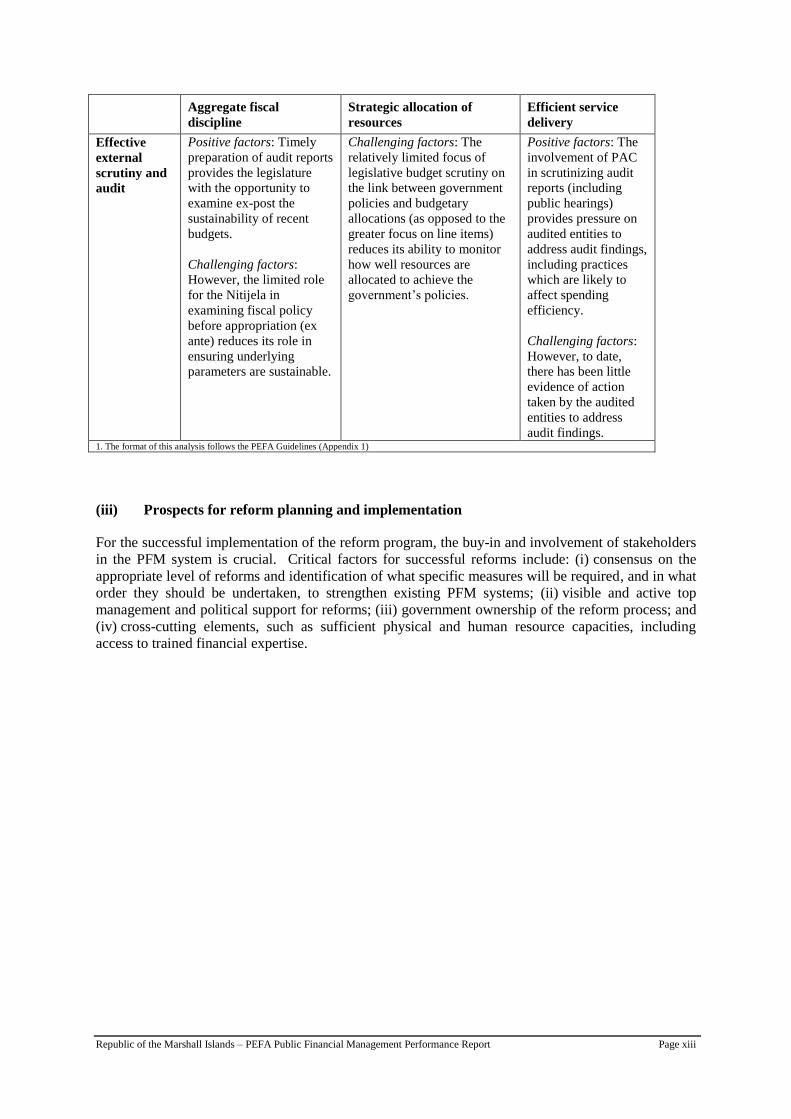
(ii) Assessment of the impact of PFM weaknesses
As public financial management concerns the efficiency and effectiveness of the use of public
resources, the interdependence of the components of the budget cycle means that weaknesses in one
part can adversely affect other parts and thereby constrain the achievement of better budgetary
outcomes; conversely, improvements in one area which are not matched by corresponding changes in
other areas can undermine the initial reforms. The strengths and weaknesses of the PFM system
found in the assessment have an impact on the three measures of budget effectiveness1 – aggregate
fiscal discipline, allocative efficiency and technical (operational) efficiency – as follows (Box SA-1).
The analysis highlights the government’s ability to achieve its broader fiscal and service delivery
objectives. In particular, the achievement of broad fiscal goals is strengthened through the effective
management of fiscal aggregate parameters. On the other hand, limited tax compliance and the
enforcement of compliance reduce potential tax collections and potentially constrain the government’s
ability to achieve its specific policy objectives.
In terms of ensuring that resources are allocated (in plan and in fact) appropriately to meet desired
policy goals, a good starting point has been established with the introduction of portfolio budgets (e.g.
health). However, while these budgets may assist with planned allocations, they are just the start, as
they are not operational in all sectors. There continues to be a weak relationship between planning
and budgeting, with limited consultation between the two during budget preparation and policy
planning.
Weaknesses in the ability of stakeholders to hold government to account, e.g. for the achievement of
policy priorities, are found in the insufficient dissemination of timely information, such as on budget
implementation and audit reports, to/from stakeholders, including the public. This results in part from
inadequate record-keeping, and may reflect the lack of importance attached to documenting and
disseminating information. On the other hand, the increasing role played by the PAC on ex-post
oversight of expenditures is a positive note.
1 These three measures are described in detail inter alia in Allen, Tommasi (eds), Managing Public Expenditure: A Reference Book for Transition
Countries, OECD, 2001.
Republic of the Marshall Islands – PEFA Public Financial Management Performance Report Page xi
The efficiency of the use of resources may potentially be monitored through the use of the financial
management information system. Nonetheless, the ability to act on this information, including the
underlying reasons for inappropriate or inefficient expenditure management, is currently hampered by
weaknesses in systematic record-keeping and reconciliations (which potentially undermine data
accuracy), in internal controls, in the absence of internal audit, and in inadequate follow-up to audit
and PAC recommendations.
Box SA-1: Links between the six dimensions of an open and orderly PFM system and the three
levels of budgetary outcomes1
Aggregate fiscal
discipline
Strategic allocation of
resources
Efficient service
delivery
Budget
credibility
Positive factors: Accurate
domestic revenue
projections and relatively
stable external financial
flows provide, at the outset
of the fiscal year, a
realistic base for aggregate
expenditure plans.
Challenging factors: On
the other hand, weaknesses
in expenditure controls
may undermine budget
credibility at the
disaggregated level and
hence fiscal discipline, and
the lack of information on
expenditure arrears also
has a potentially negative
impact on maintaining
aggregate fiscal discipline
Challenging factors: Budgets
that are not executed as
planned across line ministries
potentially undermine
strategic resource allocation.
Challenging factors:
Frequent in-year
changes to the budget
may not permit the
detailed external
scrutiny necessary to
ensure that the
changes do not
undermine spending
efficiency.
Comprehen-
siveness and
transparency
Positive factors: Some ex-
post scrutiny of budget
performance (including in
aggregate) is possible
through accessibility of
external audit reports.
Challenging factors: Non-
comprehensiveness of
budget documents,
significant unreported
operations, and limited
active oversight of
potential fiscal risks from
public enterprises and sub-
national governments.
Positive factors: Some ex-post
scrutiny of budget
performance (including for
allocations between
sectors/line ministries) is
possible through accessibility
of external audit reports.
Challenging factors:
Significant government
spending which is not shown
in or alongside the budget
documents (e.g. social
security) constrain the
legislature’s ability to examine
the proposed budget in its
overall policy context.
Limited policy and medium-
term information in the budget
has the same effect.
Challenging factors:
Limited availability of
fiscal information to
the public potentially
weakens the ability of
stakeholders to check
if resources are being
used most efficiently.
Republic of the Marshall Islands – PEFA Public Financial Management Performance Report Page xii
Aggregate fiscal
discipline
Strategic allocation of
resources
Efficient service
delivery
Policy-based
budgeting
Challenging factors: The
underlying fiscal policy
objectives and
macroeconomic
assumptions are not
explicit in the budget
documents. This
potentially limits the
Nitijela’s role in ensuring
that the fiscal parameters
underpinning the budget
are sustainable.
Challenging factors: Weak
links between the planning
and budgeting processes (i.e.
the ability to allocate
resources to achieve
government priorities as set
out in costed and agreed
sectoral expenditure
strategies).
Challenging factors:
Limited policy
information reduces
the legislature’s
ability to review
budgetary decisions in
terms of the likely
efficiency of
spending. The lack of
a true medium-term
perspective to the
budget may contribute
to weaknesses in
budgetary planning,
particularly for
investment decisions.
Predict-
ability and
control in
budget
execution
Positive factors: Revenue
projections in the budget
provide a realistic base for
the originally appropriated
budget.
Challenging factors:
However, weaknesses in
internal controls, cashflow
planning, and commitment
controls potentially put
pressure on the originally-
planned budget and
thereby on control of
aggregate budgetary
discipline.
Challenging factors: Frequent
budget reallocations
potentially weaken any links
that there might be between
policies and inter-
ministerial/sectoral budgetary
allocations as planned.
Challenging factors:
Weaknesses in
internal controls,
cashflow planning,
and commitment
controls potentially
put the originally-
planned budget under
pressure and hence
may potentially
undermine spending
efficiency through
disruptions in smooth
budget execution by
line ministries.
Accounting,
recording
and
reporting
Positive factors: Timely
preparation of annual end-
year financial statements
provides the legislature
with the opportunity to
examine ex-post the
sustainability of the most
recent budget.
Challenging factors: Lack
of systematic issuance of
in-year budget execution
reports hinders active
aggregate budget
management.
Challenging factors: There is
limited information on budget
implementation to enable
managers to monitor budget
execution during the year.
Challenging factors:
Limited in-year
information on budget
monitoring and ex-
post valuation may
constrain managers’
ability to improve the
efficiency of spending
in future budgets.
Republic of the Marshall Islands – PEFA Public Financial Management Performance Report Page xiii
Aggregate fiscal
discipline
Strategic allocation of
resources
Efficient service
delivery
Effective
external
scrutiny and
audit
Positive factors: Timely
preparation of audit reports
provides the legislature
with the opportunity to
examine ex-post the
sustainability of recent
budgets.
Challenging factors:
However, the limited role
for the Nitijela in
examining fiscal policy
before appropriation (ex
ante) reduces its role in
ensuring underlying
parameters are sustainable.
Challenging factors: The
relatively limited focus of
legislative budget scrutiny on
the link between government
policies and budgetary
allocations (as opposed to the
greater focus on line items)
reduces its ability to monitor
how well resources are
allocated to achieve the
government’s policies.
Positive factors: The
involvement of PAC
in scrutinizing audit
reports (including
public hearings)
provides pressure on
audited entities to
address audit findings,
including practices
which are likely to
affect spending
efficiency.
Challenging factors:
However, to date,
there has been little
evidence of action
taken by the audited
entities to address
audit findings. 1. The format of this analysis follows the PEFA Guidelines (Appendix 1)
(iii) Prospects for reform planning and implementation
For the successful implementation of the reform program, the buy-in and involvement of stakeholders
in the PFM system is crucial. Critical factors for successful reforms include: (i) consensus on the
appropriate level of reforms and identification of what specific measures will be required, and in what
order they should be undertaken, to strengthen existing PFM systems; (ii) visible and active top
management and political support for reforms; (iii) government ownership of the reform process; and
(iv) cross-cutting elements, such as sufficient physical and human resource capacities, including
access to trained financial expertise.
Republic of the Marshall Islands – PEFA Public Financial Management Performance Report Page xiv
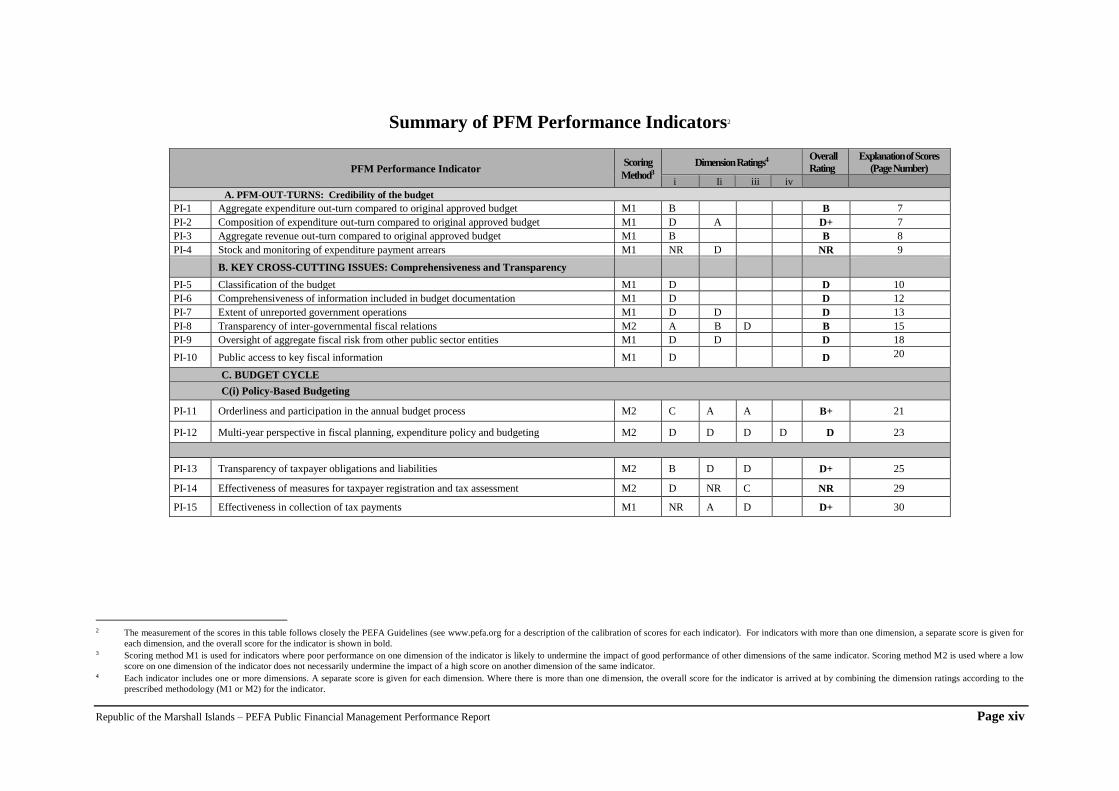
Summary of PFM Performance Indicators2
PFM Performance Indicator Scoring
Method3
Dimension Ratings4 Overall
Rating
Explanation of Scores
(Page Number)
i Ii iii iv
A. PFM-OUT-TURNS: Credibility of the budget
PI-1 Aggregate expenditure out-turn compared to original approved budget M1 B B 7
PI-2 Composition of expenditure out-turn compared to original approved budget M1 D A D+ 7
PI-3 Aggregate revenue out-turn compared to original approved budget M1 B B 8
PI-4 Stock and monitoring of expenditure payment arrears M1 NR D NR 9
B. KEY CROSS-CUTTING ISSUES: Comprehensiveness and Transparency
PI-5 Classification of the budget M1 D D 10
PI-6 Comprehensiveness of information included in budget documentation M1 D D 12
PI-7 Extent of unreported government operations M1 D D D 13
PI-8 Transparency of inter-governmental fiscal relations M2 A B D B 15
PI-9 Oversight of aggregate fiscal risk from other public sector entities M1 D D D 18
PI-10 Public access to key fiscal information M1 D D 20
C. BUDGET CYCLE
C(i) Policy-Based Budgeting
PI-11 Orderliness and participation in the annual budget process M2 C A A B+ 21
PI-12 Multi-year perspective in fiscal planning, expenditure policy and budgeting M2 D D D D D 23
PI-13 Transparency of taxpayer obligations and liabilities M2 B D D D+ 25
PI-14 Effectiveness of measures for taxpayer registration and tax assessment M2 D NR C NR 29
PI-15 Effectiveness in collection of tax payments M1 NR A D D+ 30
2 The measurement of the scores in this table follows closely the PEFA Guidelines (see www.pefa.org for a description of the calibration of scores for each indicator). For indicators with more than one dimension, a separate score is given for
each dimension, and the overall score for the indicator is shown in bold. 3 Scoring method M1 is used for indicators where poor performance on one dimension of the indicator is likely to undermine the impact of good performance of other dimensions of the same indicator. Scoring method M2 is used where a low
score on one dimension of the indicator does not necessarily undermine the impact of a high score on another dimension of the same indicator. 4 Each indicator includes one or more dimensions. A separate score is given for each dimension. Where there is more than one dimension, the overall score for the indicator is arrived at by combining the dimension ratings according to the
prescribed methodology (M1 or M2) for the indicator.
Republic of the Marshall Islands – PEFA Public Financial Management Performance Report Page xv
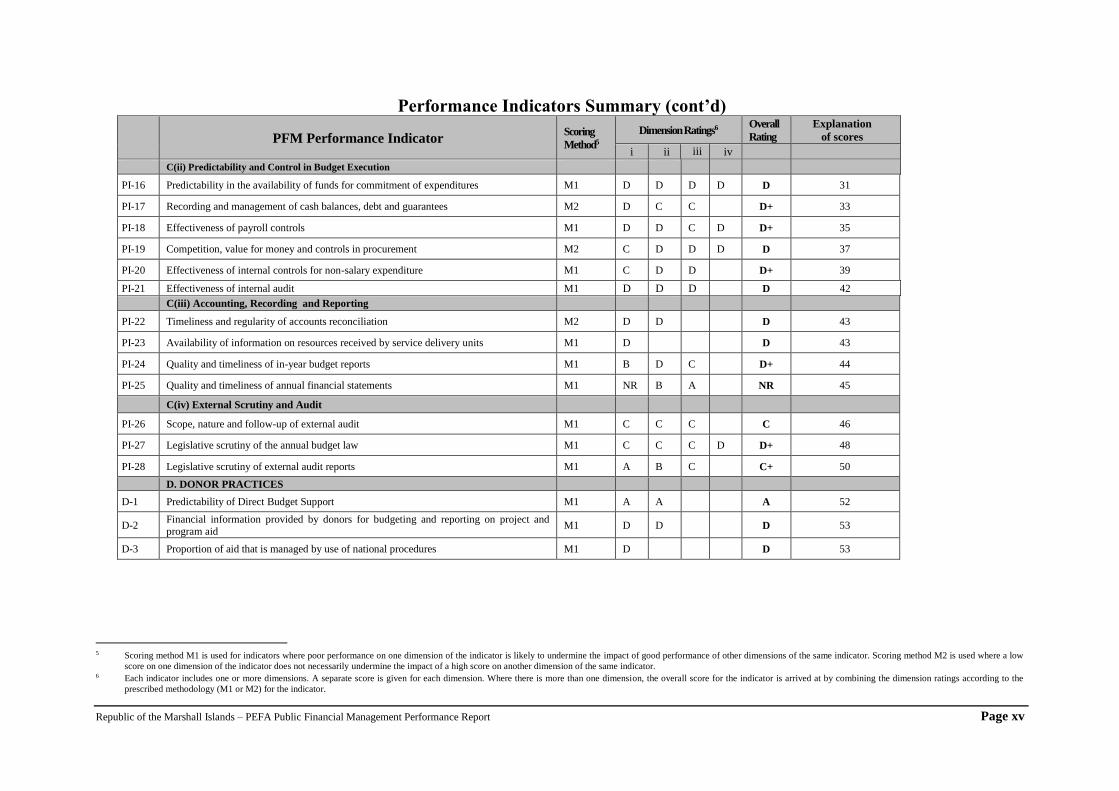
Performance Indicators Summary (cont’d)
PFM Performance Indicator Scoring
Method5
Dimension Ratings6 Overall
Rating
Explanation
of scores
i ii iii iv
C(ii) Predictability and Control in Budget Execution
PI-16 Predictability in the availability of funds for commitment of expenditures M1 D D D D D 31
PI-17 Recording and management of cash balances, debt and guarantees M2 D C C D+ 33
PI-18 Effectiveness of payroll controls M1 D D C D D+ 35
PI-19 Competition, value for money and controls in procurement M2 C D D D D 37
PI-20 Effectiveness of internal controls for non-salary expenditure M1 C D D D+ 39
PI-21 Effectiveness of internal audit M1 D D D D 42
C(iii) Accounting, Recording and Reporting
PI-22 Timeliness and regularity of accounts reconciliation M2 D D D 43
PI-23 Availability of information on resources received by service delivery units M1 D D 43
PI-24 Quality and timeliness of in-year budget reports M1 B D C D+ 44
PI-25 Quality and timeliness of annual financial statements M1 NR B A NR 45
C(iv) External Scrutiny and Audit
PI-26 Scope, nature and follow-up of external audit M1 C C C C 46
PI-27 Legislative scrutiny of the annual budget law M1 C C C D D+ 48
PI-28 Legislative scrutiny of external audit reports M1 A B C C+ 50
D. DONOR PRACTICES
D-1 Predictability of Direct Budget Support M1 A A A 52
D-2 Financial information provided by donors for budgeting and reporting on project and program aid
M1 D D D 53
D-3 Proportion of aid that is managed by use of national procedures M1 D D 53
5 Scoring method M1 is used for indicators where poor performance on one dimension of the indicator is likely to undermine the impact of good performance of other dimensions of the same indicator. Scoring method M2 is used where a low
score on one dimension of the indicator does not necessarily undermine the impact of a high score on another dimension of the same indicator. 6 Each indicator includes one or more dimensions. A separate score is given for each dimension. Where there is more than one dimension, the overall score for the indicator is arrived at by combining the dimension ratings according to the
prescribed methodology (M1 or M2) for the indicator.

Republic of the Marshall Islands – PEFA Public Financial Management Performance Report Page 1
1. Introduction
Objective of the PFM-PR
The overall objective of the assessment is to produce a comprehensive Public Financial Management
Performance Report (PFM-PR) prepared according to the PEFA methodology. It aims to establish the
baseline for the current performance of PFM processes and systems in the Republic of the Marshall
Islands (RMI), in terms of an integrated assessment of relative strengths and weaknesses. The
assessment covers the fiscal years 2008/09, 2009/10, and 2010/11, and the information is assessed as
of October 2011. The PFM-PR is expected to provide an important input into the preparation of a
roadmap for PFM reform measures, and the government aims to repeat the exercise after 3-4 years.
Process of Preparing the PFM-PR
The PFM-PR was prepared by a team comprising RMI government staff and international facilitators.
IMF/PFTAC 7 was the lead donor, and provided funding for an external consultant. Donor co-
ordination included involving a representative of the Pacific Islands Forum Secretariat (PIFC) to the
team. Other development partners, including the US, ROC and ADB, were active participants in
assessment meetings.
The government team comprised senior officials from the Ministry of Finance (MoF). A large
number of government officials were involved in participating in stakeholder interviews providing
information and documentary evidence. Quality assurance involved informal high-level meetings
with senior management from MoF, Cabinet Secretariat and the Office of the Auditor-General, and a
formal workshop to present the initial findings to a high-level group of stakeholders.
Methodology for Preparation of the Report
The assessment methodology involved: (i) pre-assessment collection and analysis of existing
documentation on PFM in RMI; (ii) an initial stakeholder workshop; (iii) in-country collection of
data, information and other evidence; (iv) interviews with government stakeholders with key
responsibilities within the PFM system; (v) triangulation of data and information from complementary
interviews, including from representatives of the private sector and civil society, and/or from available
recent reports; and (vi) a debriefing stakeholder workshop.8 The two stakeholder briefings were
conducted to discuss key issues and build consensus. The first discussed the assessment’s
methodology, while the second presented the initial results from the assessment.
Thereafter, the draft report was submitted for review to GRMI, the main development partners
(including IMF/PFTAC and PIFS), and the PEFA Secretariat. The current, final, report reflects
comments received.
Scope of the assessment
The public sector in the Marshall Islands comprises central government, local government, and state-
owned public enterprises. Within the central public sector, central government expenditures cover
just over 50% of consolidated (central public sector) expenditures,9 with the balance representing
autonomous government agencies (AGAs) 10 (see Table 1.1). This PEFA assessment focuses on
public financial management systems of central government.
Table 1.1: Structure of the Public Sector
Institutions Number of entities % of public expenditures2
Central government1 18 52.3%
Autonomous government agencies 22 47.7%
Local government 24 N/A 1. Includes ministries, and line agencies
2. Total expenditures for public sector exclude local government expenditures due to lack of available data.
Source: FY10 audited accounts
7 Pacific Financial Technical Assistance Centrer 8 The in-country analytical work took place during October and November 2011. 9 Excluding local government due to lack of available data 10 AGAs cover both commercially-oriented and non-commercially-oriented enterprises (e.g. regulatory authorities and tertiary educational institutions)
Republic of the Marshall Islands – PEFA Public Financial Management Performance Report Page 2
2. Background
2.1 Description of Country Economic Situation
Country context
The Republic of Marshall Islands (RMI) is located in the Pacific Ocean, just west of the international
dateline and just north of the Equator. In 1986, independence was attained under a Compact of Free
Association with the United States, and an amended Compact was entered into force in May 2004.
The country consists of 29 atolls and 5 isolated islands. The atolls and islands form two groups: the
Ratak Chain and the Ralik Chain (meaning "sunrise" and "sunset" chains). 24 of the atolls are
inhabited.
According to the 1999 census, RMI has a population of around 61,100, and a natural rate of
population growth of around 3.6%. The population of the RMI has doubled in the last 26 years. In
recent years however, emigration has absorbed the annual increment. Most of the people in RMI live
in the urban areas on Majuro and Kwajalein atolls. Less then one-third of the population live in the
rural areas, that is, the other atolls and islands. Marshallese comprise 97% of the population. While
results from the 2011 census have not yet been fully analysed, preliminary estimates indicate a
growing population. With growth concentrated in only a few sectors, rising unemployment and
financial hardship, especially in outer islands, have driven migration to the urban atolls and to the US.
The RMI’s economy is small and open, making it highly vulnerable to external shocks. Over the last
decade several major shocks have affected growth and development prospects, including several
natural disasters, the recent global economic and financial crisis and higher international food and fuel
prices. The public sector remains the major employer and has increased its share in recent years due
to the addition of teachers to the civil service rolls and increased investments in health and education
infrastructure since 2004. However, the private sector, employing around 40% of the employed
workforce, has become more diversified than in past decades. Important private sector industries
include fisheries, construction and tourism, as well as employment at the U.S. Army base at
Kwajalein Atoll.
Nearly all land in the country is held privately, under the traditional land tenure system. Therefore,
most government-occupied land, including land used for public offices, schools, the main hospital, the
national airport, and portions of Kwajalein Atoll that are used by the US for its missile testing
program, are only accessible through lease arrangements. Disputes over lease terms are growing
increasingly common, including over the multi-million dollar Kwajalein Land Use Agreement. GRMI
set up a voluntary land registry system in 2003 in an effort to improve accessibility to and security of
land for development purposes.
Overall Government reform program
GRMI ran an expansionary fiscal policy between 2004 and 2008, with spending increases in health,
education, environmental protection and management, and infrastructure development and
maintenance. However, such expenditure increases were not sustainable in the medium term because
of the annual decrements to the amended Compact’s sector grant funding, and efforts were made to
increase domestic revenue. With the effect of the global financial crisis, GMRI’s ability to maintain
an adequate and balanced budget became even more challenging from 2008. Thus, in 2010, the
Government agreed to two major reform programs. On the revenue side, the Cabinet adopted the Tax
Reform and Modernisation program (TRAM), with the main element being the movement toward a
value-added tax. On the expenditure side, the Cabinet adopted the Comprehensive Adjustment
Program (CAP), which calls for wholesale cuts over the medium term in civil service positions and
related costs, reductions in government allowances and support costs, reduction or elimination of
grants and subsidies, and organization and facilities consolidation.
Republic of the Marshall Islands – PEFA Public Financial Management Performance Report Page 3
Rationale for PFM reforms
The Government of the Republic of the Marshall Islands (GRMI) is currently facing a challenging
socioeconomic and fiscal situation characterised by:
a growing population placing demand on social services such as education and health and
more use by the population of these services;
limited economic growth prospects; and
reductions in the most recent (2003) U.S.-RMI Compact of Free Association (known as the
Compact) flows in grant funds and some, but limited, opportunities for domestic revenue
generation.
GRMI recognizes the urgent need for PFM reform, particularly in response to the impending
reductions in Compact grant funds, with the Association agreement due to end in 2023, and the
significant resulting reductions in external assistance.
The Government’s medium-/long-term strategic development plan framework, “Vision 2018”,
includes governance, strengthening the financial and fiscal situation, and improving resource
allocation as three of its key broad strategies. In conjunction with this plan, the Government is
undertaking a number of PFM reform measures. Short-term measures are mainly centered on budget
policy, including reductions in the wage bill and measures to increase domestic revenue. Longer-term
systemic changes include performance-based budgeting for the Compact ministries (e.g. education),
and strengthening of external audit.
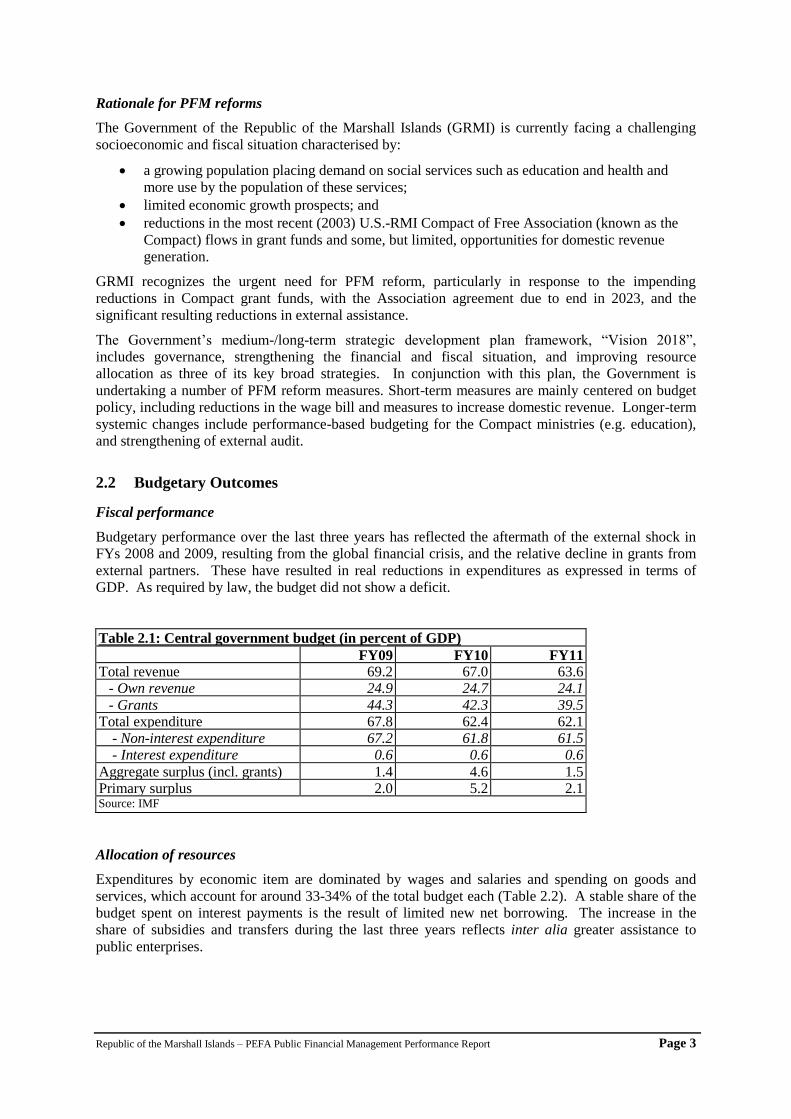
2.2 Budgetary Outcomes
Fiscal performance
Budgetary performance over the last three years has reflected the aftermath of the external shock in
FYs 2008 and 2009, resulting from the global financial crisis, and the relative decline in grants from
external partners. These have resulted in real reductions in expenditures as expressed in terms of
GDP. As required by law, the budget did not show a deficit.
Table 2.1: Central government budget (in percent of GDP)
FY09 FY10 FY11 Total revenue 69.2 67.0 63.6
- Own revenue 24.9 24.7 24.1
- Grants 44.3 42.3 39.5 Total expenditure 67.8 62.4 62.1
- Non-interest expenditure 67.2 61.8 61.5 - Interest expenditure 0.6 0.6 0.6
Aggregate surplus (incl. grants) 1.4 4.6 1.5 Primary surplus 2.0 5.2 2.1 Source: IMF
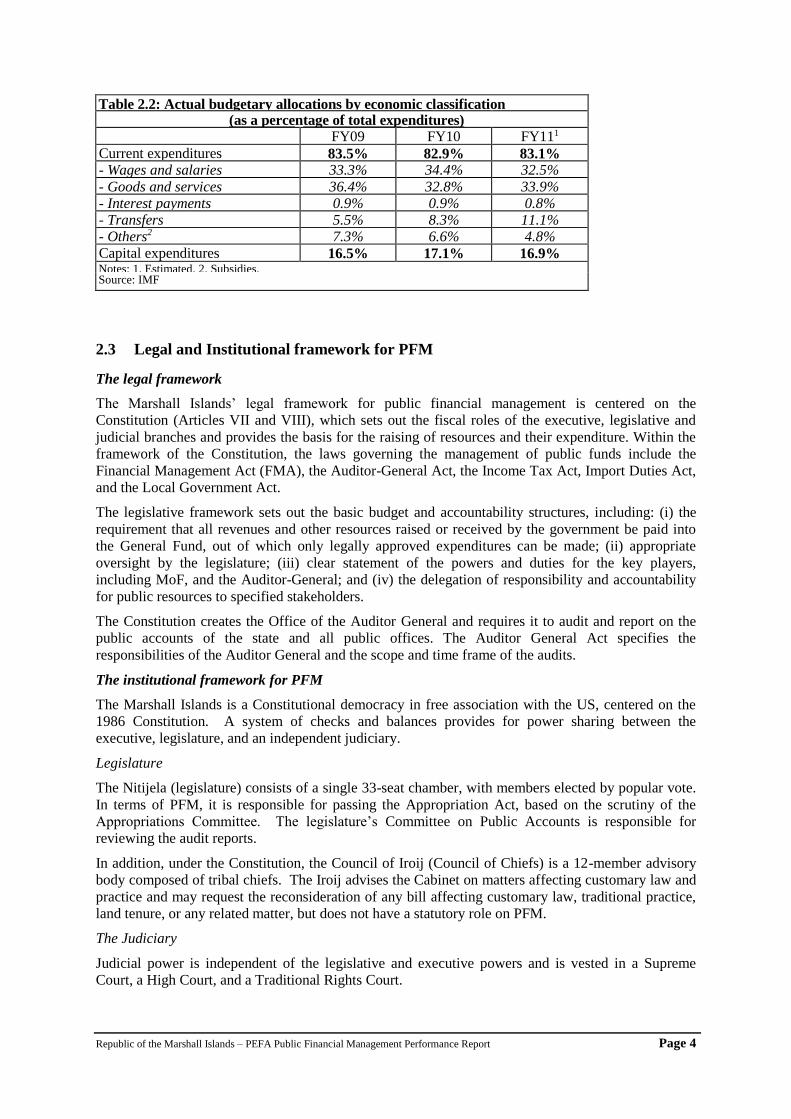
Allocation of resources
Expenditures by economic item are dominated by wages and salaries and spending on goods and
services, which account for around 33-34% of the total budget each (Table 2.2). A stable share of the
budget spent on interest payments is the result of limited new net borrowing. The increase in the
share of subsidies and transfers during the last three years reflects inter alia greater assistance to
public enterprises.
Republic of the Marshall Islands – PEFA Public Financial Management Performance Report Page 4
Table 2.2: Actual budgetary allocations by economic classification (as a percentage of total expenditures)
FY09 FY10 FY111
Current expenditures 83.5% 82.9% 83.1% - Wages and salaries 33.3% 34.4% 32.5%
- Goods and services 36.4% 32.8% 33.9%
- Interest payments 0.9% 0.9% 0.8%
- Transfers 5.5% 8.3% 11.1%
- Others2 7.3% 6.6% 4.8%
Capital expenditures 16.5% 17.1% 16.9% Notes: 1. Estimated. 2. Subsidies. Source: IMF
2.3 Legal and Institutional framework for PFM
The legal framework
The Marshall Islands’ legal framework for public financial management is centered on the
Constitution (Articles VII and VIII), which sets out the fiscal roles of the executive, legislative and
judicial branches and provides the basis for the raising of resources and their expenditure. Within the
framework of the Constitution, the laws governing the management of public funds include the
Financial Management Act (FMA), the Auditor-General Act, the Income Tax Act, Import Duties Act,
and the Local Government Act.
The legislative framework sets out the basic budget and accountability structures, including: (i) the
requirement that all revenues and other resources raised or received by the government be paid into
the General Fund, out of which only legally approved expenditures can be made; (ii) appropriate
oversight by the legislature; (iii) clear statement of the powers and duties for the key players,
including MoF, and the Auditor-General; and (iv) the delegation of responsibility and accountability
for public resources to specified stakeholders.
The Constitution creates the Office of the Auditor General and requires it to audit and report on the
public accounts of the state and all public offices. The Auditor General Act specifies the
responsibilities of the Auditor General and the scope and time frame of the audits.
The institutional framework for PFM
The Marshall Islands is a Constitutional democracy in free association with the US, centered on the
1986 Constitution. A system of checks and balances provides for power sharing between the
executive, legislature, and an independent judiciary.
Legislature
The Nitijela (legislature) consists of a single 33-seat chamber, with members elected by popular vote.
In terms of PFM, it is responsible for passing the Appropriation Act, based on the scrutiny of the
Appropriations Committee. The legislature’s Committee on Public Accounts is responsible for
reviewing the audit reports.
In addition, under the Constitution, the Council of Iroij (Council of Chiefs) is a 12-member advisory
body composed of tribal chiefs. The Iroij advises the Cabinet on matters affecting customary law and
practice and may request the reconsideration of any bill affecting customary law, traditional practice,
land tenure, or any related matter, but does not have a statutory role on PFM.
The Judiciary
Judicial power is independent of the legislative and executive powers and is vested in a Supreme
Court, a High Court, and a Traditional Rights Court.
Republic of the Marshall Islands – PEFA Public Financial Management Performance Report Page 5
The Executive
The President is both the head of State and the head of government. Executive authority of the
Marshall Islands is vested in the Cabinet, whose members are collectively responsible to the Nitijela.
Members of the Cabinet are selected by the President from among the members of the Nitijela.
The main central agencies responsible for PFM for central government are the Ministry of Finance
(MoF), the President’s Office, the Office of the Chief Secretary, the Office of the Auditor General,
and the Public Service Commission (PSC). Under the President’s Office, the Economics Policy,
Planning and Statistics Office (EPPSO) has primary responsibility for planning and statistics. The
Office of the Chief Secretary, as head of the Public Service and the chief administrative and advisory
officer of the Government, houses the Chief Public Procurement Officer.
The Auditor General manages the external audit function. This is a constitutional body accountable to
Parliament and whose function is to inspect, audit and report on the public accounts and on the control
of, and transactions with, public resources.
The Public Service Commission is responsible for the recruitment, promotion, and dismissal of
employees, the approval of organizational structures, and overseeing remuneration, job sizing, and job
descriptions.
Key Features of the PFM System
The PFM system in the Marshall Islands is highly centralized, with a relatively limited local
government sector. The Ministry of Finance is the central agency responsible for PFM. The fiscal year
runs from October 1 to September 30. Section 3 below provides details for each element of the PFM
system.
Republic of the Marshall Islands – PEFA Public Financial Management Performance Report Page 6
3. Assessment of PFM System, Processes and Institutions11
This section provides details of the main findings of the assessment by indicator. For each indicator,
the scores should be read in conjunction with the accompanying narrative explanation.
3.1 Budget Credibility
The budget is the central mechanism for controlling expenditure in accordance with amounts set out
in Appropriation Acts as passed by Parliament. The ability to implement budgeted expenditures as
planned is an important factor in supporting the government’s ability to deliver on its national policy
priorities. Budget credibility requires both actual budgetary releases to be similar to voted budgets
and the means to enforce appropriate fiscal discipline to be in place.
11 The measurement of the scores in this section follows closely the PEFA Guidelines (see www.pefa.org for a description of the calibration of scores for
each indicator). For indicators with more than one dimension, a separate score is given for each dimension, and the overall score for the indicator is
shown in bold and box-framed.
Republic of the Marshall Islands – PEFA Public Financial Management Performance Report Page 7
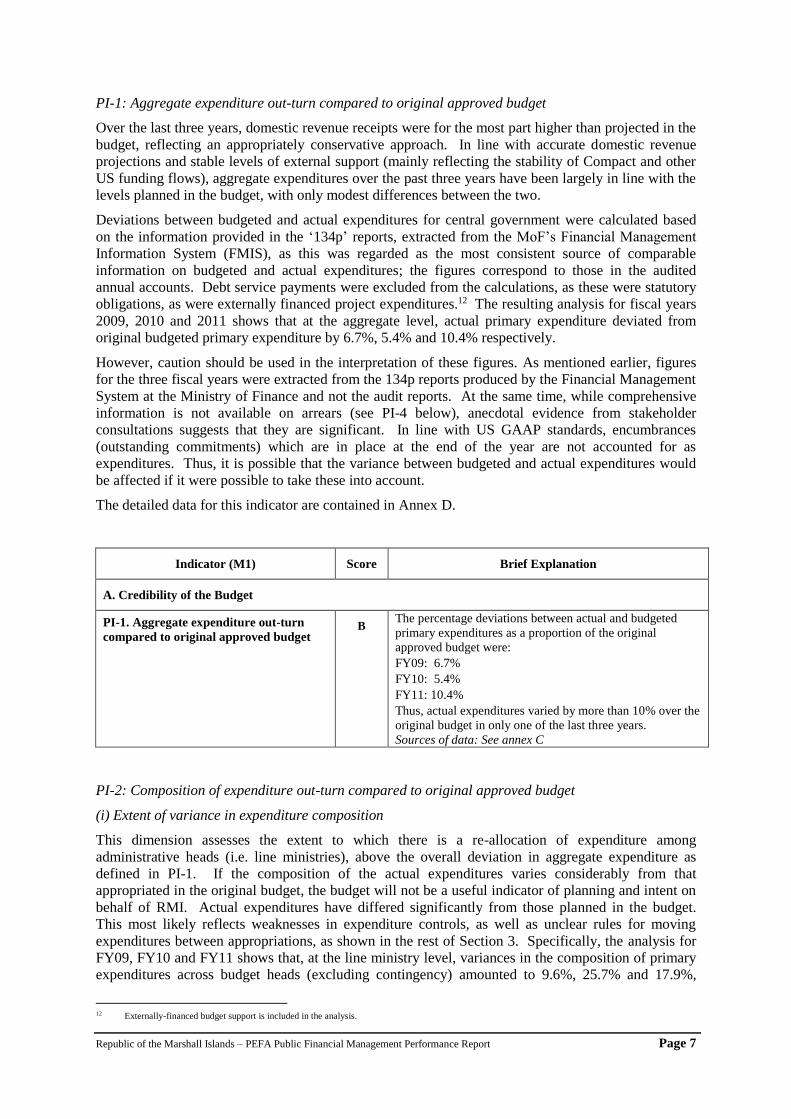
PI-1: Aggregate expenditure out-turn compared to original approved budget
Over the last three years, domestic revenue receipts were for the most part higher than projected in the
budget, reflecting an appropriately conservative approach. In line with accurate domestic revenue
projections and stable levels of external support (mainly reflecting the stability of Compact and other
US funding flows), aggregate expenditures over the past three years have been largely in line with the
levels planned in the budget, with only modest differences between the two.
Deviations between budgeted and actual expenditures for central government were calculated based
on the information provided in the ‘134p’ reports, extracted from the MoF’s Financial Management
Information System (FMIS), as this was regarded as the most consistent source of comparable
information on budgeted and actual expenditures; the figures correspond to those in the audited
annual accounts. Debt service payments were excluded from the calculations, as these were statutory
obligations, as were externally financed project expenditures.12 The resulting analysis for fiscal years
2009, 2010 and 2011 shows that at the aggregate level, actual primary expenditure deviated from
original budgeted primary expenditure by 6.7%, 5.4% and 10.4% respectively.
However, caution should be used in the interpretation of these figures. As mentioned earlier, figures
for the three fiscal years were extracted from the 134p reports produced by the Financial Management
System at the Ministry of Finance and not the audit reports. At the same time, while comprehensive
information is not available on arrears (see PI-4 below), anecdotal evidence from stakeholder
consultations suggests that they are significant. In line with US GAAP standards, encumbrances
(outstanding commitments) which are in place at the end of the year are not accounted for as
expenditures. Thus, it is possible that the variance between budgeted and actual expenditures would
be affected if it were possible to take these into account.
The detailed data for this indicator are contained in Annex D.
Indicator (M1) Score Brief Explanation
A. Credibility of the Budget
PI-1. Aggregate expenditure out-turn
compared to original approved budget B
The percentage deviations between actual and budgeted
primary expenditures as a proportion of the original
approved budget were:
FY09: 6.7%
FY10: 5.4%
FY11: 10.4%
Thus, actual expenditures varied by more than 10% over the
original budget in only one of the last three years.
Sources of data: See annex C
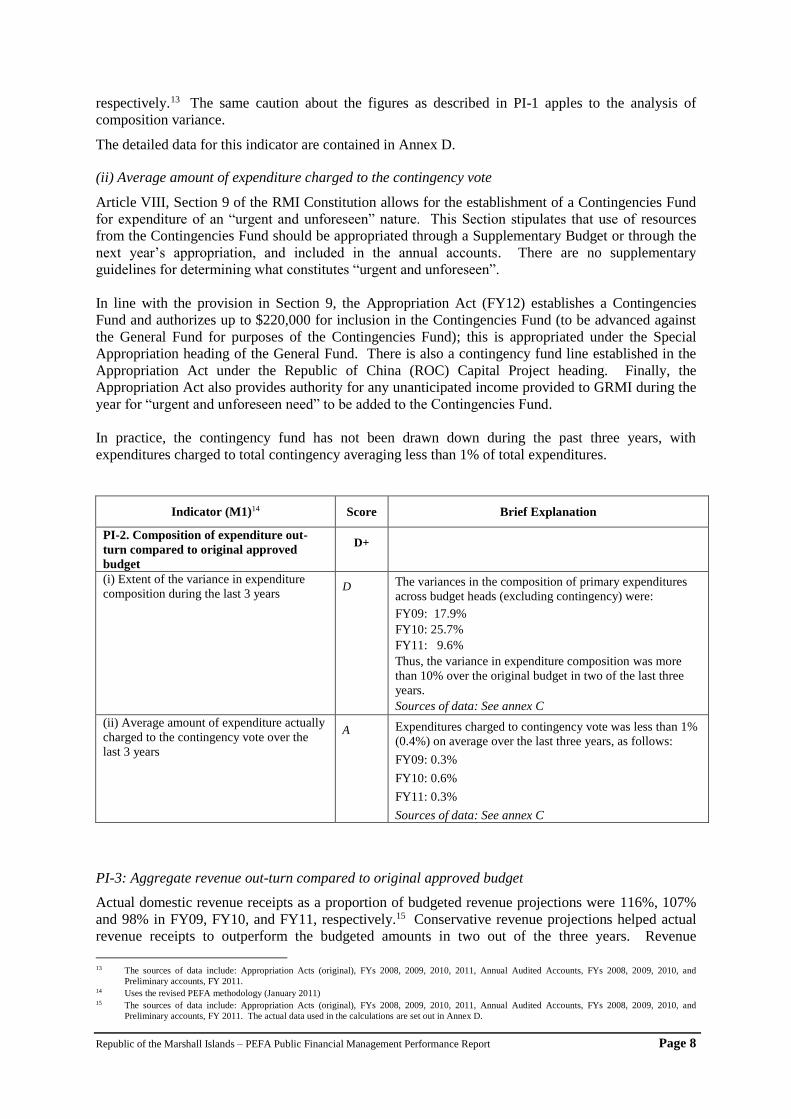
PI-2: Composition of expenditure out-turn compared to original approved budget
(i) Extent of variance in expenditure composition
This dimension assesses the extent to which there is a re-allocation of expenditure among
administrative heads (i.e. line ministries), above the overall deviation in aggregate expenditure as
defined in PI-1. If the composition of the actual expenditures varies considerably from that
appropriated in the original budget, the budget will not be a useful indicator of planning and intent on
behalf of RMI. Actual expenditures have differed significantly from those planned in the budget.
This most likely reflects weaknesses in expenditure controls, as well as unclear rules for moving
expenditures between appropriations, as shown in the rest of Section 3. Specifically, the analysis for
FY09, FY10 and FY11 shows that, at the line ministry level, variances in the composition of primary
expenditures across budget heads (excluding contingency) amounted to 9.6%, 25.7% and 17.9%,
12 Externally-financed budget support is included in the analysis.
Republic of the Marshall Islands – PEFA Public Financial Management Performance Report Page 8
respectively.13 The same caution about the figures as described in PI-1 apples to the analysis of
composition variance.
The detailed data for this indicator are contained in Annex D.
(ii) Average amount of expenditure charged to the contingency vote
Article VIII, Section 9 of the RMI Constitution allows for the establishment of a Contingencies Fund
for expenditure of an “urgent and unforeseen” nature. This Section stipulates that use of resources
from the Contingencies Fund should be appropriated through a Supplementary Budget or through the
next year’s appropriation, and included in the annual accounts. There are no supplementary
guidelines for determining what constitutes “urgent and unforeseen”.
In line with the provision in Section 9, the Appropriation Act (FY12) establishes a Contingencies
Fund and authorizes up to $220,000 for inclusion in the Contingencies Fund (to be advanced against
the General Fund for purposes of the Contingencies Fund); this is appropriated under the Special
Appropriation heading of the General Fund. There is also a contingency fund line established in the
Appropriation Act under the Republic of China (ROC) Capital Project heading. Finally, the
Appropriation Act also provides authority for any unanticipated income provided to GRMI during the
year for “urgent and unforeseen need” to be added to the Contingencies Fund.
In practice, the contingency fund has not been drawn down during the past three years, with
expenditures charged to total contingency averaging less than 1% of total expenditures.
Indicator (M1)14 Score Brief Explanation
PI-2. Composition of expenditure out-
turn compared to original approved
budget
D+
(i) Extent of the variance in expenditure
composition during the last 3 years D The variances in the composition of primary expenditures
across budget heads (excluding contingency) were:
FY09: 17.9%
FY10: 25.7%
FY11: 9.6%
Thus, the variance in expenditure composition was more
than 10% over the original budget in two of the last three
years.
Sources of data: See annex C
(ii) Average amount of expenditure actually
charged to the contingency vote over the
last 3 years
A Expenditures charged to contingency vote was less than 1%
(0.4%) on average over the last three years, as follows:
FY09: 0.3%
FY10: 0.6%
FY11: 0.3%
Sources of data: See annex C
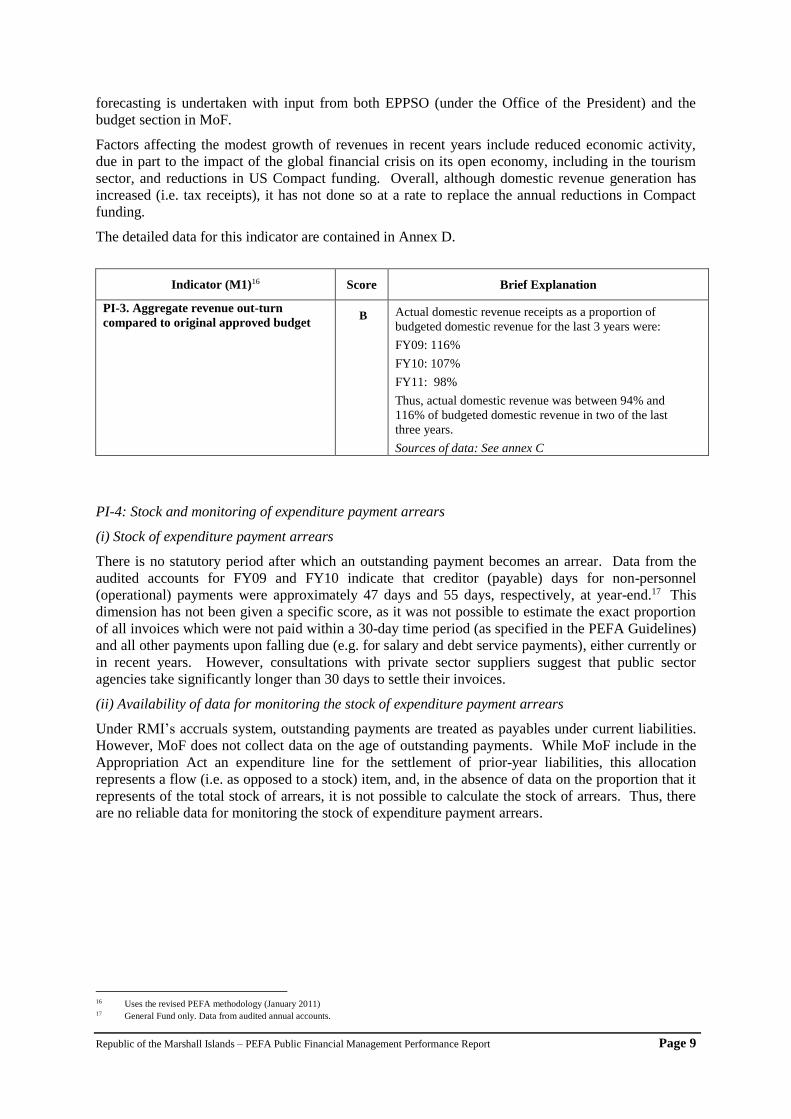
PI-3: Aggregate revenue out-turn compared to original approved budget
Actual domestic revenue receipts as a proportion of budgeted revenue projections were 116%, 107%
and 98% in FY09, FY10, and FY11, respectively.15 Conservative revenue projections helped actual
revenue receipts to outperform the budgeted amounts in two out of the three years. Revenue
13 The sources of data include: Appropriation Acts (original), FYs 2008, 2009, 2010, 2011, Annual Audited Accounts, FYs 2008, 2009, 2010, and
Preliminary accounts, FY 2011. 14 Uses the revised PEFA methodology (January 2011) 15 The sources of data include: Appropriation Acts (original), FYs 2008, 2009, 2010, 2011, Annual Audited Accounts, FYs 2008, 2009, 2010, and
Preliminary accounts, FY 2011. The actual data used in the calculations are set out in Annex D.
Republic of the Marshall Islands – PEFA Public Financial Management Performance Report Page 9
forecasting is undertaken with input from both EPPSO (under the Office of the President) and the
budget section in MoF.
Factors affecting the modest growth of revenues in recent years include reduced economic activity,
due in part to the impact of the global financial crisis on its open economy, including in the tourism
sector, and reductions in US Compact funding. Overall, although domestic revenue generation has
increased (i.e. tax receipts), it has not done so at a rate to replace the annual reductions in Compact
funding.
The detailed data for this indicator are contained in Annex D.
Indicator (M1)16 Score Brief Explanation
PI-3. Aggregate revenue out-turn
compared to original approved budget B Actual domestic revenue receipts as a proportion of
budgeted domestic revenue for the last 3 years were:
FY09: 116%
FY10: 107%
FY11: 98%
Thus, actual domestic revenue was between 94% and
116% of budgeted domestic revenue in two of the last
three years.
Sources of data: See annex C
PI-4: Stock and monitoring of expenditure payment arrears
(i) Stock of expenditure payment arrears
There is no statutory period after which an outstanding payment becomes an arrear. Data from the
audited accounts for FY09 and FY10 indicate that creditor (payable) days for non-personnel
(operational) payments were approximately 47 days and 55 days, respectively, at year-end.17 This
dimension has not been given a specific score, as it was not possible to estimate the exact proportion
of all invoices which were not paid within a 30-day time period (as specified in the PEFA Guidelines)
and all other payments upon falling due (e.g. for salary and debt service payments), either currently or
in recent years. However, consultations with private sector suppliers suggest that public sector
agencies take significantly longer than 30 days to settle their invoices.
(ii) Availability of data for monitoring the stock of expenditure payment arrears
Under RMI’s accruals system, outstanding payments are treated as payables under current liabilities.
However, MoF does not collect data on the age of outstanding payments. While MoF include in the
Appropriation Act an expenditure line for the settlement of prior-year liabilities, this allocation
represents a flow (i.e. as opposed to a stock) item, and, in the absence of data on the proportion that it
represents of the total stock of arrears, it is not possible to calculate the stock of arrears. Thus, there
are no reliable data for monitoring the stock of expenditure payment arrears.
16 Uses the revised PEFA methodology (January 2011) 17 General Fund only. Data from audited annual accounts.
Republic of the Marshall Islands – PEFA Public Financial Management Performance Report Page 10
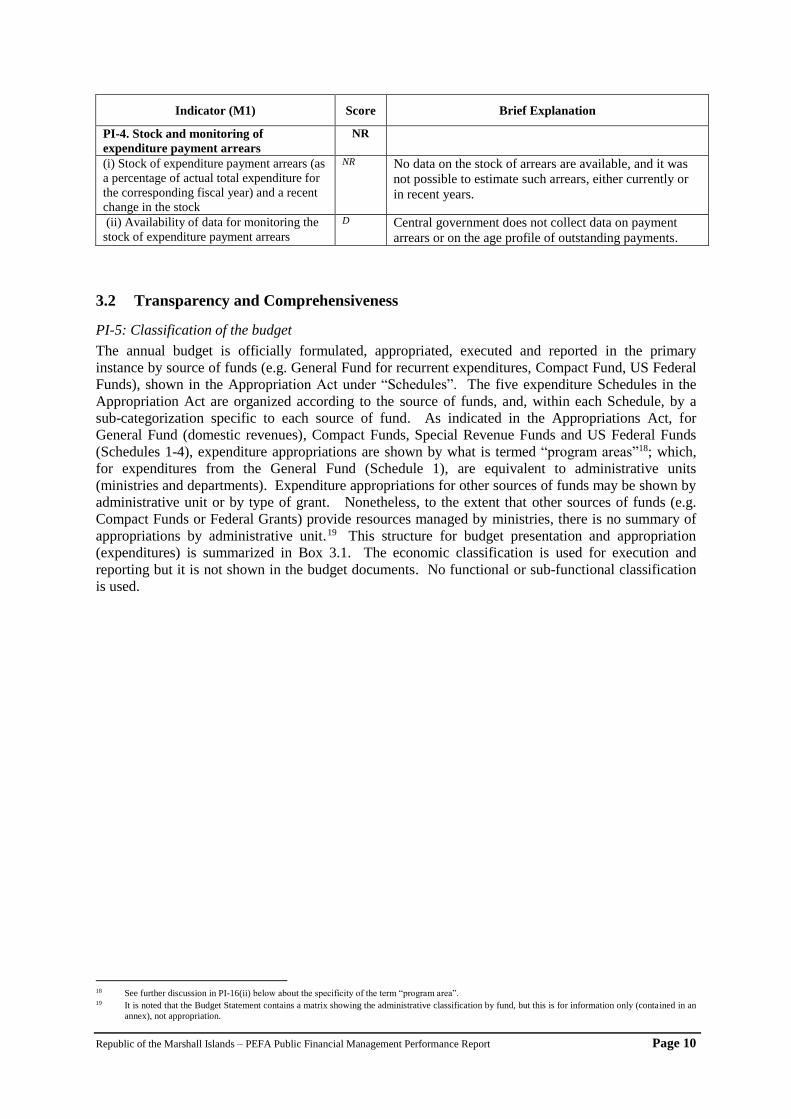
Indicator (M1) Score Brief Explanation
PI-4. Stock and monitoring of
expenditure payment arrears
NR
(i) Stock of expenditure payment arrears (as
a percentage of actual total expenditure for
the corresponding fiscal year) and a recent
change in the stock
NR No data on the stock of arrears are available, and it was
not possible to estimate such arrears, either currently or
in recent years.
(ii) Availability of data for monitoring the
stock of expenditure payment arrears
D Central government does not collect data on payment
arrears or on the age profile of outstanding payments.
3.2 Transparency and Comprehensiveness
PI-5: Classification of the budget
The annual budget is officially formulated, appropriated, executed and reported in the primary
instance by source of funds (e.g. General Fund for recurrent expenditures, Compact Fund, US Federal
Funds), shown in the Appropriation Act under “Schedules”. The five expenditure Schedules in the
Appropriation Act are organized according to the source of funds, and, within each Schedule, by a
sub-categorization specific to each source of fund. As indicated in the Appropriations Act, for
General Fund (domestic revenues), Compact Funds, Special Revenue Funds and US Federal Funds
(Schedules 1-4), expenditure appropriations are shown by what is termed “program areas”18; which,
for expenditures from the General Fund (Schedule 1), are equivalent to administrative units
(ministries and departments). Expenditure appropriations for other sources of funds may be shown by
administrative unit or by type of grant. Nonetheless, to the extent that other sources of funds (e.g.
Compact Funds or Federal Grants) provide resources managed by ministries, there is no summary of
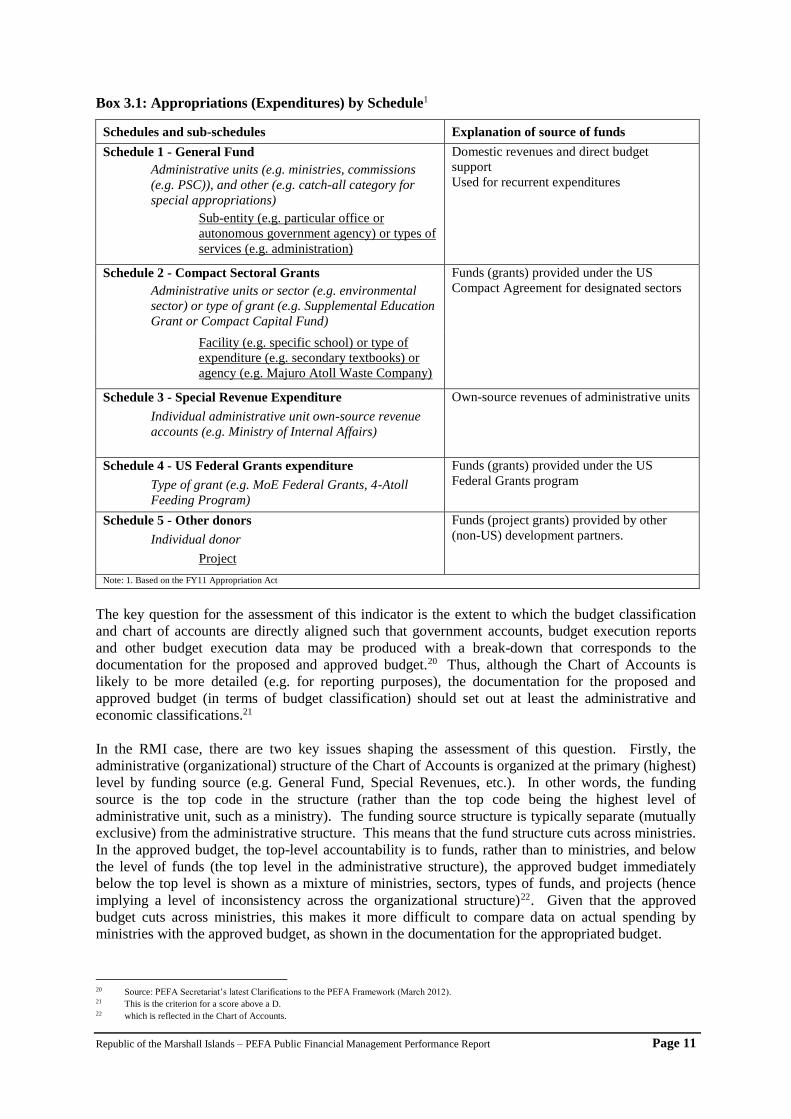
appropriations by administrative unit.19 This structure for budget presentation and appropriation
(expenditures) is summarized in Box 3.1. The economic classification is used for execution and
reporting but it is not shown in the budget documents. No functional or sub-functional classification
is used.
18 See further discussion in PI-16(ii) below about the specificity of the term “program area”. 19 It is noted that the Budget Statement contains a matrix showing the administrative classification by fund, but this is for information only (contained in an
annex), not appropriation.
Republic of the Marshall Islands – PEFA Public Financial Management Performance Report Page 11
Box 3.1: Appropriations (Expenditures) by Schedule1
Schedules and sub-schedules Explanation of source of funds
Schedule 1 - General Fund
Administrative units (e.g. ministries, commissions
(e.g. PSC)), and other (e.g. catch-all category for
special appropriations)
Sub-entity (e.g. particular office or
autonomous government agency) or types of
services (e.g. administration)
Domestic revenues and direct budget
support
Used for recurrent expenditures
Schedule 2 - Compact Sectoral Grants
Administrative units or sector (e.g. environmental
sector) or type of grant (e.g. Supplemental Education
Grant or Compact Capital Fund)
Funds (grants) provided under the US
Compact Agreement for designated sectors
Facility (e.g. specific school) or type of
expenditure (e.g. secondary textbooks) or
agency (e.g. Majuro Atoll Waste Company)
Schedule 3 - Special Revenue Expenditure
Individual administrative unit own-source revenue
accounts (e.g. Ministry of Internal Affairs)
Own-source revenues of administrative units
Schedule 4 - US Federal Grants expenditure
Type of grant (e.g. MoE Federal Grants, 4-Atoll
Feeding Program)
Funds (grants) provided under the US
Federal Grants program
Schedule 5 - Other donors
Individual donor
Project
Funds (project grants) provided by other
(non-US) development partners.
Note: 1. Based on the FY11 Appropriation Act
The key question for the assessment of this indicator is the extent to which the budget classification
and chart of accounts are directly aligned such that government accounts, budget execution reports
and other budget execution data may be produced with a break-down that corresponds to the
documentation for the proposed and approved budget.20 Thus, although the Chart of Accounts is
likely to be more detailed (e.g. for reporting purposes), the documentation for the proposed and
approved budget (in terms of budget classification) should set out at least the administrative and
economic classifications.21
In the RMI case, there are two key issues shaping the assessment of this question. Firstly, the
administrative (organizational) structure of the Chart of Accounts is organized at the primary (highest)
level by funding source (e.g. General Fund, Special Revenues, etc.). In other words, the funding
source is the top code in the structure (rather than the top code being the highest level of
administrative unit, such as a ministry). The funding source structure is typically separate (mutually
exclusive) from the administrative structure. This means that the fund structure cuts across ministries.
In the approved budget, the top-level accountability is to funds, rather than to ministries, and below
the level of funds (the top level in the administrative structure), the approved budget immediately
below the top level is shown as a mixture of ministries, sectors, types of funds, and projects (hence
implying a level of inconsistency across the organizational structure)22. Given that the approved
budget cuts across ministries, this makes it more difficult to compare data on actual spending by
ministries with the approved budget, as shown in the documentation for the appropriated budget.
20 Source: PEFA Secretariat’s latest Clarifications to the PEFA Framework (March 2012). 21 This is the criterion for a score above a D. 22 which is reflected in the Chart of Accounts.

Republic of the Marshall Islands – PEFA Public Financial Management Performance Report Page 12
Secondly, whilst the Chart of Accounts incorporates both an administrative (organizational) and an
economic structure (for detailed reporting), only the former (organizational structure, whose highest
level, funding source, cuts across ministries, as explained immediately above) is incorporated
explicitly into the approved budget. However, as indicated above, the administrative (organizational)
classification at lower levels (i.e. in its disaggregation) is not consistent across the classification.
In practice, both of these mean that the budget classification does not in practice incorporate the
administrative and economic classifications such that it allows data comparisons to be consistent with
the documentation for the proposed and approved budget.23 In this way, the requirements for a higher
score are not met.
Indicator (M1) Score Brief Explanation
B. Comprehensiveness and Transparency
PI-5. Classification of the
budget
D The administrative classification is used for preparation,
execution and reporting. The economic classification is used
for execution and reporting, but not for preparation and appropriation. No functional or sub-functional classification is
used.
The criteria for a higher score are not met.
PI-6: Comprehensiveness of budget documentation
The annual budget documents laid before Parliament mainly consist of the Appropriation Bill, which
consists of 5 expenditure schedules, organized according to the source of funds, specifically:
(1) recurrent general appropriations; (2) appropriated expenditures from Compact sectoral grants;
(3) appropriated expenditures from special revenues (line ministries’ own-source revenues);
(4) appropriated expenditures from US Federal grants; and (5) appropriated expenditures from other
donors (primarily from ROC project grants). Schedules 6 to 9 set out the revenue sources in terms of,
respectively, the General Fund (for domestic revenues), line ministries’ own-source revenues (from
fees and charges), Compact revenues, and other (specifically, US Federal Funds, and ROC grants).
In addition, an analytical document, the Budget Statement, accompanies the Appropriation Bill. The
FY12 Budget Statement contains a brief narrative statement on macro-economic events during the
previous year (e.g. GDP growth rate), an explanation of principles guiding the proposed budget, and
very brief explanations of the bases for the budget’s revenue estimates (including by fund), and
expenditure allocations.
However, neither the Appropriation Bill nor the Budget Statement provides comprehensive
information on the macroeconomic context, revenues, expenditures, and financial assets, nor
systematic information on prior year’s outturns or a detailed analysis of the fiscal implications of new
policies (see Box 3.2).
23 The criterion for a score above a D.
Republic of the Marshall Islands – PEFA Public Financial Management Performance Report Page 13
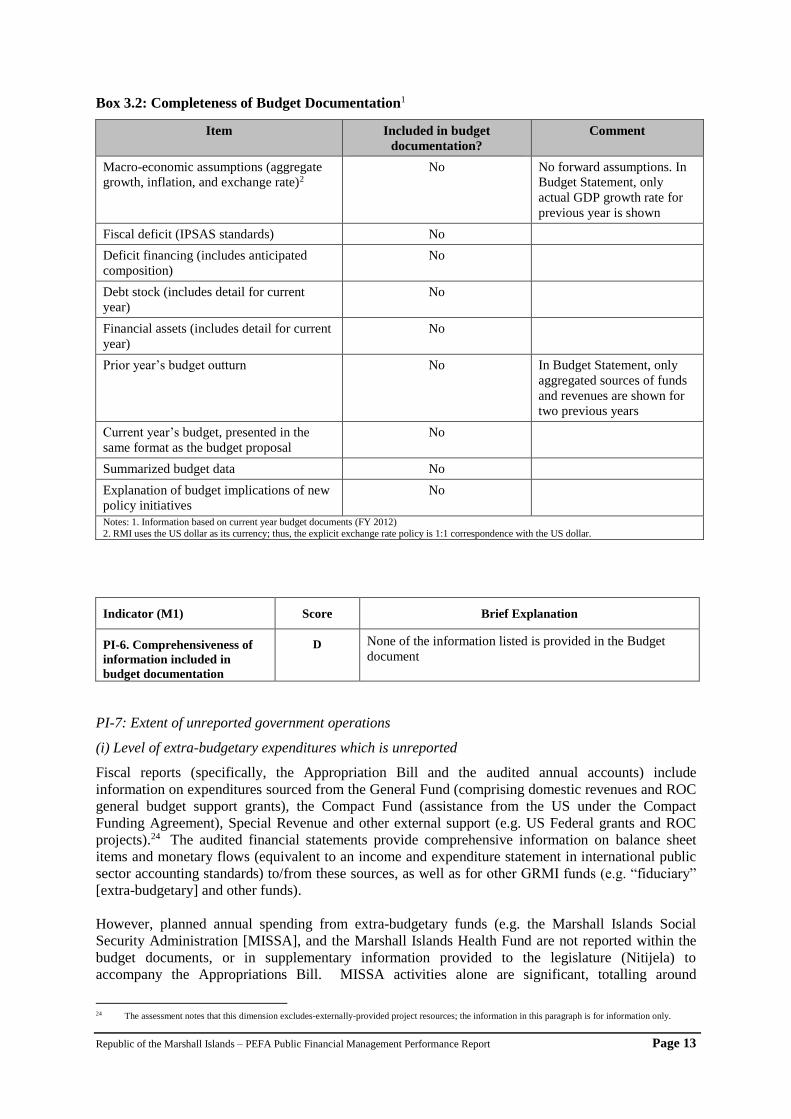
Box 3.2: Completeness of Budget Documentation1
Item Included in budget
documentation?
Comment
Macro-economic assumptions (aggregate
growth, inflation, and exchange rate)2
No No forward assumptions. In
Budget Statement, only
actual GDP growth rate for
previous year is shown
Fiscal deficit (IPSAS standards) No
Deficit financing (includes anticipated
composition)
No
Debt stock (includes detail for current
year)
No
Financial assets (includes detail for current
year)
No
Prior year’s budget outturn No In Budget Statement, only
aggregated sources of funds
and revenues are shown for
two previous years
Current year’s budget, presented in the
same format as the budget proposal
No
Summarized budget data No
Explanation of budget implications of new
policy initiatives
No
Notes: 1. Information based on current year budget documents (FY 2012)
2. RMI uses the US dollar as its currency; thus, the explicit exchange rate policy is 1:1 correspondence with the US dollar.
Indicator (M1) Score Brief Explanation
PI-6. Comprehensiveness of
information included in
budget documentation
D None of the information listed is provided in the Budget
document
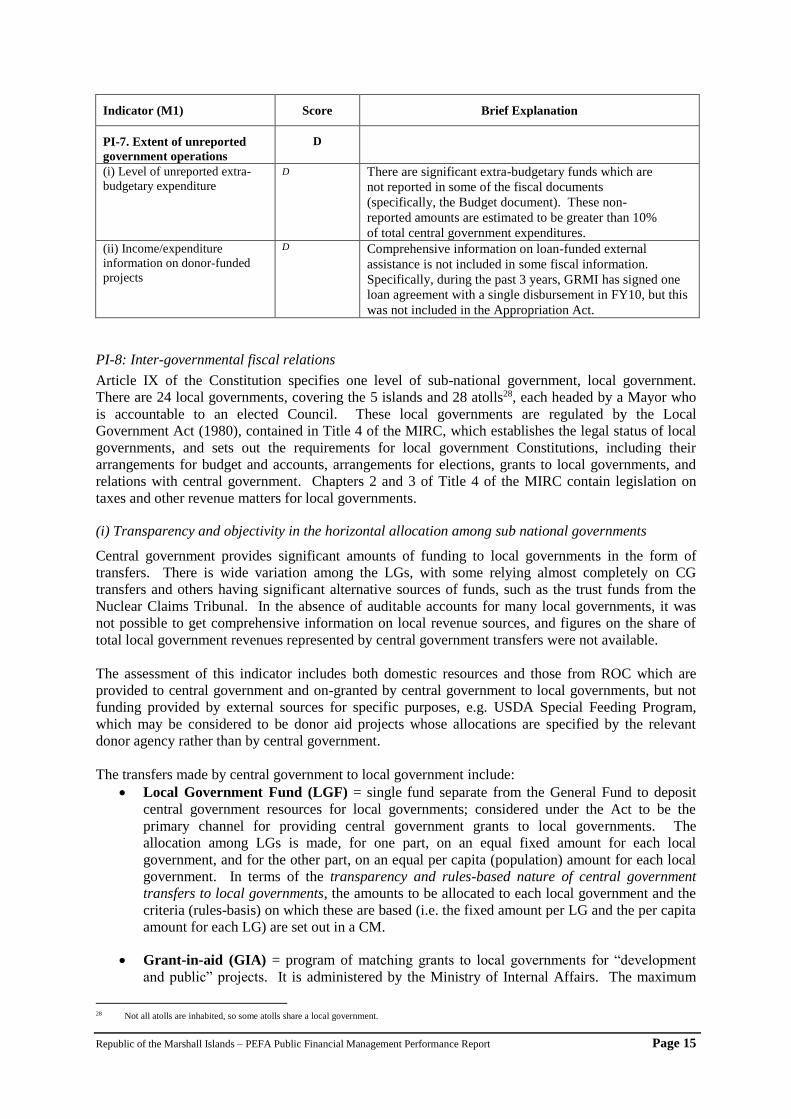
PI-7: Extent of unreported government operations
(i) Level of extra-budgetary expenditures which is unreported
Fiscal reports (specifically, the Appropriation Bill and the audited annual accounts) include
information on expenditures sourced from the General Fund (comprising domestic revenues and ROC
general budget support grants), the Compact Fund (assistance from the US under the Compact
Funding Agreement), Special Revenue and other external support (e.g. US Federal grants and ROC
projects).24 The audited financial statements provide comprehensive information on balance sheet
items and monetary flows (equivalent to an income and expenditure statement in international public
sector accounting standards) to/from these sources, as well as for other GRMI funds (e.g. “fiduciary”
[extra-budgetary] and other funds).
However, planned annual spending from extra-budgetary funds (e.g. the Marshall Islands Social
Security Administration [MISSA], and the Marshall Islands Health Fund are not reported within the
budget documents, or in supplementary information provided to the legislature (Nitijela) to
accompany the Appropriations Bill. MISSA activities alone are significant, totalling around
24 The assessment notes that this dimension excludes-externally-provided project resources; the information in this paragraph is for information only.
Republic of the Marshall Islands – PEFA Public Financial Management Performance Report Page 14
US$15 mn of expenditure in FY11, representing approximately 15% of total GRMI expenditures.25
Other un-reported government operations, which are not appropriated or reported comprehensively in
fiscal reports (including the annual audited accounts), include income and expenditure activity and
Statements of Financial Position (balance sheets) for other funds, such as the Communication
Regulation Fund, the Historic Preservation Fund, and the Marshallese Language Trust Fund; as well
as smaller expenditures, such as school registration fees, school bus fees, and fees for service
collected by health clinics in the outer islands.26 In addition, autonomous government agencies27 have
social service obligations, which are not clearly defined or valued/reported. Although it was not
possible to get an estimate of the value of the un-reported government activities listed above, these
activities clearly represent more than 10% of total central government expenditures (based on the
activities of MISSA alone).
(ii) Income/expenditure information on donor-funded projects included in fiscal reports
GRMI fiscal reports do not comprehensively include information on donor-funded projects, for
neither loans nor grants. For loans, GRMI’s external portfolio contains loans exclusively from ADB,
including new loans contracted during the past three years. The Appropriations Bill does not have a
section on budget financing (below-the-line) and it does not include external loans. Specifically,
during the past 3 years, GRMI has signed one loan agreement with one disbursement (in an amount of
$9.5 mn) in FY10, but this was not included in the Appropriation Act. The amount was disclosed in
the annual financial statements.
In terms of grants, the Appropriations Bill contains information on planned expenditures for grants
from the US in the form of the Compact and US Federal grants (those administered by the US
Department of the Interior), and from ROC, in the form of budget support and capital grants. The
annual financial statements also include expenditures from these grants made during the year.
Expenditures from other grants (e.g. those administered by US government departments other than the
US Department of the Interior) are not presented comprehensively in either the budget documents or
the annual financial statements, and these are estimated by officials to be significant. ROC’s
contribution to RMI’s Trust Fund is also not shown (e.g. in FY11). A key reason for the lack of
inclusion of grant-financed data in fiscal documents is the difficulty in obtaining relevant information
on likely disbursements.
25 Data are taken from FY10 annual audited accounts. Total expenditures are for central government (GRMI) and include all governmental funds. 26 The omission of the fiscal activity of these funds is noted in notes to the annual financial statements 27 In the RMI context, autonomous government agencies include state-owned organizations with either a non-commercial or a commercial remit. Despite
concerted attempts to do so, it was not possible to separate the two groups distinctly, but the inclusion of the latter group does not affect the score of this
dimension.
Republic of the Marshall Islands – PEFA Public Financial Management Performance Report Page 15
Indicator (M1) Score Brief Explanation
PI-7. Extent of unreported
government operations
D
(i) Level of unreported extra-
budgetary expenditure
D There are significant extra-budgetary funds which are
not reported in some of the fiscal documents
(specifically, the Budget document). These non-
reported amounts are estimated to be greater than 10%
of total central government expenditures.
(ii) Income/expenditure
information on donor-funded
projects
D Comprehensive information on loan-funded external
assistance is not included in some fiscal information.
Specifically, during the past 3 years, GRMI has signed one
loan agreement with a single disbursement in FY10, but this
was not included in the Appropriation Act.
PI-8: Inter-governmental fiscal relations
Article IX of the Constitution specifies one level of sub-national government, local government.
There are 24 local governments, covering the 5 islands and 28 atolls28, each headed by a Mayor who
is accountable to an elected Council. These local governments are regulated by the Local
Government Act (1980), contained in Title 4 of the MIRC, which establishes the legal status of local
governments, and sets out the requirements for local government Constitutions, including their
arrangements for budget and accounts, arrangements for elections, grants to local governments, and
relations with central government. Chapters 2 and 3 of Title 4 of the MIRC contain legislation on
taxes and other revenue matters for local governments.
(i) Transparency and objectivity in the horizontal allocation among sub national governments
Central government provides significant amounts of funding to local governments in the form of
transfers. There is wide variation among the LGs, with some relying almost completely on CG
transfers and others having significant alternative sources of funds, such as the trust funds from the
Nuclear Claims Tribunal. In the absence of auditable accounts for many local governments, it was
not possible to get comprehensive information on local revenue sources, and figures on the share of
total local government revenues represented by central government transfers were not available.
The assessment of this indicator includes both domestic resources and those from ROC which are
provided to central government and on-granted by central government to local governments, but not
funding provided by external sources for specific purposes, e.g. USDA Special Feeding Program,
which may be considered to be donor aid projects whose allocations are specified by the relevant
donor agency rather than by central government.
The transfers made by central government to local government include:
Local Government Fund (LGF) = single fund separate from the General Fund to deposit
central government resources for local governments; considered under the Act to be the
primary channel for providing central government grants to local governments. The
allocation among LGs is made, for one part, on an equal fixed amount for each local
government, and for the other part, on an equal per capita (population) amount for each local
government. In terms of the transparency and rules-based nature of central government
transfers to local governments, the amounts to be allocated to each local government and the
criteria (rules-basis) on which these are based (i.e. the fixed amount per LG and the per capita
amount for each LG) are set out in a CM.
Grant-in-aid (GIA) = program of matching grants to local governments for “development
and public” projects. It is administered by the Ministry of Internal Affairs. The maximum
28 Not all atolls are inhabited, so some atolls share a local government.
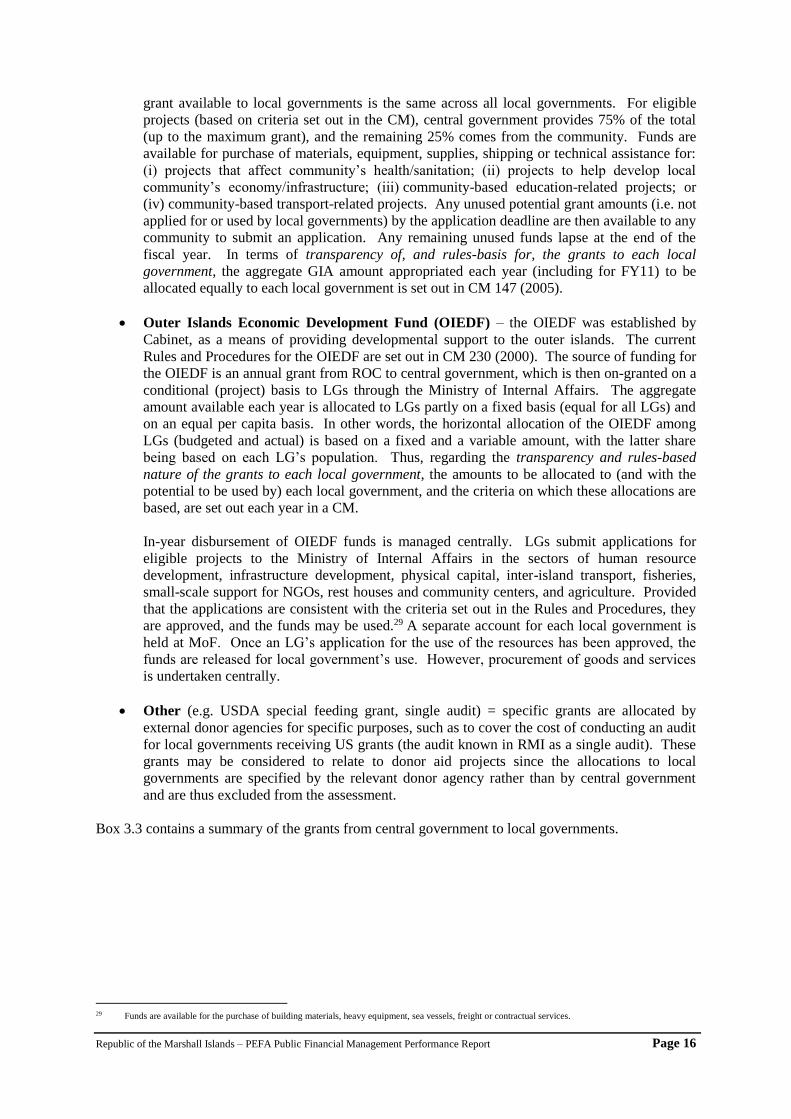
Republic of the Marshall Islands – PEFA Public Financial Management Performance Report Page 16
grant available to local governments is the same across all local governments. For eligible
projects (based on criteria set out in the CM), central government provides 75% of the total
(up to the maximum grant), and the remaining 25% comes from the community. Funds are
available for purchase of materials, equipment, supplies, shipping or technical assistance for:
(i) projects that affect community’s health/sanitation; (ii) projects to help develop local
community’s economy/infrastructure; (iii) community-based education-related projects; or
(iv) community-based transport-related projects. Any unused potential grant amounts (i.e. not
applied for or used by local governments) by the application deadline are then available to any
community to submit an application. Any remaining unused funds lapse at the end of the
fiscal year. In terms of transparency of, and rules-basis for, the grants to each local
government, the aggregate GIA amount appropriated each year (including for FY11) to be
allocated equally to each local government is set out in CM 147 (2005).
Outer Islands Economic Development Fund (OIEDF) – the OIEDF was established by
Cabinet, as a means of providing developmental support to the outer islands. The current
Rules and Procedures for the OIEDF are set out in CM 230 (2000). The source of funding for
the OIEDF is an annual grant from ROC to central government, which is then on-granted on a
conditional (project) basis to LGs through the Ministry of Internal Affairs. The aggregate
amount available each year is allocated to LGs partly on a fixed basis (equal for all LGs) and
on an equal per capita basis. In other words, the horizontal allocation of the OIEDF among
LGs (budgeted and actual) is based on a fixed and a variable amount, with the latter share
being based on each LG’s population. Thus, regarding the transparency and rules-based
nature of the grants to each local government, the amounts to be allocated to (and with the
potential to be used by) each local government, and the criteria on which these allocations are
based, are set out each year in a CM.
In-year disbursement of OIEDF funds is managed centrally. LGs submit applications for
eligible projects to the Ministry of Internal Affairs in the sectors of human resource
development, infrastructure development, physical capital, inter-island transport, fisheries,
small-scale support for NGOs, rest houses and community centers, and agriculture. Provided
that the applications are consistent with the criteria set out in the Rules and Procedures, they
are approved, and the funds may be used.29 A separate account for each local government is
held at MoF. Once an LG’s application for the use of the resources has been approved, the
funds are released for local government’s use. However, procurement of goods and services
is undertaken centrally.
Other (e.g. USDA special feeding grant, single audit) = specific grants are allocated by
external donor agencies for specific purposes, such as to cover the cost of conducting an audit
for local governments receiving US grants (the audit known in RMI as a single audit). These
grants may be considered to relate to donor aid projects since the allocations to local
governments are specified by the relevant donor agency rather than by central government
and are thus excluded from the assessment.
Box 3.3 contains a summary of the grants from central government to local governments.
29 Funds are available for the purchase of building materials, heavy equipment, sea vessels, freight or contractual services.
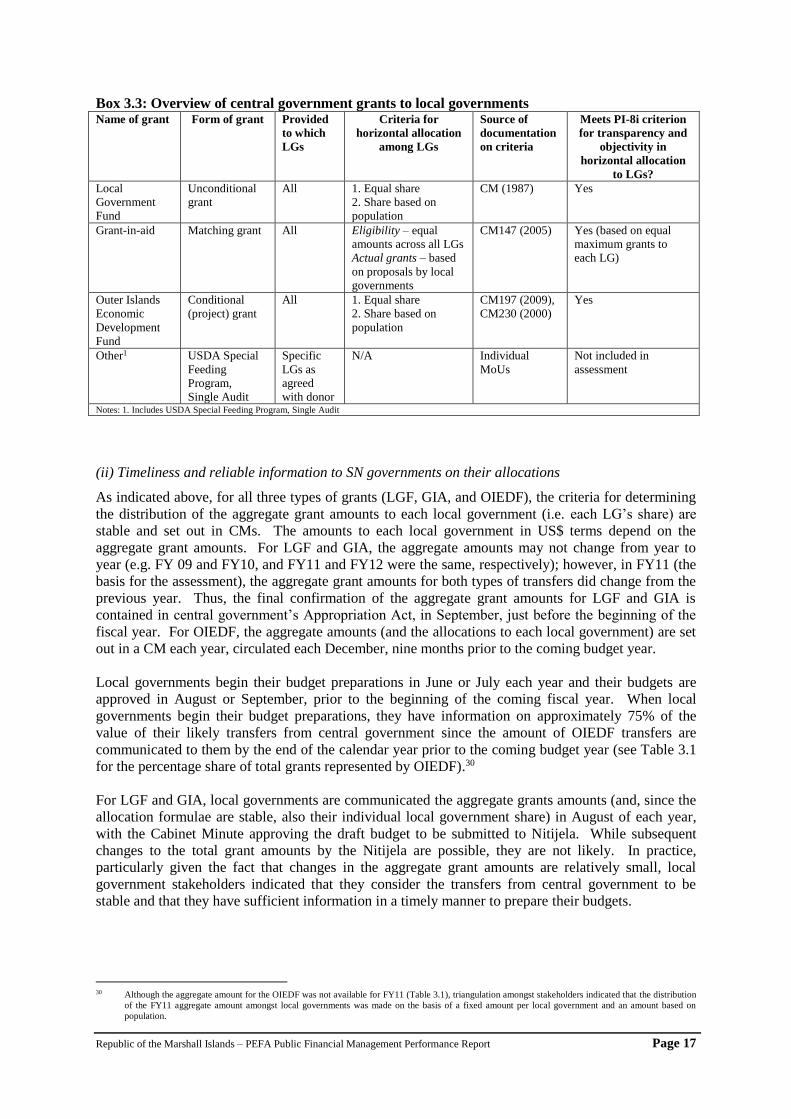
Republic of the Marshall Islands – PEFA Public Financial Management Performance Report Page 17
Box 3.3: Overview of central government grants to local governments Name of grant Form of grant Provided
to which
LGs
Criteria for
horizontal allocation
among LGs
Source of
documentation
on criteria
Meets PI-8i criterion
for transparency and
objectivity in
horizontal allocation
to LGs?
Local
Government
Fund
Unconditional
grant
All 1. Equal share
2. Share based on
population
CM (1987) Yes
Grant-in-aid Matching grant All Eligibility – equal
amounts across all LGs
Actual grants – based
on proposals by local
governments
CM147 (2005) Yes (based on equal
maximum grants to
each LG)
Outer Islands
Economic
Development
Fund
Conditional
(project) grant
All 1. Equal share
2. Share based on
population
CM197 (2009),
CM230 (2000)
Yes
Other1 USDA Special
Feeding
Program,
Single Audit
Specific
LGs as
agreed
with donor
N/A Individual
MoUs
Not included in
assessment
Notes: 1. Includes USDA Special Feeding Program, Single Audit
(ii) Timeliness and reliable information to SN governments on their allocations
As indicated above, for all three types of grants (LGF, GIA, and OIEDF), the criteria for determining
the distribution of the aggregate grant amounts to each local government (i.e. each LG’s share) are
stable and set out in CMs. The amounts to each local government in US$ terms depend on the
aggregate grant amounts. For LGF and GIA, the aggregate amounts may not change from year to
year (e.g. FY 09 and FY10, and FY11 and FY12 were the same, respectively); however, in FY11 (the
basis for the assessment), the aggregate grant amounts for both types of transfers did change from the
previous year. Thus, the final confirmation of the aggregate grant amounts for LGF and GIA is
contained in central government’s Appropriation Act, in September, just before the beginning of the
fiscal year. For OIEDF, the aggregate amounts (and the allocations to each local government) are set
out in a CM each year, circulated each December, nine months prior to the coming budget year.
Local governments begin their budget preparations in June or July each year and their budgets are
approved in August or September, prior to the beginning of the coming fiscal year. When local
governments begin their budget preparations, they have information on approximately 75% of the
value of their likely transfers from central government since the amount of OIEDF transfers are
communicated to them by the end of the calendar year prior to the coming budget year (see Table 3.1
for the percentage share of total grants represented by OIEDF).30
For LGF and GIA, local governments are communicated the aggregate grants amounts (and, since the
allocation formulae are stable, also their individual local government share) in August of each year,
with the Cabinet Minute approving the draft budget to be submitted to Nitijela. While subsequent
changes to the total grant amounts by the Nitijela are possible, they are not likely. In practice,
particularly given the fact that changes in the aggregate grant amounts are relatively small, local
government stakeholders indicated that they consider the transfers from central government to be
stable and that they have sufficient information in a timely manner to prepare their budgets.
30 Although the aggregate amount for the OIEDF was not available for FY11 (Table 3.1), triangulation amongst stakeholders indicated that the distribution
of the FY11 aggregate amount amongst local governments was made on the basis of a fixed amount per local government and an amount based on
population.
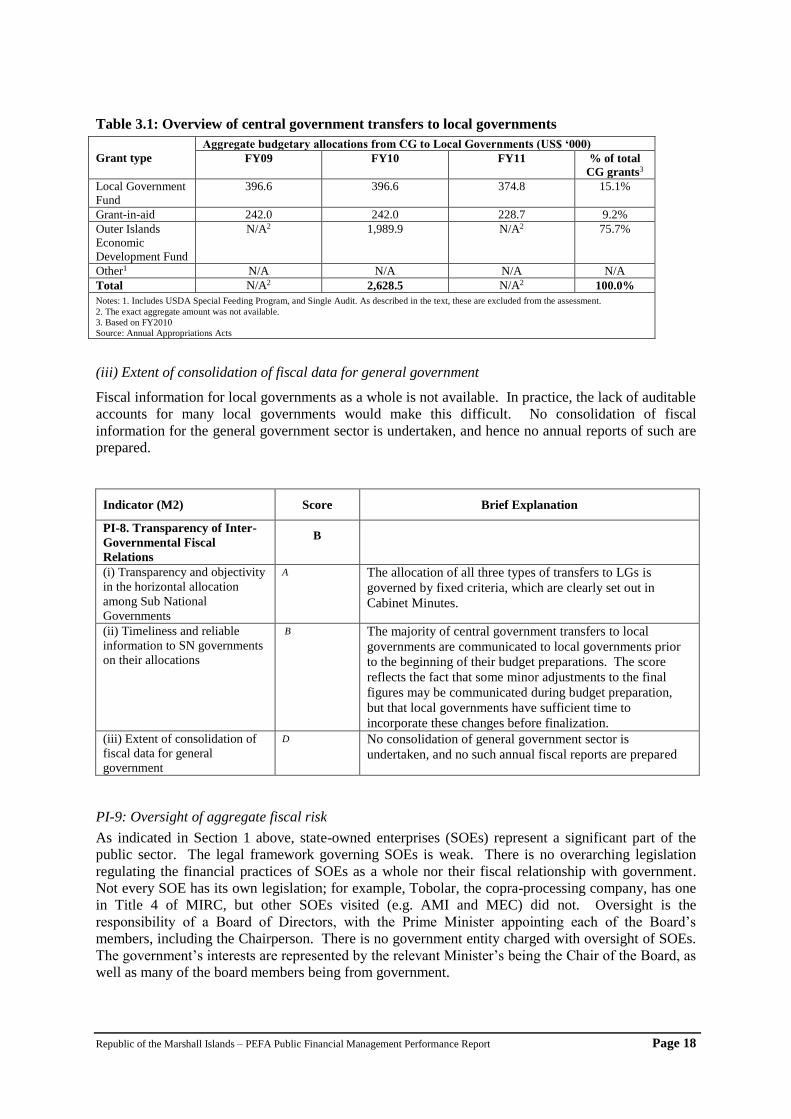
Republic of the Marshall Islands – PEFA Public Financial Management Performance Report Page 18
Table 3.1: Overview of central government transfers to local governments
Grant type
Aggregate budgetary allocations from CG to Local Governments (US$ ‘000)
FY09 FY10 FY11 % of total
CG grants3
Local Government
Fund
396.6 396.6 374.8 15.1%
Grant-in-aid 242.0 242.0 228.7 9.2%
Outer Islands
Economic
Development Fund
N/A2 1,989.9 N/A2 75.7%
Other1 N/A N/A N/A N/A
Total N/A2 2,628.5 N/A2 100.0%
Notes: 1. Includes USDA Special Feeding Program, and Single Audit. As described in the text, these are excluded from the assessment.
2. The exact aggregate amount was not available.
3. Based on FY2010
Source: Annual Appropriations Acts
(iii) Extent of consolidation of fiscal data for general government
Fiscal information for local governments as a whole is not available. In practice, the lack of auditable
accounts for many local governments would make this difficult. No consolidation of fiscal
information for the general government sector is undertaken, and hence no annual reports of such are
prepared.
Indicator (M2) Score Brief Explanation
PI-8. Transparency of Inter-
Governmental Fiscal
Relations
B
(i) Transparency and objectivity
in the horizontal allocation
among Sub National
Governments
A The allocation of all three types of transfers to LGs is
governed by fixed criteria, which are clearly set out in
Cabinet Minutes.
(ii) Timeliness and reliable
information to SN governments
on their allocations
B The majority of central government transfers to local
governments are communicated to local governments prior
to the beginning of their budget preparations. The score
reflects the fact that some minor adjustments to the final
figures may be communicated during budget preparation,
but that local governments have sufficient time to
incorporate these changes before finalization.
(iii) Extent of consolidation of
fiscal data for general
government
D No consolidation of general government sector is
undertaken, and no such annual fiscal reports are prepared
PI-9: Oversight of aggregate fiscal risk
As indicated in Section 1 above, state-owned enterprises (SOEs) represent a significant part of the
public sector. The legal framework governing SOEs is weak. There is no overarching legislation
regulating the financial practices of SOEs as a whole nor their fiscal relationship with government.
Not every SOE has its own legislation; for example, Tobolar, the copra-processing company, has one
in Title 4 of MIRC, but other SOEs visited (e.g. AMI and MEC) did not. Oversight is the
responsibility of a Board of Directors, with the Prime Minister appointing each of the Board’s
members, including the Chairperson. There is no government entity charged with oversight of SOEs.
The government’s interests are represented by the relevant Minister’s being the Chair of the Board, as
well as many of the board members being from government.
Republic of the Marshall Islands – PEFA Public Financial Management Performance Report Page 19
(i) Extent of central government monitoring of AGAs and PEs
There is no statutory body with oversight authority for the agencies managing the extra-budgetary
funds (e.g. MISSA), and no systematic process to identify risks associated with these agencies or to
monitor follow-up actions in order to ensure appropriate accountability to central government.
In the absence of relevant legislation, there are no statutory reporting requirements. Strategic plans,
operational and business plans are not required to be prepared as a matter of routine, and most
autonomous government agencies (AGAs) do not prepare them. At least one AGA has prepared a
preliminary strategic plan but this plan was not officially endorsed by the Board.
End-of-year reporting by AGAs consist of annual financial statements and annual reports. These are
submitted to the relevant AGA’s Board but they are not lodged with the Ministry or Finance or other
government body. The annual financial statements are audited and are sent to the Nitijela but not to
central government.
As part of their budget submissions, AGAs who request subsidies are requested to include their most
recent annual reports. In the FY12 budget process, fewer than 10 AGAs provided their annual reports
to MoF, representing less than 40% (by number) of all AGAs.31 At the same time, the objective of
submitting these reports is to inform MoF’s analysis to recommend (or not) budgetary subsidies as
part of the draft budget to the Nitijela, rather than on-going monitoring of AGAs’ overall fiscal risk.
Thus, in practice, there is very limited oversight of the fiscal risk posed by AGAs, although such risks
may be significant. While the government provides substantial subsidies to some AGAs, no reports of
fiscal risk represented by AGAs (including agencies managing extra-budgetary funds) are prepared.
Recently, Cabinet approved a list of six principles covering proposed regulations for AGAs, which is
being reviewed with a view to forming the basis for overarching SOE legislation.
(ii) Extent of central government monitoring of SN governments’ fiscal position
There is little systematic central government oversight of local government fiscal risk. The Ministry
of Internal Affairs is the central government agency responsible for local government. According to
the Act, its role is limited primarily to co-ordination. The Ministry of Finance does not have a
statutory or explicitly-mandated role vis-à-vis local governments, despite the fact that the former
provides the majority of funding for some (but not all) local governments and that local governments
have the potential to generate fiscal risk for central government. According to the Local Government
Act, local governments are allowed to borrow with the approval of the Councils but without recourse
to a review of debt sustainability. Local governments are not required to inform the Ministry of
Finance or the Ministry of Internal Affairs. Central government does not compile fiscal information
on local governments, and no fiscal reports on the local government sector, annual or otherwise, are
prepared. Local governments are not required (and do not do so, in practice) to forward their fiscal
information (e.g. on budgeted and actual revenues and expenditures) to central government. Thus, in
practice, central government does not monitor local governments’ fiscal position.
31 In RMI, AGAs refer both to commercially-oriented entities (e.g. MEC) as well as to those with less of a commercial orientation (e.g. the Marshall
Islands Visitors Authority).

Republic of the Marshall Islands – PEFA Public Financial Management Performance Report Page 20
Indicator (M1) Score Brief Explanation
PI-9. Oversight of aggregate
fiscal risk from other public
sector entities.
D
(i) Extent of central government
monitoring of AGAs/PEs
D No central government entity, including the MoF,
systematically receives Annual Financial Statements or
Annual Reports from the majority of AGAs, nor does any
entity prepare a report on the associated fiscal risk.
(ii) Extent of central
government monitoring of SN
governments’ fiscal position
D No central GRMI entity actively monitors the fiscal position
of local governments, who potentially may generate fiscal
risk for central government (through their ability to borrow).
GRMI does not produce any analytical or other reports on
fiscal risk from LGs.
PI-10: Public access to fiscal information
Access to timely, accurate, comprehensive and useful information on a country’s fiscal activities helps
ensure accountability of the government to its population.
While some fiscal documents (e.g. the budget and audited annual financial statements) are in theory
available from government staff on request32, none of the documents listed are systematically made
available to the public (i.e. such that a member of the public may obtain the document independently
of interacting with government staff). None of the documents are available to purchase, nor are they
posted in a public space (e.g. the Post Office, library, or a notice board in the Nitijela building).
Neither the Ministry of Finance nor the Auditor-General’s Office has a website. The Ministry of
Finance has indicated that it plans to establish a website in the near future.
None of the key central government entities, such as the Ministry of Finance or the Office of the
Auditor-General, operates a website, although both have indicated that they intend to establish one in
the near future. The Nitijela does have a website, with downloadable information, including audit
reports, from the sub-section operated by the Public Accounts Committee (PAC), but it is not up-to-
date (the most recent audit report on the site was posted in 2008).
The status of fiscal information available to the public is summarized in Box 3.4. In practice,
however, for those outside of Majuro, particularly those on the Outer Islands, public access to fiscal
information (even on request) is minimal.
32 Testing this would require assessing the extent to which an ordinary member of the public has access in practice (including likely obstacles); however, in
general, there was reportedly insufficient demand (such requests) for such documents so by default it was not possible for the team to conclude that
public access was provided in practice.
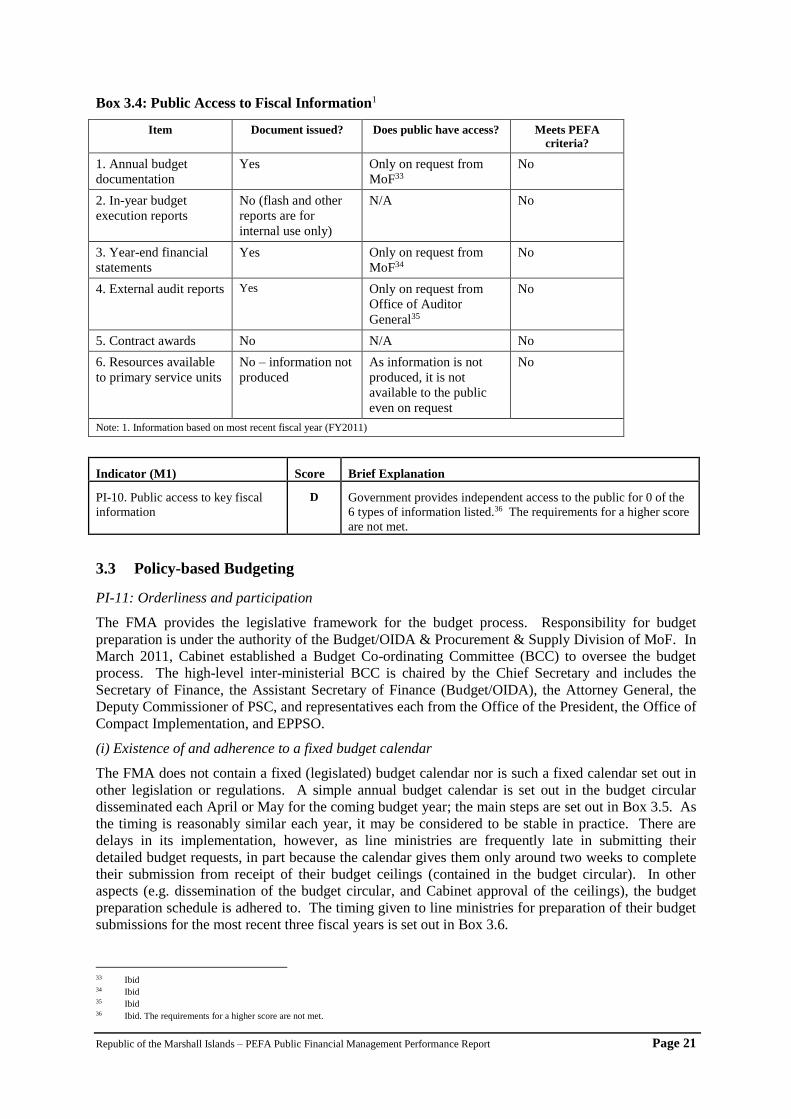
Republic of the Marshall Islands – PEFA Public Financial Management Performance Report Page 21
Box 3.4: Public Access to Fiscal Information1
Item Document issued? Does public have access? Meets PEFA
criteria?
1. Annual budget
documentation
Yes Only on request from
MoF33
No
2. In-year budget
execution reports
No (flash and other
reports are for
internal use only)
N/A No
3. Year-end financial
statements
Yes Only on request from
MoF34
No
4. External audit reports Yes Only on request from
Office of Auditor
General35
No
5. Contract awards No N/A No
6. Resources available
to primary service units
No – information not
produced
As information is not
produced, it is not
available to the public
even on request
No
Note: 1. Information based on most recent fiscal year (FY2011)
Indicator (M1) Score Brief Explanation
PI-10. Public access to key fiscal
information
D Government provides independent access to the public for 0 of the
6 types of information listed.36 The requirements for a higher score
are not met.
3.3 Policy-based Budgeting
PI-11: Orderliness and participation
The FMA provides the legislative framework for the budget process. Responsibility for budget
preparation is under the authority of the Budget/OIDA & Procurement & Supply Division of MoF. In
March 2011, Cabinet established a Budget Co-ordinating Committee (BCC) to oversee the budget
process. The high-level inter-ministerial BCC is chaired by the Chief Secretary and includes the
Secretary of Finance, the Assistant Secretary of Finance (Budget/OIDA), the Attorney General, the
Deputy Commissioner of PSC, and representatives each from the Office of the President, the Office of
Compact Implementation, and EPPSO.
(i) Existence of and adherence to a fixed budget calendar
The FMA does not contain a fixed (legislated) budget calendar nor is such a fixed calendar set out in
other legislation or regulations. A simple annual budget calendar is set out in the budget circular
disseminated each April or May for the coming budget year; the main steps are set out in Box 3.5. As
the timing is reasonably similar each year, it may be considered to be stable in practice. There are
delays in its implementation, however, as line ministries are frequently late in submitting their
detailed budget requests, in part because the calendar gives them only around two weeks to complete
their submission from receipt of their budget ceilings (contained in the budget circular). In other
aspects (e.g. dissemination of the budget circular, and Cabinet approval of the ceilings), the budget
preparation schedule is adhered to. The timing given to line ministries for preparation of their budget
submissions for the most recent three fiscal years is set out in Box 3.6.
33 Ibid 34 Ibid 35 Ibid 36 Ibid. The requirements for a higher score are not met.
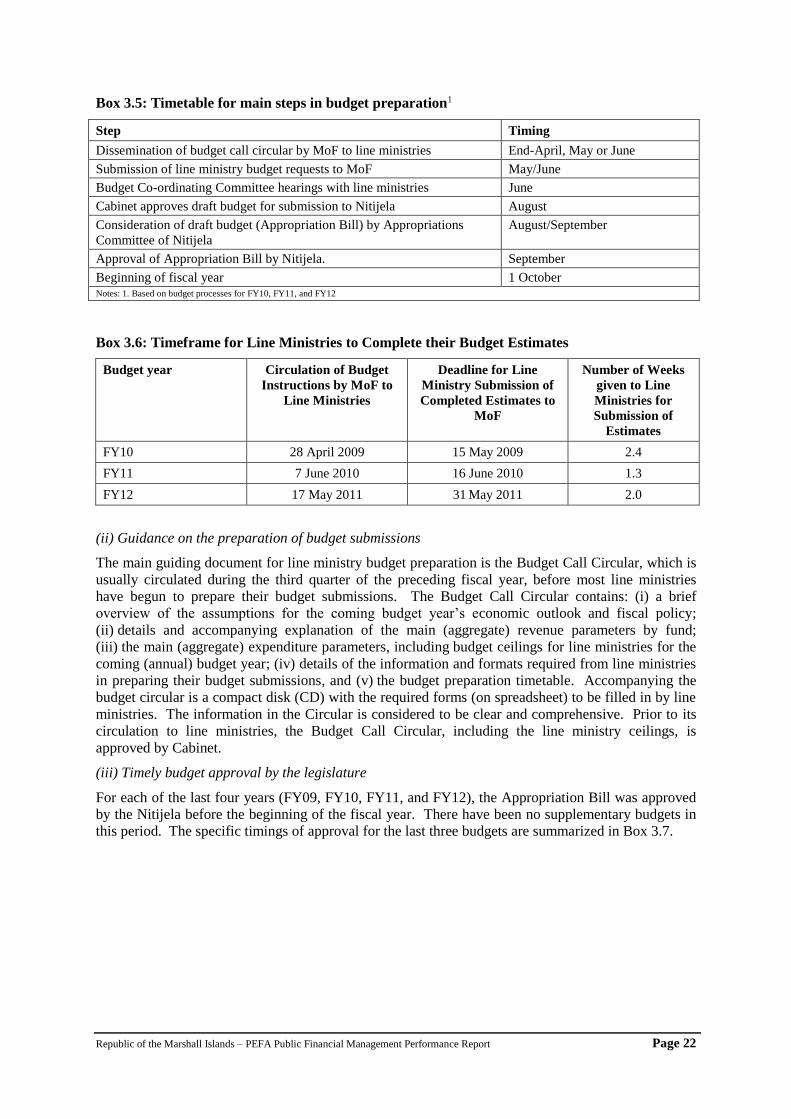
Republic of the Marshall Islands – PEFA Public Financial Management Performance Report Page 22
Box 3.5: Timetable for main steps in budget preparation1
Step Timing
Dissemination of budget call circular by MoF to line ministries End-April, May or June
Submission of line ministry budget requests to MoF May/June
Budget Co-ordinating Committee hearings with line ministries June
Cabinet approves draft budget for submission to Nitijela August
Consideration of draft budget (Appropriation Bill) by Appropriations
Committee of Nitijela
August/September
Approval of Appropriation Bill by Nitijela. September
Beginning of fiscal year 1 October Notes: 1. Based on budget processes for FY10, FY11, and FY12
Box 3.6: Timeframe for Line Ministries to Complete their Budget Estimates
Budget year Circulation of Budget
Instructions by MoF to
Line Ministries
Deadline for Line
Ministry Submission of
Completed Estimates to
MoF
Number of Weeks
given to Line
Ministries for
Submission of
Estimates
FY10 28 April 2009 15 May 2009 2.4
FY11 7 June 2010 16 June 2010 1.3
FY12 17 May 2011 31 May 2011 2.0
(ii) Guidance on the preparation of budget submissions
The main guiding document for line ministry budget preparation is the Budget Call Circular, which is
usually circulated during the third quarter of the preceding fiscal year, before most line ministries
have begun to prepare their budget submissions. The Budget Call Circular contains: (i) a brief
overview of the assumptions for the coming budget year’s economic outlook and fiscal policy;
(ii) details and accompanying explanation of the main (aggregate) revenue parameters by fund;
(iii) the main (aggregate) expenditure parameters, including budget ceilings for line ministries for the
coming (annual) budget year; (iv) details of the information and formats required from line ministries
in preparing their budget submissions, and (v) the budget preparation timetable. Accompanying the
budget circular is a compact disk (CD) with the required forms (on spreadsheet) to be filled in by line
ministries. The information in the Circular is considered to be clear and comprehensive. Prior to its
circulation to line ministries, the Budget Call Circular, including the line ministry ceilings, is
approved by Cabinet.
(iii) Timely budget approval by the legislature
For each of the last four years (FY09, FY10, FY11, and FY12), the Appropriation Bill was approved
by the Nitijela before the beginning of the fiscal year. There have been no supplementary budgets in
this period. The specific timings of approval for the last three budgets are summarized in Box 3.7.

Republic of the Marshall Islands – PEFA Public Financial Management Performance Report Page 23
Box 3.7: Approval of Appropriation Bill, FY09-FY12
Fiscal year Date of Parliamentary (Nitijela)
approval2
FY09 29 September 2008
FY10 21 September 2009
FY11 22 September 2010
FY12 29 September 2011
1. The dates shown indicate when the Bill became an Act (i.e. with the signature of the Speaker of the Nitijela).
Source: MoF
Indicator (M2) Score Brief Explanation
C(i) Policy-Based Budgeting
PI-11. Orderliness and
participation in the annual
budget process
B+
(i) Existence of, and
adherence to, a fixed budget
calendar
C The FMA or other legislation/regulations does not contain a fixed
budget calendar. The annual budget calendar is set out in the
budget circular disseminated in April or May of each year. It does
not give LMs sufficient time to complete their budget estimates on
time, leading to delays in the calendar’s implementation.
(ii) Guidance on the
preparation of budget
submissions
A The budget circular is clear and comprehensive, and it contains
ceilings for LMs for the coming budget year. These are approved
by Cabinet before the budget circular (with ceilings) is
disseminated to line ministries.
(iii) timely budget approval
by the legislature
A The Appropriations Bill has been passed by the legislature before
the beginning of the new fiscal year in each of the last 3 years
PI-12: Multi-year perspective
(i) Multi-year fiscal forecasts and functional allocation
GRMI prepares two sets of outputs containing notional medium-term fiscal information, both of
which are prepared to comply with the requirements of the Compact of Free Association with the US
(as amended in 2003). The first is called a rolling Medium Term Budget and Investment Framework
(MTBIF), and it is prepared by the Economic Policy, Planning and Statistics Office (EPPSO) under
the Office of the President. The MTBIF comprises a 5-year budget and investment cycle, covering
the previous fiscal year, the current fiscal year, the proposed budget year plus two forward fiscal
years.37 The estimates are shown by line ministry and fund source (e.g. General Fund, Compact
funding, US Federal funds). An overview of the MTBIF is contained in the MTBIF Policy
Framework Paper.
However, in reality, the MTBIF is not used and does not form part of the budget process (annual or
otherwise); consultations with stakeholders indicated that the MTBIF has no link with the annual
budget. The MTBIF is revised after, not before, each stage of the budget process (e.g. approved
budget) to reflect the agreed budget parameters, and thus it effectively involves filling in a spreadsheet
ex post with the updated budget data.38 The MTBIF is not approved by Cabinet, and it does not guide
the budget process. The “forward estimates” shown for the coming two years in the MTBIF Policy
37 See Compact of Free Association Amendments Act of 2003 between the governments of the US and the Marshall Islands. 38 However, it is not clear that it is updated in a timely fashion, as the PEFA team were provided the MTBIF for FY08-12 (effectively, relating to the
budget year FY10), prepared in August 2009.
Republic of the Marshall Islands – PEFA Public Financial Management Performance Report Page 24
Framework Paper are identical to the proposed budget year (i.e. in the FY08-FY12 MTBIF39, the
aggregate fiscal parameters for FY10, 11 and 12 are identical).40
The second set of outputs containing medium-term fiscal information is the performance-related
budget statement, known as a portfolio budget, prepared by those ministries receiving Compact grants
(Ministries of Health, Education, PMU Office within the Ministry of Public Works, and the
Environmental Protection Agency). These portfolio budgets, prepared in line with the requirements
of the Compact agreement, contain performance information for the relevant ministries, including its
goals, a breakdown of the overall budget by output (and, within output, by fund and economic item),
an explanation of the priority activities to be funded for each output, and the likely impact of these
activities. However, they do not include forward expenditure estimates. While the portfolio budgets
are provided to the Nitijela (including to the Appropriation Committee), as information during the
budget scrutiny process, they are not considered systematically by the Committee as part of its review
of the budget.
Thus, in practice, GRMI operates an annual, rather than a multi-year, budget process, and no forward
estimates of fiscal aggregates for any category of expenditure classification are prepared.
(ii) Scope and frequency of debt sustainability analysis
No analyses of debt sustainability have been undertaken, either by government or by an external
partner, in the last 3 years. During FY12, MoF has committed to working with external partners to
address the issue of debt sustainability in more detail.
(iii) Existence of costed sector strategies
Updated 3-year rolling plans are available only for the Ministry of Education and the Environmental
Protection Agency. Neither has been fully costed, with estimates given only for the coming budget
year and within the budget ceiling as part of the budget process. Thus, in practice, there are no sector
or ministerial medium-term strategy documents which reflect complete costings for recurrent and
investment expenditures.
(iv) Linkages between investment budgets and forward expenditure estimates
In practice, the processes for preparing recurrent and capital (investment) budgets are separate.
Ministerial responsibilities for planning and managing capital expenditures are split between the
Ministry of Works, which is responsible for construction and maintenance for all of central
government and the line ministries themselves (e.g. the Ministry of Health), which are responsible for
the procurement of goods and services and routine maintenance.
In practice, in the absence of a medium-term focus for the budget process and of a mechanism to
calculate forward costs, the impact of likely future recurrent costs of investment projects is not
factored into future line ministry budgets.
39 The most recent one available to the assessment team. 40 In other words, as the MTBIF does not, in practice, comprise meaningful forward estimates as part of the wider budget process, it is not considered
applicable to this dimension.
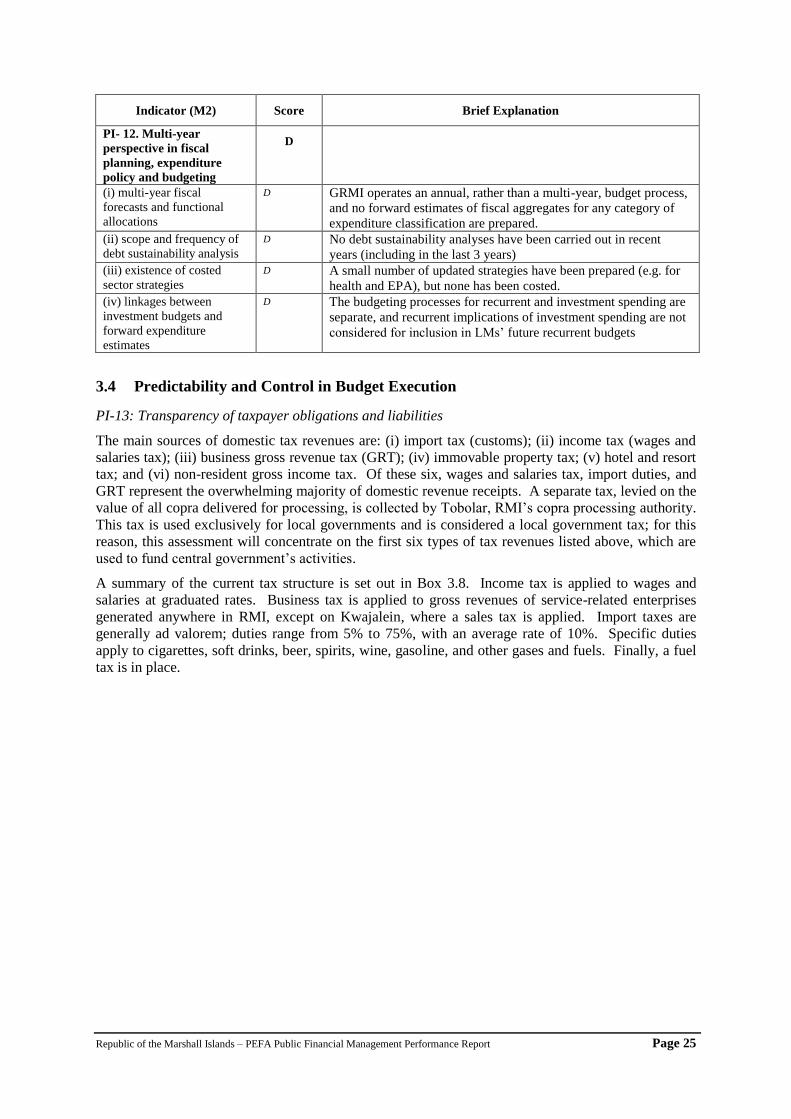
Republic of the Marshall Islands – PEFA Public Financial Management Performance Report Page 25
Indicator (M2) Score Brief Explanation
PI- 12. Multi-year
perspective in fiscal
planning, expenditure
policy and budgeting
D
(i) multi-year fiscal
forecasts and functional
allocations
D GRMI operates an annual, rather than a multi-year, budget process,
and no forward estimates of fiscal aggregates for any category of
expenditure classification are prepared.
(ii) scope and frequency of
debt sustainability analysis
D No debt sustainability analyses have been carried out in recent
years (including in the last 3 years)
(iii) existence of costed
sector strategies
D A small number of updated strategies have been prepared (e.g. for
health and EPA), but none has been costed.
(iv) linkages between
investment budgets and
forward expenditure
estimates
D The budgeting processes for recurrent and investment spending are
separate, and recurrent implications of investment spending are not
considered for inclusion in LMs’ future recurrent budgets
3.4 Predictability and Control in Budget Execution
PI-13: Transparency of taxpayer obligations and liabilities
The main sources of domestic tax revenues are: (i) import tax (customs); (ii) income tax (wages and
salaries tax); (iii) business gross revenue tax (GRT); (iv) immovable property tax; (v) hotel and resort
tax; and (vi) non-resident gross income tax. Of these six, wages and salaries tax, import duties, and
GRT represent the overwhelming majority of domestic revenue receipts. A separate tax, levied on the
value of all copra delivered for processing, is collected by Tobolar, RMI’s copra processing authority.
This tax is used exclusively for local governments and is considered a local government tax; for this
reason, this assessment will concentrate on the first six types of tax revenues listed above, which are
used to fund central government’s activities.
A summary of the current tax structure is set out in Box 3.8. Income tax is applied to wages and
salaries at graduated rates. Business tax is applied to gross revenues of service-related enterprises
generated anywhere in RMI, except on Kwajalein, where a sales tax is applied. Import taxes are
generally ad valorem; duties range from 5% to 75%, with an average rate of 10%. Specific duties
apply to cigarettes, soft drinks, beer, spirits, wine, gasoline, and other gases and fuels. Finally, a fuel
tax is in place.
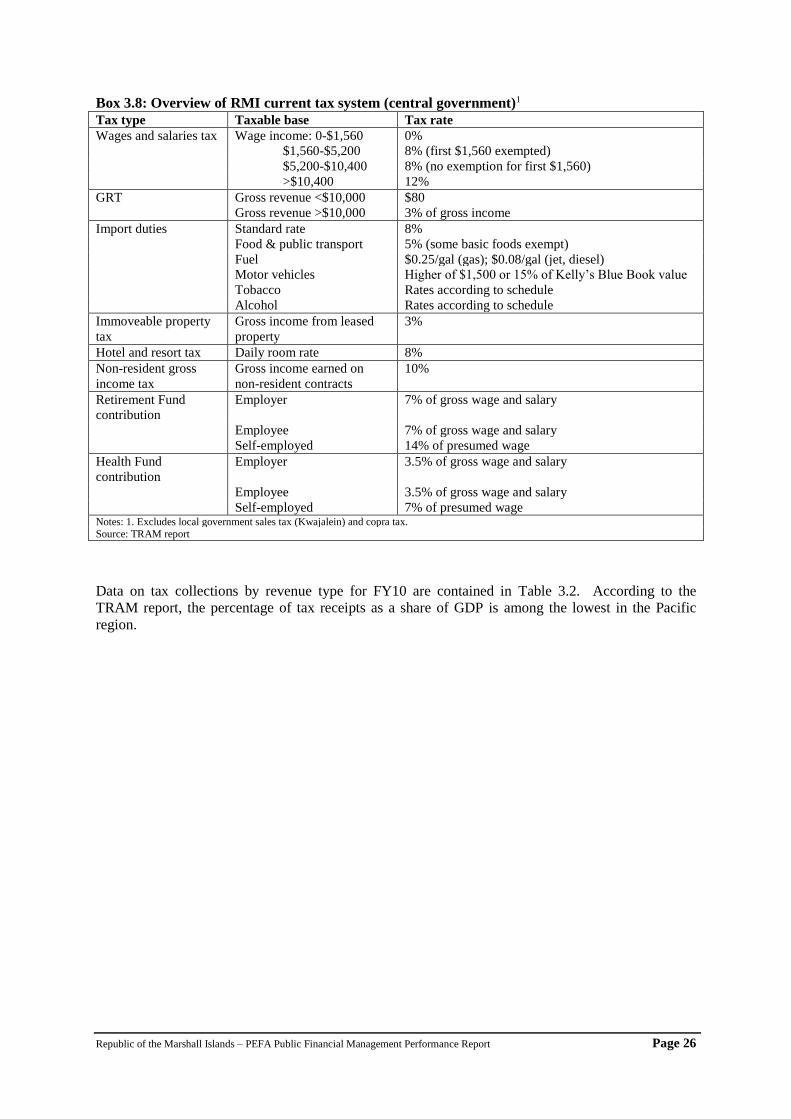
Republic of the Marshall Islands – PEFA Public Financial Management Performance Report Page 26
Box 3.8: Overview of RMI current tax system (central government)1
Tax type Taxable base Tax rate
Wages and salaries tax Wage income: 0-$1,560 0%
$1,560-$5,200 8% (first $1,560 exempted)
$5,200-$10,400 8% (no exemption for first $1,560)
>$10,400 12%
GRT Gross revenue <$10,000 $80
Gross revenue >$10,000 3% of gross income
Import duties Standard rate 8%
Food & public transport 5% (some basic foods exempt)
Fuel $0.25/gal (gas); $0.08/gal (jet, diesel)
Motor vehicles Higher of $1,500 or 15% of Kelly’s Blue Book value
Tobacco Rates according to schedule
Alcohol Rates according to schedule
Immoveable property
tax
Gross income from leased
property
3%
Hotel and resort tax Daily room rate 8%
Non-resident gross
income tax
Gross income earned on
non-resident contracts
10%
Retirement Fund
contribution
Employer 7% of gross wage and salary
Employee 7% of gross wage and salary
Self-employed 14% of presumed wage
Health Fund
contribution
Employer 3.5% of gross wage and salary
Employee 3.5% of gross wage and salary
Self-employed 7% of presumed wage Notes: 1. Excludes local government sales tax (Kwajalein) and copra tax. Source: TRAM report
Data on tax collections by revenue type for FY10 are contained in Table 3.2. According to the
TRAM report, the percentage of tax receipts as a share of GDP is among the lowest in the Pacific
region.

Republic of the Marshall Islands – PEFA Public Financial Management Performance Report Page 27
Table 3.2: Overview of types of tax revenues collected by central government
Tax revenue receipts
(FY10)
US$’000
As % of total
Wages and salaries tax (income tax) 10,812 42.8% Customs duties 7,722 30.6% Business Gross Revenue Tax (GRT) 5,682 22.5% Immovable Property Tax 242 1.0% Hotel and Resort Tax 70 0.3% Non-resident Gross Income Tax 99 0.4% Other1 617 2.4% Total Taxes 25,243 100.0%
Above taxes as % of GDP 15.5%
Total domestic revenue receipts as % of GDP3 24.7% 1. Data exclude receipts from MISSA withholding tax and copra tax. 2. Includes non-resident workers’ fees (penalty & interest), and tax audit adjustment
3. Data are from IMF and include all sources of domestic revenues.
Source: MoF
The most recent IMF Article IV report41 indicates that some immediate steps have been taken to
improve tax collection, but that the current tax structure is now considered to be largely outdated. A
full review of the tax system is scheduled for 2012, and tax reforms are planned from the latter part of
the current fiscal year (FY12).
(i) Clarity and comprehensiveness of tax liabilities
Legislation covering RMI tax liabilities and procedures for the taxes listed in Box 3.8 above are set
out in the Taxation Act (MIRC Title 48), the Social Security Act (MIRC Title 49), the Health Fund
Act (MIRC Title 7), and the Copra Tax Act (MIRC Title 4), (see Box 3.9). There are no
supplementary procedures documented. Responsibility for tax administration for the main types of
taxes42 is under the authority of the Revenue & Taxation, Customs and Treasury Division of MoF.
The assessment of this indicator focuses on the two main tax laws, the Income Tax Act 1989
(providing for wage and salary tax, gross revenue tax and hotel tax) and the Import Duties Act 1989,
which are collated as Chapters 1 and 2, respectively, under Title 48 in the MIRC (as shown in Box 3.8
above). In terms of its comprehensiveness, the legislation is simple and covers the main points, and
the liability for taxes is reasonably simple and clear. The legislation makes reference in a number of
places to the Minister's ability to issue regulations. However, as there was no evidence of any
regulations supporting these Acts in place, this absence (of regulations) adversely affects the clarity of
procedures; regulations serve to address procedural issues and thereby help ensure procedures for all
tax types are comprehensive and clear.
Administrative discretion is fairly limited in the legislation for the main tax types. There is limited
discretion to grant exemptions or other relief from tax payable other than as specified in the
legislation. There do not appear to be any extra statutory exemptions granted. Anecdotal evidence
suggests that administrative discretion by revenue officers appears to be applied to waivers and
penalties at times, providing an illustration of some lack of clarity in the legislation in the absence of
regulations, as indicated above. However, this anecdotal evidence on discretion in practice does not
alter the basic fact that the legislation provides for reasonably limited administrative discretion.
41 IMF Country Report 11/339, November 2011. 42 Specifically, wages and salaries (income) tax, customs duties, business gross revenue tax, immoveable property tax, hotel and resort tax, and non-
resident gross income tax.

Republic of the Marshall Islands – PEFA Public Financial Management Performance Report Page 28
Comprehensive changes to the fiscal policy framework from 2012 have been proposed, which will see
the tax base broadened to include a net profits income tax and a value added tax. This will be
accompanied by new tax administration legislation.43
Box 3.9: Types of taxes, RMI Tax type Relevant legislation
Wages and salaries tax (income tax) Income Tax Act 1989 [MIRC Title 48, Chapter 1], Part II
Customs duties Import Duties Act 1989 [MIRC Title 48, Chapter 2], Part III
Business Gross Revenue Tax (GRT) Income Tax Act 1989 [MIRC Title 48, Chapter 1], Part III
Immovable Property Tax Income Tax Act 1989 [MIRC Title 48, Chapter 1], Part V
Hotel and Resort Tax Income Tax Act 1989 [MIRC Title 48, Chapter 1], Part XI
Non-resident Gross Income Tax Income Tax Act 1989 [MIRC Title 48, Chapter 1], Part VI
Retirement Fund contribution Social Security Act [MIRC Title 49, Chapter 1], Part V
Health Fund contribution Health Fund Act [MIRC Title 7, Chapter 2], Part III
Copra Tax Copra Tax Act 1992, [MIRC Title 4, Chapter 3] Source: MIRC
(ii) Taxpayers’ access to information on tax liabilities and administrative procedures
There is no systematic process for providing information on tax liabilities to the public. The
legislation is not available on-line, and there are no brochures available to guide taxpayers. Some very
limited information is provided on the back of the income tax forms on how to fill them out. The
dispersed nature of the population among geographically spread-out islands and the lack of budgetary
resources mean that in practice it is difficult to provide information to the population as a whole. For
those on the outer islands, in particular, it is very difficult to get information on tax liabilities; limited
staffing in the Revenue Division mean that tax officers are not able to make periodic visits to the outer
islands to carry out tax awareness and education.44
In practice, people wishing to seek clarification or find out basic information on tax liabilities and
procedures are required to come into the MoF Customs, Revenue and Tax Division to do so. Given
the number of people doing this, it would suggest that clear information on tax liabilities and
administrative procedures is not easily accessible elsewhere and would appear to indicate a significant
appetite for information that is more easily accessible. The Customs, Revenue and Tax Division does
not systematically carry out tax awareness and education campaigns. The media are not used
systematically. There is a lack of relevant tax information in other languages, particularly Chinese,
which is significant, since many of the major businesses are Taiwanese. Triangulation with
stakeholders confirmed that, for new businesses starting up, including those from overseas, it was
difficult for taxpayers to understand the tax system and their tax obligations and to know where to get
help.
(iii) Existence and functioning of a tax appeals mechanism
The legislation does not provide for an independent system of appeal of tax assessments. For taxes on
wages and salaries, gross revenue, immovable property and non-resident income tax, the legislation
(Section 130 of the Income Tax Act 1989) indicates that, in the first instance, the taxpayer can object
to an assessment directly to the Secretary of Finance. Thereafter, the taxpayer may lodge an appeal
with the High Court. In the Import Duties Act 1989, Section 214 sets out the conditions for the
review of taxable amounts as relating to the granting of refunds, e.g. for lost or damaged goods,
authorizable by the Secretary of Finance. In neither case is there a functioning system with
documented administrative procedures established. In practice, the tax appeal system is based on
recourse to the general legal system, which does not include a special court established to hear such
cases.45
43 As discussed in the Tax and Revenue Reform and Modernization Commission’s (TRAM) Report: “Republic of the Marshall Islands: A Holistic
Approach to Reforming the Tax and Revenue System”, 2009. 44 It is true that the value of economic activity in these remote communities is low, and, given the high cost of travel, it would not necessarily represent
value-for-money given scarce resources. 45 See the PEFA Secretariat’s latest Clarifications to the PEFA Framework (March 2012) on this dimension.
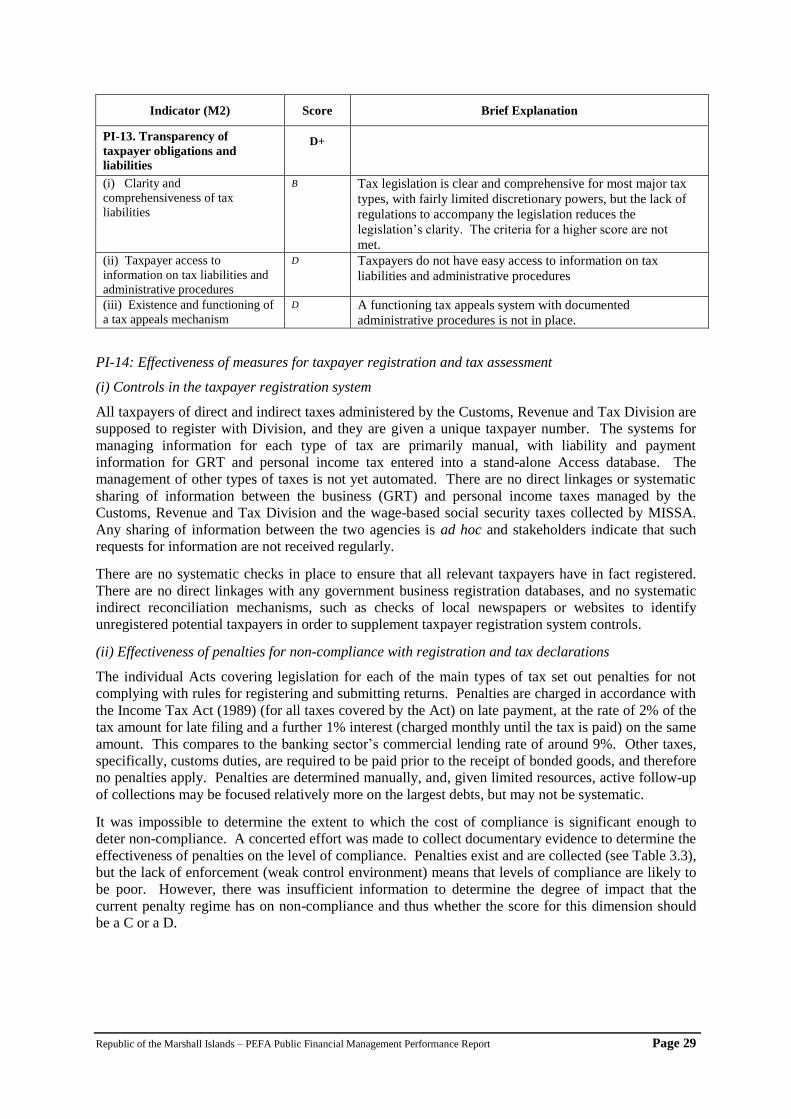
Republic of the Marshall Islands – PEFA Public Financial Management Performance Report Page 29
Indicator (M2) Score Brief Explanation
PI-13. Transparency of
taxpayer obligations and
liabilities
D+
(i) Clarity and
comprehensiveness of tax
liabilities
B Tax legislation is clear and comprehensive for most major tax
types, with fairly limited discretionary powers, but the lack of
regulations to accompany the legislation reduces the
legislation’s clarity. The criteria for a higher score are not
met.
(ii) Taxpayer access to
information on tax liabilities and
administrative procedures
D Taxpayers do not have easy access to information on tax
liabilities and administrative procedures
(iii) Existence and functioning of
a tax appeals mechanism
D A functioning tax appeals system with documented
administrative procedures is not in place.
PI-14: Effectiveness of measures for taxpayer registration and tax assessment
(i) Controls in the taxpayer registration system
All taxpayers of direct and indirect taxes administered by the Customs, Revenue and Tax Division are
supposed to register with Division, and they are given a unique taxpayer number. The systems for
managing information for each type of tax are primarily manual, with liability and payment
information for GRT and personal income tax entered into a stand-alone Access database. The
management of other types of taxes is not yet automated. There are no direct linkages or systematic
sharing of information between the business (GRT) and personal income taxes managed by the
Customs, Revenue and Tax Division and the wage-based social security taxes collected by MISSA.
Any sharing of information between the two agencies is ad hoc and stakeholders indicate that such
requests for information are not received regularly.
There are no systematic checks in place to ensure that all relevant taxpayers have in fact registered.
There are no direct linkages with any government business registration databases, and no systematic
indirect reconciliation mechanisms, such as checks of local newspapers or websites to identify
unregistered potential taxpayers in order to supplement taxpayer registration system controls.
(ii) Effectiveness of penalties for non-compliance with registration and tax declarations
The individual Acts covering legislation for each of the main types of tax set out penalties for not
complying with rules for registering and submitting returns. Penalties are charged in accordance with
the Income Tax Act (1989) (for all taxes covered by the Act) on late payment, at the rate of 2% of the
tax amount for late filing and a further 1% interest (charged monthly until the tax is paid) on the same
amount. This compares to the banking sector’s commercial lending rate of around 9%. Other taxes,
specifically, customs duties, are required to be paid prior to the receipt of bonded goods, and therefore
no penalties apply. Penalties are determined manually, and, given limited resources, active follow-up
of collections may be focused relatively more on the largest debts, but may not be systematic.
It was impossible to determine the extent to which the cost of compliance is significant enough to
deter non-compliance. A concerted effort was made to collect documentary evidence to determine the
effectiveness of penalties on the level of compliance. Penalties exist and are collected (see Table 3.3),
but the lack of enforcement (weak control environment) means that levels of compliance are likely to
be poor. However, there was insufficient information to determine the degree of impact that the
current penalty regime has on non-compliance and thus whether the score for this dimension should
be a C or a D.
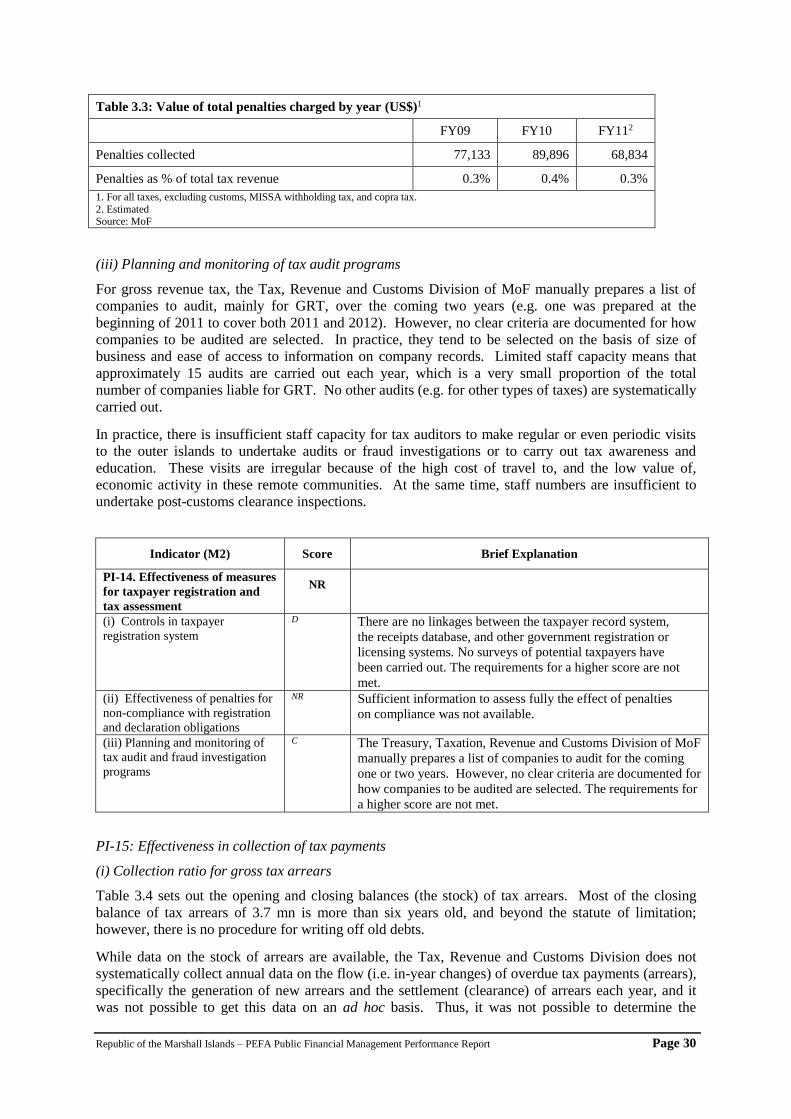
Republic of the Marshall Islands – PEFA Public Financial Management Performance Report Page 30
Table 3.3: Value of total penalties charged by year (US$)1
FY09 FY10 FY112
Penalties collected 77,133 89,896 68,834
Penalties as % of total tax revenue 0.3% 0.4% 0.3%
1. For all taxes, excluding customs, MISSA withholding tax, and copra tax.
2. Estimated Source: MoF
(iii) Planning and monitoring of tax audit programs
For gross revenue tax, the Tax, Revenue and Customs Division of MoF manually prepares a list of
companies to audit, mainly for GRT, over the coming two years (e.g. one was prepared at the
beginning of 2011 to cover both 2011 and 2012). However, no clear criteria are documented for how
companies to be audited are selected. In practice, they tend to be selected on the basis of size of
business and ease of access to information on company records. Limited staff capacity means that
approximately 15 audits are carried out each year, which is a very small proportion of the total
number of companies liable for GRT. No other audits (e.g. for other types of taxes) are systematically
carried out.
In practice, there is insufficient staff capacity for tax auditors to make regular or even periodic visits
to the outer islands to undertake audits or fraud investigations or to carry out tax awareness and
education. These visits are irregular because of the high cost of travel to, and the low value of,
economic activity in these remote communities. At the same time, staff numbers are insufficient to
undertake post-customs clearance inspections.
Indicator (M2) Score Brief Explanation
PI-14. Effectiveness of measures
for taxpayer registration and
tax assessment
NR
(i) Controls in taxpayer
registration system
D There are no linkages between the taxpayer record system,
the receipts database, and other government registration or
licensing systems. No surveys of potential taxpayers have
been carried out. The requirements for a higher score are not
met.
(ii) Effectiveness of penalties for
non-compliance with registration
and declaration obligations
NR Sufficient information to assess fully the effect of penalties
on compliance was not available.
(iii) Planning and monitoring of
tax audit and fraud investigation
programs
C The Treasury, Taxation, Revenue and Customs Division of MoF
manually prepares a list of companies to audit for the coming
one or two years. However, no clear criteria are documented for
how companies to be audited are selected. The requirements for
a higher score are not met.
PI-15: Effectiveness in collection of tax payments
(i) Collection ratio for gross tax arrears
Table 3.4 sets out the opening and closing balances (the stock) of tax arrears. Most of the closing
balance of tax arrears of 3.7 mn is more than six years old, and beyond the statute of limitation;
however, there is no procedure for writing off old debts.
While data on the stock of arrears are available, the Tax, Revenue and Customs Division does not
systematically collect annual data on the flow (i.e. in-year changes) of overdue tax payments (arrears),
specifically the generation of new arrears and the settlement (clearance) of arrears each year, and it
was not possible to get this data on an ad hoc basis. Thus, it was not possible to determine the

Republic of the Marshall Islands – PEFA Public Financial Management Performance Report Page 31
collection ratio for gross tax arrears and thus the appropriate score for the indicator.
Table 3.4: Stock of tax arrears1 (US$) FY09 FY10 FY11
Stock of arrears – opening balance N/A 3,082,177 3,560,833
In-year generation of new arrears - - -
In year clearance (settlement) of arrears - - -
Stock of arrears – closing balance 3,082,177 3,560,833 3,713,968
Closing arrears as % of tax revenues 12.7% 14.1% 16.5% 1. All sources of tax revenues except customs, for which no data are available.
Source: MoF
(ii) Effectiveness of transfers of tax collections to the Treasury by the revenue administration
All tax collections are made at the Majuro and Ebeye offices of the Ministry of Finance. Revenues
collected are transferred to the Treasury (the cashier) on a daily basis, at least by the day following
receipt. Audit reports over the last three years have not indicated any issues with the banking of
revenue collections.46
There can be a delay in the reconciliation of the cash books for the two MoF offices and the revenue
collection data in the FMIS, since the Ministry of Finance in Ebeye does not have a live systems link
to the FMIS (due to limited bandwidth). The synchronisation of the systems can be delayed due to
staff travel or communications problems.
(iii) Frequency of complete accounts reconciliation between tax assessments, collections, arrears
records and receipts by the Treasury
No evidence was provided to show that complete reconciliations of tax accounts are carried out each
year. This conclusion is strengthened by the fact that tax and payment records are maintained in
separate, un-linkable systems, which would require manual reconciliation.
Indicator (M1) Score Brief Explanation
PI-15. Effectiveness in collection
of tax payments D+
(i) Collection ratio for gross tax
arrears, being percentage of tax
arrears at the beginning of a fiscal
year, which was collected during
that fiscal year
NR Data on arrears collection ratios are not available
(ii) Effectiveness of transfer of
tax collections to the Treasury by
the revenue administration
A Collections for all revenues are transferred to the Treasury
daily.
(iii) Frequency of complete
accounts reconciliation between
tax assessments, collections,
arrears records and receipts by the
Treasury
D There was no evidence of complete reconciliations of tax
accounts being systematically carried out.
PI-16: Predictability in the availability of funds for commitment of expenditures
(i) Extent to which cash flows are forecast and monitored
While some cash planning takes place by MoF, in the form of in-year revenue projections, line
ministries do not provide MoF with their in-year (e.g. monthly or quarterly) cash requirements for the
46 However, it is noted that the single audit does not look systematically at this issue.
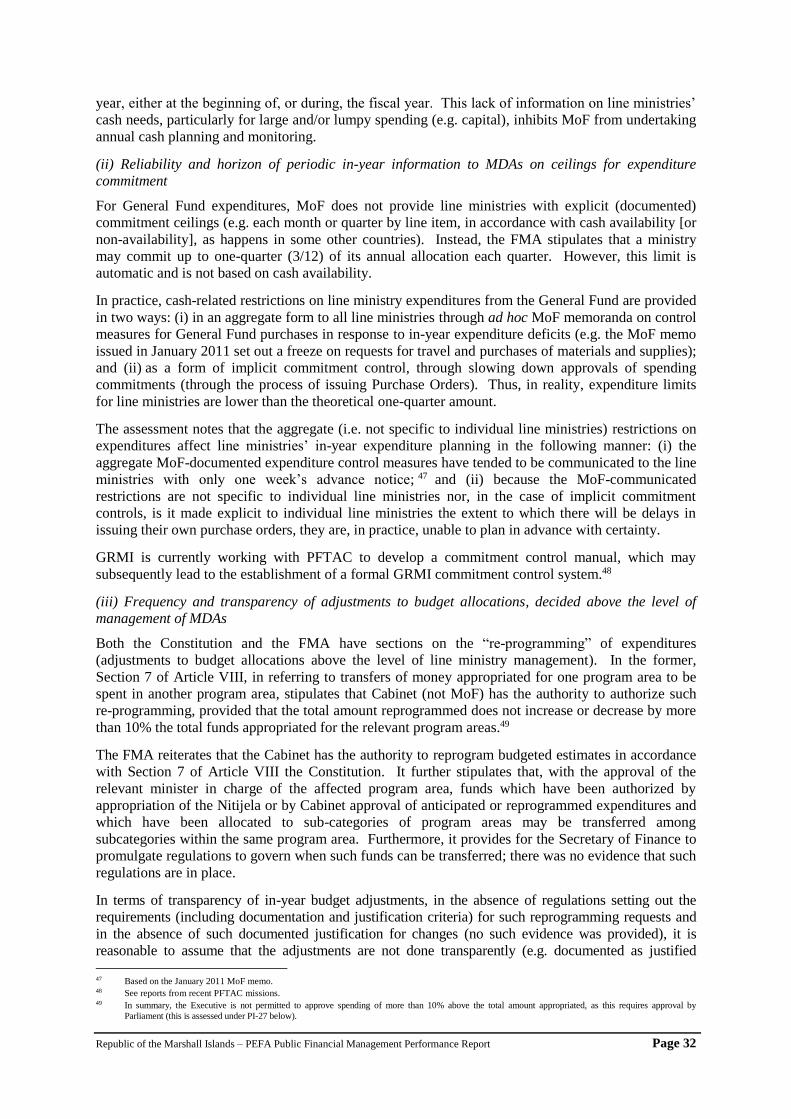
Republic of the Marshall Islands – PEFA Public Financial Management Performance Report Page 32
year, either at the beginning of, or during, the fiscal year. This lack of information on line ministries’
cash needs, particularly for large and/or lumpy spending (e.g. capital), inhibits MoF from undertaking
annual cash planning and monitoring.
(ii) Reliability and horizon of periodic in-year information to MDAs on ceilings for expenditure
commitment
For General Fund expenditures, MoF does not provide line ministries with explicit (documented)
commitment ceilings (e.g. each month or quarter by line item, in accordance with cash availability [or
non-availability], as happens in some other countries). Instead, the FMA stipulates that a ministry
may commit up to one-quarter (3/12) of its annual allocation each quarter. However, this limit is
automatic and is not based on cash availability.
In practice, cash-related restrictions on line ministry expenditures from the General Fund are provided
in two ways: (i) in an aggregate form to all line ministries through ad hoc MoF memoranda on control
measures for General Fund purchases in response to in-year expenditure deficits (e.g. the MoF memo
issued in January 2011 set out a freeze on requests for travel and purchases of materials and supplies);
and (ii) as a form of implicit commitment control, through slowing down approvals of spending
commitments (through the process of issuing Purchase Orders). Thus, in reality, expenditure limits
for line ministries are lower than the theoretical one-quarter amount.
The assessment notes that the aggregate (i.e. not specific to individual line ministries) restrictions on
expenditures affect line ministries’ in-year expenditure planning in the following manner: (i) the
aggregate MoF-documented expenditure control measures have tended to be communicated to the line
ministries with only one week’s advance notice; 47 and (ii) because the MoF-communicated
restrictions are not specific to individual line ministries nor, in the case of implicit commitment
controls, is it made explicit to individual line ministries the extent to which there will be delays in
issuing their own purchase orders, they are, in practice, unable to plan in advance with certainty.
GRMI is currently working with PFTAC to develop a commitment control manual, which may
subsequently lead to the establishment of a formal GRMI commitment control system.48
(iii) Frequency and transparency of adjustments to budget allocations, decided above the level of
management of MDAs
Both the Constitution and the FMA have sections on the “re-programming” of expenditures
(adjustments to budget allocations above the level of line ministry management). In the former,
Section 7 of Article VIII, in referring to transfers of money appropriated for one program area to be
spent in another program area, stipulates that Cabinet (not MoF) has the authority to authorize such
re-programming, provided that the total amount reprogrammed does not increase or decrease by more
than 10% the total funds appropriated for the relevant program areas.49
The FMA reiterates that the Cabinet has the authority to reprogram budgeted estimates in accordance
with Section 7 of Article VIII the Constitution. It further stipulates that, with the approval of the
relevant minister in charge of the affected program area, funds which have been authorized by
appropriation of the Nitijela or by Cabinet approval of anticipated or reprogrammed expenditures and
which have been allocated to sub-categories of program areas may be transferred among
subcategories within the same program area. Furthermore, it provides for the Secretary of Finance to
promulgate regulations to govern when such funds can be transferred; there was no evidence that such
regulations are in place.
In terms of transparency of in-year budget adjustments, in the absence of regulations setting out the
requirements (including documentation and justification criteria) for such reprogramming requests and
in the absence of such documented justification for changes (no such evidence was provided), it is
reasonable to assume that the adjustments are not done transparently (e.g. documented as justified
47 Based on the January 2011 MoF memo. 48 See reports from recent PFTAC missions. 49 In summary, the Executive is not permitted to approve spending of more than 10% above the total amount appropriated, as this requires approval by
Parliament (this is assessed under PI-27 below).
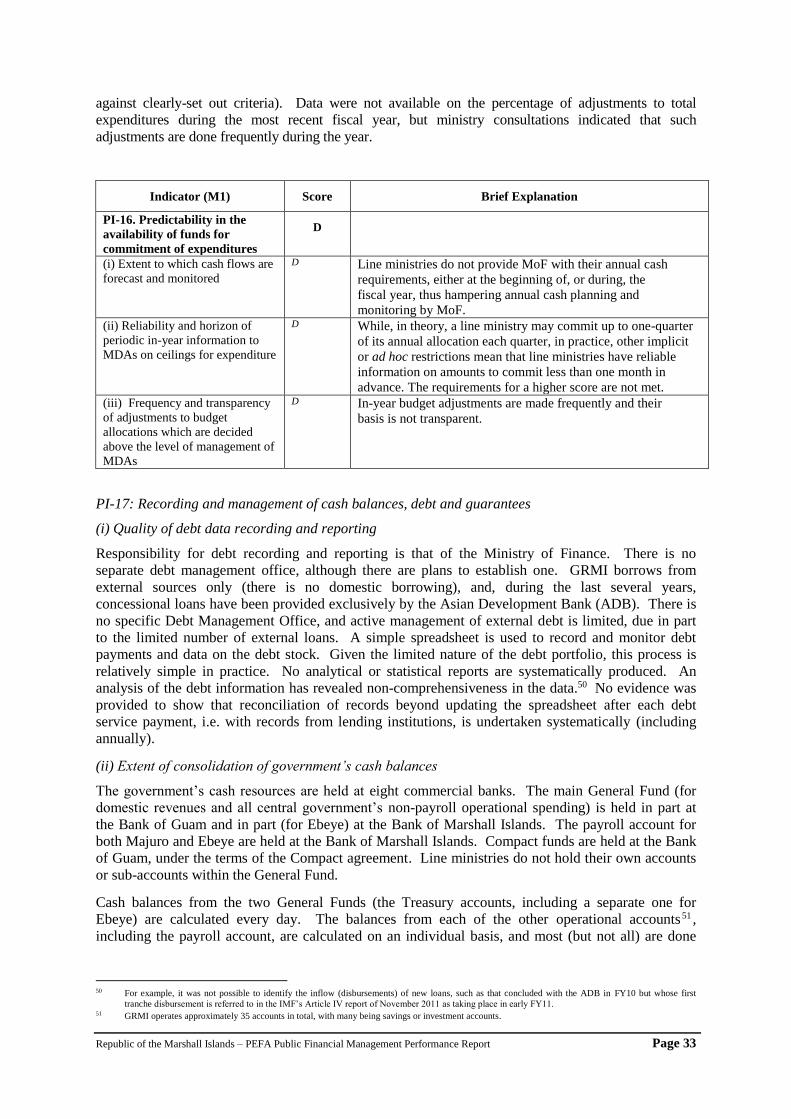
Republic of the Marshall Islands – PEFA Public Financial Management Performance Report Page 33
against clearly-set out criteria). Data were not available on the percentage of adjustments to total
expenditures during the most recent fiscal year, but ministry consultations indicated that such
adjustments are done frequently during the year.
Indicator (M1) Score Brief Explanation
PI-16. Predictability in the
availability of funds for
commitment of expenditures
D
(i) Extent to which cash flows are
forecast and monitored
D Line ministries do not provide MoF with their annual cash
requirements, either at the beginning of, or during, the
fiscal year, thus hampering annual cash planning and
monitoring by MoF.
(ii) Reliability and horizon of
periodic in-year information to
MDAs on ceilings for expenditure
D While, in theory, a line ministry may commit up to one-quarter
of its annual allocation each quarter, in practice, other implicit
or ad hoc restrictions mean that line ministries have reliable
information on amounts to commit less than one month in
advance. The requirements for a higher score are not met.
(iii) Frequency and transparency
of adjustments to budget
allocations which are decided
above the level of management of
MDAs
D In-year budget adjustments are made frequently and their
basis is not transparent.
PI-17: Recording and management of cash balances, debt and guarantees
(i) Quality of debt data recording and reporting
Responsibility for debt recording and reporting is that of the Ministry of Finance. There is no
separate debt management office, although there are plans to establish one. GRMI borrows from
external sources only (there is no domestic borrowing), and, during the last several years,
concessional loans have been provided exclusively by the Asian Development Bank (ADB). There is
no specific Debt Management Office, and active management of external debt is limited, due in part
to the limited number of external loans. A simple spreadsheet is used to record and monitor debt
payments and data on the debt stock. Given the limited nature of the debt portfolio, this process is
relatively simple in practice. No analytical or statistical reports are systematically produced. An
analysis of the debt information has revealed non-comprehensiveness in the data.50 No evidence was
provided to show that reconciliation of records beyond updating the spreadsheet after each debt
service payment, i.e. with records from lending institutions, is undertaken systematically (including
annually).
(ii) Extent of consolidation of government’s cash balances
The government’s cash resources are held at eight commercial banks. The main General Fund (for
domestic revenues and all central government’s non-payroll operational spending) is held in part at
the Bank of Guam and in part (for Ebeye) at the Bank of Marshall Islands. The payroll account for
both Majuro and Ebeye are held at the Bank of Marshall Islands. Compact funds are held at the Bank
of Guam, under the terms of the Compact agreement. Line ministries do not hold their own accounts
or sub-accounts within the General Fund.
Cash balances from the two General Funds (the Treasury accounts, including a separate one for
Ebeye) are calculated every day. The balances from each of the other operational accounts51 ,
including the payroll account, are calculated on an individual basis, and most (but not all) are done
50 For example, it was not possible to identify the inflow (disbursements) of new loans, such as that concluded with the ADB in FY10 but whose first
tranche disbursement is referred to in the IMF’s Article IV report of November 2011 as taking place in early FY11. 51 GRMI operates approximately 35 accounts in total, with many being savings or investment accounts.

Republic of the Marshall Islands – PEFA Public Financial Management Performance Report Page 34
regularly, specifically, at least monthly.52 All ending balances are provided to the Secretary of
Finance regularly (in some cases, on a daily basis). However, there was no evidence that
consolidation (as distinct from calculation of balances) of all Treasury’s accounts (including accounts
covering payroll and operations) take place. At the same time, the domestic banking system in the
Marshall Islands does not facilitate the consolidation of bank balances, and thus the calculation of
consolidated bank balances is not carried out systematically.
(iii) Systems for contracting loans and issuance of guarantees
The legislation relating to the contracting of loans and the issuance of guarantees is provided in
Chapter 10 of Title 11 of the MIRC. It grants the authority for entering into loan agreements and for
issuing loan guarantees (e.g. to a public corporation) to the Minister of Finance, with the agreement of
Cabinet.
In practice, GRMI contracts only very limited numbers of loans and issues relatively few guarantees.
In the two most recent fiscal years (FY10 and FY11), there was only one loan contracted (by the
ADB, for on-lending to state-owned enterprises (SOEs)), and no government guarantees were
issued.53
Prior to the most recent loan, a Cabinet Paper (CP) was prepared, setting out the rationale for the loan,
and its terms and conditions. An analysis of the fiscal impact of the loan was provided by MoF as an
input into the CP. Upon Cabinet approval of the proposal, and the official issuance of a Cabinet
Minute (CM), the loan was approved. No other loans have been entered into in recent years,
including in the last fiscal year.
In terms of government guarantees, despite the fact that SOEs require significant government support,
this support primarily takes the form of direct subsidies from the budget, rather than government loan
guarantees. One recent (FY11) proposed guarantee was presented to, and discussed by, Cabinet for a
loan by the Export-Import Bank of the ROC to MEC and MIDB. Following Cabinet discussions, no
sovereign guarantees were given. Instead, Cabinet approved the two SOEs to negotiate separately
with the ExIm Bank for loans without government guarantees.
Thus, on the basis that the Cabinet may be considered a single responsible entity (on the basis of
collective responsibility for Cabinet decisions under the President, as head of the government and
Cabinet), the assessment concludes that the GRMI’s system for contracting of loans and guarantees is
always approved by a single responsible government entity.
At present, there are no documented guidelines, setting out clear criteria or overall ceilings, for the
approval of loans and guarantees. A start on setting financial limits was made in June 2010, with the
issuance of a Cabinet Minute indicating a freeze on new borrowing by government, including SOEs.
However, this may be considered an ad hoc measure (restrictions on the flow of loans), rather than an
overall permanent ceiling amount (overall ceiling on stock of loans). The Government’s
Comprehensive Adjustment Program (CAP) Advisory Group recommended in its final report54 that
GRMI prepare an external debt management strategy. GRMI has recognized that it needs to
strengthen its sovereign liability and risk management, and has plans to work with the IMF on this in
the current FY (FY12).
52 One exception has been embassy accounts, whose balances may not be calculated regularly (in some cases, every quarter, during account reconciliation). 53 The audited annual accounts include a list of guarantees issued by GRMI. All refer to arrangements made more than 3 years ago. One of the most recent
government guarantees was issued in FY 2007, relating to a $12 mn loan to MEC, for which the GRMI pledged a portion of the tax revenues from the
General Fund. 54 Final report, Comprehensive Adjustment Program Advisory Group, September 2009.
Republic of the Marshall Islands – PEFA Public Financial Management Performance Report Page 35
Indicator (M2) Score Brief Explanation
PI-17 Recording and
management of cash balances,
debt and guarantees
D+
(i) Quality of debt data recording
and reporting
D There are material omissions in the debt records. No analytical or statistical reports are produced. There is no evidence that reconciliation of records is carried out systematically (including annually). The requirements for a higher score are not met.
(ii) Extent of consolidation of the
government’s cash balances
C55 Cash balances for the main government accounts (General Fund O&M – Majuro and Ebeye) are calculated regularly (i.e. at least weekly), but for most other accounts the calculation is undertaken less regularly (monthly or less frequently). Consolidation of Treasury or bank balances is not undertaken.
(iii) Systems for contracting loans
and issuance of guarantees
C All loans and guarantees are approved by Cabinet. However, no documented guidelines or criteria for such loans/guarantees yet exist, nor are there total limits within which loans/guarantees should be made (beyond a freeze on new borrowings). The requirements for a higher score are not met.
PI-18: Effectiveness of payroll controls
(i) Degree of integration and reconciliation between personnel records and payroll data
Title 5, Chapter 1 of the MIRC sets out the Public Service Act, which governs the civil service. The
employees of the majority of ministries and agencies operate under the rules and framework of the
Public Service Commission (PSC). PSC’s role is to oversee human resource management, including
the recruitment, promotion, and dismissal of employees, the approval of organizational structures,
maintenance of the establishment list and the personnel database for all public servants under its
remit, management of remuneration, job descriptions and job sizing as per the organization’s
structure. Five ministries or agencies operate outside of the PSC’s aegis, including the Ministries of
Police, Public Safety, and Judiciary, and the Land Registration Authority (LRA).
Public entities maintain three lists of personnel and payroll records: (i) payroll, maintained
exclusively by MoF; (ii) personnel records (staff records), maintained by the line ministries; and
(iii) establishment list (ministry structure with all posts), maintained by PSC. The 3 databases are
separate, and there is no evidence of any reconciliation among the 3 lists.
(ii) Timeliness of changes to personnel records and the payroll
Figure 3.1 sets out the stages of the process required to make changes to personnel records and the
payroll, including the incorporation of newly-hired personnel to more minor changes (e.g. changes in
salary levels). This process is centered on the Personnel Action (PA) document and involves activity
by the PSC, the initiating institution (e.g. school), the initiating line ministry (e.g. Ministry of
Education), and the Ministry of Finance.
55 This change in rating reflects a clarification to the PEFA Guidelines set out in the latest version from the PEFA Secretariat (March 2012, after the draft
of this assessment was circulated). There is no change in the overall rating..
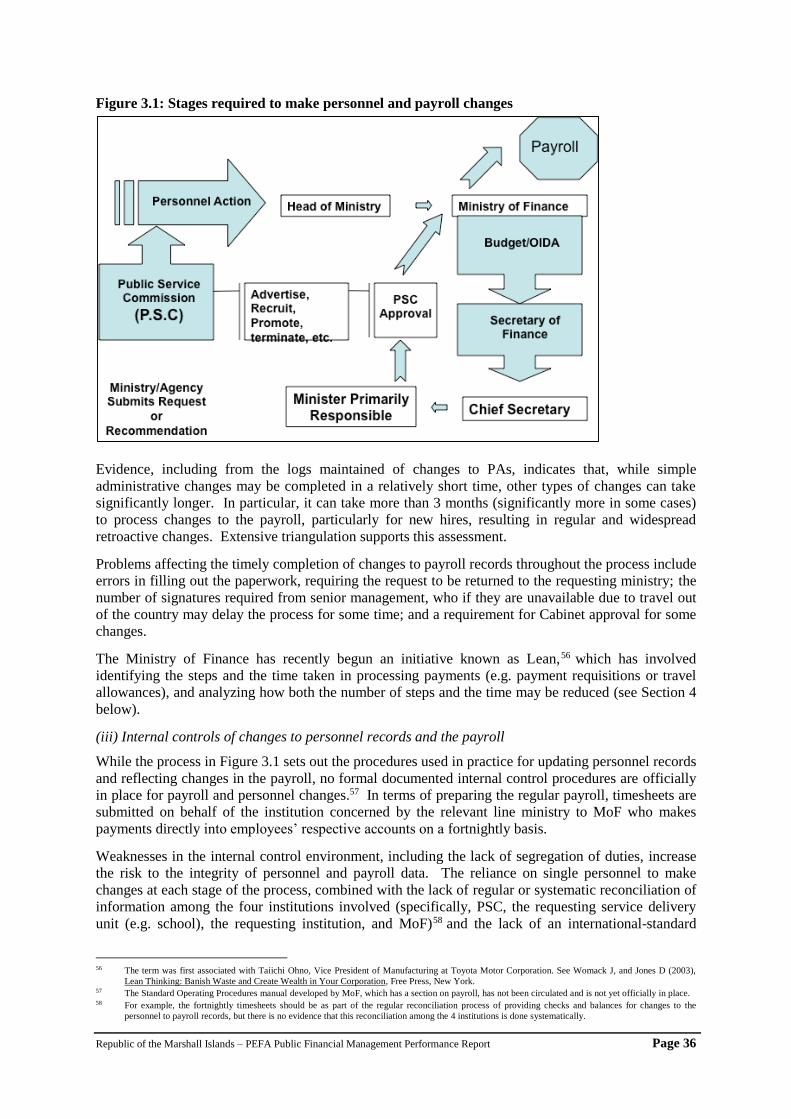
Republic of the Marshall Islands – PEFA Public Financial Management Performance Report Page 36
Figure 3.1: Stages required to make personnel and payroll changes
Evidence, including from the logs maintained of changes to PAs, indicates that, while simple
administrative changes may be completed in a relatively short time, other types of changes can take
significantly longer. In particular, it can take more than 3 months (significantly more in some cases)
to process changes to the payroll, particularly for new hires, resulting in regular and widespread
retroactive changes. Extensive triangulation supports this assessment.
Problems affecting the timely completion of changes to payroll records throughout the process include
errors in filling out the paperwork, requiring the request to be returned to the requesting ministry; the
number of signatures required from senior management, who if they are unavailable due to travel out
of the country may delay the process for some time; and a requirement for Cabinet approval for some
changes.
The Ministry of Finance has recently begun an initiative known as Lean,56 which has involved
identifying the steps and the time taken in processing payments (e.g. payment requisitions or travel
allowances), and analyzing how both the number of steps and the time may be reduced (see Section 4
below).
(iii) Internal controls of changes to personnel records and the payroll
While the process in Figure 3.1 sets out the procedures used in practice for updating personnel records
and reflecting changes in the payroll, no formal documented internal control procedures are officially
in place for payroll and personnel changes.57 In terms of preparing the regular payroll, timesheets are
submitted on behalf of the institution concerned by the relevant line ministry to MoF who makes
payments directly into employees’ respective accounts on a fortnightly basis.
Weaknesses in the internal control environment, including the lack of segregation of duties, increase
the risk to the integrity of personnel and payroll data. The reliance on single personnel to make
changes at each stage of the process, combined with the lack of regular or systematic reconciliation of
information among the four institutions involved (specifically, PSC, the requesting service delivery
unit (e.g. school), the requesting institution, and MoF)58 and the lack of an international-standard
56 The term was first associated with Taiichi Ohno, Vice President of Manufacturing at Toyota Motor Corporation. See Womack J, and Jones D (2003),
Lean Thinking: Banish Waste and Create Wealth in Your Corporation, Free Press, New York. 57 The Standard Operating Procedures manual developed by MoF, which has a section on payroll, has not been circulated and is not yet officially in place. 58 For example, the fortnightly timesheets should be as part of the regular reconciliation process of providing checks and balances for changes to the
personnel to payroll records, but there is no evidence that this reconciliation among the 4 institutions is done systematically.

Republic of the Marshall Islands – PEFA Public Financial Management Performance Report Page 37
internal audit function, mean that there are insufficient controls in place to guarantee the accuracy and
integrity of the changes made to the databases. Stakeholder consultation corroborates this assessment.
(iv) Existence of payroll audits to identify control weaknesses and/or ghost workers
There have been no comprehensive payroll or personnel audits undertaken in recent years, including
not in the last 3 years. A limited personnel audit was carried out in 2009, with funding from an ADB
technical assistance loan.59 It focussed exclusively on studying options for rationalising public sector
expenditure and improving performance in three ministries (Health, Education, and Public Works).60
Indicator (M1) Score Brief Explanation
PI-18. Effectiveness of payroll
controls
D+
(i) Degree of integration and
reconciliation between personnel
records and payroll data.
D The payroll and personnel databases at MoF, PSC and the line
ministries are not linked, and no reconciliations are done
amongst the three systems, thereby resulting in data whose
quality is seriously deficient.
(ii) Timeliness of changes to
personnel records and the payroll
D It can take more than 3 months (significantly more in some
cases) to process changes to the payroll, particularly for new
hires, resulting in regular and widespread retroactive changes.
(iii) Internal controls of changes
to personnel records and the
payroll.
C Non-officially-documented internal controls exist for changes
to the payroll and personnel databases but the control
environment is insufficient to ensure the integrity of the data.
(iv) Existence of payroll audits to
identify control weaknesses
and/or ghost workers.
D No payroll audits have been undertaken in recent years (and not
in the last 3 years).
PI-19: Competition, value for money and controls in procurement
(i) Transparency, comprehensiveness and competition in the legal and regulatory framework
The legislation covering procurement is set out in the Procurement Code (PC), found in Title 44 of the
MIRC (2004 revised Code). The PC gives responsibility for procurement to the Office of the Chief
Secretary and provides for the post of the Chief Procurement Officer under the Chief Secretary’s
Office. Although Section 120 of the Code provides for the establishment of separate regulations,
there was no evidence that any such regulations have been prepared or are in place.61
In terms of coverage of the legal/regulatory framework for each of the listed items, establishment of
hierarchy and precedence is assumed through the fact that the legislative and regulatory framework is
enshrined in a single Code. The Code is freely accessible to those with internet access on the
Marshall Islands’ Chamber of Commerce (www.marshallislandschamber.net) and on the University
of the South Pacific (USP)’s Pacific Islands Legal Information Institute (www.paclii.org) websites. In
practice, there may be a significant proportion of the population, particularly in the outer islands, who
do not have ready Internet access and/or for which English is not its first language. At the same time,
since both websites hosting the Code are external to the executive, legislative, and judicial branches of
RMI, it is in theory possible that the posting of the Code may not be sustained. However, neither of
these points changes the fact that the Code is in practice freely available.
The Code stipulates that open competitive bidding is the default method of procurement (Section
124), and the situations in which alternative methods can be used are stated (Sections 127-130).
59 Lanki and Pitkin (2009), Public Service Commission Limited Personnel Audit. 60 Its terms of reference were to (i) to identify examples of duplication in roles, responsibilities and activities between positions; (ii) to examine the
accuracy of job descriptions in describing the key responsibilities and tasks of positions; and (iii) to identify any examples of misalignment between
categorizing positions and remuneration received by position holders. 61 This information on the lack of regulations is based on conversations with stakeholders and a recent review of procurement procedures in RMI. See
Mose Saitala, Review of Government Procurement Policies and Practices, May 2009.

Republic of the Marshall Islands – PEFA Public Financial Management Performance Report Page 38
These exceptions include: (i) procurement of small purchases of less than $25,000; (ii) situations
where there is a single supplier; and (iii) emergencies affecting public health, welfare or safety.
In terms of the scope of the legislative framework, Section 106 (2) of the Code exempts contracts
between the Government and its political subdivisions and other governments. It may not be likely
that Government will place procurement contracts with either its own political subdivisions or other
governments, but it is possible. The Code therefore does not apply to all procurement undertaken
using government funds. At the same time, the PC does not apply in full to procurement of purchases
funded under the Compact agreement with the US, as a higher threshold exists for the use of less than
openly competitive procurement methods than under the PC.
In terms of the legislation’s provision for public access to specific types of procurement information,
the publication of bidding opportunities is provided for (Sections 125 (3), 126 (3) and 158 (2)).
Sections 125 (4) and 126 (4) provide for records of bid opening, including the bids themselves, to be
open to public inspection, but contract awards are not mentioned. However, Section 143 states that
details of all contracts let under sole source and emergency procurement arrangements should be
available for public inspection. Finally, no independent administrative procurement complaints
review process is provided for in the legislative and regulatory framework (Section 164).
As summarized in Box 3.10, RMI’s procurement procedures meet three of the six PEFA criteria. The
Cabinet has recently agreed to form a Working Group to review GRMI’s existing procurement
processes and make recommendations for improvement.
Box 3.10: Overview of Comprehensiveness of Procurement Legislative Framework
Item1 Covered in Legislative
Framework?
(i) be organized hierarchically and include clearly-established precedence Yes
(ii) freely and easily accessible to the public Yes
(iii) apply to all procurement undertaken using government funds No
(iv) make open competitive procurement the default method of procurement
and define clearly the situation in which other methods can be used and how
this is to be justified
Yes
(v) provide for public access to all of the following procurement
information: government procurement plans, bidding opportunities, contract
awards, and data on resolution of procurement complaints
No
(vi) provide for an independent administrative procurement review process
for handling procurement complaints by participants prior to contract
signature
No
1. Refers to criteria listed in PEFA manual under PI-19 (i)
(ii) Use of competitive procurement methods
As indicated above, the Procurement Code provides for the use of non–competitive methods of
procurement (Sections 127-130). However, reliable data on the total number of procurement
contracts and the percentage of those contracts awarded by alternative competitive methods are not
available. At the same time, there is some ambiguity concerning the applicability (and hence
appropriate justification) of the use of non-competitive methods, as supplementary regulations are not
in place, as provided for in Sections 128-129 of the Code (e.g. the conditions under which emergency
procedures are applicable). As a result, reliable information to enable proper scoring of this
dimension is lacking.
(iii) Public access to complete, reliable and timely procurement information
Public access to procurement information is not comprehensive nor complete (see Box 3.11).
Government does not produce or publish procurement plans. Information on bidding opportunities is
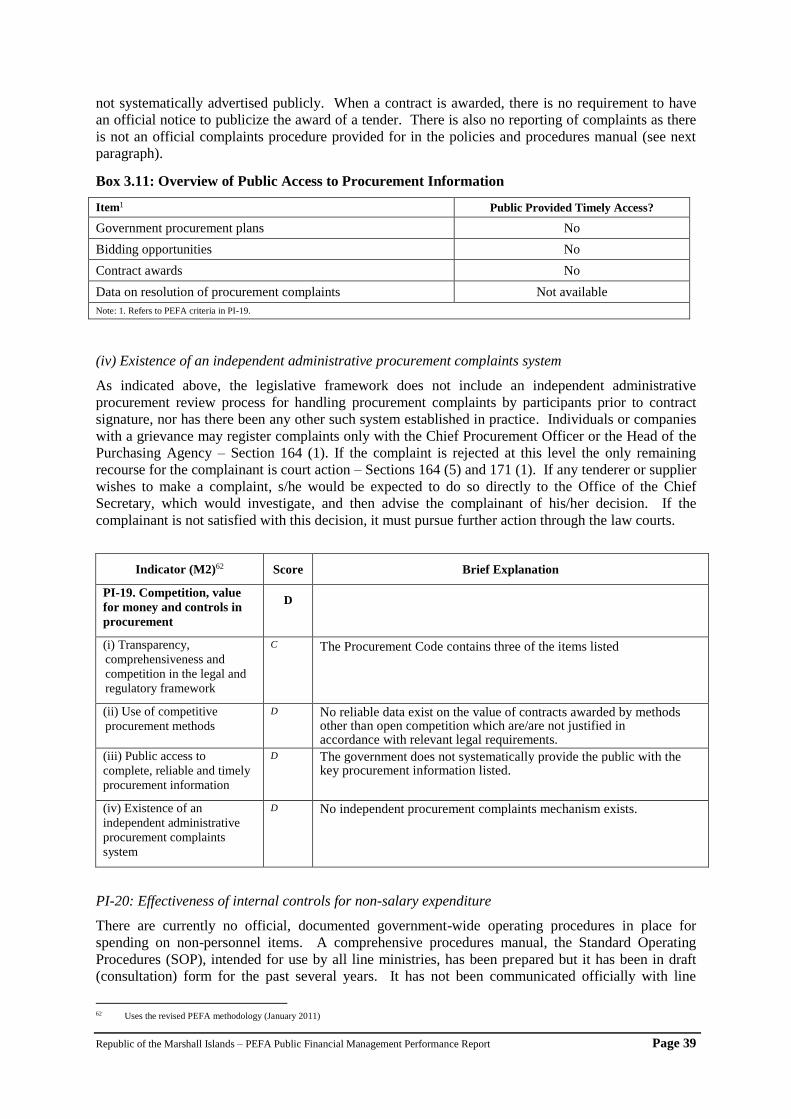
Republic of the Marshall Islands – PEFA Public Financial Management Performance Report Page 39
not systematically advertised publicly. When a contract is awarded, there is no requirement to have
an official notice to publicize the award of a tender. There is also no reporting of complaints as there
is not an official complaints procedure provided for in the policies and procedures manual (see next
paragraph).
Box 3.11: Overview of Public Access to Procurement Information
Item1 Public Provided Timely Access?
Government procurement plans No
Bidding opportunities No
Contract awards No
Data on resolution of procurement complaints Not available
Note: 1. Refers to PEFA criteria in PI-19.
(iv) Existence of an independent administrative procurement complaints system
As indicated above, the legislative framework does not include an independent administrative
procurement review process for handling procurement complaints by participants prior to contract
signature, nor has there been any other such system established in practice. Individuals or companies
with a grievance may register complaints only with the Chief Procurement Officer or the Head of the
Purchasing Agency – Section 164 (1). If the complaint is rejected at this level the only remaining
recourse for the complainant is court action – Sections 164 (5) and 171 (1). If any tenderer or supplier
wishes to make a complaint, s/he would be expected to do so directly to the Office of the Chief
Secretary, which would investigate, and then advise the complainant of his/her decision. If the
complainant is not satisfied with this decision, it must pursue further action through the law courts.
Indicator (M2)62 Score Brief Explanation
PI-19. Competition, value
for money and controls in
procurement
D
(i) Transparency,
comprehensiveness and
competition in the legal and
regulatory framework
C The Procurement Code contains three of the items listed
(ii) Use of competitive
procurement methods
D No reliable data exist on the value of contracts awarded by methods other than open competition which are/are not justified in accordance with relevant legal requirements.
(iii) Public access to
complete, reliable and timely
procurement information
D The government does not systematically provide the public with the key procurement information listed.
(iv) Existence of an
independent administrative
procurement complaints
system
D No independent procurement complaints mechanism exists.
PI-20: Effectiveness of internal controls for non-salary expenditure
There are currently no official, documented government-wide operating procedures in place for
spending on non-personnel items. A comprehensive procedures manual, the Standard Operating
Procedures (SOP), intended for use by all line ministries, has been prepared but it has been in draft
(consultation) form for the past several years. It has not been communicated officially with line
62 Uses the revised PEFA methodology (January 2011)

Republic of the Marshall Islands – PEFA Public Financial Management Performance Report Page 40
ministries. The SOP sets out administrative control procedures for spending on personnel, travel
advances, goods and services.
(i) Effectiveness of expenditure commitment controls
As indicated above, GRMI does not yet have in place a comprehensive, government-wide and fully
documented commitment control system in the sense of (ideally, automated) systemic checks and
system blocks of proposed commitments which are not within the budgetary appropriations, MoF-
expenditure ceilings/cash releases, and Treasury fund availability. A comprehensive commitment
control system would also (ideally, automatically) monitor outstanding commitments and ensure the
prompt clearance of payment arrears. As indicated above (see PI-16), GRMI is currently working
with PFTAC to develop a formal government-wide commitment control system.
The authorisation process set out in Figures 3.2 and 3.3 applies to the issuance of, respectively,
purchase requisitions and purchase orders for goods and services, including capital goods. In the
absence of the issuance of regular (e.g. monthly) cash ceilings by MoF (see PI-16 above), cash-related
restrictions to line ministry expenditures are provided through ad hoc Cabinet Minutes63 and through
delays in the approval of spending commitments (through the issuance of a Purchase Order).
Figure 3.2: Authorization process for Purchase Requisition
Figure 3.3: Authorization process for Purchase Order
63 PI-16 above referred to the MoF memo issued in January 2011 which set out a freeze on requests for travel and purchases of materials and supplies.
Republic of the Marshall Islands – PEFA Public Financial Management Performance Report Page 41
Thus, controls on non-salary expenditure commitments by line ministries do exist. However,
evidence, including from recent external audit reports64, shows that there are instances where they are
not followed.
(ii) Comprehensiveness, relevance and understanding of other internal control rules/procedures
Part IV of the FMA (found in Chapter 11 of the MIRC) deals with internal controls for expenditures
on non-salary items, including sections on the keeping of books and records, authorisation for the
Secretary of Finance to examine books, procedures for the issuance of cheques, and the handling of
petty cash. There is provision in the Act for the Secretary of Finance to direct the preparation of
supplementary rules to accompany the Act’s provisions.
However, at present, there is no official documentation currently in place which sets out
comprehensive internal controls (e.g. covering risk assessment, the control environment, and
monitoring of the control environment) applicable to central government for expenditure on non-
salary items. Thus, procedures are based on historic practice. A draft Standard Operating Procedures
(SOP) manual, which is only part of an internal control system, has been prepared, but it has not been
approved officially or circulated widely, e.g. to line ministries. In December 2010, the Secretary of
Finance issued a 7-page memo to staff of the Ministry of Finance comprising a list (reminder) of
strengthened expenditure control procedures.65 These covered procedures for purchase requisitions,
purchase orders, certification of invoices for payment, and record keeping. However, they do not
represent comprehensive internal control procedures.
Internal control rules and procedures, as largely based on historic practice (non-codified), are non-
comprehensive in significant ways. In particular, recent findings in the compliance audits66 refer
explicitly to the lack of adequate internal control policies and procedures, and to the lack of
segregation of duties.
In terms of the extent of understanding of the rules and procedures, MoF officials indicate that there
are frequent errors in the paperwork accompanying requests for payments for non-salary items. In
addition, a repeated audit finding is the absence of supporting documents to accompany the
processing of expenditures. These would suggest that the procedures are not necessarily widely
understood.
Finally, in terms of efficiency of the de facto procedures67, as part of the Lean initiative (see PI-18),
MoF has begun to analyze the efficiency of time taken to process purchase requisitions and purchase
orders and, with the analysis indicating that there is room for improvement, will be using Lean to
improve the efficiency of these two processes.
(iii) Degree of compliance with rules for processing and recording transactions
As discussed above, senior management of the Ministry of Finance issued a directive containing “in-
house procedures and policies” for expenditures in December 2010 for FY11. The text of the
directive referred explicitly to the non-compliance by various staff to rules and procedures and
thereby necessitated the issuance of such a directive. In addition, recent audit findings68 refer to the
non-compliance with relevant procedures for processing and recording non-salary expenditure
transactions. Thus, it may be understood that instances of non-compliance to the core set of rules are
reasonably widespread.
64 See, for example, 2010 Audit, RMI Compliance Audit. 65 As stated in the memo, it was issued in response to the discovery of potential fraud involving government funds. 66 See, for example, 2010 Audit, RMI Compliance Audit. 67 The de facto (non-codified) procedures, as used in RMI, are distinguished from de jure (codified) ones, which are currently not in place. 68 See, for example, 2010 Audit, RMI Compliance Audit.
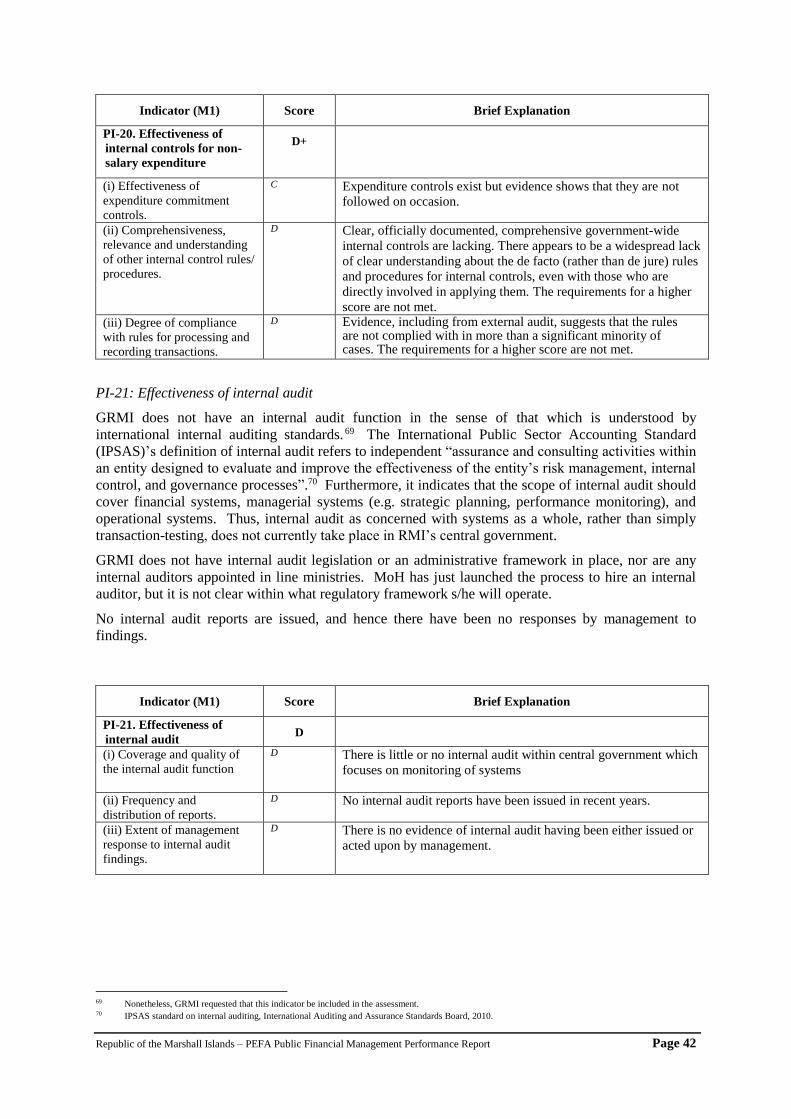
Republic of the Marshall Islands – PEFA Public Financial Management Performance Report Page 42
Indicator (M1) Score Brief Explanation
PI-20. Effectiveness of
internal controls for non-
salary expenditure
D+
(i) Effectiveness of
expenditure commitment
controls.
C Expenditure controls exist but evidence shows that they are not
followed on occasion.
(ii) Comprehensiveness,
relevance and understanding
of other internal control rules/
procedures.
D Clear, officially documented, comprehensive government-wide
internal controls are lacking. There appears to be a widespread lack
of clear understanding about the de facto (rather than de jure) rules
and procedures for internal controls, even with those who are
directly involved in applying them. The requirements for a higher
score are not met.
(iii) Degree of compliance
with rules for processing and
recording transactions.
D Evidence, including from external audit, suggests that the rules are not complied with in more than a significant minority of cases. The requirements for a higher score are not met.
PI-21: Effectiveness of internal audit
GRMI does not have an internal audit function in the sense of that which is understood by
international internal auditing standards. 69 The International Public Sector Accounting Standard
(IPSAS)’s definition of internal audit refers to independent “assurance and consulting activities within
an entity designed to evaluate and improve the effectiveness of the entity’s risk management, internal
control, and governance processes”.70 Furthermore, it indicates that the scope of internal audit should
cover financial systems, managerial systems (e.g. strategic planning, performance monitoring), and
operational systems. Thus, internal audit as concerned with systems as a whole, rather than simply
transaction-testing, does not currently take place in RMI’s central government.
GRMI does not have internal audit legislation or an administrative framework in place, nor are any
internal auditors appointed in line ministries. MoH has just launched the process to hire an internal
auditor, but it is not clear within what regulatory framework s/he will operate.
No internal audit reports are issued, and hence there have been no responses by management to
findings.
Indicator (M1) Score Brief Explanation
PI-21. Effectiveness of
internal audit D
(i) Coverage and quality of
the internal audit function
D There is little or no internal audit within central government which
focuses on monitoring of systems
(ii) Frequency and
distribution of reports.
D No internal audit reports have been issued in recent years.
(iii) Extent of management
response to internal audit
findings.
D There is no evidence of internal audit having been either issued or
acted upon by management.
69 Nonetheless, GRMI requested that this indicator be included in the assessment. 70 IPSAS standard on internal auditing, International Auditing and Assurance Standards Board, 2010.

Republic of the Marshall Islands – PEFA Public Financial Management Performance Report Page 43
3.5 Accounting, recording and reporting
PI-22: Timeliness and regularity of accounts reconciliation
(i) Regularity of bank reconciliations
As discussed in PI-17 above, the RMI Government manages four main bank accounts for central
government operations71 across two commercial banks, the Bank of Guam and the Bank of the
Marshall Islands. Line ministries do not manage their own operating bank accounts. The main
operating accounts include separate accounts for salaries for central Majuro personnel, operational
expenses for Majuro, salaries for Ebeye, and operational expenses for Ebeye. Many of the remaining
accounts are savings (fund holding) accounts.
In the absence of a regulatory framework, there is no stipulated time period requirement within which
bank accounts will be reconciled. Reconciliation of some of the main operational accounts tends to
take place at least quarterly, but some accounts may be reconciled less regularly. Indeed, evidence
from external audit reports 72 indicates that bank reconciliations, including for some key central
government expenditure accounts, are not undertaken regularly (in some cases, not more than once
per year, if at all).
(ii) Regularity of reconciliation and clearance of suspense accounts and advances
According to information provided by staff in MoF’s Accounting Division, the reconciliation of
suspense accounts, which consist mainly of travel advances, takes place at the end of the year.
Evidence from audit reports suggests that the clearance of these accounts may take longer than two
months.
Indicator (M2) Score Brief Explanation
PI-22. Timeliness and regularity of
accounts reconciliation D
(i) Regularity of bank reconciliations D Evidence, including from external audit reports,
suggest that bank reconciliations, including for some
key CG expenditure accounts, are not undertaken
regularly (in some cases, not more than once per
year, if at all). The requirements for a higher score
are not met.
(ii) Regularity of reconciliation and
clearance of suspense accounts and
advances
D The clearance of suspense accounts and the
reconciliation of these accounts tends to take place at
the end of the year but to take longer than two
months.
PI-23: Availability of information on resources received by service delivery units
There are no data available on the resources received by schools and primary health facilities.
Schools and health facilities do not receive resources directly from central government; all recurrent
and capital expenditures on their behalf are made centrally. They do not prepare their own accounts
nor do they record data on resources received in-kind. No Public Expenditure Tracking Surveys
(PETS) in either health or education have been carried out recently, including in the last 3 years.
71 Including payroll. 72 See, for example, 2010 Audit, RMI Compliance Audit.
Republic of the Marshall Islands – PEFA Public Financial Management Performance Report Page 44
Indicator (M1) Score Brief Explanation
PI-23. Availability of information on
resources received by service delivery
units
D Data on the resources received (including those
received in-kind) by primary service units (schools
and health clinics) are not available, and there is no
mechanism at the primary service unit level for
recording such information.
PI-24: Quality and timeliness of in-year budget reports
(i) Scope of reports in terms of coverage and compatibility with budget estimates
As discussed under dimension PI-24 (ii) below, GRMI does not issue official in-year budget
execution reports. Consequently, this first dimension is assessed in terms of the data contained in the
financial management information system (FMIS). The FMIS captures expenditure data for both
commitments (known as encumbrances) and payments. The accounts classification used for
accounting allows direct comparison to the budget in most cases. One exception which makes it more
difficult to compare in-year expenditures directly with the budget is the difference in treatment of
Compact funding, which doesn’t lapse at the end of the year, compared to General Fund resources
(largely, domestic revenues), which do.
(ii) Timeliness of the issue of reports
GRMI does not issue official in-year budget execution reports (e.g. quarterly reports), comparing and
providing analysis of expenditures to date with the appropriated budget by the classification of
appropriation, as is standard practice in some other countries. The Ministry of Finance provides an
annual report to the Nitijela at the end of the fiscal year, which sets out both progress made during the
year and plans for the coming year for each of the Ministry’s divisions. Internal budget monitoring
reports from the FMIS are produced on an on-demand basis.
(iii) Quality of information
As indicated above, with GRMI not issuing official in-year budget execution reports, this dimension
has been assessed on the basis of the quality of the data in the annual budget reports, i.e. the annual
financial statements. Whilst potential problems with the accuracy of some data have been raised as an
issue in the latest year-end compliance audit reports 73 , some important issues have not been
systematically highlighted in the reports to facilitate managerial action.74 However, overall, the non-
qualification of the annual accounts for the past several years (the central government’s accounts have
not been qualified since FY07) suggests that the auditors do not believe that there are fundamental
(material) problems with the data in the accounts, and thus these problems do not undermine the basic
usefulness of the accounts.
73 See, for example, the compliance volume of the single audit for FY10. 74 Whilst potential questions about the verification, and thus accuracy, of some reported data are mentioned in the reports, the discussion of such issues is
not necessarily prominent, including with major potential issues (see recent US General Accountability Office reports)..
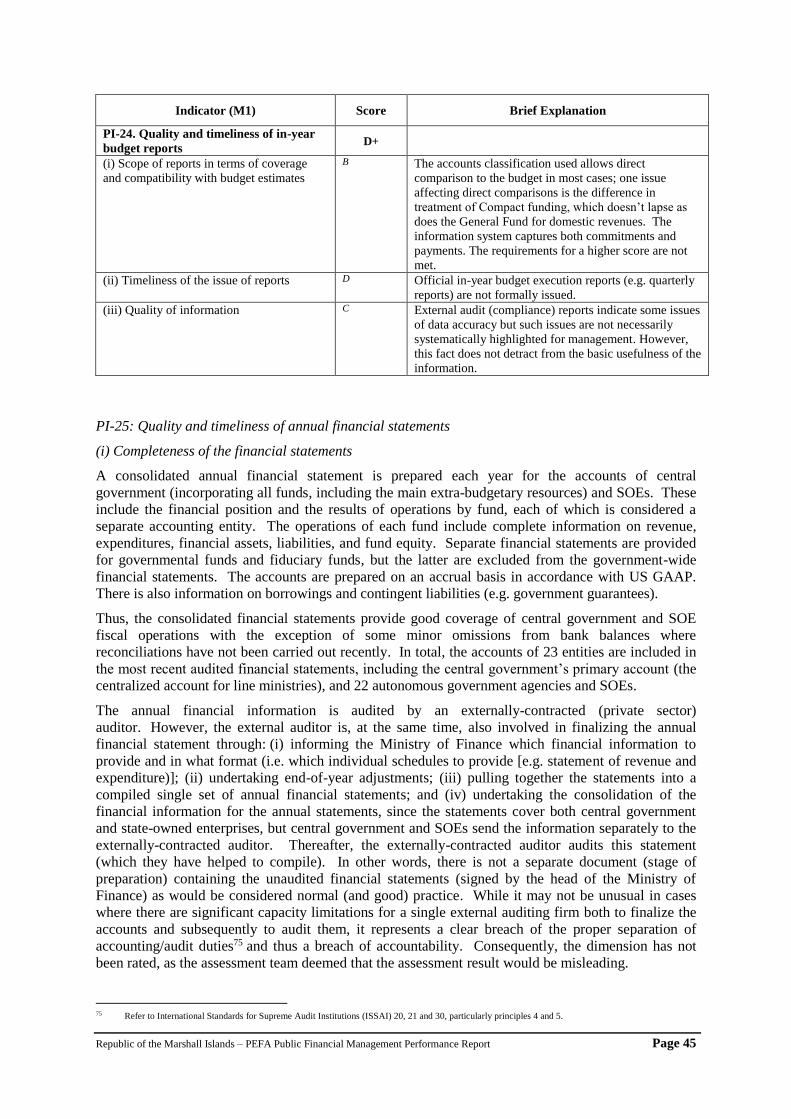
Republic of the Marshall Islands – PEFA Public Financial Management Performance Report Page 45
Indicator (M1) Score Brief Explanation
PI-24. Quality and timeliness of in-year
budget reports D+
(i) Scope of reports in terms of coverage
and compatibility with budget estimates
B The accounts classification used allows direct
comparison to the budget in most cases; one issue
affecting direct comparisons is the difference in
treatment of Compact funding, which doesn’t lapse as
does the General Fund for domestic revenues. The
information system captures both commitments and
payments. The requirements for a higher score are not
met.
(ii) Timeliness of the issue of reports D Official in-year budget execution reports (e.g. quarterly
reports) are not formally issued.
(iii) Quality of information C External audit (compliance) reports indicate some issues
of data accuracy but such issues are not necessarily
systematically highlighted for management. However,
this fact does not detract from the basic usefulness of the
information.
PI-25: Quality and timeliness of annual financial statements
(i) Completeness of the financial statements
A consolidated annual financial statement is prepared each year for the accounts of central
government (incorporating all funds, including the main extra-budgetary resources) and SOEs. These
include the financial position and the results of operations by fund, each of which is considered a
separate accounting entity. The operations of each fund include complete information on revenue,
expenditures, financial assets, liabilities, and fund equity. Separate financial statements are provided
for governmental funds and fiduciary funds, but the latter are excluded from the government-wide
financial statements. The accounts are prepared on an accrual basis in accordance with US GAAP.
There is also information on borrowings and contingent liabilities (e.g. government guarantees).
Thus, the consolidated financial statements provide good coverage of central government and SOE
fiscal operations with the exception of some minor omissions from bank balances where
reconciliations have not been carried out recently. In total, the accounts of 23 entities are included in
the most recent audited financial statements, including the central government’s primary account (the
centralized account for line ministries), and 22 autonomous government agencies and SOEs.
The annual financial information is audited by an externally-contracted (private sector)
auditor. However, the external auditor is, at the same time, also involved in finalizing the annual
financial statement through: (i) informing the Ministry of Finance which financial information to
provide and in what format (i.e. which individual schedules to provide [e.g. statement of revenue and
expenditure)]; (ii) undertaking end-of-year adjustments; (iii) pulling together the statements into a
compiled single set of annual financial statements; and (iv) undertaking the consolidation of the
financial information for the annual statements, since the statements cover both central government
and state-owned enterprises, but central government and SOEs send the information separately to the
externally-contracted auditor. Thereafter, the externally-contracted auditor audits this statement
(which they have helped to compile). In other words, there is not a separate document (stage of
preparation) containing the unaudited financial statements (signed by the head of the Ministry of
Finance) as would be considered normal (and good) practice. While it may not be unusual in cases
where there are significant capacity limitations for a single external auditing firm both to finalize the
accounts and subsequently to audit them, it represents a clear breach of the proper separation of
accounting/audit duties75 and thus a breach of accountability. Consequently, the dimension has not
been rated, as the assessment team deemed that the assessment result would be misleading.
75 Refer to International Standards for Supreme Audit Institutions (ISSAI) 20, 21 and 30, particularly principles 4 and 5.
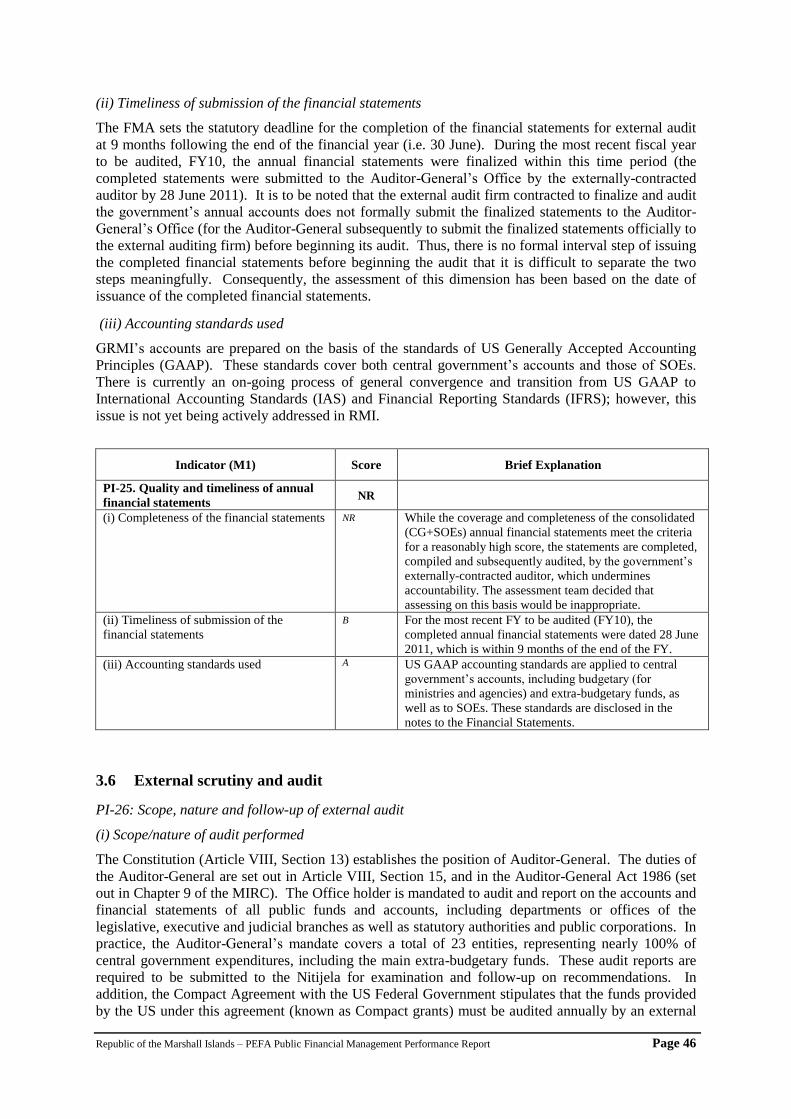
Republic of the Marshall Islands – PEFA Public Financial Management Performance Report Page 46
(ii) Timeliness of submission of the financial statements
The FMA sets the statutory deadline for the completion of the financial statements for external audit
at 9 months following the end of the financial year (i.e. 30 June). During the most recent fiscal year
to be audited, FY10, the annual financial statements were finalized within this time period (the
completed statements were submitted to the Auditor-General’s Office by the externally-contracted
auditor by 28 June 2011). It is to be noted that the external audit firm contracted to finalize and audit
the government’s annual accounts does not formally submit the finalized statements to the Auditor-
General’s Office (for the Auditor-General subsequently to submit the finalized statements officially to
the external auditing firm) before beginning its audit. Thus, there is no formal interval step of issuing
the completed financial statements before beginning the audit that it is difficult to separate the two
steps meaningfully. Consequently, the assessment of this dimension has been based on the date of
issuance of the completed financial statements.
(iii) Accounting standards used
GRMI’s accounts are prepared on the basis of the standards of US Generally Accepted Accounting
Principles (GAAP). These standards cover both central government’s accounts and those of SOEs.
There is currently an on-going process of general convergence and transition from US GAAP to
International Accounting Standards (IAS) and Financial Reporting Standards (IFRS); however, this
issue is not yet being actively addressed in RMI.
Indicator (M1) Score Brief Explanation
PI-25. Quality and timeliness of annual
financial statements NR
(i) Completeness of the financial statements NR While the coverage and completeness of the consolidated
(CG+SOEs) annual financial statements meet the criteria
for a reasonably high score, the statements are completed,
compiled and subsequently audited, by the government’s
externally-contracted auditor, which undermines
accountability. The assessment team decided that
assessing on this basis would be inappropriate.
(ii) Timeliness of submission of the
financial statements
B For the most recent FY to be audited (FY10), the
completed annual financial statements were dated 28 June
2011, which is within 9 months of the end of the FY.
(iii) Accounting standards used A US GAAP accounting standards are applied to central
government’s accounts, including budgetary (for
ministries and agencies) and extra-budgetary funds, as
well as to SOEs. These standards are disclosed in the
notes to the Financial Statements.
3.6 External scrutiny and audit
PI-26: Scope, nature and follow-up of external audit
(i) Scope/nature of audit performed
The Constitution (Article VIII, Section 13) establishes the position of Auditor-General. The duties of
the Auditor-General are set out in Article VIII, Section 15, and in the Auditor-General Act 1986 (set
out in Chapter 9 of the MIRC). The Office holder is mandated to audit and report on the accounts and
financial statements of all public funds and accounts, including departments or offices of the
legislative, executive and judicial branches as well as statutory authorities and public corporations. In
practice, the Auditor-General’s mandate covers a total of 23 entities, representing nearly 100% of
central government expenditures, including the main extra-budgetary funds. These audit reports are
required to be submitted to the Nitijela for examination and follow-up on recommendations. In
addition, the Compact Agreement with the US Federal Government stipulates that the funds provided
by the US under this agreement (known as Compact grants) must be audited annually by an external
Republic of the Marshall Islands – PEFA Public Financial Management Performance Report Page 47
auditor, covering audit of the funds’ financial statements as well as a compliance audit (this is known
as the Single Audit). In practice, GRMI has requested that the externally-contracted auditor apply
these requirements to all public funds. The RMI Audit Office follows US GAAP auditing standards.
The Audit Office currently undertakes only financial and compliance audits (either directly or by
contracting out to an external auditor, as indicated above). Audit Office records show that these 23
entities in the Auditor-General’s mandate are indeed audited each year. The only expenditures
excluded from audit are small, unreported activities at the school level (e.g. parent-teachers’
associations) and non-major governmental funds (e.g. Communication Regulation Fund) due to an
absence of account balances, whose omission the external auditor considers non-material. In practice,
significant capacity constraints (3 auditors in the Audit Office) mean that virtually all of the entities’
audits are conducted by the externally-contracted auditor.76 The Audit Office is planning to begin to
undertake performance audits in the near future.
The compliance audit conducted by the externally-contracted auditor (as part of the Single Audit)
does not look comprehensively at (or express an opinion on) the effectiveness of GRMI’s internal
control systems. The notes to the audit report explicitly indicate that the audits involve transaction
testing and do not cover systemic issues, e.g. of compliance. The reports identify some significant
issues (e.g. with compliance) but do not highlight them. In the compliance audit report itself, findings
that are non-material, material, and potentially serious are afforded the same treatment in the text.
Thus, management must read the entire report to identify potentially serious issues or the report must
be read together with the separate letter.77 Given that the most recent letter shown to the assessment
team was for FY08 (the most recent audited report was for FY10), it may be that the management
letters are difficult to locate.
(ii) Timeliness of submission of audit reports to legislature
According to the Constitution, the Auditor-General is required to report once per year to the Nitijela,
detailing his/her activities for the year; in practice, the Auditor-General produces two such reports per
year, which include financial and compliance audits for selected SOEs.78 There is no statutory
obligation to table audit reports; however, all audit reports are submitted to the Public Accounts
Committee but are not officially tabled. In terms of deadlines, the annual audited accounts and
compliance audit reports as part of the Single Audit are required to be completed by 30 June of the
year following the year for which the accounts are being audited (i.e. within 9 months of the end of
the fiscal year). In practice, audit reports have been completed by the external auditor79 in line with
this time period.
However, the submission of such reports to the Nitijela (the subject of this dimension) depends on the
timing of the Nitijela’s sessions since the reports are not submitted (tabled) when the Nitijela is not in
session. During the most recent fiscal year to be audited, FY10, evidence from the external auditor
and from the Nitijela indicate that the audited accounts, including the accounts for each central
government entity and the consolidated central government accounts, were finalized and submitted to
the Nitijela within 10 months from the receipt of the accounts by the external auditor, excluding those
audits delayed by on-going fraud investigations. The compliance audits for each audited entity were
finalized and submitted to the Nitijela within 9-10 months from the end of FY10 (i.e. the end of the
period audited). There were no other audit reports submitted to the Nitijela during the period being
assessed.80
(iii) Evidence of follow-up on audit recommendations
With the single audit, for each of its compliance findings (known as a “questioned cost”), the
management prepares a simple (not detailed) formal response (e.g. 1-2 sentences or, at most, a
paragraph), which is incorporated into the auditor’s report before it is finalized and published. The
76 In FY10, the Audit Office undertook the audit of 3 entities. 77 The recent discovery of significant amounts of potential fraud going back over a number of years bears witness to the importance of highlighting such
issues more clearly for management. 78 As indicated above, in the RMI context, SOEs cover both autonomous government agencies and public enterprises. 79 Either the Auditor-General’s office or, in most cases, the external audit firm contracted to the Auditor General. 80 As indicated above, the Auditor-General’s office carries out only financial audit and compliance audits.
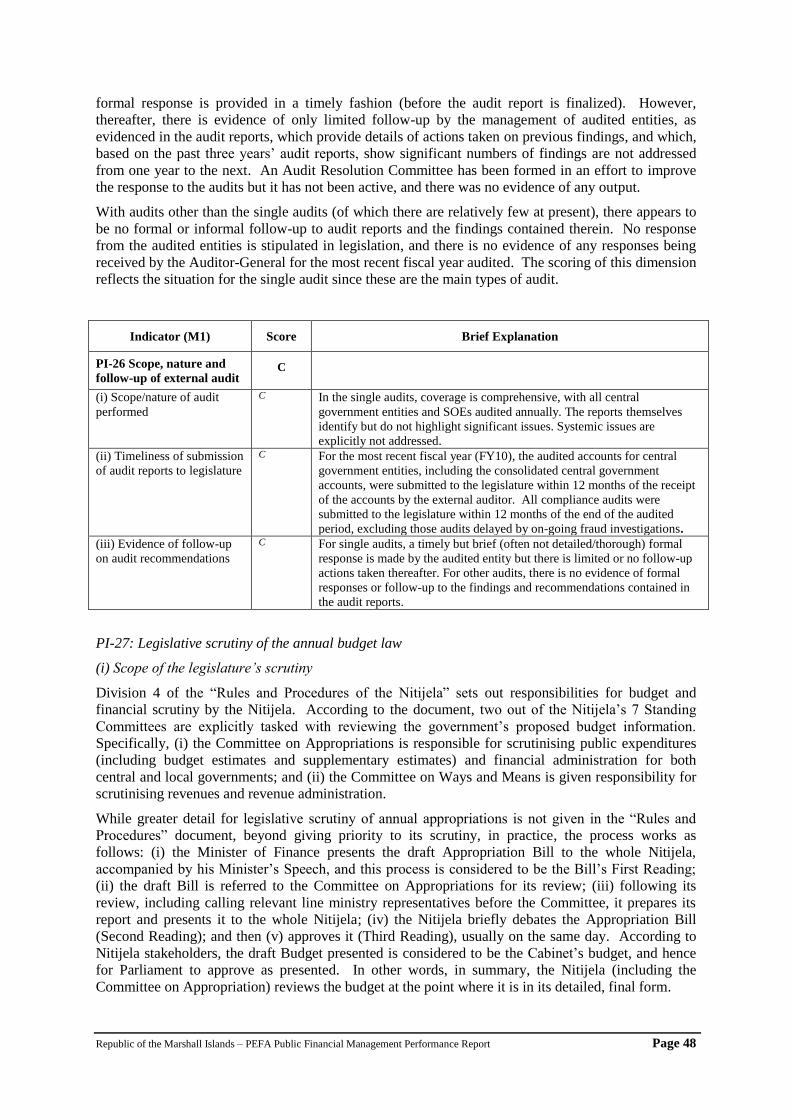
Republic of the Marshall Islands – PEFA Public Financial Management Performance Report Page 48
formal response is provided in a timely fashion (before the audit report is finalized). However,
thereafter, there is evidence of only limited follow-up by the management of audited entities, as
evidenced in the audit reports, which provide details of actions taken on previous findings, and which,
based on the past three years’ audit reports, show significant numbers of findings are not addressed
from one year to the next. An Audit Resolution Committee has been formed in an effort to improve
the response to the audits but it has not been active, and there was no evidence of any output.
With audits other than the single audits (of which there are relatively few at present), there appears to
be no formal or informal follow-up to audit reports and the findings contained therein. No response
from the audited entities is stipulated in legislation, and there is no evidence of any responses being
received by the Auditor-General for the most recent fiscal year audited. The scoring of this dimension
reflects the situation for the single audit since these are the main types of audit.
Indicator (M1) Score Brief Explanation
PI-26 Scope, nature and
follow-up of external audit C
(i) Scope/nature of audit
performed
C In the single audits, coverage is comprehensive, with all central
government entities and SOEs audited annually. The reports themselves
identify but do not highlight significant issues. Systemic issues are
explicitly not addressed.
(ii) Timeliness of submission
of audit reports to legislature
C For the most recent fiscal year (FY10), the audited accounts for central
government entities, including the consolidated central government
accounts, were submitted to the legislature within 12 months of the receipt
of the accounts by the external auditor. All compliance audits were
submitted to the legislature within 12 months of the end of the audited
period, excluding those audits delayed by on-going fraud investigations.
(iii) Evidence of follow-up
on audit recommendations
C For single audits, a timely but brief (often not detailed/thorough) formal
response is made by the audited entity but there is limited or no follow-up
actions taken thereafter. For other audits, there is no evidence of formal
responses or follow-up to the findings and recommendations contained in
the audit reports.
PI-27: Legislative scrutiny of the annual budget law
(i) Scope of the legislature’s scrutiny
Division 4 of the “Rules and Procedures of the Nitijela” sets out responsibilities for budget and
financial scrutiny by the Nitijela. According to the document, two out of the Nitijela’s 7 Standing
Committees are explicitly tasked with reviewing the government’s proposed budget information.
Specifically, (i) the Committee on Appropriations is responsible for scrutinising public expenditures
(including budget estimates and supplementary estimates) and financial administration for both
central and local governments; and (ii) the Committee on Ways and Means is given responsibility for
scrutinising revenues and revenue administration.
While greater detail for legislative scrutiny of annual appropriations is not given in the “Rules and
Procedures” document, beyond giving priority to its scrutiny, in practice, the process works as
follows: (i) the Minister of Finance presents the draft Appropriation Bill to the whole Nitijela,
accompanied by his Minister’s Speech, and this process is considered to be the Bill’s First Reading;
(ii) the draft Bill is referred to the Committee on Appropriations for its review; (iii) following its
review, including calling relevant line ministry representatives before the Committee, it prepares its
report and presents it to the whole Nitijela; (iv) the Nitijela briefly debates the Appropriation Bill
(Second Reading); and then (v) approves it (Third Reading), usually on the same day. According to
Nitijela stakeholders, the draft Budget presented is considered to be the Cabinet’s budget, and hence
for Parliament to approve as presented. In other words, in summary, the Nitijela (including the
Committee on Appropriation) reviews the budget at the point where it is in its detailed, final form.

Republic of the Marshall Islands – PEFA Public Financial Management Performance Report Page 49
(ii) Extent to which the legislature’s procedures are well-established and respected
The process outlined above involves relatively simple procedures (e.g. there are no sectoral sub-
committees under the main Appropriations Committee [which, given the size of the Nitijela, would
pose practical problems] and the extent of debate is relatively limited) which are not set out in
documented form. The documented rules covering budget scrutiny as set out in the Nitijela’s Rules
and Procedures effectively merely establish the principle of Parliamentary scrutiny of the budget. The
rules consist of a single sentence each for the Committees on Appropriations and on Ways and
Means81, and there are no detailed accompanying procedures, such as official Committees’ Terms of
Reference. As such, there is nothing regulating each new Committee Chair from establishing new
procedures. Thus, the rules are too broad to be comprehensive. In summary, few procedures are set
out to govern the review of the government’s budget proposals by the legislature, and these do not
include details of such scrutiny. The criteria for a higher score for this dimension are not met.
(iii) Adequacy of time for the legislature to provide a response to budget proposals
Nitijela records indicate the dates for each of the three Parliamentary readings of Appropriations Bill
and thus the amount of time spent at each stage. In the last fiscal year considered by Parliament
(FY12), the basis for the assessment, Nitijela had just over four weeks to review the budget proposals.
(iv) Rules for in-year amendments to the budget without ex-ante approval by the legislature
Rules for in-year amendments to the budget without ex-ante approval by the legislature are contained
in the Constitution, the FMA, and the annual Appropriation Act.82 As indicated above (see PI-16),
Section 7 of Article VIII of the Constitution stipulates that Cabinet may authorize reprogramming of
expenditures provided that the revised (reprogrammed) amounts do not cause the expenditures in the
relevant program areas to be 10% higher or lower than the original funds appropriated for these
program areas. The FMA stipulates that over-expenditures or over-obligations by line ministries can
only be made as in accordance with Article VIII of the Constitution, and indicates that the Minister of
a relevant ministry may authorize the transfer of funds between sub-programs within an overall
program area total. The FMA also states that the Secretary of Finance may promulgate regulations
which govern when funds may be transferred between program areas; however, no such regulations
are in place, and there are no regulations stipulating what documentation or justification must be
given for reprogramming requests. In addition, in the Annual Appropriation Act, there is a blanket
provision that stipulates that any expenditure other than in accordance with Schedules 1,2,3,4 or 5 of
the Appropriation Act is to be approved by Cabinet (in accordance with Article VIII, Section 5 [not
Section 7] of the Constitution).83
However, the rules in the Constitution and the FMA for making changes to the appropriations are not
clear. In neither document is the term ‘program area’ defined (and hence the basic unit which is the
basis for reprogramming is not defined). The Constitution does not define the term at all, while the
FMA defines a program area to be ‘the program areas set forth in the Annual Appropriation Bill’, but,
besides being a circular argument, the Appropriation Bill does not contain the term ‘program area’.84
Even if one implicitly assumes the term to refer to the lowest level of classification as set out in the
Appropriation Act, there appears to be a contradiction (or, at least, some lack of clarity), between the
provision in the Constitution on expenditures different to those appropriated (Article VIII, Section 7,
described above) and the blanket provision in Section 12 of the Appropriation Act85 (described in the
previous paragraph), about which changes may be made by the Cabinet, and which must be approved
by the Nitijela.
81 Specifically, “The Committee [on Appropriations] shall consider and report on all Bills, Resolutions, motions, and other matters relating to public
expenditure or to financial administration of the Marshall Islands and local government finance, including budget estimates and supplementary estimates, that are referred to it by the Nitijela”
82 While these rules were set out in PI-16 above, they are repeated here for ease of reference. 83 Section 5 of Article VIII of the Constitution provides for Cabinet’s collective responsibility over all public expenditures. 84 In the annual Appropriation Act, a similar circular definition is shown, with a ‘program area’ defined as ‘program areas set out in Schedule 1 to Schedule
4 as indicated by the headings in those schedules’ but without any headings in Schedules 1 to 4 referring to program areas. 85 Section number from FY2011 Appropriation Act
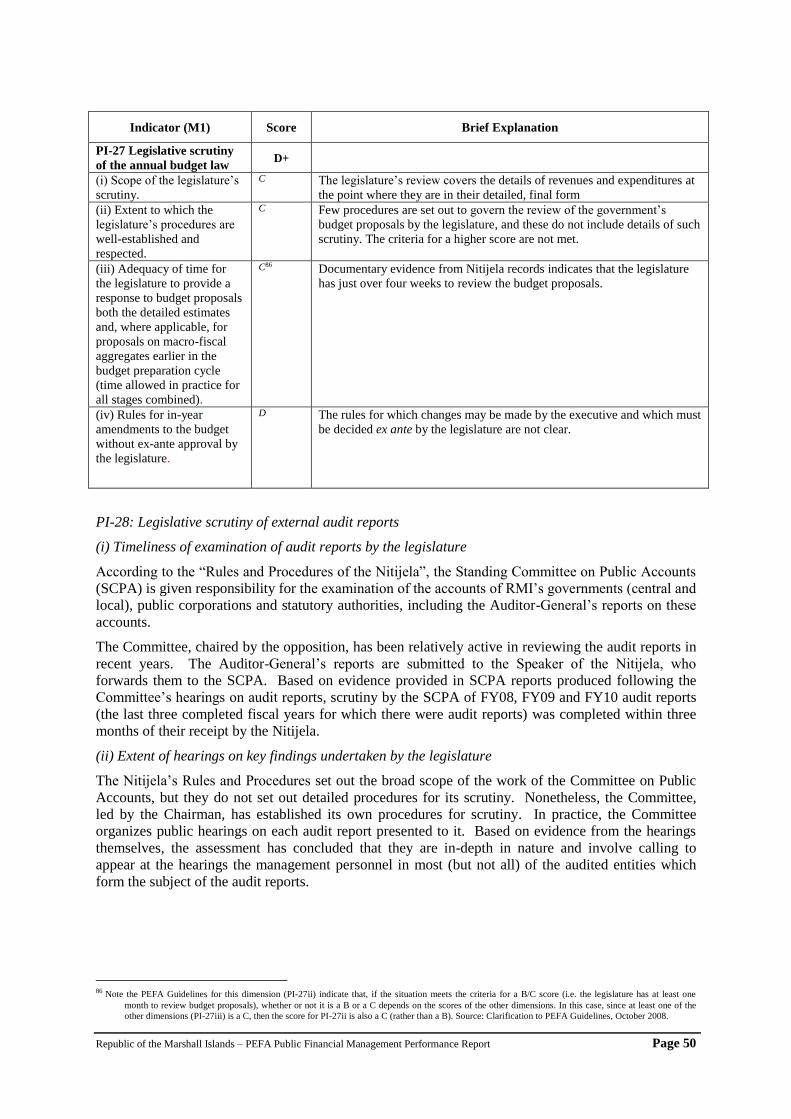
Republic of the Marshall Islands – PEFA Public Financial Management Performance Report Page 50
Indicator (M1) Score Brief Explanation
PI-27 Legislative scrutiny
of the annual budget law D+
(i) Scope of the legislature’s
scrutiny.
C The legislature’s review covers the details of revenues and expenditures at
the point where they are in their detailed, final form
(ii) Extent to which the
legislature’s procedures are
well-established and
respected.
C Few procedures are set out to govern the review of the government’s
budget proposals by the legislature, and these do not include details of such
scrutiny. The criteria for a higher score are not met.
(iii) Adequacy of time for
the legislature to provide a
response to budget proposals
both the detailed estimates
and, where applicable, for
proposals on macro-fiscal
aggregates earlier in the
budget preparation cycle
(time allowed in practice for
all stages combined).
C86 Documentary evidence from Nitijela records indicates that the legislature
has just over four weeks to review the budget proposals.
(iv) Rules for in-year
amendments to the budget
without ex-ante approval by
the legislature.
D The rules for which changes may be made by the executive and which must
be decided ex ante by the legislature are not clear.
PI-28: Legislative scrutiny of external audit reports
(i) Timeliness of examination of audit reports by the legislature
According to the “Rules and Procedures of the Nitijela”, the Standing Committee on Public Accounts
(SCPA) is given responsibility for the examination of the accounts of RMI’s governments (central and
local), public corporations and statutory authorities, including the Auditor-General’s reports on these
accounts.
The Committee, chaired by the opposition, has been relatively active in reviewing the audit reports in
recent years. The Auditor-General’s reports are submitted to the Speaker of the Nitijela, who
forwards them to the SCPA. Based on evidence provided in SCPA reports produced following the
Committee’s hearings on audit reports, scrutiny by the SCPA of FY08, FY09 and FY10 audit reports
(the last three completed fiscal years for which there were audit reports) was completed within three
months of their receipt by the Nitijela.
(ii) Extent of hearings on key findings undertaken by the legislature
The Nitijela’s Rules and Procedures set out the broad scope of the work of the Committee on Public
Accounts, but they do not set out detailed procedures for its scrutiny. Nonetheless, the Committee,
led by the Chairman, has established its own procedures for scrutiny. In practice, the Committee
organizes public hearings on each audit report presented to it. Based on evidence from the hearings
themselves, the assessment has concluded that they are in-depth in nature and involve calling to
appear at the hearings the management personnel in most (but not all) of the audited entities which
form the subject of the audit reports.
86 Note the PEFA Guidelines for this dimension (PI-27ii) indicate that, if the situation meets the criteria for a B/C score (i.e. the legislature has at least one
month to review budget proposals), whether or not it is a B or a C depends on the scores of the other dimensions. In this case, since at least one of the
other dimensions (PI-27iii) is a C, then the score for PI-27ii is also a C (rather than a B). Source: Clarification to PEFA Guidelines, October 2008.

Republic of the Marshall Islands – PEFA Public Financial Management Performance Report Page 51
(iii) Issuance of recommended actions by the legislature and implemented by the executive
The SCPA makes recommendations in its reports. However, there is no evidence that the executive
takes follow-up actions in response to these, and the SCPA reports reveal repeated recommendations
over time.
Indicator (M1) Score Brief Explanation
PI-28 Legislative scrutiny
of external audit reports C+
(i) Timeliness of
examination of audit reports
by the legislature (for reports
received within the last three
years).
A Scrutiny of the audit reports by the legislature (SPCA) is completed within
three months of their receipt by the legislature
(ii) Extent of hearings on key
findings undertaken by the
legislature.
B The SCPA conducts regular, in-depth hearings on the findings in the audit
reports, which involve calling senior officials from many, but not all,
audited entities to give evidence
(iii) Issuance of
recommended actions by the
legislature and
implementation by the
executive.
C The SCPA makes recommendations but evidence indicates that these are
not acted upon by the executive.
3.7 Donor Practices
The US, ROC, and Japan accounted for virtually all of ODA provided to the Marshall Islands during
the last three years (Table 3.5). Together, ODA from these countries represented 97% of total
reported ODA in 2009, as measured by disbursements. As the largest provider of aid, the US, under
the 2003 Compact of Free Association, provides GRMI with a base grant which is divided by GRMI
across the priority sectors of health, education, environmental protection and enhancement, and
infrastructure development and maintenance. Under separate agreements, it also provides other US
Federal grants.
Aid management is split between the MoF’s Office of Compact Implementation (OCI) and the
Economic Policy, Planning and Statistical Office (EPPSO) under the President’s Office.
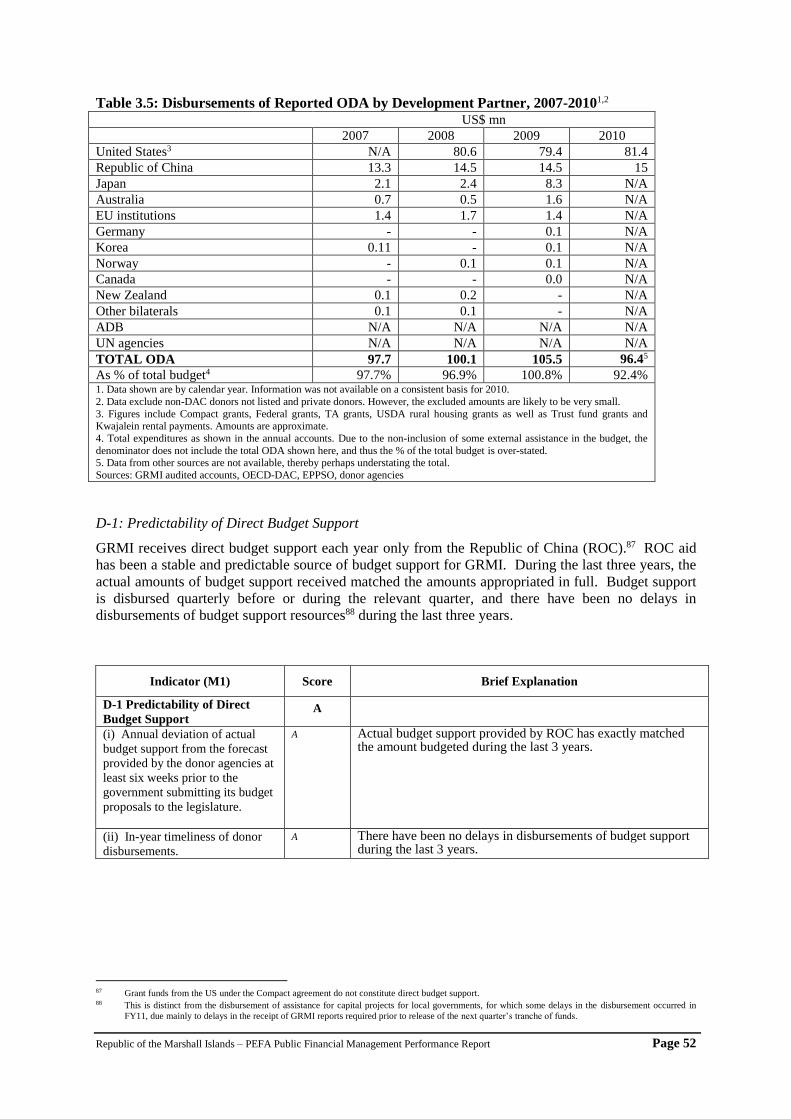
Republic of the Marshall Islands – PEFA Public Financial Management Performance Report Page 52
Table 3.5: Disbursements of Reported ODA by Development Partner, 2007-20101,2 US$ mn
2007 2008 2009 2010
United States3 N/A 80.6 79.4 81.4
Republic of China 13.3 14.5 14.5 15
Japan 2.1 2.4 8.3 N/A
Australia 0.7 0.5 1.6 N/A
EU institutions 1.4 1.7 1.4 N/A
Germany - - 0.1 N/A
Korea 0.11 - 0.1 N/A
Norway - 0.1 0.1 N/A
Canada - - 0.0 N/A
New Zealand 0.1 0.2 - N/A
Other bilaterals 0.1 0.1 - N/A
ADB N/A N/A N/A N/A
UN agencies N/A N/A N/A N/A
TOTAL ODA 97.7 100.1 105.5 96.45
As % of total budget4 97.7% 96.9% 100.8% 92.4% 1. Data shown are by calendar year. Information was not available on a consistent basis for 2010.
2. Data exclude non-DAC donors not listed and private donors. However, the excluded amounts are likely to be very small.
3. Figures include Compact grants, Federal grants, TA grants, USDA rural housing grants as well as Trust fund grants and Kwajalein rental payments. Amounts are approximate.
4. Total expenditures as shown in the annual accounts. Due to the non-inclusion of some external assistance in the budget, the
denominator does not include the total ODA shown here, and thus the % of the total budget is over-stated. 5. Data from other sources are not available, thereby perhaps understating the total.
Sources: GRMI audited accounts, OECD-DAC, EPPSO, donor agencies
D-1: Predictability of Direct Budget Support
GRMI receives direct budget support each year only from the Republic of China (ROC).87 ROC aid
has been a stable and predictable source of budget support for GRMI. During the last three years, the
actual amounts of budget support received matched the amounts appropriated in full. Budget support
is disbursed quarterly before or during the relevant quarter, and there have been no delays in
disbursements of budget support resources88 during the last three years.
Indicator (M1) Score Brief Explanation
D-1 Predictability of Direct
Budget Support A
(i) Annual deviation of actual
budget support from the forecast
provided by the donor agencies at
least six weeks prior to the
government submitting its budget
proposals to the legislature.
A Actual budget support provided by ROC has exactly matched the amount budgeted during the last 3 years.
(ii) In-year timeliness of donor
disbursements.
A There have been no delays in disbursements of budget support during the last 3 years.
87 Grant funds from the US under the Compact agreement do not constitute direct budget support. 88 This is distinct from the disbursement of assistance for capital projects for local governments, for which some delays in the disbursement occurred in
FY11, due mainly to delays in the receipt of GRMI reports required prior to release of the next quarter’s tranche of funds.
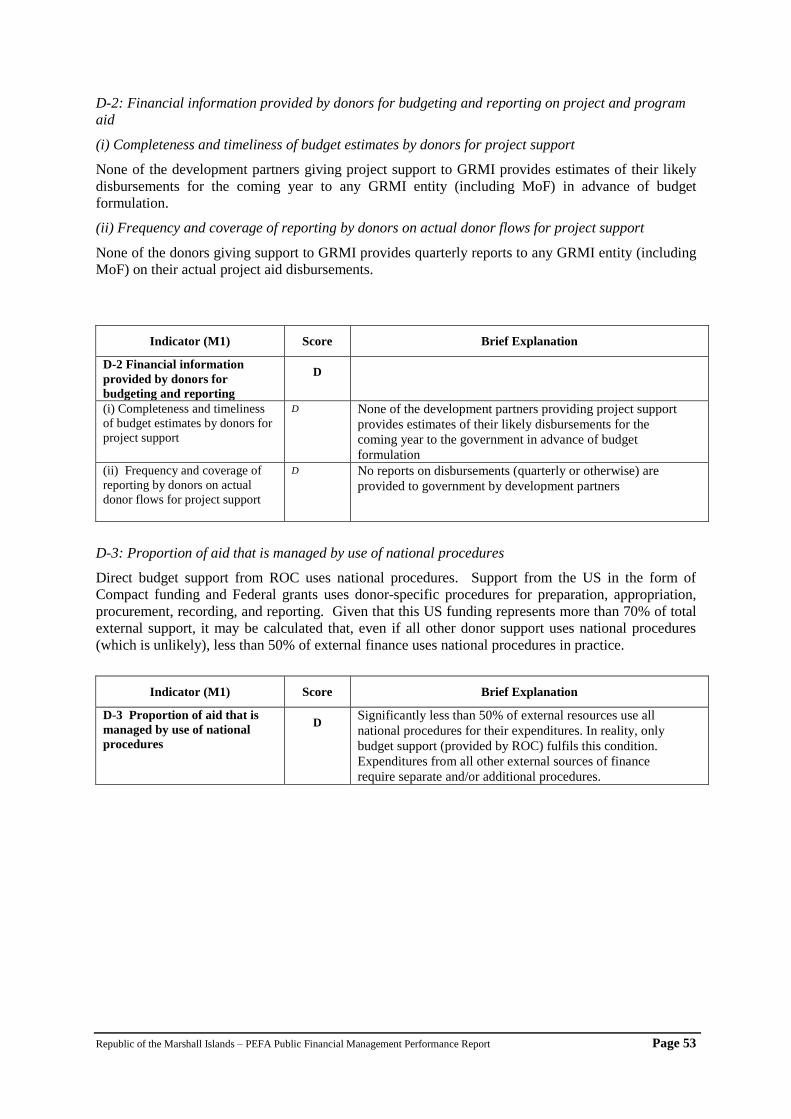
Republic of the Marshall Islands – PEFA Public Financial Management Performance Report Page 53
D-2: Financial information provided by donors for budgeting and reporting on project and program
aid
(i) Completeness and timeliness of budget estimates by donors for project support
None of the development partners giving project support to GRMI provides estimates of their likely
disbursements for the coming year to any GRMI entity (including MoF) in advance of budget
formulation.
(ii) Frequency and coverage of reporting by donors on actual donor flows for project support
None of the donors giving support to GRMI provides quarterly reports to any GRMI entity (including
MoF) on their actual project aid disbursements.
Indicator (M1) Score Brief Explanation
D-2 Financial information
provided by donors for
budgeting and reporting
D
(i) Completeness and timeliness
of budget estimates by donors for
project support
D None of the development partners providing project support
provides estimates of their likely disbursements for the
coming year to the government in advance of budget
formulation
(ii) Frequency and coverage of
reporting by donors on actual
donor flows for project support
D No reports on disbursements (quarterly or otherwise) are
provided to government by development partners
D-3: Proportion of aid that is managed by use of national procedures
Direct budget support from ROC uses national procedures. Support from the US in the form of
Compact funding and Federal grants uses donor-specific procedures for preparation, appropriation,
procurement, recording, and reporting. Given that this US funding represents more than 70% of total
external support, it may be calculated that, even if all other donor support uses national procedures
(which is unlikely), less than 50% of external finance uses national procedures in practice.
Indicator (M1) Score Brief Explanation
D-3 Proportion of aid that is
managed by use of national
procedures
D Significantly less than 50% of external resources use all
national procedures for their expenditures. In reality, only
budget support (provided by ROC) fulfils this condition.
Expenditures from all other external sources of finance
require separate and/or additional procedures.
Republic of the Marshall Islands – PEFA Public Financial Management Performance Report Page 54
4. Government Reform Process
4.1 General Description of Recent and On-Going Reforms
The Government has demonstrated its commitment to improving its public financial management
system in recent years through a series of measures aimed at improving the efficiency of resource use.
The most recent reforms have built on those achieved as part of the measures introduced under
Cabinet Minute or Executive Directive between 2008 to date, intended to strengthen the enabling
environment for private sector growth. Assistance is currently provided mainly by ADB and PFTAC
(IMF).
Tax and Revenue Reform and Modernization (TRAM) was endorsed by the Cabinet in June 2010 to
strengthen RMI tax administration and enforcement, provide ways and means to ensure fiscal
sustainability and promote sustainable private sector growth. At the time of this assessment, the
assessment team was told that the Bill would be introduced in the January 2012 session.
Weak financial positions among the SOEs triggered the government to develop a reform plan. GRMI
adopted a comprehensive recovery plan (CRP) for the energy company and six good practice
principles under SOEs reform in 2010. In the meantime, recognizing the need to control subsidies to
the SOEs, GRMI has decreased its aggregate annual subsidies in FY11 and FY12.
Although Vision 2018 was adopted as the national development plan in 2001, the document does not
identify priorities, sequence or estimates. Cabinet had approved a National Development Plan (NDP)
working group in May 2010. Two consultants have worked with Economic Planning, Policy,
Statistics Office (EPPSO) in the meantime. Active consultation and drafting is due to commence after
the new government is established. UNDP is providing an advisor for this exercise. The availability
of a sound NDP is expected to allow better budgeting and planning.
Public Sector Reform as recommended by the 2010 Comprehensive Adjustment Program (CAP)
report indicated 13 expenditure areas of focus. The Advisory Group recommended various
expenditure reductions to be implemented over three years that could, when fully implemented,
achieve a fiscal saving of $7-8 million annually. In line with such, a Bill to amend and decrease
Parliament’s contribution had been introduced in the August session, then subsequently deferred. The
civil service assessment TA has been secured through ADB, with a consultant scheduled to work in
RMI during December 2011. The budget for electricity allowances was also cut by half, anticipating
another ADB TA to review easement payments to landowners resulting in roughly a 50% difference
in expenditure. The Public Service Commission is also reviewing the current cost structure of
housing privileges, as a maximum of $750 per month is charged by all leasers irrespective of size,
location, and condition. Other selective items are also targeted with control mechanisms to decrease
pubic expenditures.
Recognized Public Financial Management (PFM) weaknesses resulted in a number of measures,
intended to strengthen the legislative framework and improve oversight of the use of public sector
resources, initiated by the Ministry of Finance. The Financial Management Act and Procurement
Code are on the frontline to be reviewed. Improved oversight and legislative scrutiny is also
evidenced by the strengthened and more active role of the Public Accounts Committee (PAC). The
Lean team initiative also has commenced in an attempt to build a more efficient procurement and
PFM system. System upgrade of the Financial Management Information System upgrades have
started, with the conclusion of phase one in mid 2011, to be followed by the second phase mid-2012.
The PEFA assessment is expected to be followed by the preparation of a roadmap to improve PFM
systems. Initiatives on a Debt Management Strategy and Fiscal Responsibility Legislation are also in
the pipeline through the assistance of ADB. The development of medium-term budgeting is also
planned to start in 2012, with the MoF co-ordinating the formulation of a Three Year Strategic Plan.
At the December 2010 Development Partners’ Meeting, RMI had pushed for assistance in Aid
Coordination and Management, intending to streamline and effectively manage aid and other
assistance benefiting the country. The Secretariat of the Pacific Community (SPC) and PIFS had
Republic of the Marshall Islands – PEFA Public Financial Management Performance Report Page 55
responded in mid 2011, with the plan to progress in 2012 an Aid Management Policy and legislative
changes to transfer ODA mandates from EPPSO to the Ministry of Finance Office of International
Development and Assistance (OIDA).
Reform is also visible at the Office of the Auditor General. With the newly appointed Auditor
General, the Government had supported an aggressive restructuring and additional budget support to
strengthen supervision and scrutiny of financial and performance audits of the government, local
governments, and SOEs. Partnership with the MoF to conduct internal investigations and non-
performance reviews illustrates a promising improvement in the PFM system.
4.2 Institutional Factors Supporting Reform Planning and Implementation
The Government has an agenda to reform its public sector and encourage private sector growth to
meet its overarching target of better accountability and transparency. It has recognized that this target
will require overcoming potentially significant institutional challenges. In his 2011 Budget
Statement, the Minister of Finance addressed a number of these challenges directly, including the
need for leadership on accountability and transparency, overcoming low implementation capacity, and
co-ordinating the reforms, all to begin in early 2012, with the results expected to become visible
beginning in 2013.
Government ownership and leadership of reform program
The achievement of recent improvements in the PFM system provides evidence of government
commitment to the reforms under the leadership of the Minister of Finance Jack J Ading, and the
Cabinet and Parliament members. At present, leadership for the PFM reforms appears strongest in the
MoF. The Government is developing plans to introduce and monitor medium term budgeting to
ensure results are monitored and accounted for.
More accountable institutions improve the incentives for good leadership, and the Government has
recognized that this implies changes in work ethics, structure, and behaviour. Similarly, enhanced
legislative and external scrutiny is recognized as a vehicle of improved accountability and
transparency. In this way, the increased emphasis on participation by the public in the budget and
audit reports is welcomed.
Overcoming low implementation capacity
The pace of reform is potentially hampered by constraints in implementation and absorptive capacity,
leading to delays in the execution of projects and programs. This issue is exacerbated by weaknesses
in technical capacities as higher salaries in the SOEs or off-island opportunities attract other
professionals with marketable skills. While expatriate consultants and experts are easily attainable
through assistance from development partners, local sustainability is questioned when participation
and capacity of local counterparts are insufficient. The recruitment and retention of qualified officials
will be particularly important to sustain the reform programs under way. As a response, GRMI has
introduced a Cabinet Minute to set SOE pay scale so as to match that of the Public Service
Commission’s.
Co-ordination of reforms
The Ministry of Finance and the Office of the President EPPSO are at the core of the public sector
reform program. Although the Government has introduced a series of CMs, this does not appear to be
sufficient to act as a road map for reforms since the plans do not contain a sequenced and costed work
plan with realistic timelines. There is a need for MoF to set priorities and expected results, identify
timelines for the medium-term, monitor implementation, and ensure good communication and
coordination between central and line ministries and respective stakeholders to ensure self-
sustainability post 2023, when the Compact of Free Association with the United States is expected to
expire.

Republic of the Marshall Islands – PEFA Public Financial Management Performance Report Page 56
Republic of the Marshall Islands – PEFA Public Financial Management Performance Report Page 57
List of Annexes
Annex A: List of stakeholders met
Annex B: List of documents consulted
Annex C: Evidence used for indicators
Annex D: Background data for PI to PI-3
Annex E: Terms of reference
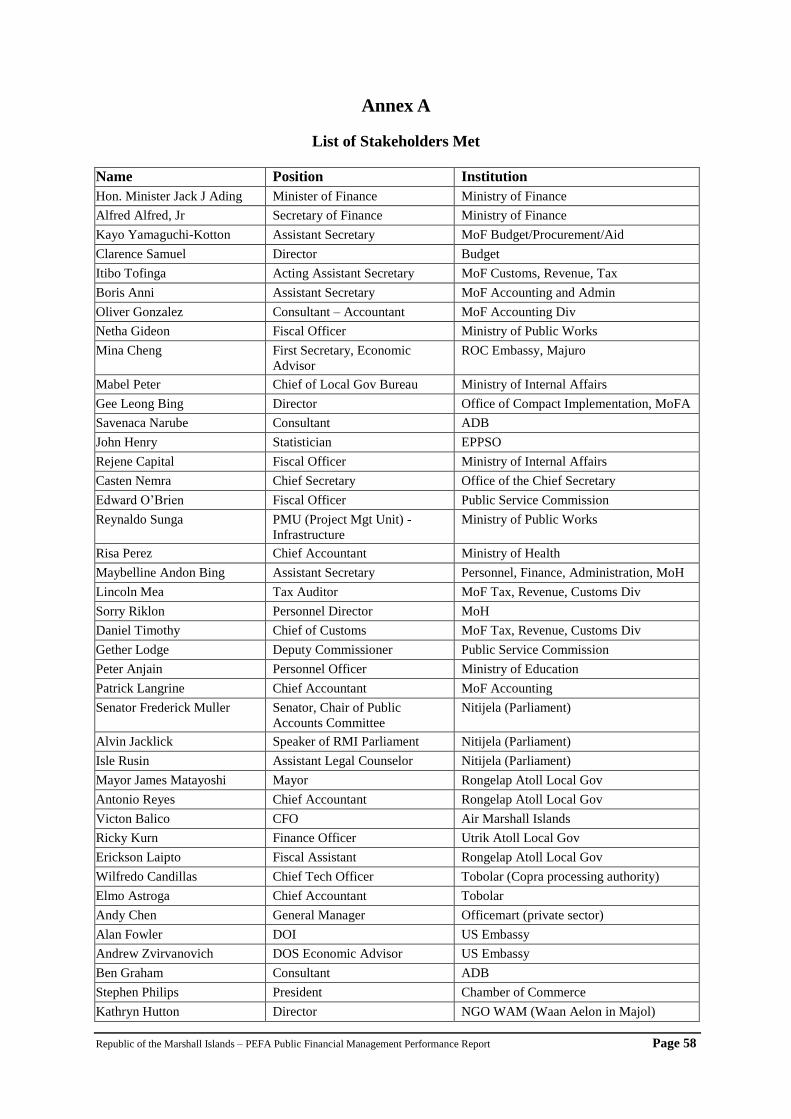
Republic of the Marshall Islands – PEFA Public Financial Management Performance Report Page 58
Annex A
List of Stakeholders Met
Name Position Institution
Hon. Minister Jack J Ading Minister of Finance Ministry of Finance
Alfred Alfred, Jr Secretary of Finance Ministry of Finance
Kayo Yamaguchi-Kotton Assistant Secretary MoF Budget/Procurement/Aid
Clarence Samuel Director Budget
Itibo Tofinga Acting Assistant Secretary MoF Customs, Revenue, Tax
Boris Anni Assistant Secretary MoF Accounting and Admin
Oliver Gonzalez Consultant – Accountant MoF Accounting Div
Netha Gideon Fiscal Officer Ministry of Public Works
Mina Cheng First Secretary, Economic
Advisor
ROC Embassy, Majuro
Mabel Peter Chief of Local Gov Bureau Ministry of Internal Affairs
Gee Leong Bing Director Office of Compact Implementation, MoFA
Savenaca Narube Consultant ADB
John Henry Statistician EPPSO
Rejene Capital Fiscal Officer Ministry of Internal Affairs
Casten Nemra Chief Secretary Office of the Chief Secretary
Edward O’Brien Fiscal Officer Public Service Commission
Reynaldo Sunga PMU (Project Mgt Unit) -
Infrastructure
Ministry of Public Works
Risa Perez Chief Accountant Ministry of Health
Maybelline Andon Bing Assistant Secretary Personnel, Finance, Administration, MoH
Lincoln Mea Tax Auditor MoF Tax, Revenue, Customs Div
Sorry Riklon Personnel Director MoH
Daniel Timothy Chief of Customs MoF Tax, Revenue, Customs Div
Gether Lodge Deputy Commissioner Public Service Commission
Peter Anjain Personnel Officer Ministry of Education
Patrick Langrine Chief Accountant MoF Accounting
Senator Frederick Muller Senator, Chair of Public
Accounts Committee
Nitijela (Parliament)
Alvin Jacklick Speaker of RMI Parliament Nitijela (Parliament)
Isle Rusin Assistant Legal Counselor Nitijela (Parliament)
Mayor James Matayoshi Mayor Rongelap Atoll Local Gov
Antonio Reyes Chief Accountant Rongelap Atoll Local Gov
Victon Balico CFO Air Marshall Islands
Ricky Kurn Finance Officer Utrik Atoll Local Gov
Erickson Laipto Fiscal Assistant Rongelap Atoll Local Gov
Wilfredo Candillas Chief Tech Officer Tobolar (Copra processing authority)
Elmo Astroga Chief Accountant Tobolar
Andy Chen General Manager Officemart (private sector)
Alan Fowler DOI US Embassy
Andrew Zvirvanovich DOS Economic Advisor US Embassy
Ben Graham Consultant ADB
Stephen Philips President Chamber of Commerce
Kathryn Hutton Director NGO WAM (Waan Aelon in Majol)
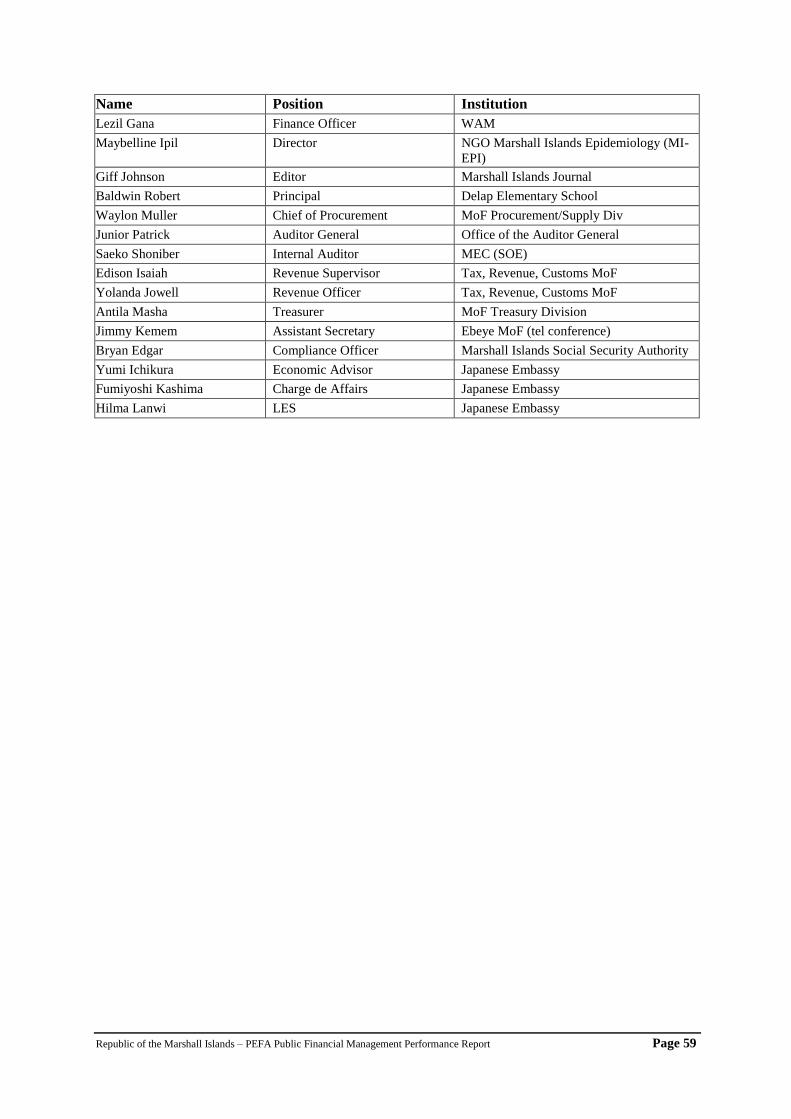
Republic of the Marshall Islands – PEFA Public Financial Management Performance Report Page 59
Name Position Institution
Lezil Gana Finance Officer WAM
Maybelline Ipil Director NGO Marshall Islands Epidemiology (MI-
EPI)
Giff Johnson Editor Marshall Islands Journal
Baldwin Robert Principal Delap Elementary School
Waylon Muller Chief of Procurement MoF Procurement/Supply Div
Junior Patrick Auditor General Office of the Auditor General
Saeko Shoniber Internal Auditor MEC (SOE)
Edison Isaiah Revenue Supervisor Tax, Revenue, Customs MoF
Yolanda Jowell Revenue Officer Tax, Revenue, Customs MoF
Antila Masha Treasurer MoF Treasury Division
Jimmy Kemem Assistant Secretary Ebeye MoF (tel conference)
Bryan Edgar Compliance Officer Marshall Islands Social Security Authority
Yumi Ichikura Economic Advisor Japanese Embassy
Fumiyoshi Kashima Charge de Affairs Japanese Embassy
Hilma Lanwi LES Japanese Embassy
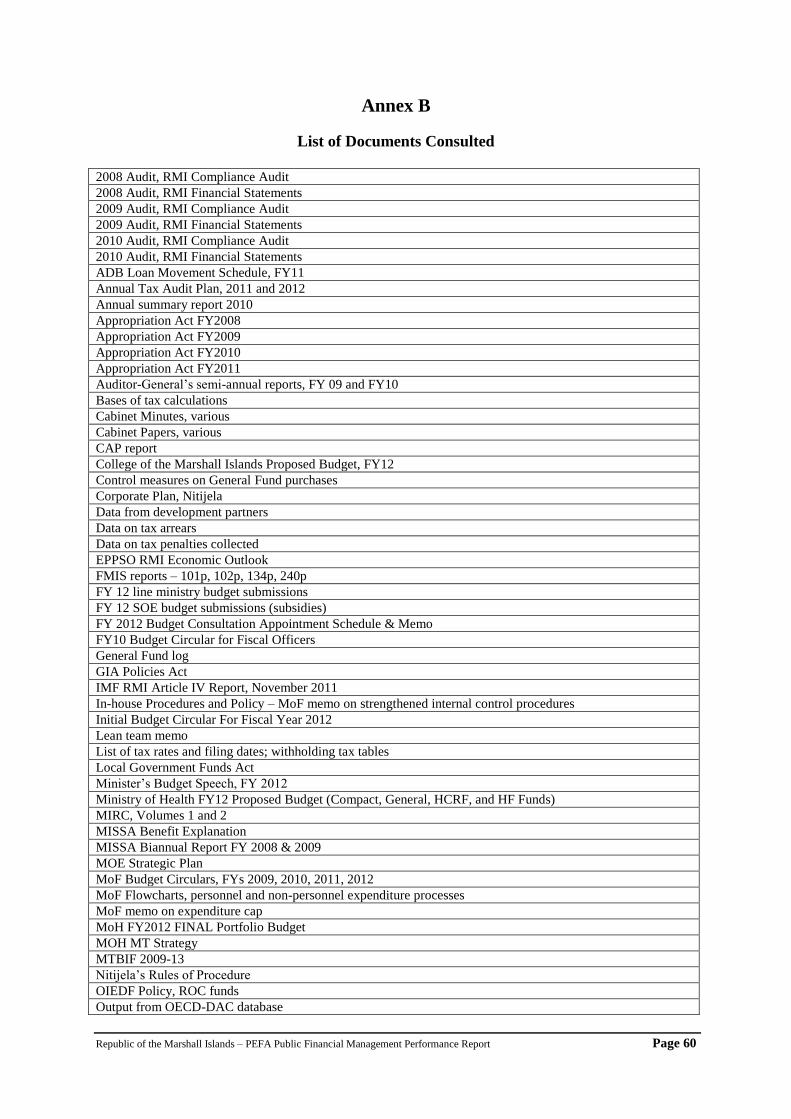
Republic of the Marshall Islands – PEFA Public Financial Management Performance Report Page 60
Annex B
List of Documents Consulted
2008 Audit, RMI Compliance Audit
2008 Audit, RMI Financial Statements
2009 Audit, RMI Compliance Audit
2009 Audit, RMI Financial Statements
2010 Audit, RMI Compliance Audit
2010 Audit, RMI Financial Statements
ADB Loan Movement Schedule, FY11
Annual Tax Audit Plan, 2011 and 2012
Annual summary report 2010
Appropriation Act FY2008
Appropriation Act FY2009
Appropriation Act FY2010
Appropriation Act FY2011
Auditor-General’s semi-annual reports, FY 09 and FY10
Bases of tax calculations
Cabinet Minutes, various
Cabinet Papers, various
CAP report
College of the Marshall Islands Proposed Budget, FY12
Control measures on General Fund purchases
Corporate Plan, Nitijela
Data from development partners
Data on tax arrears
Data on tax penalties collected
EPPSO RMI Economic Outlook
FMIS reports – 101p, 102p, 134p, 240p
FY 12 line ministry budget submissions
FY 12 SOE budget submissions (subsidies)
FY 2012 Budget Consultation Appointment Schedule & Memo
FY10 Budget Circular for Fiscal Officers
General Fund log
GIA Policies Act
IMF RMI Article IV Report, November 2011
In-house Procedures and Policy – MoF memo on strengthened internal control procedures
Initial Budget Circular For Fiscal Year 2012
Lean team memo
List of tax rates and filing dates; withholding tax tables
Local Government Funds Act
Minister’s Budget Speech, FY 2012
Ministry of Health FY12 Proposed Budget (Compact, General, HCRF, and HF Funds)
MIRC, Volumes 1 and 2
MISSA Benefit Explanation
MISSA Biannual Report FY 2008 & 2009
MOE Strategic Plan
MoF Budget Circulars, FYs 2009, 2010, 2011, 2012
MoF Flowcharts, personnel and non-personnel expenditure processes
MoF memo on expenditure cap
MoH FY2012 FINAL Portfolio Budget
MOH MT Strategy
MTBIF 2009-13
Nitijela’s Rules of Procedure
OIEDF Policy, ROC funds
Output from OECD-DAC database

Republic of the Marshall Islands – PEFA Public Financial Management Performance Report Page 61
RMI Budget Statement, FYs 2010, 2011, 2012
RMI Compact FPA
RMI Constitution
RMI Decrement Strategy
RMI Economic Statistics Tables, 2009
RMI Procurement Code
RMI Procurement Report
RMI SOE Reform document
RMI Vision 2018
Tax filing forms
TRAM report

Republic of the Marshall Islands – PEFA Public Financial Management Performance Report Page 62
Annex C
Evidence Used for Indicators
Indicator Specific Documentary Information Sources Used1
A. Credibility of the Budget
1. Aggregate expenditure out-turn compared
to original approved budget Appropriation Acts (original), FYs 2008, 2009, 2010, 2011
Annual Audited Accounts, FYs 2008, 2009, 2010
Preliminary accounts, FY 2011
2. Composition of expenditure out-turn
compared to original approved budget Appropriation Acts (original), FYs 2008, 2009, 2010, 2011
Annual Audited Accounts, FYs 2008, 2009, 2010
Preliminary accounts, FY 2011
3. Aggregate revenue out-turn compared to
original approved budget Appropriation Acts (original), FYs 2008, 2009, 2010, 2011
Annual Audited Accounts, FYs 2008, 2009, 2010
Preliminary accounts, FY 2011
4. Stock and monitoring of expenditure
payment arrears Stakeholder discussions
B. Comprehensiveness and Transparency
5. Classification of the budget RMI Chart of Accounts
6. Comprehensiveness of information
included in budget documentation Budget schedules, FYs 2009, 2010, 2011, 2012
7. Extent of unreported government
operations Annual Audited Accounts, FYs 2008, 2009, 2010
8. Transparency of Inter-Governmental
Fiscal Relations Annual Audited Accounts, FYs 2008, 2009, 2010
9. Oversight of aggregate fiscal risk from
other public sector entities Annual Audited Accounts, FYs 2008, 2009, 2010
10. Public access to key fiscal information Stakeholder discussions
C(i) Policy-Based Budgeting
11. Orderliness and participation in the
annual budget process Budget Call Circular, FYs 2009, 2010, 2011, 2012
Appropriation Acts, FYs 2009, 2010, 2011, 2012
MIRC
12. Multi-year perspective in fiscal planning,
expenditure policy and budgeting MIRC
Budget Schedules, FYs 2009, 2010, 2011, 2012
Strategic Development Program
Vision 2018
Health Sector Plan
Education Sector Plan
C (ii) Predictability and Control in Budget Execution
13. Transparency of taxpayer obligations
and liabilities Income Tax Act
Customs Act
14. Effectiveness of measures for taxpayer
registration and tax assessment Income Tax Act
Customs Act
Data on penalties collected
Tax audit plan
Tax audit criteria
15. Effectiveness in collection of tax
payments Stakeholder discussions
16. Predictability in the availability of funds
for commitment of expenditures MIRC
Control measures on General Fund purchases
Stakeholder discussions

Republic of the Marshall Islands – PEFA Public Financial Management Performance Report Page 63
Indicator Specific Documentary Information Sources Used1
17. Recording and management of cash
balances, debt and guarantees MIRC
Debt management worksheet
List of bank accounts
Report on bank balances
18. Effectiveness of payroll controls PSC Act
Examples of Personnel Action forms (filled-in)
General Fund log
19. Competition, value for money and
controls in procurement MIRC
Procurement Code
20. Effectiveness of internal controls for
non-salary expenditure MIRC
Annual compliance audit reports, FYs 2008, 2009, 2010
In-house Procedures and Policy – MoF memo on strengthened
internal control procedures
21. Effectiveness of internal audit N/A
C (iii) Accounting, Recording and Reporting
22. Timeliness and regularity of accounts
reconciliation Bank reconciliation statements
Bank balances log
23. Availability of information on resources
received by service delivery units Stakeholder discussions
24. Quality and timeliness of in-year budget
reports Expenditure Reports from FMIS
Stakeholder discussions
25. Quality and timeliness of annual
financial statements Annual audited accounts, Single Audit, FYs 2008, 2009, 2010
C (iv) External Scrutiny and Audit
26. Scope, nature and follow-up of external
audit Auditor-General’s Semi-Annual Reports, FYs 2009, 2010
Single audits, compliance reports and management letter
27. Legislative scrutiny of the annual budget
law Nitijela’s Rules of Procedure
Discussion with Nitijela stakeholders
28. Legislative scrutiny of external audit
reports Nitijela’s Rules of Procedure
Discussion with Nitijela stakeholders
D. Donor Practices
D-1 Predictability of Direct Budget Support Data from ROC
D-2 Financial information provided by
donors for budgeting and reporting on
project and program aid
OECD-DAC database
D-3 Proportion of aid that is managed by use
of national procedures Stakeholder discussions
Note: 1. Supplemented by detailed interviews with stakeholders
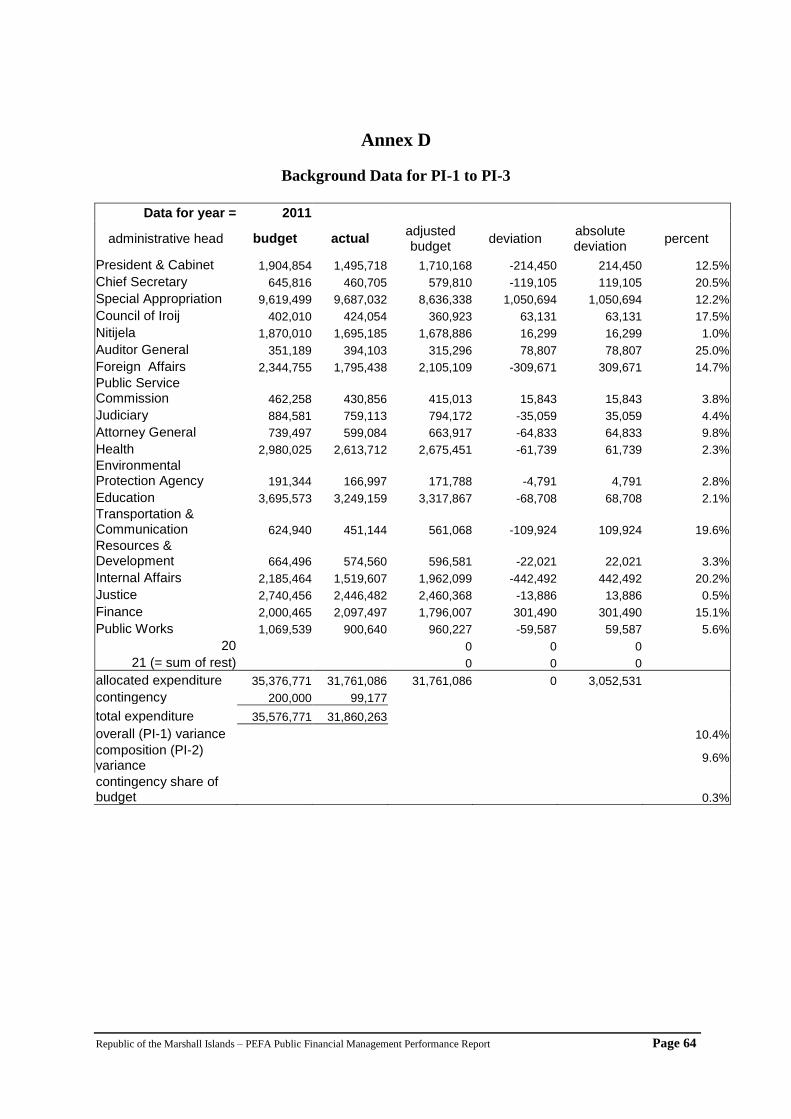
Republic of the Marshall Islands – PEFA Public Financial Management Performance Report Page 64
Annex D
Background Data for PI-1 to PI-3
Data for year = 2011
administrative head budget actual adjusted budget
deviation absolute deviation
percent
President & Cabinet 1,904,854 1,495,718 1,710,168 -214,450 214,450 12.5%
Chief Secretary 645,816 460,705 579,810 -119,105 119,105 20.5%
Special Appropriation 9,619,499 9,687,032 8,636,338 1,050,694 1,050,694 12.2%
Council of Iroij 402,010 424,054 360,923 63,131 63,131 17.5%
Nitijela 1,870,010 1,695,185 1,678,886 16,299 16,299 1.0%
Auditor General 351,189 394,103 315,296 78,807 78,807 25.0%
Foreign Affairs 2,344,755 1,795,438 2,105,109 -309,671 309,671 14.7%
Public Service Commission 462,258 430,856 415,013 15,843 15,843 3.8%
Judiciary 884,581 759,113 794,172 -35,059 35,059 4.4%
Attorney General 739,497 599,084 663,917 -64,833 64,833 9.8%
Health 2,980,025 2,613,712 2,675,451 -61,739 61,739 2.3%
Environmental Protection Agency 191,344 166,997 171,788 -4,791 4,791 2.8%
Education 3,695,573 3,249,159 3,317,867 -68,708 68,708 2.1%
Transportation & Communication 624,940 451,144 561,068 -109,924 109,924 19.6%
Resources & Development 664,496 574,560 596,581 -22,021 22,021 3.3%
Internal Affairs 2,185,464 1,519,607 1,962,099 -442,492 442,492 20.2%
Justice 2,740,456 2,446,482 2,460,368 -13,886 13,886 0.5%
Finance 2,000,465 2,097,497 1,796,007 301,490 301,490 15.1%
Public Works 1,069,539 900,640 960,227 -59,587 59,587 5.6%
20 0 0 0 21 (= sum of rest) 0 0 0 allocated expenditure 35,376,771 31,761,086 31,761,086 0 3,052,531
contingency 200,000 99,177
total expenditure 35,576,771 31,860,263
overall (PI-1) variance
10.4%
composition (PI-2) variance
9.6%
contingency share of budget
0.3%
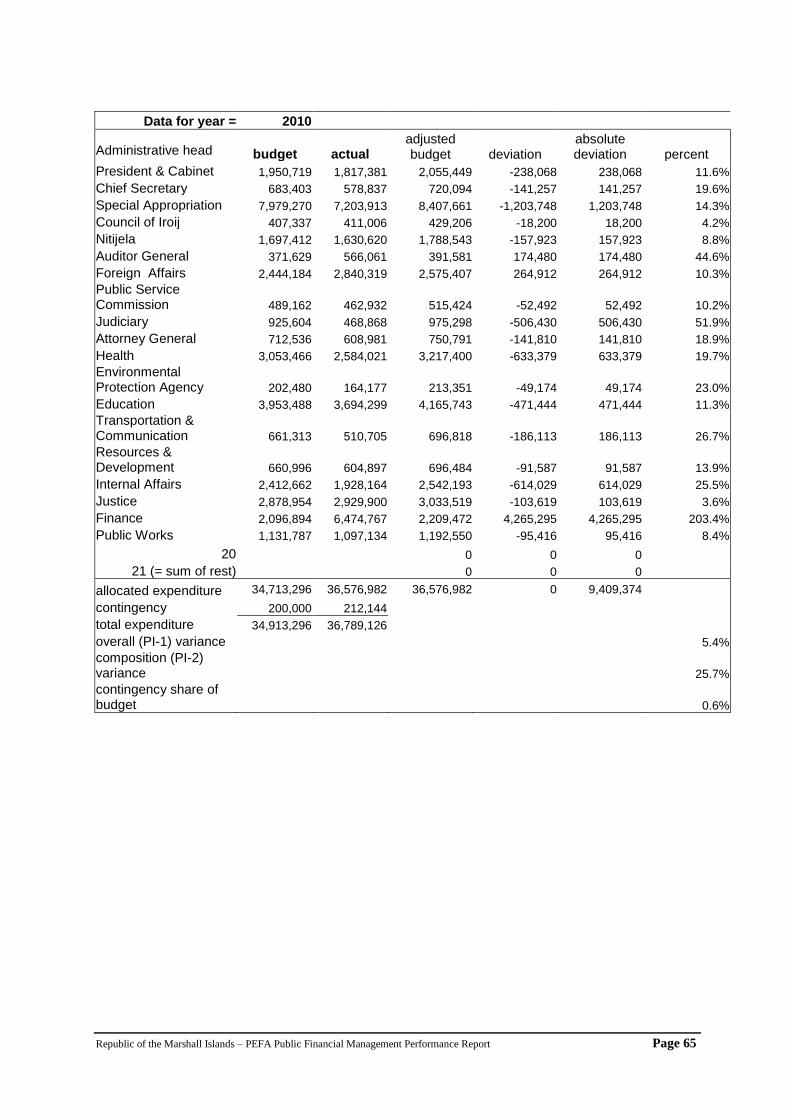
Republic of the Marshall Islands – PEFA Public Financial Management Performance Report Page 65
Data for year = 2010
Administrative head budget actual adjusted budget deviation
absolute deviation percent
President & Cabinet 1,950,719 1,817,381 2,055,449 -238,068 238,068 11.6%
Chief Secretary 683,403 578,837 720,094 -141,257 141,257 19.6%
Special Appropriation 7,979,270 7,203,913 8,407,661 -1,203,748 1,203,748 14.3%
Council of Iroij 407,337 411,006 429,206 -18,200 18,200 4.2%
Nitijela 1,697,412 1,630,620 1,788,543 -157,923 157,923 8.8%
Auditor General 371,629 566,061 391,581 174,480 174,480 44.6%
Foreign Affairs 2,444,184 2,840,319 2,575,407 264,912 264,912 10.3%
Public Service Commission 489,162 462,932 515,424 -52,492 52,492 10.2%
Judiciary 925,604 468,868 975,298 -506,430 506,430 51.9%
Attorney General 712,536 608,981 750,791 -141,810 141,810 18.9%
Health 3,053,466 2,584,021 3,217,400 -633,379 633,379 19.7%
Environmental Protection Agency 202,480 164,177 213,351 -49,174 49,174 23.0%
Education 3,953,488 3,694,299 4,165,743 -471,444 471,444 11.3%
Transportation & Communication 661,313 510,705 696,818 -186,113 186,113 26.7%
Resources & Development 660,996 604,897 696,484 -91,587 91,587 13.9%
Internal Affairs 2,412,662 1,928,164 2,542,193 -614,029 614,029 25.5%
Justice 2,878,954 2,929,900 3,033,519 -103,619 103,619 3.6%
Finance 2,096,894 6,474,767 2,209,472 4,265,295 4,265,295 203.4%
Public Works 1,131,787 1,097,134 1,192,550 -95,416 95,416 8.4%
20 0 0 0 21 (= sum of rest) 0 0 0 allocated expenditure 34,713,296 36,576,982 36,576,982 0 9,409,374
contingency 200,000 212,144
total expenditure 34,913,296 36,789,126
overall (PI-1) variance
5.4%
composition (PI-2) variance
25.7%
contingency share of budget 0.6%
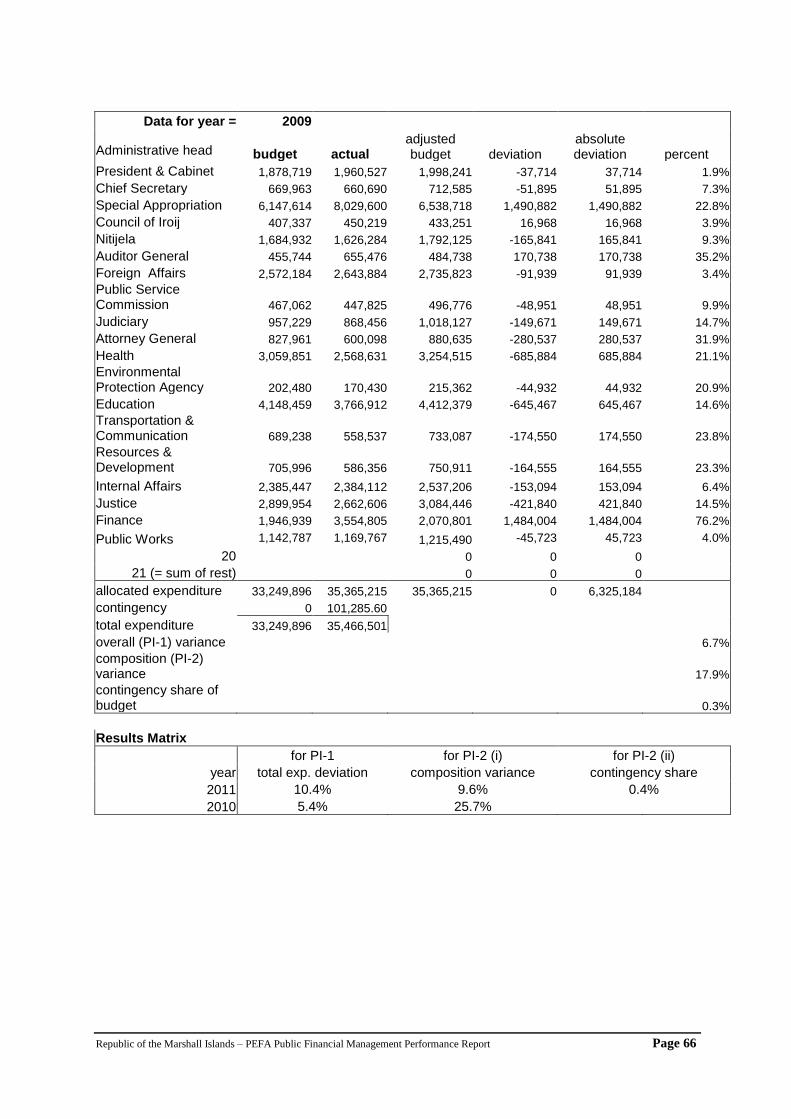
Republic of the Marshall Islands – PEFA Public Financial Management Performance Report Page 66
Data for year = 2009
Administrative head budget actual adjusted budget deviation
absolute deviation percent
President & Cabinet 1,878,719 1,960,527 1,998,241 -37,714 37,714 1.9%
Chief Secretary 669,963 660,690 712,585 -51,895 51,895 7.3%
Special Appropriation 6,147,614 8,029,600 6,538,718 1,490,882 1,490,882 22.8%
Council of Iroij 407,337 450,219 433,251 16,968 16,968 3.9%
Nitijela 1,684,932 1,626,284 1,792,125 -165,841 165,841 9.3%
Auditor General 455,744 655,476 484,738 170,738 170,738 35.2%
Foreign Affairs 2,572,184 2,643,884 2,735,823 -91,939 91,939 3.4%
Public Service Commission 467,062 447,825 496,776 -48,951 48,951 9.9%
Judiciary 957,229 868,456 1,018,127 -149,671 149,671 14.7%
Attorney General 827,961 600,098 880,635 -280,537 280,537 31.9%
Health 3,059,851 2,568,631 3,254,515 -685,884 685,884 21.1%
Environmental Protection Agency 202,480 170,430 215,362 -44,932 44,932 20.9%
Education 4,148,459 3,766,912 4,412,379 -645,467 645,467 14.6%
Transportation & Communication 689,238 558,537 733,087 -174,550 174,550 23.8%
Resources & Development 705,996 586,356 750,911 -164,555 164,555 23.3%
Internal Affairs 2,385,447 2,384,112 2,537,206 -153,094 153,094 6.4%
Justice 2,899,954 2,662,606 3,084,446 -421,840 421,840 14.5%
Finance 1,946,939 3,554,805 2,070,801 1,484,004 1,484,004 76.2%
Public Works 1,142,787 1,169,767 1,215,490 -45,723 45,723 4.0%
20 0 0 0 21 (= sum of rest) 0 0 0 allocated expenditure 33,249,896 35,365,215 35,365,215 0 6,325,184
contingency 0 101,285.60
total expenditure 33,249,896 35,466,501
overall (PI-1) variance
6.7%
composition (PI-2) variance
17.9%
contingency share of budget 0.3%
Results Matrix for PI-1 for PI-2 (i) for PI-2 (ii)
year total exp. deviation composition variance contingency share
2011 10.4% 9.6% 0.4%
2010 5.4% 25.7%
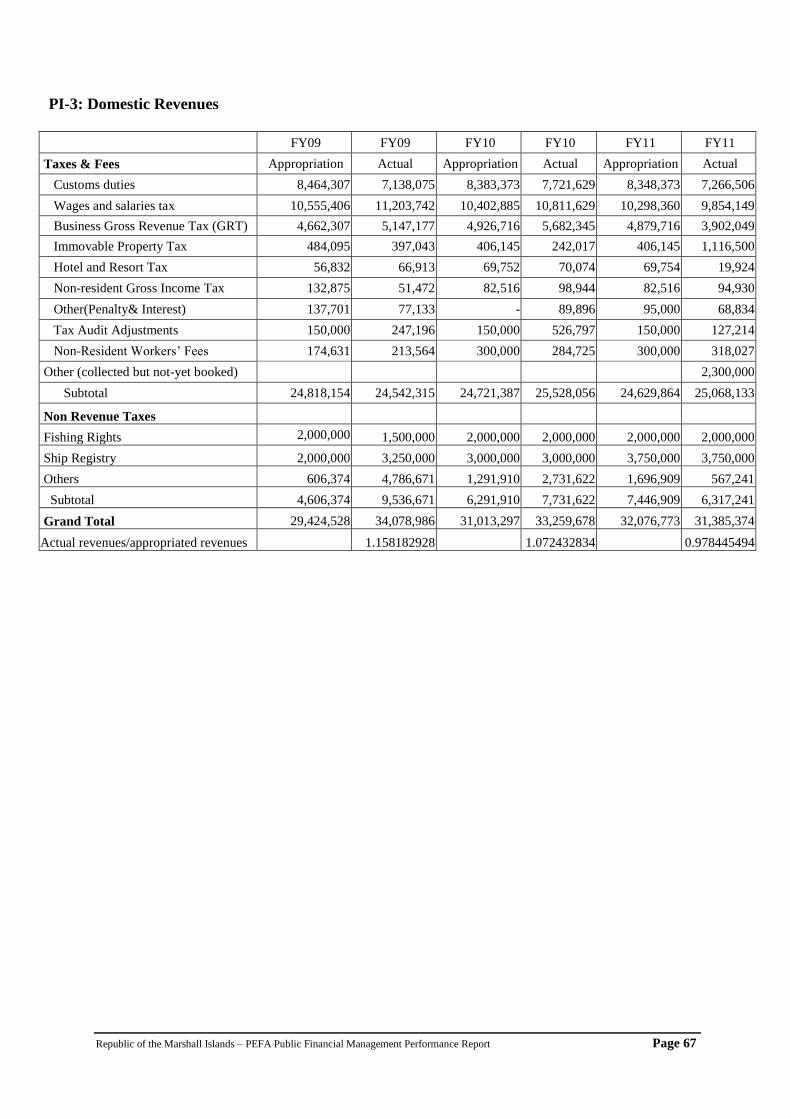
Republic of the Marshall Islands – PEFA Public Financial Management Performance Report Page 67
PI-3: Domestic Revenues
FY09 FY09 FY10 FY10 FY11 FY11
Taxes & Fees Appropriation Actual Appropriation Actual Appropriation Actual
Customs duties 8,464,307 7,138,075 8,383,373 7,721,629 8,348,373 7,266,506
Wages and salaries tax 10,555,406 11,203,742 10,402,885 10,811,629 10,298,360 9,854,149
Business Gross Revenue Tax (GRT) 4,662,307 5,147,177 4,926,716 5,682,345 4,879,716 3,902,049
Immovable Property Tax 484,095 397,043 406,145 242,017 406,145 1,116,500
Hotel and Resort Tax 56,832 66,913 69,752 70,074 69,754 19,924
Non-resident Gross Income Tax 132,875 51,472 82,516 98,944 82,516 94,930
Other(Penalty& Interest) 137,701 77,133 - 89,896 95,000 68,834
Tax Audit Adjustments 150,000 247,196 150,000 526,797 150,000 127,214
Non-Resident Workers’ Fees 174,631 213,564 300,000 284,725 300,000 318,027
Other (collected but not-yet booked) 2,300,000
Subtotal 24,818,154 24,542,315 24,721,387 25,528,056 24,629,864 25,068,133
Non Revenue Taxes
Fishing Rights 2,000,000 1,500,000 2,000,000 2,000,000 2,000,000 2,000,000
Ship Registry 2,000,000 3,250,000 3,000,000 3,000,000 3,750,000 3,750,000
Others 606,374 4,786,671 1,291,910 2,731,622 1,696,909 567,241
Subtotal 4,606,374 9,536,671 6,291,910 7,731,622 7,446,909 6,317,241
Grand Total 29,424,528 34,078,986 31,013,297 33,259,678 32,076,773 31,385,374
Actual revenues/appropriated revenues
1.158182928
1.072432834
0.978445494
Republic of the Marshall Islands – PEFA Public Financial Management Performance Report Page 68
Annex E
Terms of Reference
PEFA Assessment in the Republic of the Marshall Islands
Draft Concept Note 89
1. Background and context
The Government of the Republic of the Marshall Islands (GoRMI) is currently facing a challenging
socioeconomic and fiscal situation characterized by:
o stagnant or limited economic growth prospects;
o a growing population placing demand on social services such as education and health and
more use by the population of these services; and
o actual reductions in amended Compact of Free Association grant funds flows and some, but
limited, opportunities for domestic revenue generation.
The RMI’s economic performance since 2000 has been positive except for a 1.6 percent decrease in
GDP in 2008 and a 2.1 percent decrease in 2009. The positive factors of growth throughout the
decade have been the stable input of funds provided through the amended U.S.-RMI Compact of Free
Association (hereinafter, the Compact), some private sector growth led by the fisheries and
construction sectors, and more stable fiscal planning as opposed to previous practices during the late
1980s and 1990s.
The RMI’s economy, since amended Compact implementation, has weathered regional and
international economic impacts including regional health and natural disaster crises in the 2003-07
period, worldwide inflation in 2008 that severely impacted the energy sector and energy and
consumer goods costs, and worldwide recession since late 2008 that has severely handicapped all
aspects of the RMI economy, resulting in the negative growth rates for 2008 and 2009. Economic
stagnation continued into 2010 with more positive prospects anticipated in FY11 and over the
medium term given improved global and regional economic performance and measures taken by the
Government to implement tax and expenditure reforms.
The RMI’s population has historically increased but, in recent times, the growth rate has decreased.
While results from the 2011 census have not yet been fully analyzed, preliminary estimates indicate a
still growing population. There is a notable increase in statistics showing a demand for more
education and health services from increases in the youth population and old age population.
Increased investments in these sectors have been made since the early 2000s. Based on net air
passenger movements, there has been an increase in movement of people out of the RMI during
periods of economic downturn. The movement is believed to be due to citizens leaving to find
employment or for education purposes, mainly in the United States given amended Compact
immigration provisions.
The labor force has witnessed swings in the relative opportunities available in the public and private
sectors. The public sector remains the major employer. But, the private sector has become more
resilient and diversified than in past decades. The private sector over the past decade has employed
55-57 percent of the employed workforce. But, the public sector share has increased in recent years,
89 This note incorporates material from an earlier note originally drafted by Mary Betley (Advisor to PFTAC, May 2011) and subsequently modified by Ron
Hackett. Portions of the current note relating to the macroeconomic and fiscal context were adapted from documents prepared by the GoMI in March
2011. The prior version of this note was discussed briefly with the Assistant Secretary for Budget during my September Mission to the Marshalls for the
Self-Assessment Exercise. The original version was reviewed with the Finance Secretary at the end of Mary Betley’s April training visit.
Republic of the Marshall Islands – PEFA Public Financial Management Performance Report Page 69
because of the addition of teachers to the civil service rolls and because increased investments in the
health and education infrastructure since 2004 have resulted in more jobs in those sectors. Declines in
the fisheries, construction, and tourism industries, as well as cutbacks in Marshallese employment at
the U.S. Army base at Kwajalein Atoll (USAKA), have affected many Marshallese, and resulted in
very high unemployment for youth.
The only instrument available to the Government to impact the economy is its use of the budget. The
RMI’s budget during the period 2004-08 was expansionary with spending increases in health,
education, environmental protection and management, and infrastructure development and
maintenance. Most of the increased infrastructure investment was in the education and health sectors
along with a major U.S. Federal Aviation Administration project to upgrade the Amata Kabua
International airport.
Since it was known that such expenditure increases would not be sustainable in the medium term
because of the annual decrements to the amended Compact’s sector grant funding, effort was made to
increase domestic revenue. But, external economic circumstances placed the RMI in a fiscally
untenable position. The ability to maintain an adequate and balanced budget became more challenging
from 2008 to the present time. Because of this, in 2010, the Government agreed to two major reform
programs.
On the revenue side, the Cabinet adopted the Tax Reform and Modernization program (TRAM) with
the main element being the movement toward a value-added tax. When implemented (planned for
2012), the reform is forecast to be revenue neutral but can be more positive if more production and
services are captured and there is improved administration.
On the expenditure side, the Cabinet adopted the Comprehensive Adjustment Program (CAP). The
CAP calls for wholesale cuts over the medium term in civil service positions and related costs,
reductions in government allowances and support costs, reduction or elimination of grants and
subsidies, and organization and facilities consolidation.
A roadmap for PFM reform for Pacific Island countries was produced in 2010. It sets out the key
principles which should guide sustainable PFM reforms in the region and provides a broad framework
within which these principles may be applied. It recognises the importance of government ownership
and leadership of the process. It also highlights the role that PEFA assessments can play in
identifying critical weaknesses and in building consensus around the PFM reform agenda.
The FY11 budget was the first budget to take into account these reforms. Various aspects of the CAP
reductions were included along with across-the-board expenditure cuts. At the same time, the
Government committed to (as part of an Asian Development Bank loan package) the Public Sector
Comprehensive Reform Program (PSCRP), and agreed to set aside funds for an RMI contribution to
the Compact Trust Fund. The FY11 budget reflects these changes and commitments.
The FY09-14 Medium Term Budget and Investment Framework (MTBIF) takes into account the
FY11 budget changes as well as future commitments and prospects for the FY12-14 period. With
these forecasts, the RMI believes it can maintain a stable budget environment if expenditures are
reduced in certain areas while maintaining or increasing investments in priority areas.
The medium term outlook for revenue anticipates relative stability from conservative economic
growth prospects. Some growth in domestic tax revenue is anticipated from increases
in fees and charges such as for the Ship Registry and possibly for fishing licenses. In addition, an
expected increase in amended Compact Ebeye Specials Needs funding as of FY14 will help stem the
reduction in amended Compact sector grant funding. However, current regional and
international economic and natural disaster factors may hinder domestic tax generation once
again.
Republic of the Marshall Islands – PEFA Public Financial Management Performance Report Page 70
With regard to expenditures in the medium-term, the GOMI expects to continue applying the CAP
reforms. While preliminary steps have been taken, the government believes more wholesale
application is warranted over the medium term. Such application of the reforms will help to free up
funds to maintain or increase investments in the priority sectors of health and education (which also
have to obtain efficiencies and apply reforms) as well as maintain infrastructure and related
maintenance investments.
The Government’s medium-/long-term strategic development plan framework, “Vision 2018”,
includes governance, strengthening the financial and fiscal situation, and improving resource
allocation as three of its key broad strategies. In conjunction with this plan, the Government is
undertaking a number of PFM reform measures. Short-term measures are mainly centred on budget
policy, including reductions in the wagebill and measures to increase domestic revenue. Longer-term
systemic changes include performance-based budgeting for the Compact ministries (e.g. education),
and strengthening of external audit.
The Government believes that with a conservative growth path and the application of substantive
expenditure reforms, the RMI can generate budget surpluses which can be used to increase
investments in priority sectors or be investment into the Compact Trust Fund.
The Government intends to put together its own roadmap to guide the next phase of its reforms of
PFM systems and practices and aims to use the PEFA framework as an important input into the
process. This Concept Note outlines the objectives, methodology, timetable and inputs for a PEFA
assessment and preparation of a PFM Performance Report for RMI.
2. Purpose of assessment
The assessment will have a triple purpose: (i) to measure the current performance of the public
financial management (PFM) systems using an objective, internationally-recognised standard; (ii) to
set a baseline for future monitoring of progress against this standard; and (iii) to give country officials
experience in using the PEFA tool so that they can periodically apply the criteria for good practice on
which it is built to conduct their own stock-take. It will contribute to the preparation by government
of its PFM reform roadmap.
3. The PEFA Framework
The PEFA program was established to provide a framework, based on international experience and
widely accepted good practices, to assess and monitor the performance of public financial
management (PFM) of countries90. It has been developed by the PEFA partners, in collaboration with
the OECD/DAC Joint Venture on PFM, as a tool to provide reliable information on the performance
of their PFM systems, processes and institutions – and deliver progress reports thereof over time.
The PEFA Performance Measurement Framework includes a set of 28 high level indicators (listed in
Annex 1) and sixty-nine measurement dimensions, which measure the performance of PFM systems,
processes and institutions and a PFM Performance Report (PFM-PR) that reports on PFM
performance as measured by the indicators. The indicators are structured into three categories:
(i) PFM system out-turns: these capture the immediate results of the PFM system in terms of actual
expenditures and revenues by comparing them to the original approved budget, as well as level of
and changes in expenditure arrears.
(ii) Cross-cutting features of the PFM system: these capture the comprehensiveness and
transparency of the PFM system across the whole of the budget cycle.
90 See www.pefa.org
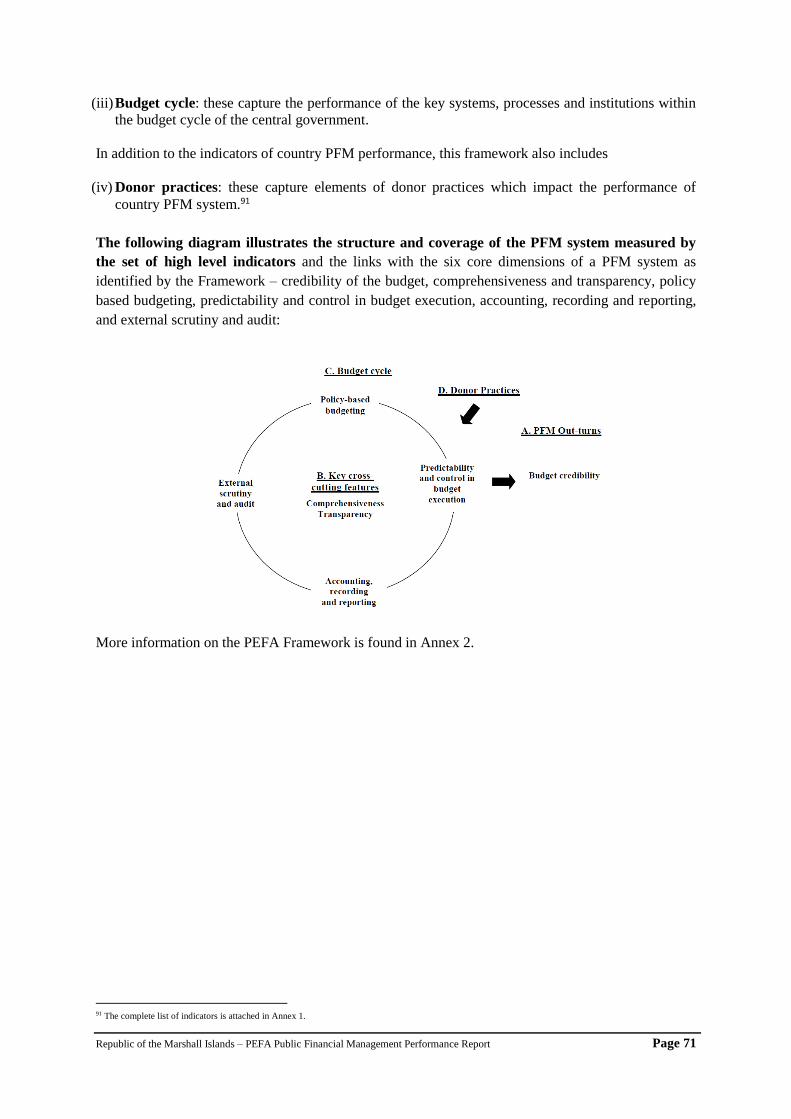
Republic of the Marshall Islands – PEFA Public Financial Management Performance Report Page 71
(iii) Budget cycle: these capture the performance of the key systems, processes and institutions within
the budget cycle of the central government.
In addition to the indicators of country PFM performance, this framework also includes
(iv) Donor practices: these capture elements of donor practices which impact the performance of
country PFM system.91
The following diagram illustrates the structure and coverage of the PFM system measured by
the set of high level indicators and the links with the six core dimensions of a PFM system as
identified by the Framework – credibility of the budget, comprehensiveness and transparency, policy
based budgeting, predictability and control in budget execution, accounting, recording and reporting,
and external scrutiny and audit:
More information on the PEFA Framework is found in Annex 2.
91 The complete list of indicators is attached in Annex 1.

Republic of the Marshall Islands – PEFA Public Financial Management Performance Report Page 72
4. Methodology
PFTAC has been asked by Pacific Forum Economic Ministers as well as donors in the region to
coordinate PEFA Assessments. The model that PFTAC is applying to the current assessment, and
which it plans to apply to future assessments will involve two phases:
Phase I (Conducted in the RMI in mid- September by PFTAC’s PFM Advisor) will be a self-
assessment. This phase:
o identified key senior staff (and persons from other organizations) relevant and knowledgeable
about each of the PFM processes/procedures to be assessed;
o reviewed with them each indicator, the criteria that need to be met for each rating level for the
indicator, the required supporting documentation, and the scoring procedures;
o assembled essential supporting documentation; and
o produced staff generated self-assessments for each indicator (the results of which will be
discussed in a forthcoming report prior to the Phase II formal assessment).
o introduced the assessment team to the OECD-MAPS (procurement assessment)
This phase is intended as an educational/preparatory engagement for staff on the specifics of each
indicator and as an information gathering effort. During these sessions participants will be
encouraged to consider using the indicators to do their own regular stock-take of operations to
monitor progress toward PFM reforms. Copies of the self-assessments will be collected by the
PFTAC PFM advisor for input into Phase II.
This Phase is also particularly important for identifying regional PIC talent for participation in
future PEFA assessment missions.
Phase II, occurring roughly 1 month after Phase I (tentatively scheduled to start Oct 24 in RMI),
will be conducted by a joint national-consultant assessment team. The national-consultant team
will be lead by a consultant with experience in undertaking PEFA assessments 92 . This
methodology ensures a government-led approach that is, at the same time, externally validated.
The approach will involve a series of team-wide consultations with relevant stakeholders.
Ensuring that all team-members are actively involved in each of the meetings will promote joint
ownership of the findings, provide inter-agency challenge and triangulation of stakeholders’
responses, and overcome possible negative incentives from interviewing colleagues. The
consultant(s) will provide quality assurance of the team’s use of the PEFA framework93 as well as
independent (external) validation of the findings as they emerge. The procurement expert is
expected to incorporate the OECD-MAPS assessment items (or the modified draft WB-Australian
version of the OECD-MAPS instrument) into his work as a supplemental guide for the disciplined
gathering of comprehensive information needed to complete the procurement items in PEFA
The scope of the RMI assessment will focus on the PFM systems for Central Government, including
any transfers that are made from central government to the municipalities and SOE’s. The assessment
will examine financial reporting from the SOE’s and municipalities to the Central Government, but
will not include a detailed review of the all aspects of the FM systems for those entities.
Likely sources of information are summarised in Annex 3 and a generic list of stake-holders is found
in Annex 4.
92 As of October 6 we have confirmation that the lead consultant will be Mary Betley. She will be supported by ??a procurement expert from the
Commonwealth Pacific Governance Facility (Mose Saitala) ?? and by Sanjesh Naidu, an Economic Advisor from the Pacific Islands Forum Secretariat
with regional PFM experience 93 In April 2011 PFTAC sponsored a workshop in Majuro for GoMI officials on the PEFA Framework. Some of this content was repeated during the Phase I
Self-assessment effort.
Republic of the Marshall Islands – PEFA Public Financial Management Performance Report Page 73
5. Implementation schedule, timetable and deliverables
Work on the PEFA assessment started with the April training and continued in September with the
Phase I self-assessment. Phase II is tentatively scheduled to begin around late October. The
assessment is expected to be completed by December, including 1-2 weeks for stakeholder video-
conference consultations. Annex 5 shows a detailed implementation schedule and the responsible
party.
The methodology for Phase II provides for two distinct strands of the assessment team’s joint
working:
stakeholder consultations (field visits), which are expected to take around two weeks. In
order to ensure that this time is used efficiently, significant preparatory work will be
undertaken beforehand.
Report finalization after the circulation of the draft report and the receipt of comments. This
would be expected to take up to one week.
As indicated above, Phase II will start with an initial one-day preparation/review workshop prior to
the stakeholder consultations in order to review with key stakeholders the materials presented in the
earlier training and self-assessment exercise. This workshop would be for both senior government
officials and for those to be interviewed. Near the end of the consultations, a half-day workshop to
discuss preliminary findings will be held. Finally, a half-day dissemination workshop (likely via
video-conference) will be held after the draft report has been circulated in order to discuss
stakeholders’ comments and to faciliate finalization of the report.
The main deliverable will be the PFM-Performance Report (PFM-PR), drafted in accordance with the
PEFA Guidelines (updated to include the three revised indicators).
The major risk to the successful completion of the PEFA Assessment would be turnover of key
officials who have already been through the PEFA training and Self-Assessment exercise. While such
an occurrence is not likely because of the upcoming elections, the mitigation strategy would either
involve lengthening the mission to include an education session for the new officlals, or rescheduling
the effort to a latter time.
6. Stakeholders involved
National stakeholders will be involved at two levels. An oversight group will provide the overall
oversight of the exercise. It would be sufficiently high-level to facilitate senior government
ownership of the PEFA. The group is likely to be comprised of the following members:
o Alfred Alfred, Jr., Secretary of Finance,
o Chief Secretary
o Clerk of Cabinet
o Secretary of Foreign Affairs
o Senator Frederick Muller, Chair of Public Accounts Committee, and
o Junior Patrick, Auditor- General.
The team is expected to be led by the Secretary of Finance. The group will be convened initially
during the Concept Note/preparatory stage and subsequently will be briefed by the assessment team
regularly during the assessment. It will provide the senior management framework for dissemination
and practical follow-up of the results.
The government-led joint assessment team will be responsible for undertaking the assessment itself.
From the government/national side, the team will comprise some or all of the following:
o Kayo Yamaguchi-Kotton, Assistant Secretary (Budget, OIDA, Procurement/Supply)),
Ministry of Finance (assessment team leader);
Republic of the Marshall Islands – PEFA Public Financial Management Performance Report Page 74
o Boris Anni, Assistant Secretary for Accounting and Administration, Ministry of Finance;
o Deputy Auditor-General;
o Gee Leong Bing, Director, Office for Compact and Integration (OCI), Ministry of Foreign
Affairs;
o ??, Acting Assistant Secretary (Revenue), Ministry of Finance;
o Waylon Muller, Director of Procurement Department, Ministry of Finance;
o representative from the Office of Environmental Policy, Planning and Co-ordination
(OEPPC);
o representative from the Grant-writer’s Office;
o Director, EPPSO , Office of the President
o Maybelline Anton Bing, Assistant Secretary of Finance, Administration and Personnel,
Maybelline Andon Bing
o Reynaldo Sunga, PMU Head, Ministry of Public Works
o Antonio Elliou, Chief Secretary’s Office
At this time it is expected that the first 4 members of this group will participate in the assessment
discussions for all indicators. Others will be involved for the indicators most relevant to their
responsibilities. This covers all of the main government stakeholders, including expenditures,
revenue, procurement, accounting/reporting, and audit, as well as those working in aid co-ordination.
Other stakeholders
Involvement of stakeholders outside of government will be critical to ensure the credibility of the
assessment. In particular, the views will be sought by those in the legislature, civil society
representatives, the local Chamber of Commerce, and the Editor of the local newspaper (Marshall
Islands Journal). The latter two are are particularly important in order to triangulate the information
from government sources, including the public and private sector’s perceptions of the efficiency of
government services. In addition, the views of the Budget Co-ordinating Committee (BCC) will be
sought.
Development partners (DPs)
Development partners will be involved through their participation in the stakeholder workshops and
through consultation with the assessment team, particularly on the indicators related to donor
practices.
A summary of stakeholders likely to be consulted is contained in Annex 4.
7. Reporting
The main output of the assessment will be the PEFA PFM-Performance Report. It will follow the
guidance provided by the PEFA Secretariat and have the following structure:
A Summary Assessment will provide a brief overview of the ratings.
An Introductory Section will present the context and the process of preparing the report and
specify the share of public expenditures captured by the report.
A Section presenting Country Background Information will provide the context for the
indicator-led and overall assessment of PFM performance. It will include a brief review of the
country economic situation, a description of the budgetary outcomes as measured by
achievement of aggregate fiscal discipline and strategic allocation of funds and, an analysis of
the legal and institutional PFM framework highlighting gaps which are impacting on the
reform process.
The Narrative or Main Body of the Report will assess the current performance of PFM
systems, processes and institutions based on the indicators, and describe the sources of
evidence used in completing the scores.
Republic of the Marshall Islands – PEFA Public Financial Management Performance Report Page 75
A Section on Government Reform Process will briefly summarize recent and ongoing reform
measures implemented by Government and assess the institutional factors that are likely to
impact reform planning and implementation in the future. Where necessary reference may be
made to policy recommendations already contained in recent Bank and donor reports.
Annex 1 will contain a Performance Indicator Summary.
Annex 2 will list the sources of information.
During stakeholder consultations an interim output will be produced, comprising an initial draft of the
indicator scores and brief justification for each and the summary assessment. This aide-memoire will
be presented and discussed during a stakeholder workshop at the end of the stakeholder consultation
(field) phase. Following the stakeholder workshop, the Assessment Team will prepare the draft
report, and copies of this draft will be circulated to members of the Oversight Group.
After circulation of the draft report, Government and development partners will be invited to give
comments through the PFTAC PFM Advisor over a period of 3 weeks. The report will be sent to the
IMF Fiscal Affairs Department, and then to the PEFA Secretariat for their comments and quality
assurance. Following the comment period, the Assessment Team will reconvene via video-
conference to discuss the comments in a consultative workshop, consider any additional data
provided, and amend the draft as necessary into a final report.
The final report will be disseminated to members of the Oversight Group, and copies will be made
available to the directors of those departments represented on the Assessment Team. In addition,
copies will be disseminated to the legislature, the Auditor-General’s office, and those who were
interviewed. Finally, the report will be posted on the Ministry of Finance’s website for the general
public.
8. Consultation and follow-up
In order to ensure sufficient understanding and government ownership of the exercise, the
methodology will ensure that sufficient time is given to engaging regularly with as wide a group of
stakeholders as possible. This will include: (i) a familiarisation/training workshop on the principles
and application of the PEFA framework (conducted April 2011); (ii) a self-assessment exercise
(conducted September 2011); (iii) circulation and discussion of the Concept Note (April 2011 and
September 2011); ; (iv) participatory stakeholder consultations; (v) a briefing workshop for both
government and other public officials, and development partners near the end of the stakeholder
consultation (field) phase; and (vi) a video workshop to discuss the draft performance report.
Following the assessment (which has been requested by the Finance Secretary), it is expected that the
PEFA report will provide an important input into developing the Government’s PFM reform roadmap.
It will also provide a shared (common) source of information on PFM which will be used by all
development partners.
It is likely that a follow-up PEFA assessment would be undertaken after three years.
9. Team composition and inputs
The assessment team, comprising both government stakeholders and an external consultant(s) with
experience of conducting PEFA assessments, described above, will carry out the assessment. The
composition of the team covers the main skills required by PEFA, including budget, accounting,
revenue, procurement, and audit.
The total number of working days for the team includes:
1. team leader: up to 5 days for preparation, up to 10 days for the consultation phase, up to 5
days for report-writing. [Note: Draft contract (copied from Cook’s contract): Mission days-
Republic of the Marshall Islands – PEFA Public Financial Management Performance Report Page 76
not to exceed 14 days; travel days- not to exceed 4; post-mission work-not to exceed 3; total –
not to exceed 21 days]
2. other team members: up to 2 days for preparatory work, up to 14 days for the consultation
phase, up to 2 days for report-writing, and a maximum of 5 days for the final workshop and
report finalisation stage.
3. external consultant(s): up to 5 days for preparation, up to 10 days for the consultation and
report-writing (???some of which may be home-based, depending on schedule ???) .
Management of the team will be the responsibility of the team leader, with the assistance of the
external consultant(s). The oversight group will provide high-level oversight of the exercise and
assist with senior management’s understanding and ownership of the emerging results. PFTAC will
provide back-stopping from Suva.
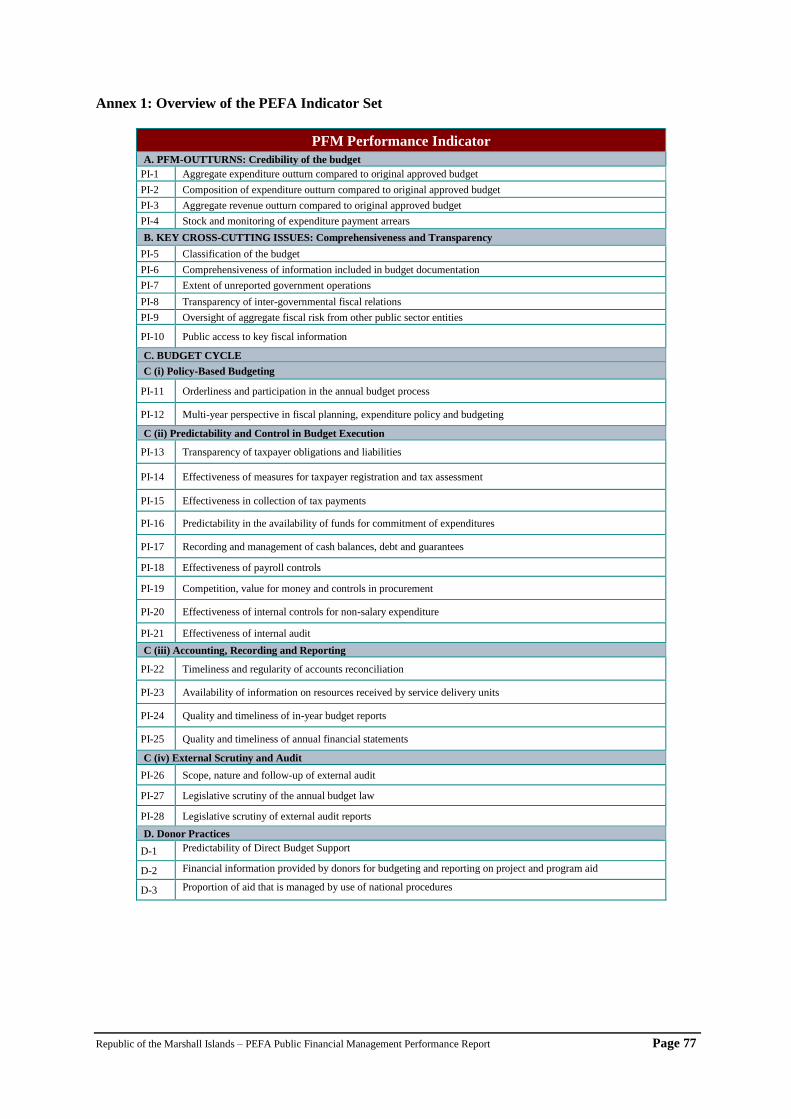
Republic of the Marshall Islands – PEFA Public Financial Management Performance Report Page 77
Annex 1: Overview of the PEFA Indicator Set
PFM Performance Indicator
A. PFM-OUTTURNS: Credibility of the budget
PI-1 Aggregate expenditure outturn compared to original approved budget
PI-2 Composition of expenditure outturn compared to original approved budget
PI-3 Aggregate revenue outturn compared to original approved budget
PI-4 Stock and monitoring of expenditure payment arrears
B. KEY CROSS-CUTTING ISSUES: Comprehensiveness and Transparency
PI-5 Classification of the budget
PI-6 Comprehensiveness of information included in budget documentation
PI-7 Extent of unreported government operations
PI-8 Transparency of inter-governmental fiscal relations
PI-9 Oversight of aggregate fiscal risk from other public sector entities
PI-10 Public access to key fiscal information
C. BUDGET CYCLE
C (i) Policy-Based Budgeting
PI-11 Orderliness and participation in the annual budget process
PI-12 Multi-year perspective in fiscal planning, expenditure policy and budgeting
C (ii) Predictability and Control in Budget Execution
PI-13 Transparency of taxpayer obligations and liabilities
PI-14 Effectiveness of measures for taxpayer registration and tax assessment
PI-15 Effectiveness in collection of tax payments
PI-16 Predictability in the availability of funds for commitment of expenditures
PI-17 Recording and management of cash balances, debt and guarantees
PI-18 Effectiveness of payroll controls
PI-19 Competition, value for money and controls in procurement
PI-20 Effectiveness of internal controls for non-salary expenditure
PI-21 Effectiveness of internal audit
C (iii) Accounting, Recording and Reporting
PI-22 Timeliness and regularity of accounts reconciliation
PI-23 Availability of information on resources received by service delivery units
PI-24 Quality and timeliness of in-year budget reports
PI-25 Quality and timeliness of annual financial statements
C (iv) External Scrutiny and Audit
PI-26 Scope, nature and follow-up of external audit
PI-27 Legislative scrutiny of the annual budget law
PI-28 Legislative scrutiny of external audit reports
D. Donor Practices
D-1 Predictability of Direct Budget Support
D-2 Financial information provided by donors for budgeting and reporting on project and program aid
D-3 Proportion of aid that is managed by use of national procedures
Republic of the Marshall Islands – PEFA Public Financial Management Performance Report Page 78
Annex 2: The PFM Performance Measurement Framework
1. Introduction and background The PFM Performance Measurement Framework is an integrated monitoring framework that allows
measurement of country PFM performance over time. It has been developed by the PEFA partners, in
collaboration with the OECD/DAC Joint Venture on PFM as a tool that would provide reliable
information on the performance of PFM systems, processes and institutions over time. The
information provided by the framework would also contribute to the government reform process by
determining the extent to which reforms are yielding improved performance and by increasing the
ability to identify and learn from reform success. It would also facilitate harmonization of the
dialogue between government and donors around a common framework measuring PFM performance
and therefore contribute to reduce transaction costs for partner governments.
The PFM Performance Measurement Framework is one of the elements of a strengthened approach to
supporting PFM reforms1. It is designed to measure PFM performance of countries across a wide
range of development over time. The Performance Measurement Framework includes a set of high
level indicators, which measures and monitors performance of PFM systems, processes and
institutions and a PFM Performance Report (PFM-PR) that provides a framework to report on
PFM performance as measured by the indicators.
2. Scope and coverage of the framework A good PFM system is essential for the implementation of policies and the achievement of
developmental objectives by supporting aggregate fiscal discipline, strategic allocation of resources
and efficient service delivery. An open and orderly PFM system is one of the enabling elements for
those three levels of budgetary outcomes:
• Effective controls of the budget totals and management of fiscal risks contribute to maintain
aggregate fiscal discipline.
• Planning and executing the budget in line with government priorities contributes to
implementation of government’s objectives.
• Managing the use of budgeted resources contributes to efficient service delivery and value for
money.
The Performance Measurement Framework identifies the critical dimensions of performance of an
open and orderly PFM system as follows:
1. Credibility of the budget - The budget is realistic and is implemented as intended
2. Comprehensiveness and transparency - The budget and the fiscal risk oversight are
comprehensive, and fiscal and budget information is accessible to the public.
3. Policy-based budgeting - The budget is prepared with due regard to government policy.
4. Predictability and control in budget execution - The budget is implemented in an orderly and
predictable manner and there are arrangements for the exercise of control and stewardship in
the use of public funds.
5. Accounting, recording and reporting – Adequate records and information are produced,
maintained and disseminated to meet decision-making control, management and reporting
purposes.
6. External scrutiny and audit - Arrangements for scrutiny of public finances and follow up by
executive are operating.
Against the six core dimensions of PFM performance, the set of high-level indicators measures the
operational performance of the key elements of the PFM systems, processes and institutions of a
country central government, legislature and external audit. In addition, the PFM-PR uses the
Republic of the Marshall Islands – PEFA Public Financial Management Performance Report Page 79
indicator-based analysis to develop an integrated assessment of the PFM system against the six
critical dimensions of PFM performance and evaluate the likely impact of PFM weaknesses on the
three levels of budgetary outcomes.
The set of high-level indicators captures the key PFM elements that are recognized as being critical
for all countries to achieve sound public financial management. In some countries, the PFM-PR may
also include an assessment of additional, country specific issues in order to provide a comprehensive
picture of PFM performance.
It is expected that the repeated application of the indicator tool will provide information on the extent
to which country PFM performance is improving or not. In addition, the PFM-PR recognizes the
efforts made by government to reform its PFM system by describing recent and on-going reform
measures, which may not have yet impacted PFM performance. The report does not, however, include
any recommendations for reforms or assumptions as to the potential impact of ongoing reforms on
PFM performance.
The focus of the PFM performance indicator set is the public financial management at central
government level, including the related institutions of oversight. Central government comprises a
central group of ministries and departments (and in some cases deconcentrated units such as
provincial administrations), that make up a single institutional unit. In many countries, other units are
operating under the authority of the central government with a separate legal entity and substantial
autonomy in its operations (in this document referred to as autonomous government agencies) and
also constitute a part of central government operations. Such units would be used for the purpose of
implementing central government policy and may include non-profit institutions, which are controlled
and mainly financed by central government.
Operations of other levels of general government and of public enterprises are considered in the
PFM performance indicator set only to the extent they impact the performance of the national
PFM system and its linkages to national fiscal policy, formulated and monitored by central
government. Other parts of general government include lower levels with separate accountability
mechanisms and their own PFM systems (e.g. budgets and accounting systems). Such sub-national
governments may include state, provincial, and regional government at a higher level and local
government (including e.g. districts and municipalities) at a lower level. In addition to general
government, the public sector includes public corporations or enterprises, created for the purpose of
providing goods and services for a market, and controlled by and accountable to government units.
Public corporations can be non-financial or financial, the latter including monetary corporations such
as the central bank3. Additional information on other levels of government and public enterprises may
be included in the section on country specific issues of the PFM-PR.
The focus of the indicator set is on revenues and expenditures undertaken through the central
government budget. However, activities of central government implemented outside the budget are
covered in part by the some indicators. Typically, this includes expenditure executed by central
government units and financed from earmarked revenue sources (whether domestic or external, the
latter often being only nominally on-budget), and by autonomous government agencies.
The Performance Measurement Framework does not measure the factors impacting performance,
such as the legal framework or existing capacities in the government. In particular, the set of high-
level indicators focuses on the operational performance of the key elements of the PFM system rather
that on the inputs than enable the PFM system to reach a certain level of performance.
The Performance Measurement Framework does not involve fiscal or expenditure policy analysis,
which would determine whether fiscal policy is sustainable, whether expenditures incurred through
the budget have their desired effect on reducing poverty or achieving other policy objectives, or
whether there is value for money achieved in service delivery. This would require detailed data
Republic of the Marshall Islands – PEFA Public Financial Management Performance Report Page 80
analysis or utilization of country-specific indicators. The framework rather focuses on assessing the
extent to which the PFM system is an enabling factor for achieving such outcomes.
Republic of the Marshall Islands – PEFA Public Financial Management Performance Report Page 81
3. The set of high level performance indicators The selected 28 indicators for the country’s PFM system are structured into three categories:
A. PFM system out-turns: these capture the immediate results of the PFM system in terms
of actual expenditures and revenues by comparing them to the original approved budget,
as well as level of and changes in expenditure arrears.
B. Cross-cutting features of the PFM system: these capture the comprehensiveness and
transparency of the PFM system across the whole of the budget cycle.
C. Budget cycle: these capture the performance of the key systems, processes and institutions
within the budget cycle of the central government.
In addition to the indicators of country PFM performance, this framework also includes
D. Donor practices: these capture elements of donor practices which impact the performance of
country PFM system.
Republic of the Marshall Islands – PEFA Public Financial Management Performance Report Page 82
Annex 3: Indicative List of Documents to Be Supplied By The Government 94
Constitution
Legislation:
Organic Budget Law (Public Finance Act)
Financial Instructions/ Financial Manual
Procurement Law
External Audit Law
Internal Audit Law
Public Service Act
Budget appropriations (Annual Budget Laws) for the last 3 fiscal years
Budget books for the last 3 fiscal years
Budget policy statements
Audited annual accounts for the last 3 fiscal years
Chart of Accounts/Budget code
Audit reports
Most recent reports, including compliance audits and performance audits (in addition to
financial audit/audited accounts)
Any audit reports on procurement, tax/revenue, state-owned enterprises (public
enterprises), other funds outside of the General Fund (e.g. funded from hypothecated
taxation) Latest financial statements (audited or unaudited) for other funds (e.g. funded from
hypothecated taxation)
Sector strategies for largest spending ministries
Last 2 budget circulars, including sector ceilings
Cabinet memoranda on the budget - latest budget
Public Investment Programme
Parliamentary rules
Data on budget support (commitments and disbursements) for the last 3 fiscal years
Data on external project support for the last 3 fiscal years
Debt management reports - latest
Debt sustainability analysis - latest
Any PFM assessments recently carried out (during the last 3 years)
94 As of the writing of this Concept Note (Sept 25, 2011) the majority of these documents were gathered during the Self-
Assessment (Phase I) exercise. Any outstanding will be requested from the GOMI Assessment Team Leader prior to
start of the Phase II Assessment
Republic of the Marshall Islands – PEFA Public Financial Management Performance Report Page 83
Annex 4: Indicative List of Stakeholders
Ministry of Finance Budget
Planning
Debt management
Treasury (including payroll accountant)
Finance/Accountant General
Other government Revenue agencies for all taxes (income, customs, VAT), including entity responsible for tax
audit, and any tax public information office
Auditor-General’s office
Entity responsible for sub-national governments
Entity responsible for oversight of state-owned enterprises/public enterprises
Entity responsible for payroll and for personnel database if different
Budget or finance officers of major sub-national governments
Public Procurement Authority/Central Tender Board
Cabinet/Chief Secretary’s Office
Budget/planning officers within key spending ministries
Finance officers within key spending ministries
Procurement officers in large spending ministries
Entity in charge of internal audit (oversight) (may be in MoF)
Any internal audit units within key spending ministries
Statistics office
Other public authorities Major state-owned enterprises/public enterprises
Clerk to Parliament
Chair of Public Accounts Committee in the legislature
Chair of Budget Committee in the legislature
Ombudsman, if in post
Non-government Governance NGOs, e.g.
Transparency International
Chamber of Commerce
Taxpayer groups
Association of NGOs
Development partners (DPs) DPs giving general budget support
DPs of 5 largest projects
Any PMUs of these large projects
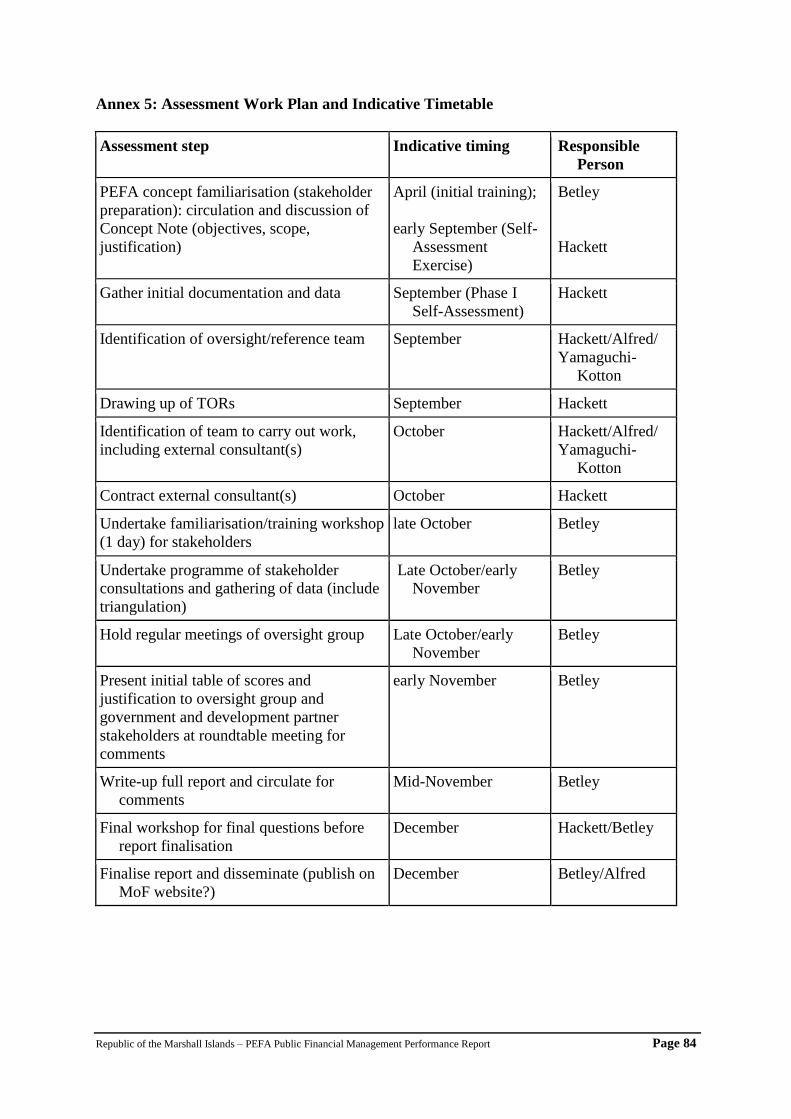
Republic of the Marshall Islands – PEFA Public Financial Management Performance Report Page 84
Annex 5: Assessment Work Plan and Indicative Timetable
Assessment step Indicative timing Responsible
Person
PEFA concept familiarisation (stakeholder
preparation): circulation and discussion of
Concept Note (objectives, scope,
justification)
April (initial training);
early September (Self-
Assessment
Exercise)
Betley
Hackett
Gather initial documentation and data September (Phase I
Self-Assessment)
Hackett
Identification of oversight/reference team September Hackett/Alfred/
Yamaguchi-
Kotton
Drawing up of TORs September Hackett
Identification of team to carry out work,
including external consultant(s)
October Hackett/Alfred/
Yamaguchi-
Kotton
Contract external consultant(s) October Hackett
Undertake familiarisation/training workshop
(1 day) for stakeholders
late October Betley
Undertake programme of stakeholder
consultations and gathering of data (include
triangulation)
Late October/early
November
Betley
Hold regular meetings of oversight group Late October/early
November
Betley
Present initial table of scores and
justification to oversight group and
government and development partner
stakeholders at roundtable meeting for
comments
early November Betley
Write-up full report and circulate for
comments
Mid-November Betley
Final workshop for final questions before
report finalisation
December Hackett/Betley
Finalise report and disseminate (publish on
MoF website?)
December Betley/Alfred


