
RESEARCH EVALUATIONIN THE AGE OF GLOBAL DIGITAL SCHOLARSHIPO’Reilly Strata Conference
Brian Wilson, Vice President, Chief ArchitectHealthcare and Science Business3 February 2011

HOW CAN YOU PREDICT THE PROGRESS OF SCIENCE?
2

NOBEL PRIZE PREDICTIONS
• In 1965, Drs. Eugene Garfield and Irving Sher published a paper showing that Nobel Prize winners published five times more papers and were cited 50 time more than the average researcher.
• Since 1989, the Science business of Thomson Reuters has correctly predicted at least one Nobel Laureate each year (except for 1993 and 1996).

WHAT IS CITATION ANALYSIS?
4

CITATION ANALYSIS
• A way to understand connections between the scholarly literature
• A way to discover relationships
• A way to track and measure productivity and impact

1960 1965 1970 1975 1980 1985 1990 1995 2000 2005 2007 2008
Web tools
WORLD WIDE WEB Broader citation sources
New Metrics
New Sources
Growth of Network analysis and visualisation tools
Mesur/ usage
Maps and Research Fronts
Eigenmetrics
H index
OVER 40 YEARS OF EXPERIENCE IN ANALYSIS AND METRICS
World and University Indicators
Growth of bibliometrics and scientometrics
CRAY-1
Birth of citation analysis
ARPANETPDP-1

THE STRATA OF SCIENCETHE POST WAR PERIOD
7

THE POST WAR PERIOD
SCIENCE DRIVERS
• Huge influx of government dollars into research and development following World War II
• Growing lag time in subject indexing of published findings
• Early stages of automation and computerization
ADVANCES IN SCIENCE AND TECHNOLOGY
• The Space Age Sputnik launched (1957) First man on moon (1969)
• First nuclear power plant (Obninsk, USSR)
• Discovery of spiral structure of DNA
ADVANCES IN INFORMATION PROCESSING
• First commercial computer (1951)
• Silicon transistor invented (1954)
• DEC PDP-1 (1960)
• Remote terminals via telephone connections
• Arpanet (1969)
1950s and 60s

CHARTING THE CITATION METRICS EVOLUTION
“IMPACT” METRICS
• Relate citation count to publication count
• Simple, well understood measures
• Journal Impact Factor, Immediacy Index
“H” FAMILY
• Based on rank-ordered publications
• Simple metrics rapidly evolving as issues become understood
• General metrics applicable to any list of cited publications (journals are one instance).
“INFLUENCE” METRICS
• Based on weightings within entire citation network structure
• Eigenfactor, Article Influence. SciMago Journal Rank (SJR)

IMPACT FACTOR
IMPACT FACTOR: Average citations from items in 2010 to items published in the journal in 2009 or 2008
Citations in 2010 to years 2009 or 2008
Citable items indexed in 2009 or 2008
IMMEDIACY INDEX: Average citations from items published in 2005
to items published in 2005
IF 2010 =

“IMPACT FACTOR”: A SIMPLE,MUCH-DISCUSSED RATIO
11
A = total cites in current year
B = current year cites to itemspublished in two precedingyears (a subset of A)
C = number of articles (‘citableitems’, excluding editorials, letters, news items, and meeting abstracts) published in two preceding years
D = B/C = Journal Impact Factor
DEFINITION: Ratio between citations and citable items.

“H” INDEX…
12
PUBLICATIONS RANKED BY CITATION
CIT
AT
ION
S
H
DEFINITION
‘A scientist has index h if h of his or her Np papers have h citations and the other (Np– h) papers have ≤h citations each.’
• Combines impact and size
• Can be applied to any selectionof articles
• Addresses the why not use the median?
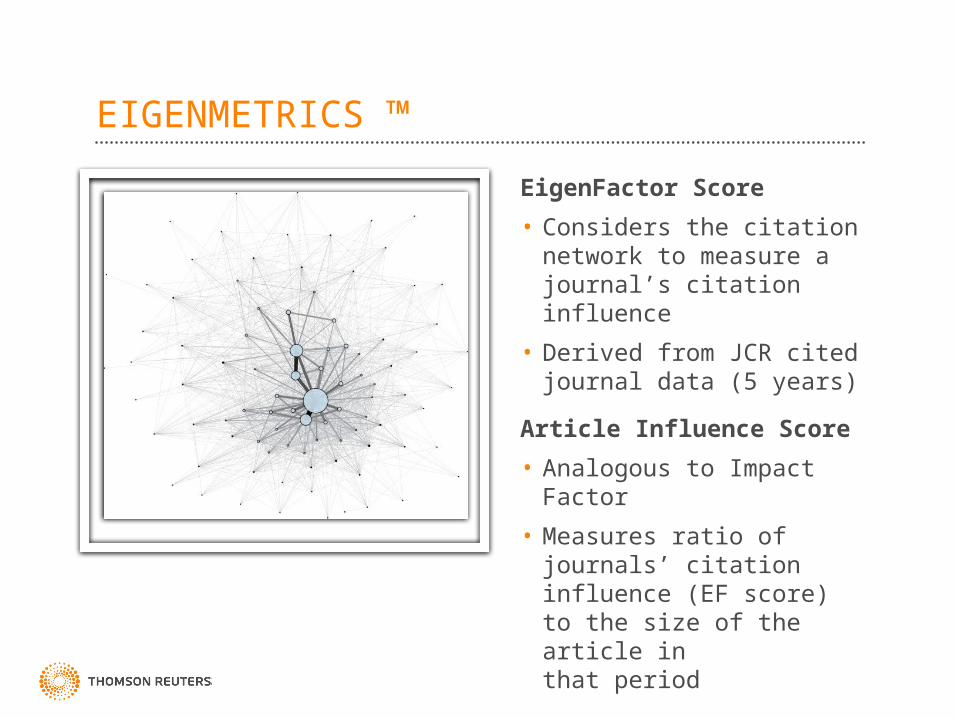
EIGENMETRICS ™
EigenFactor Score
• Considers the citation network to measure a journal’s citation influence
• Derived from JCR cited journal data (5 years)
Article Influence Score
• Analogous to Impact Factor
• Measures ratio of journals’ citation influence (EF score) to the size of the article inthat period

LAV(Europe)
HTLV-III (USA)
HIV + many variants, “SIV”
1983 1987 PRESENT FUTURE
???
CITATION INDEX – A VALUABLE SEARCH TOOL
The language of research is constantly changing, as research progress concepts and terminology evolve.
• Text based searching may miss critical information
• Network linkages through citations facilitate the discovery of information across the boundaries of terminology
This particular article is highly cited and relevant, but does not contain the term “HIV”
Therefore, this record cannot be found by searching for the text “HIV” but is easily found by using citations

WEB OF SCIENCE – DISCOVERY TOOLS
Visualize citations using the Citation Map. Identify trends and track research pathways
Instant Citation Reportsto easily evaluate research and identify trends
Analyze results for detailed analysis such as collaborator identification

THE STRATA OF SCIENCETHE OIL CRISIS ANDSPACE EXPLORATION
16

THE OIL CRISIS ANDSPACE EXPLORATION
SCIENCE DRIVERS
• Truly large scale scientific projects
• Growth of European cooperation
• Growing resource scarcity & funding optimization
• Rise of environmentalism and energy scarcity
ADVANCES IN SCIENCE AND TECHNOLOGY
• Skylab, Salyut, and the Space Shuttle
• Robotic inter-planetary discovery Voyager program (1977+) Mars Vikings (1975)
• Consumer technology and personal computers
• VLSI integrated circuitry fabrication
ADVANCES IN INFORMATION PROCESSING
• PCs, GUIs, and mice
• C programming language
• Solid state memory
• First supercomputer
• Commercial fiber optics
1950s and 60s
1970s and 80s

WHAT ARE SOME DATA CHALLENGES WITH EVALUATING “BIG SCIENCE?”
SUBJECT FOCUSES
• Quality differentiators in journal selection
• Different citation characteristics
ENSURING QUALITY
• The print to electronic evolution dilemma
• An appropriate balance of human curation and automation
DISAMBIGUATION
• Authors
• Institutions
• Subjects
NEWS SOURCESOF CONTENT
• Open datasets
• Blogs
• Videos
Differences in citation curves at the category level
0%
2%
4%
6%
8%
10%
12%
2006 2005 2004 2003 2002 2001 2000 1999 1998 1997Cited year
% o
f to
tal cit
ati
on
s t
o t
he c
ate
go
ry
Cell Biol (5.9)
Med, Gen Int (7.1)
Math (>10)
Multidisc (7.6)
Econ (>10)
Education(8.3)

AN EXAMPLE: CERNCOLLABORATION IN HIGH ENERGY PHYSICS
“CERN - where scientists smash stuff at the speed of light to produce new stuff... get pretty excited about that... and eventually write articles.”
- Dr. Salvatore Mele, CERN Head of Open Access
© COPYRIGHT CERN Photograph: Claudia Marcelloni, 16 Feb 2007
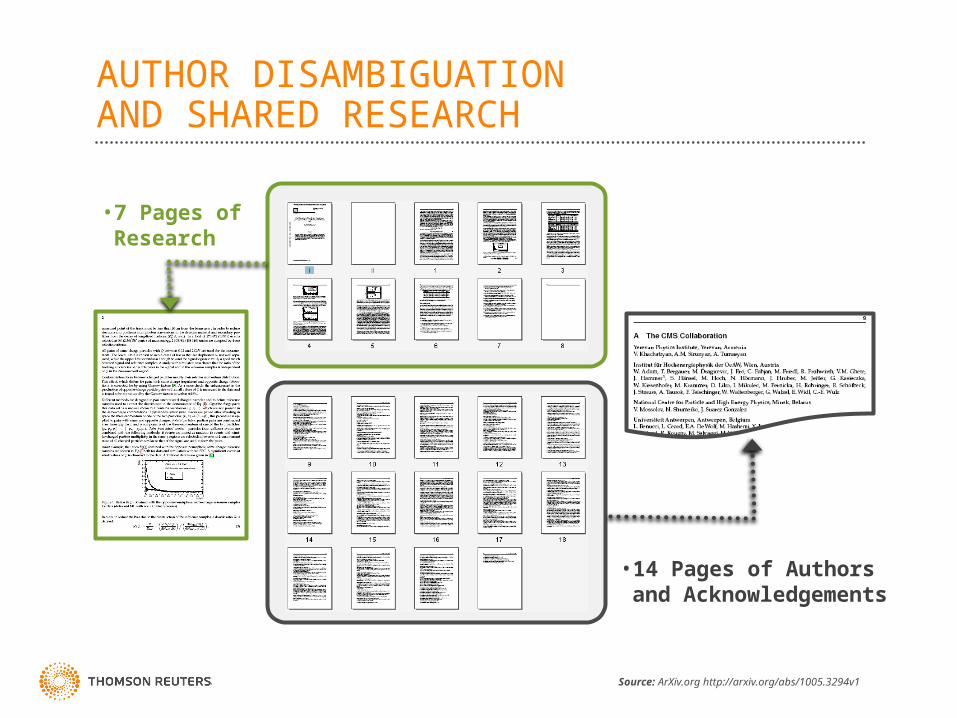
AUTHOR DISAMBIGUATIONAND SHARED RESEARCH
• 7 Pages of Research
• 14 Pages of Authorsand Acknowledgements
Source: ArXiv.org http://arxiv.org/abs/1005.3294v1
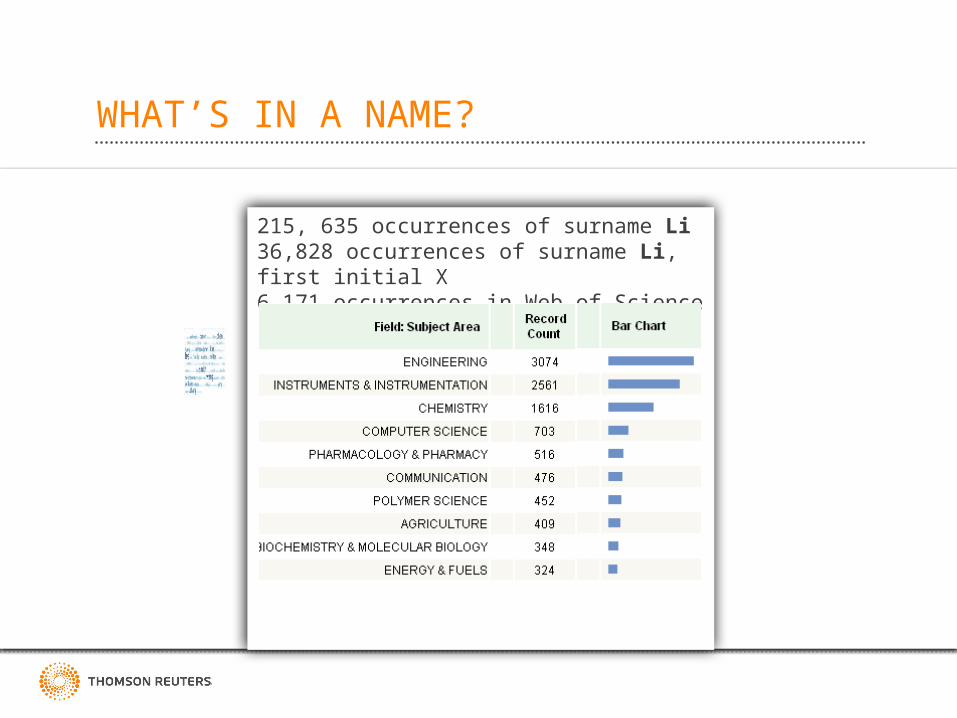
WHAT’S IN A NAME?
215, 635 occurrences of surname Li 36,828 occurrences of surname Li, first initial X6,171 occurrences in Web of Science (2008)

WORKING TO RESOLVEGLOBAL NAME AMBIGUITY
THE STRATA OF SCIENCEGLOBALIZATION ANDTHE BEGINNING OF THE INFORMATION AGE
23

GLOBALIZATION AND THE BEGINNINGOF THE INFORMATION AGE
SCIENCE DRIVERS
• Removal of international barriers
• Large scale international collaboration
• Funding organization encouragement of collaboration
• Opportunities to use and share data via the world wide web
ADVANCES IN SCIENCE AND TECHNOLOGY
• Human Genome Project
• Widespread adoption of cell phones
• Hubble Space Telescope (1990)
• International Space Station (1996)
• Civilian Global Positioning System (1996)
ADVANCES IN INFORMATION PROCESSING
• The World Wide Web (1989+)
• PGP encryption (1991)
• Intel Pentium processor (1993)
• Linux kernel developed (1992-94)
1950s and 60s
1970s and 80s
1990s

GLOBAL COMPARISONS
Netherlands:35% increase over 10 years

ANALYZE COUNTRIES: NETHERLANDS TOP 6 FIELDS
-2% Biology & Biochemistry

HOW DO I BENCHMARK, RANK, AND ANALYZE MY INSTITUTION?
+33%
+166%
+140%
+47%
+84%
+197%
All of these institutions exceed the field average, as well as the US average.

DR. FUSTER’S OVERALL PERFORMANCE
H INDEX:77 papers have been cited at least 77 times each
MEAN PERCENTILEaverage, Fuster’s papers
rank in the top 31% of their respective fields
SELF CITATION ANALYSIS9.34% of Fuster’s citations are self citations. H index without self citations is 72.
JOURNAL ACTUAL/EXPECTED RATIOFuster gets cited 48% above average for the journals he publishes in

29
CITATION METRICS
Citation Metrics
Funding data
Peer review
Awards/Honors
Citation metrics are one piece of the research performance puzzle.
They complement other types of assessment.
WHAT DO WE REPORT?
Counts of, outputs, activities, funds, and items
KPIsEfficiency
ProductivityOperational
Financial
Citation metrics
Time trends and changes
Relationships by citation or co authorship
Relative measures and Benchmarks
Peer Review
WHAT DO WE EVALUATE?
Region: Country, Territory ReputationRankings
StarsSuccess Stories
Organization Level: University, Institute, Corporation, Funder
Person Level: Researcher, Team, Research Project
Item level: grant, paper, patent, award, activity

GLOBAL INSTITUTIONAL PROFILES PROJECT ACADEMIC REPUTATION SURVEY
• Asked academics around the world to give feedback on the reputation of academic institutions, with a clear distinction between the reputation for Research and Teaching
• First run of the survey completed in May 2010
Mixed function of respondents
• Academic Staff 69%
• Research staff 15%
• Institutional 7% leadership
• Graduate/post 6% grad students

EXAMPLE INSTITUTIONALPROFILE AND TRENDS

THE STRATA OF SCIENCETHE BUSINESS OF SCIENCE
32

THE BUSINESS OF SCIENCE
SCIENCE DRIVERS
• Increased collaboration between academia, government and industry
• Academic research facilities seeking business oriented efficiencies
• Increasing growth in Asia
ADVANCES IN SCIENCE AND TECHNOLOGY
• First commercial Flash drives – 2000
• Wikipedia - 2001
• First self-contained artificial heart - 2001
• Mars Exploration Rovers - 2004
• Autonomous automobiles - 2005
ADVANCES IN INFORMATION PROCESSING
• Pervasive search technologies
• Semantic technologies
• Web 2.0
• Broadband proliferation
• “The Cloud”
1950s and 60s
1970s and 80s
1990s
2000 and Beyond

Funding Pressures
Efforts at Objective Approaches to Promotion and Tenure
Reputation Management & Demonstration of Achievement
Global Competition in the Sciences – BIG SCIENCE
Changing Nature of Scholarly Journal Publishing
COMMON DRIVERS ACROSS SCIENCE

35
The scientific discovery process is universally accepted and practiced in a similar fashion world wide. Science evaluation process varies by region and largely driven by the research funding structures by country and general attitudes toward to metrics and comparisons.
METRICS EVALUATION SYSTEMS
REGIONAL CHARACTERISTICS DRIVE APPETITES FOR EVALUATION

36
Market Driver: Relative use of performance metrics within the academic markets are generally driven by the regulatory environment in which they operate
PERFORMANCE EVALUATIONGLOBAL DEMAND

DIFFERENT LOCALES,DIFFERENT FOCUSES
SOURCE: Thomson Reuters Web of Science(SM)

ANNUAL PUBLICATION OUTPUTIN ENGINEERING
SOURCE: Thomson Reuters Web of Science(SM)

DATA IS GROWING
“Linking Open Data cloud diagram, by Richard Cyganiak and Anja Jentzsch. http://lod-cloud.net/”
SCIENCE HAS GROWN FASTER THAN OUR ABILITY TO KEEP UP
• Estimated 20,000 papers published daily
• Laboratory Information Management Systems (LIMS) market size will grow from US $395M in 2008 to US $454M in 2013.
DATA IS GROWING – A RECENT IDC STUDY INDICATED THAT THE DIGITAL UNIVERSE GREW TO 1.2 ZB AND BY 2020 SHOULD BE TO 35 ZB
THE OPEN DATA COMMUNITY IS CONSTANTLY LAUNCHING NEW REPOSITORIES – THE NUMBER OF DATA SETS IS DOUBLING EVERY YEAR
SELECTIVITY IS A MUST:
• Which articles should a researcher read?
• Which journals should a library subscribe to?
• Which projects and researchers should be funded?
DATA BASED DECISION MAKINGINCREASINGLY IMPORTANT

DIGITAL SCHOLARSHIP IS COLLABORATIVE AND GLOBAL
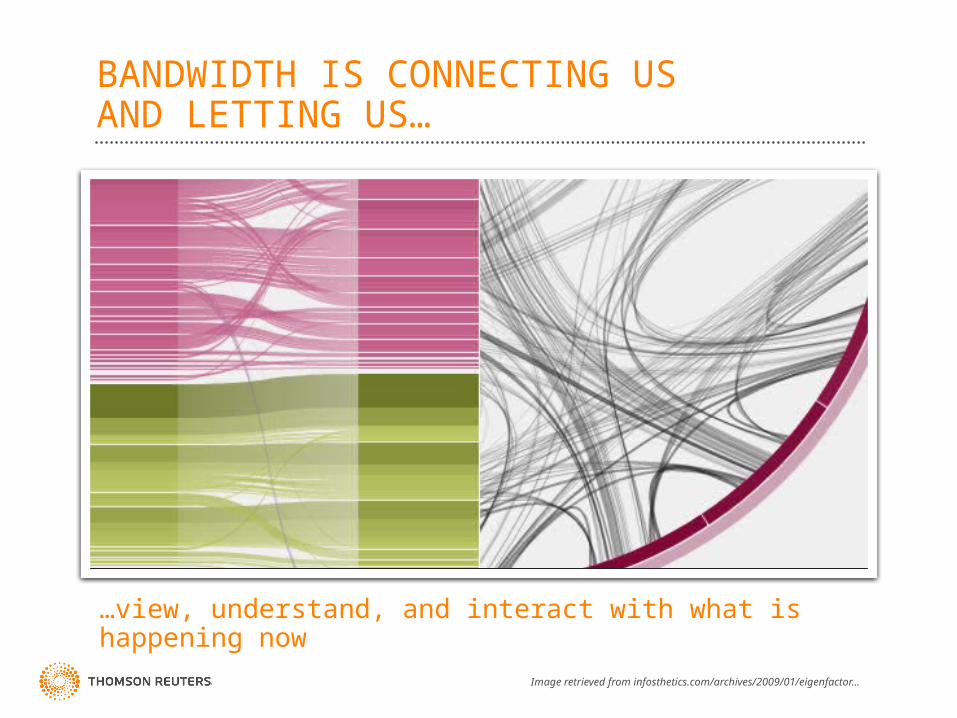
…view, understand, and interact with what is happening now
BANDWIDTH IS CONNECTING USAND LETTING US…
Image retrieved from infosthetics.com/archives/2009/01/eigenfactor...

Neural NetworkDisplay of Eigenfactors for corpus of JCR journals
• Data accessibility• Large computations on large datasets• Visualizations
• Real time • In context• Open & widely
available
BIG DATA IS CHANGING OUR UNDERSTANDING
THOMSON INNOVATION THEMESCAPEAnalyzing large search results sets using term overlap and multidimensional scaling
mesurMapping usage downloads and citation
Expectations are changing...
Tools arechanging...

QUESTIONS
43


