
STRONGER
Strategies for success
2015 Partner Conference
together
Retirement Plan Industry Update and Perspectives
Paul Neveu, President,BPAS Plan Administration and
Recordkeeping Services
2015 Partner ConferenceStronger Together 2
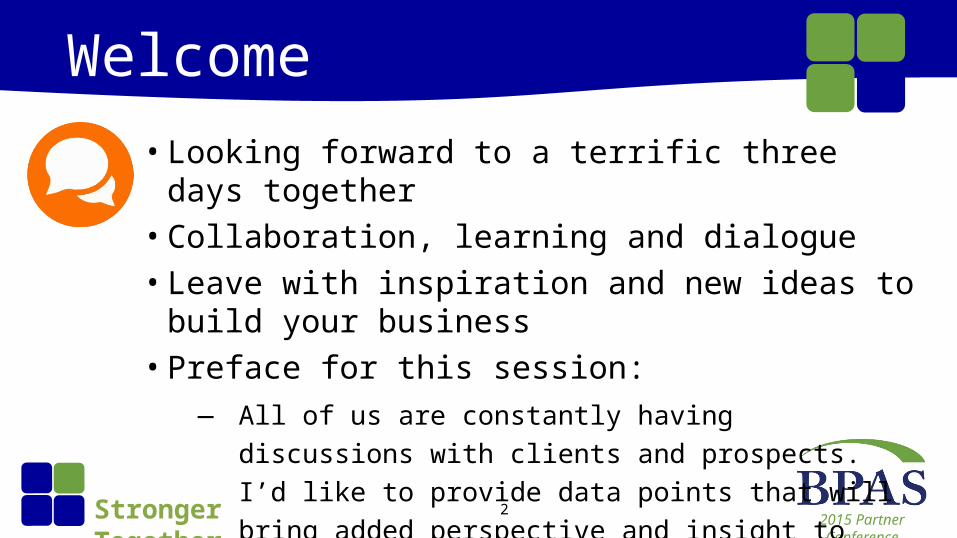
Welcome• Looking forward to a terrific three days together• Collaboration, learning and dialogue • Leave with inspiration and new ideas to build your
business• Preface for this session:
— All of us are constantly having discussions with clients and prospects. I’d like to provide data points that will bring added perspective and insight to these discussions.

WelcomeThe new face of our company…
2015 Partner ConferenceStronger Together 4
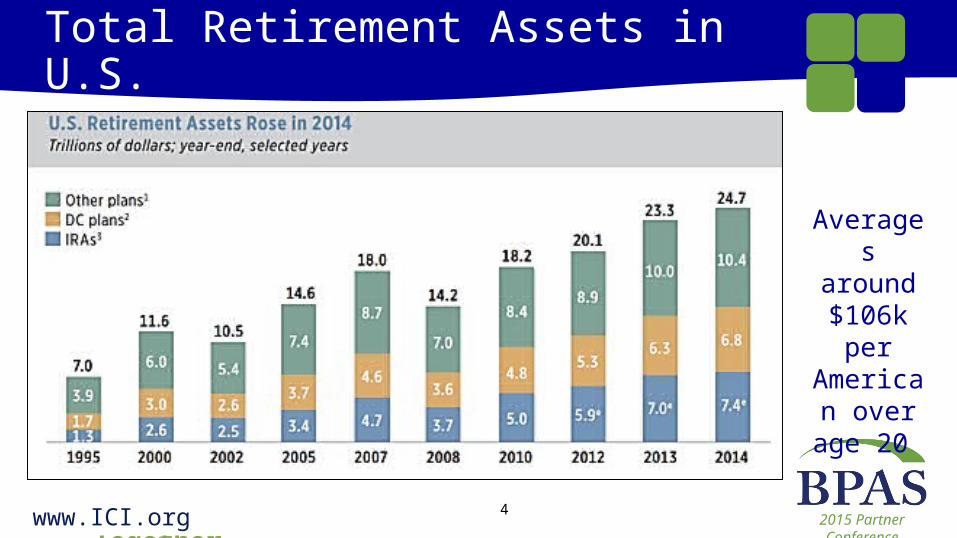
Total Retirement Assets in U.S.
www.ICI.org
Averages around
$106k per American over age
20

2015 Partner ConferenceStronger Together 5
DC Plans: 28% of Total Assets
www.ICI.org

2015 Partner ConferenceStronger Together 6
How DC Assets Break Down
www.ICI.org

2015 Partner ConferenceStronger Together 7
U.S. Retirement Assets & Unfunded Liabilities
www.ICI.org
$3.1T versus $6.8T in all DC plans will give
you a perspective!

2015 Partner ConferenceStronger Together 8
The Household Picture
www.ICI.org
2015 Partner ConferenceStronger Together 9
Welcome
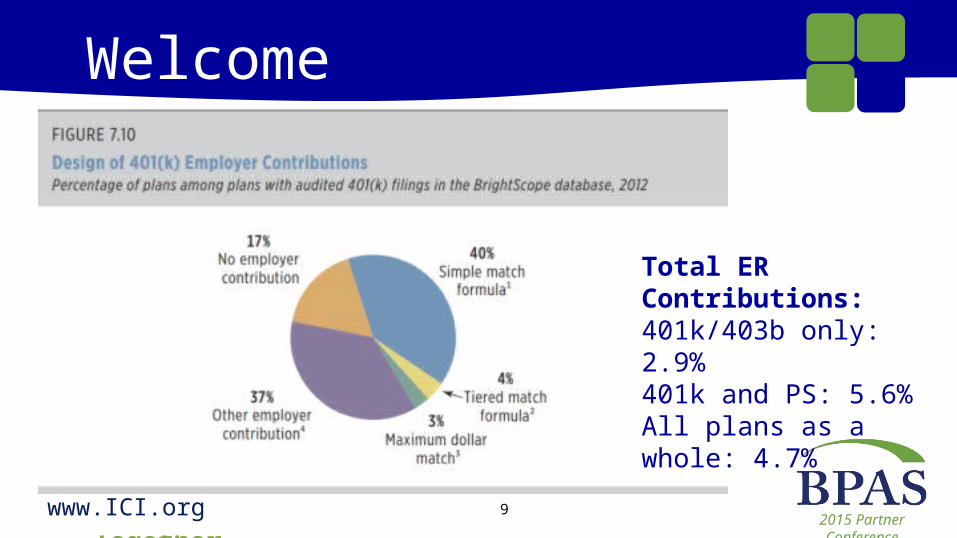
Total ER Contributions:401k/403b only: 2.9%401k and PS: 5.6%All plans as a whole: 4.7%
www.ICI.org

2015 Partner ConferenceStronger Together 10
Matching formulas
www.ICI.org
Stretching out the match… Something
we should all be encouraging with
clients
2015 Partner ConferenceStronger Together 11
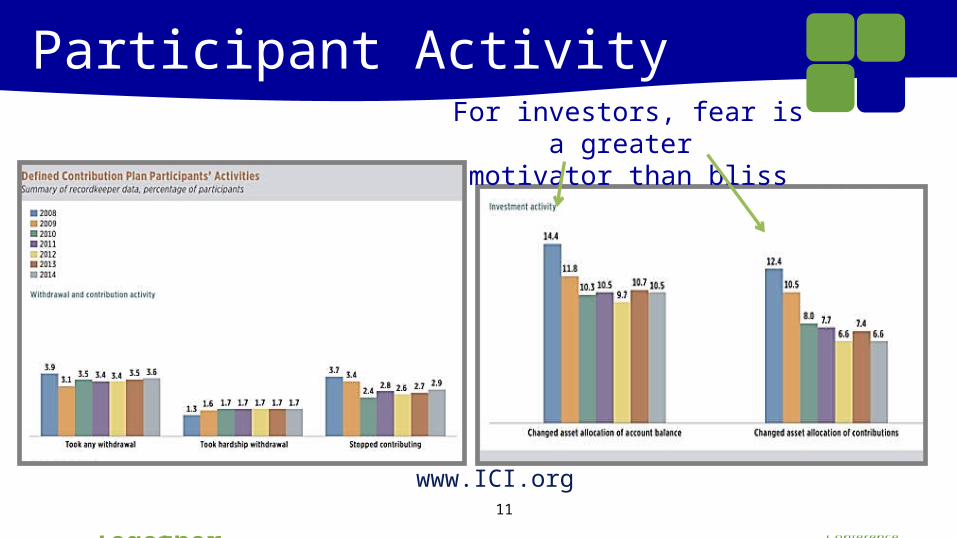
Participant Activity
www.ICI.org
For investors, fear is a greater motivator than bliss

2015 Partner ConferenceStronger Together 12
Update on Loans
www.ICI.org
• About 18% of eligible participants have a loan outstanding
• Roughly 1.8% - 2.0% of plan assets are on loan
• Average payroll deducted loan: $6,726
• Average MPL loan: $8,107 (aggregate)
• MPL is an attractive selling point of our partnership to clients

2015 Partner ConferenceStronger Together 13
Average Balances
• Average 401(k) balance at 12/31/2014:— Fidelity: $91,300— Vanguard: 101,650 (average), $31,396 median— 2014 Plan Sponsor Magazine Survey: $61,373
• Average IRA balance at 12/31/2014: — $92,200 (Fidelity)
2015 Partner ConferenceStronger Together 14
Average Balances
• Issues with average balance figures: —Many do not include eligible non-participants in
the count (as $0) —The size and age of the plans providers service
($33,461 versus $101,650)
2015 Partner ConferenceStronger Together 15
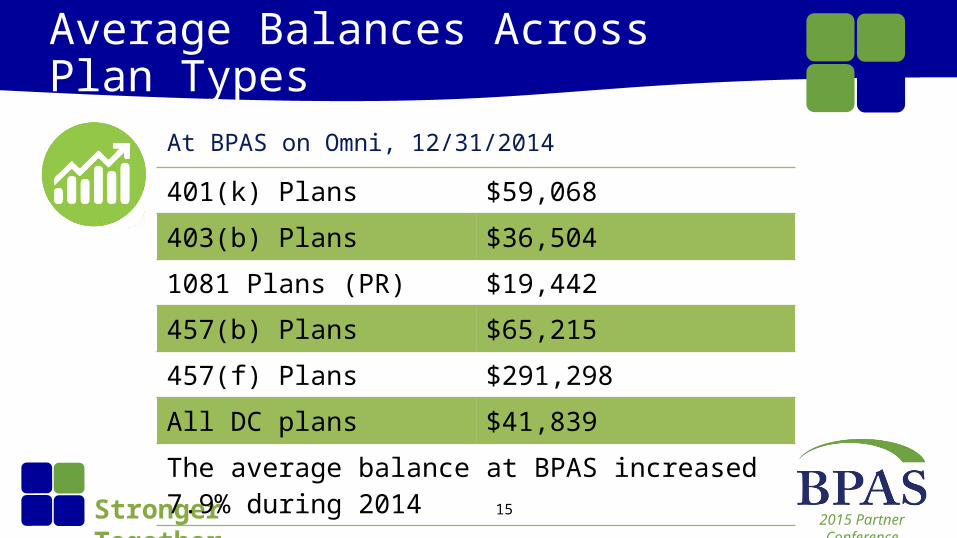
Average Balances Across Plan Types
401(k) Plans $59,068403(b) Plans $36,5041081 Plans (PR) $19,442457(b) Plans $65,215457(f) Plans $291,298All DC plans $41,839The average balance at BPAS increased 7.9% during 2014
At BPAS on Omni, 12/31/2014
2015 Partner ConferenceStronger Together 16
A Realistic Way to Look at It
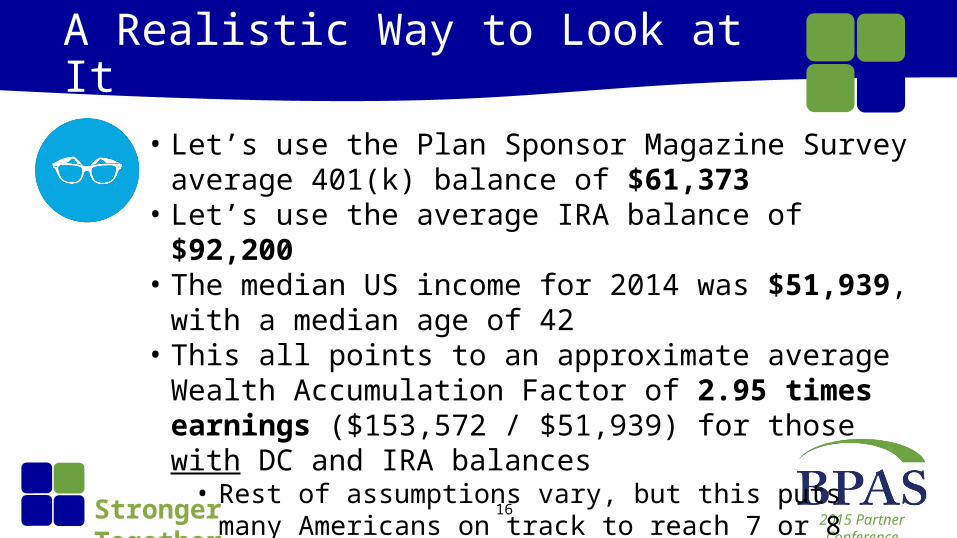
• Let’s use the Plan Sponsor Magazine Survey average 401(k) balance of $61,373
• Let’s use the average IRA balance of $92,200• The median US income for 2014 was $51,939, with a median
age of 42• This all points to an approximate average Wealth
Accumulation Factor of 2.95 times earnings ($153,572 / $51,939) for those with DC and IRA balances• Rest of assumptions vary, but this puts many Americans on
track to reach 7 or 8 times pay by age 67

2015 Partner ConferenceStronger Together 17
A Realistic Way to Look at It
• The issue, however, is with the millions of Americans who are not participating in DC plans and IRAs • 30.9% of Americans have no retirement savings per Fed
• Also, median balances are FAR lower• Median balance at Vanguard was $31,396
• So, the picture has definitely improved. But we still have a long way to go

2015 Partner ConferenceStronger Together 18
Progress Toward Large DC Balances
Participant DC Balance % who have attained as of today
> $100,000 10.31%
> $250,000 3.41%
> $500,000 1.04%
> $1,000,000 .24%
> $1,500,000 .09%
> $2,000,000 .04%
We currently have 10 participants on Omni with a single plan DC balance > $3M… ranging to as high as $7.9M
Current values on BPAS’ Omni system

2015 Partner ConferenceStronger Together 19
Misc. Data Points (Vanguard 2014)
• 12% of eligible participants are currently “maxing out”• 14% of participants are currently making catch up
contributions— Remember, catch up contributions are not counted in ADP
test. Some of these participants are cut short on the ADP test but make additional catch up contributions to their account.
• 13% of participants are currently making Roth contributions (within the 52% of plans who offer Roth)
2015 Partner ConferenceStronger Together 20
Misc. Data Points (Vanguard 2014)
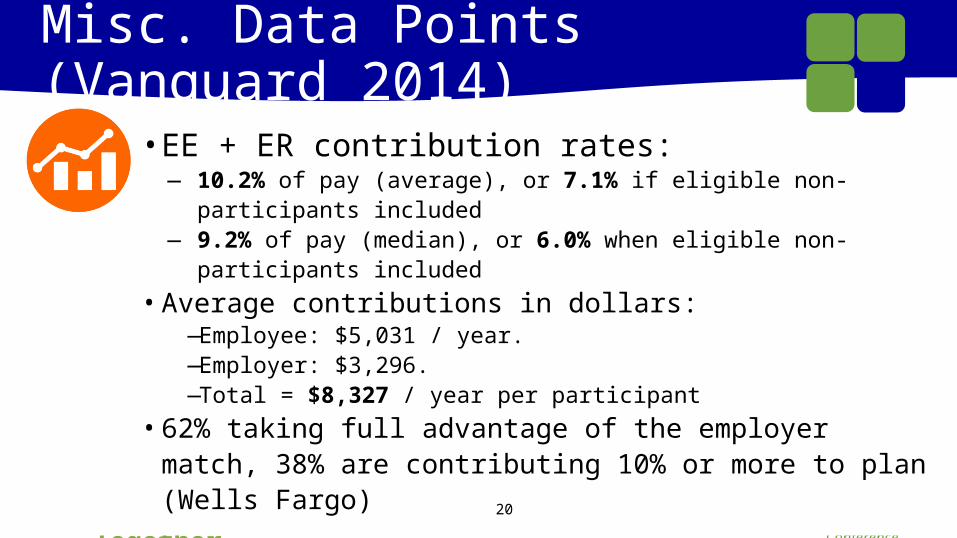
• EE + ER contribution rates:— 10.2% of pay (average), or 7.1% if eligible non-participants included— 9.2% of pay (median), or 6.0% when eligible non-participants
included• Average contributions in dollars:
—Employee: $5,031 / year. —Employer: $3,296. —Total = $8,327 / year per participant
• 62% taking full advantage of the employer match, 38% are contributing 10% or more to plan (Wells Fargo)
2015 Partner ConferenceStronger Together 21
Misc. Data Points (Vanguard 2014)
• 86% of plans now offer target date funds (26% at end of 2008)• 55% of all participants are invested in TDFs (at some
level)• 19% of recordkeeper’s assets invested in TDFs• 34% of all new contributions directed to TDFs• Only 10% of participants made investment changes
during 2014

2015 Partner ConferenceStronger Together 22
Misc. Data Points (Vanguard 2014)
• Median income: Eligible employees: $64,000. Participants: $75,000. Non-participants: $48,000• 69% of Vanguard plans had auto-enrollment with auto
increases• Deferral rate: Average: 7.0%. Mean: 6.0%. Participants
contributing more than 10% of pay: 22%• Average ADP: 5.3% for NHCEs, 6.6% for HCEs
(BPAS platform)

2015 Partner ConferenceStronger Together 23
Average Participation and Contribution Rates by Sector
Sector Avg. Part. Rate Median EE Def %
Agriculture, mining and construction 76% 6.0%
Media, entertainment and leisure 71% 6.8%
Education and health: 72% 6.7%
Business, professional and nonprofit 77% 6.0%
Transportation, utilities and communications 73% 6.0%
Manufacturing 75% 5.9%
Finance, insurance and real estate 86% 5.5%
Wholesale and retail trade 75% 4.9%
Vanguard, 2014 study

2015 Partner ConferenceStronger Together 24
A Look at SDBA Participants at BPAS (2014)
• Approximately 5% of BPAS plans now offer the SDBA feature (Schwab)• Not a surprise, it is heavily utilized by professional practice firms
(medical, dental, legal, professional services, financial services)• The average SDBA participant had 53% in SDBA and 47% in core funds• Average balances for SDBA participants:
• $266,907 in SDBA (53% of total)• $236,691 in core funds (47% of total)• $503,598 in total balance

2015 Partner ConferenceStronger Together 25
A Look at SDBA Participants at BPAS (2014)
• For SDBA participants:• Average 2014 return for assets within the brokerage account was 3.12%• Average 2014 return for assets held on the core funds side of their
account was 5.18%• Average 2014 return for their entire account (both sides) was 4.12%
• By perspective, the average return for all DC plan participants on our platform during 2014 was an estimated 5.58% (7.9% was total balance increase including contributions)

2015 Partner ConferenceStronger Together 26
Updates from our Call Center• Major enhancements made over last year through
new management team, additional reporting and monitoring, added staff• 8 AM to 8 PM ET coverage starting July 1st
• 2015 YTD, we have received approximately 11,851 calls per month, which averages to 546 calls per day
2015 Partner ConferenceStronger Together 27
Updates from our Call Center• Average call time is 6:08• 18% of calls require a call back or second call • Average wait time has been approximately 3:30 so far this year;
this is constantly monitored/policed• Voice system tells them how many calls on hold and their
position in queue; have option to press a button for a callback when next CSR becomes available

2015 Partner ConferenceStronger Together 28
Why Do Participants Call?
Distrib
ution assis
tance
IRA Assista
nce
Loan
assis
tance
Websit
e assis
tance
General plan
questions
Can't r
emember codes
Lock
ed acco
unt
Callbac
k requests
Account b
alance
questions
1099-R questions
Verify c
hecks
Address ch
ange
VRU assis
tance
Incoming r
ollove
rs
Investm
ent questi
ons0.00%5.00%
10.00%15.00%20.00%25.00%30.00%35.00% 31.92%
14.74% 13.71%12.02%
9.01% 7.51% 6.57%
0.94% 0.87% 0.83% 0.56% 0.38% 0.36% 0.29% 0.28%

2015 Partner ConferenceStronger Together 29
Seizing the Moment: Things We can Do Together to Shape Outcomes• Still only 69% of eligible participants have a balance on BPAS Omni
platform… we can work together to make a huge dent on this group of eligible non-participants (auto enrollment is key)
• We can do so much more with auto enrollment (wimpy versus non-wimpy version)… Only 7% of clients so far using non-wimpy version, another 6% using wimpy version. Increasing the use of NWAA is one of the best things we can do for participants.
• Auto enrollment: Now used in 50.2% of all plans (PSCA study, which admittedly includes mostly plans with > 100 participants), and 67% of plans with > 5,000 employees

2015 Partner ConferenceStronger Together 30
• Largest plans have adopted online enrollment, but we have a long way to go (still only 18% of actual plans)
• Online beneficiary designations: A great value added; we need to push this together with clients (only about 8% of plans have added since we rolled it out a year ago). This really is a no-brainer for clients.
• Still only about 41% of DC participants platform have provided email addresses. We can do so much more to “go green” and get participants to engage.
Seizing the Moment: Things We can Do Together to Shape Outcomes
2015 Partner ConferenceStronger Together 31
Some Key Reports We Will Discuss
• It’s all about moving the needle… And measuring how we’re doing in the process
• Retirement Gap Report• Year to Date Return Report• Participant Investment Grid• Annual Plan Review Report• Demographic Reports section of Resource Center• We look forward to your feedback so we can optimize our report
library -- putting key issues under a microscope and helping you demonstrate value to clients

2015 Partner ConferenceStronger Together 32
Dynamics of the Post-408(b)(2) Marketplace
• Fees have gone from one consideration to the dominant consideration in far too many searches; this impacts Advisors, Trustees and Recordkeepers
• Huge push to institutional funds and share classes• Many advisors are now positioning themselves now as a “consultant”• It brings up a question from a recordkeeper’s perspective: Should the goal
be to have 200 strong, robust partnerships, or to work with 1,000 “dabblers” ?
• I would suggest to you that clients are better serviced when there is a strong partnership between the Advisor / Trustee and Recordkeeper, instead of “speed dating” across a book of business like an episode of the Bachelor.
2015 Partner ConferenceStronger Together 33
Dynamics of the Post-408(b)(2) Marketplace
• New strategies: SPARK 2 RFP response, enhanced proposal format, greater use of multimedia, drawing the line on fees and accepting the outcome, and helping our partners articulate our combined value proposition• 408(b)(2) has had MANY beneficial effects, but we need to
fight the trend where we essentially put plan sponsors in the aisles of Wal-Mart
2015 Partner ConferenceStronger Together 34
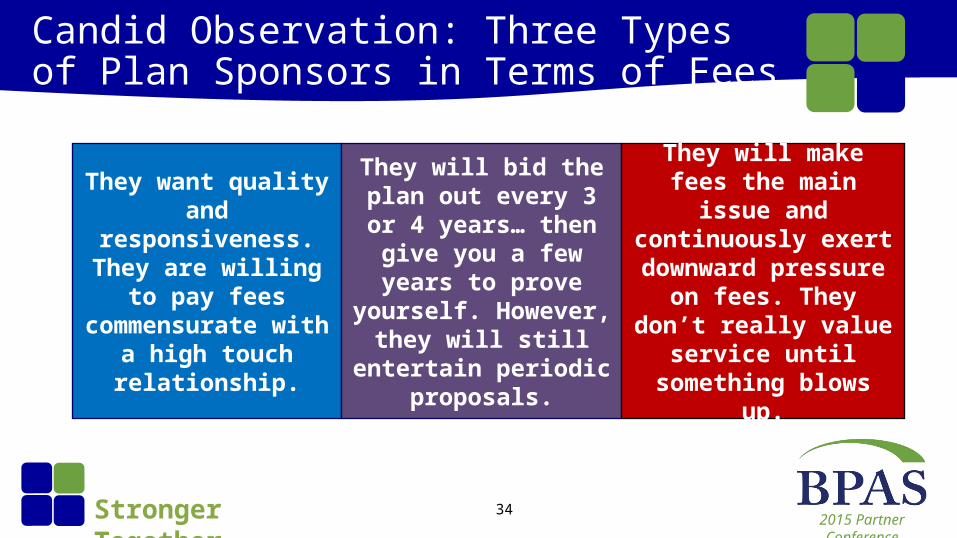
Candid Observation: Three Types of Plan Sponsors in Terms of Fees
They want quality and responsiveness. They are
willing to pay fees commensurate with a
high touch relationship.
They will bid the plan out every 3 or 4 years… then give you a few years to
prove yourself. However, they will still entertain
periodic proposals.
They will make fees the main issue and
continuously exert downward pressure on fees. They don’t really
value service until something blows up.

2015 Partner ConferenceStronger Together 35
When our Partnership is at its Best
• We are combatting inertia, boosting participation and contribution rates for each plan
• We’re moving employees:
Educated Engaged Motivated
• We help clients put the right plan design in place to balance corporate and plan-related goals
2015 Partner ConferenceStronger Together 36
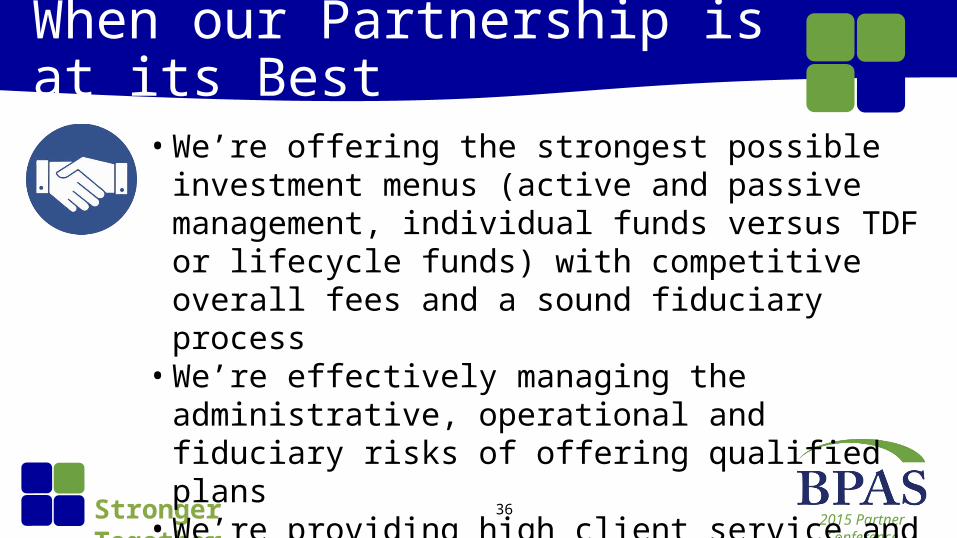
When our Partnership is at its Best
• We’re offering the strongest possible investment menus (active and passive management, individual funds versus TDF or lifecycle funds) with competitive overall fees and a sound fiduciary process• We’re effectively managing the administrative,
operational and fiduciary risks of offering qualified plans• We’re providing high client service and creating loyal
client relationships at reasonable and competitive fees

2015 Partner ConferenceStronger Together 37
The Next Three Days
• Re-orienting around this mission; that’s what this conference is about• Collaborate with peers… sharing best practices, success
stories and strategies• We want your feedback and suggestions on how BPAS can
be the best possible partner. We want to earn more of your business.

2015 Partner ConferenceStronger Together 38
The Next Three Days
• Having recently become the President of our DC Services division, I am humbled by the challenge and honored to be working with you. I want you to know how committed we are to you and how much we value each of our partner relationships. • Please enjoy the conference; let’s make it fun and
engaging.
2015 Partner ConferenceStronger Together
QuestionsPaul Neveu,
President, Plan Administration and Recordkeeping Services
Thank you


