
© Ericsson AB 2009 Commercial in confidence 8 July 20092
Esta demostrado que las telecomunicaciones ayudan a reducir el impacto de la crisis
económica mundial siempre y cuando se aceleren las inversiones para las redes de
banda ancha móvil creando fuentes de trabajo, con regulaciones que promuevan el cuádruple
play y que faciliten la cobertura en zonas rurales ó de bajos ingresos
© Ericsson AB 2009 Commercial in confidence 8 July 20093
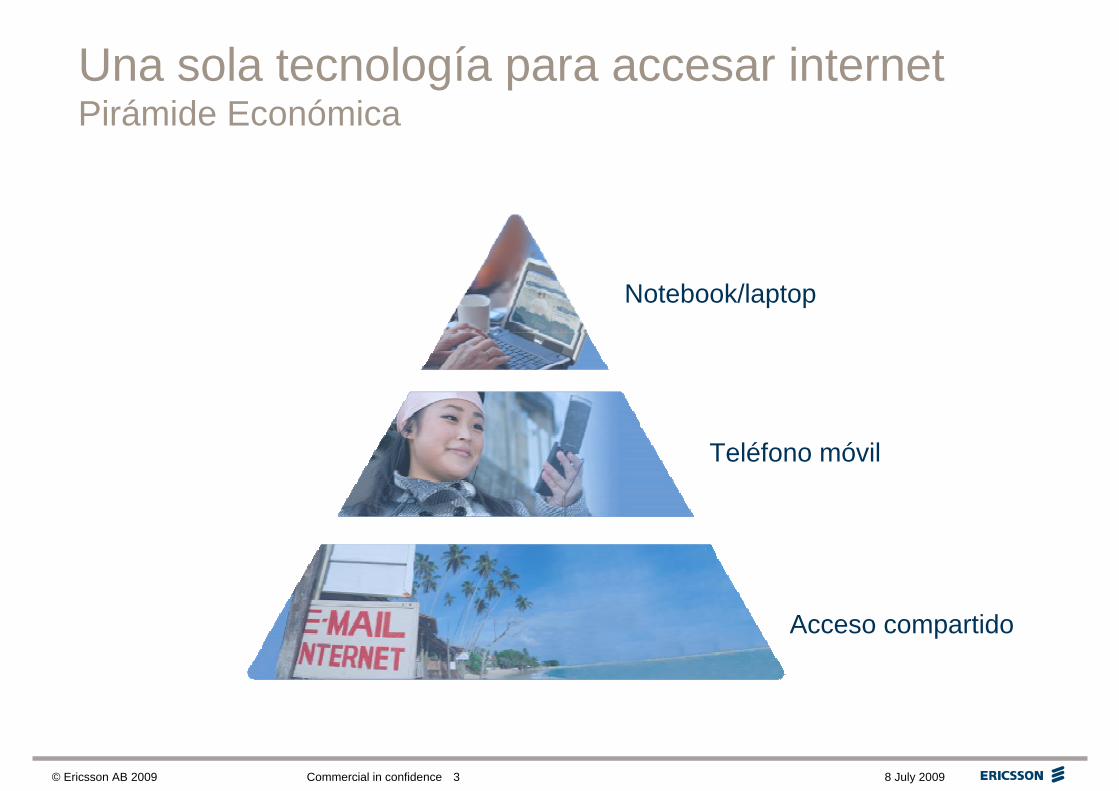
Una sola tecnología para accesar internetPirámide Económica
Notebook/laptop
Teléfono móvil
Acceso compartido
© Ericsson AB 2009 Commercial in confidence 8 July 20094
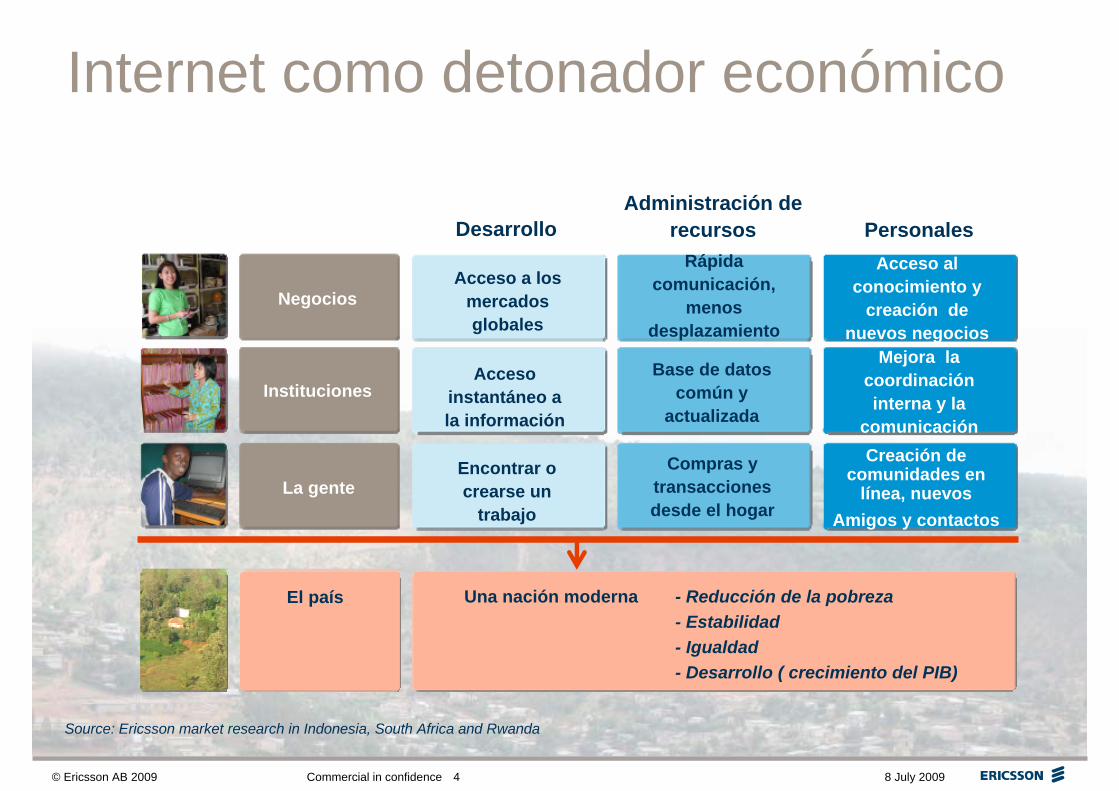
Internet como detonador económico
DesarrolloAdministración de
recursos
Negocios
Instituciones
La gente
Acceso a los mercados globales
Acceso instantáneo a la información
Encontrar o crearse un
trabajo
Rápida comunicación,
menos desplazamiento
Compras y transacciones desde el hogar
Acceso al conocimiento y
creación de nuevos negocios
Creación de comunidades en
línea, nuevosAmigos y contactos
El país
Base de datos común y
actualizada
Una nación moderna - Reducción de la pobreza- Estabilidad- Igualdad- Desarrollo ( crecimiento del PIB)
Personales
Source: Ericsson market research in Indonesia, South Africa and Rwanda
Mejora la coordinación interna y la
comunicación

© Ericsson AB 2009 Commercial in confidence 8 July 20095
El efecto Internet
Antes de banda ancha:– Imprimir reportes en un centro de
negocios– minibus 6h viaje redondo– Pérdida de dos días de trabajo + costos
de viaje
Con banda ancha móvil:– Retrazo de pago de prestamos
se redujo
– Incremento de ganancias de 30%
– Los clientes se beneficiaron al reducirse las tasas de interés
Sr. Robert, Director de región de un banco de Nyamata, Rwanda
Reporta a oficina principal en Kigali 2 veces a la semana
Source: Ericsson market research
© Ericsson AB 2009 Commercial in confidence 8 July 20096
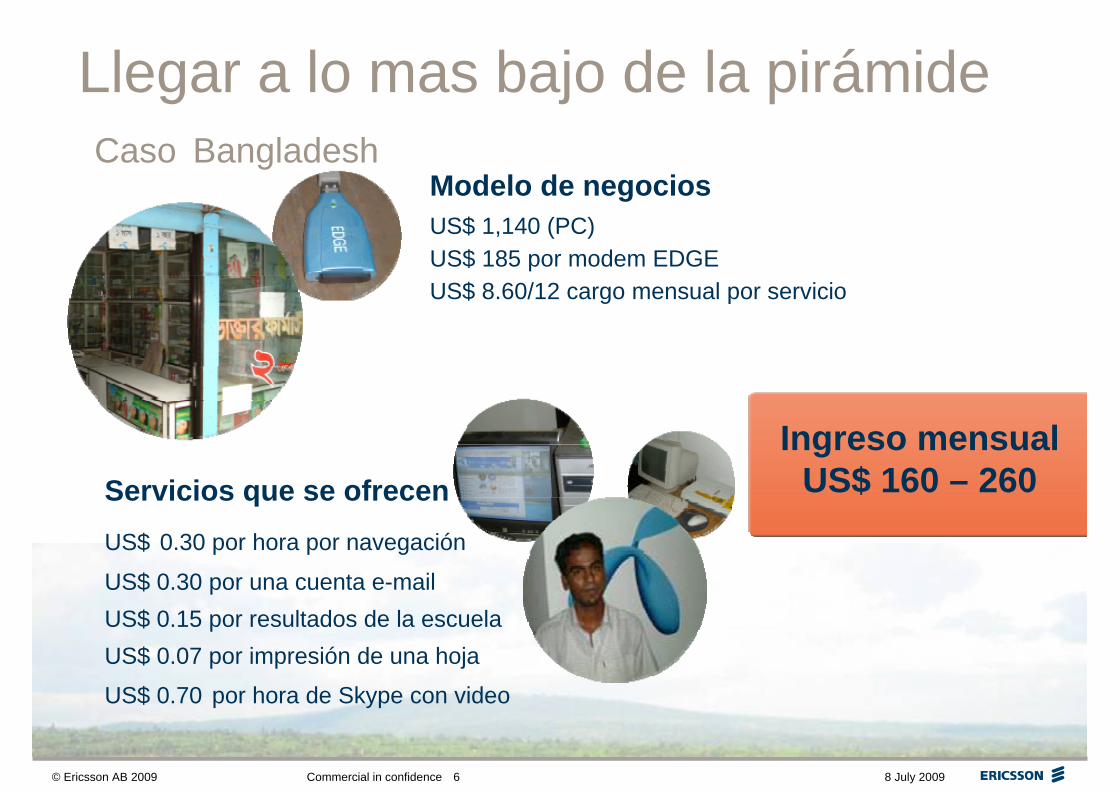
Llegar a lo mas bajo de la pirámideCaso Bangladesh
Modelo de negociosUS$ 1,140 (PC)US$ 185 por modem EDGEUS$ 8.60/12 cargo mensual por servicio
Ingreso mensual US$ 160 – 260Servicios que se ofrecen
US$ 0.30 por hora por navegación
US$ 0.30 por una cuenta e-mail US$ 0.15 por resultados de la escuelaUS$ 0.07 por impresión de una hoja
US$ 0.70 por hora de Skype con video

© Ericsson AB 2009 Commercial in confidence 8 July 20097
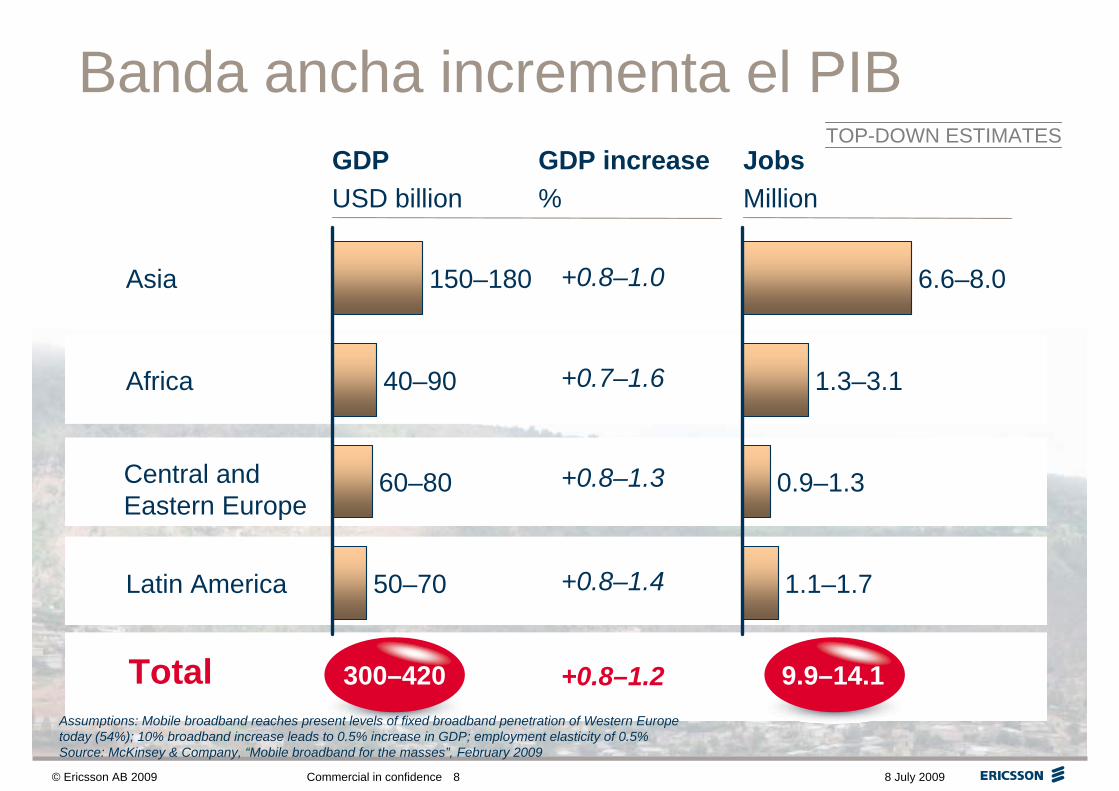
Banda ancha incrementa el PIB
Un aumento en los enlaces de banda ancha del 10 %, contribuirá con un alza del PIB nacional de 1.3%
(Fuente: Resultado de estudio del Banco Mundial, “Información y comunicación para el desarrollo de 2009”)
© Ericsson AB 2009 Commercial in confidence 8 July 20098
6.6–8.0
1.1–1.7
1.3–3.1
0.9–1.3
TOP-DOWN ESTIMATESGDPUSD billion
Latin America
Africa
Asia 150–180
40–90
60–80
50–70
JobsMillion
GDP increase%
+0.8–1.0
+0.7–1.6
+0.8–1.4
+0.8–1.3
Total 300–420 9.9–14.1+0.8–1.2
Central and Eastern Europe
Assumptions: Mobile broadband reaches present levels of fixed broadband penetration of Western Europe today (54%); 10% broadband increase leads to 0.5% increase in GDP; employment elasticity of 0.5%Source: McKinsey & Company, “Mobile broadband for the masses”, February 2009
Banda ancha incrementa el PIB
© Ericsson AB 2009 Commercial in confidence 8 July 20099
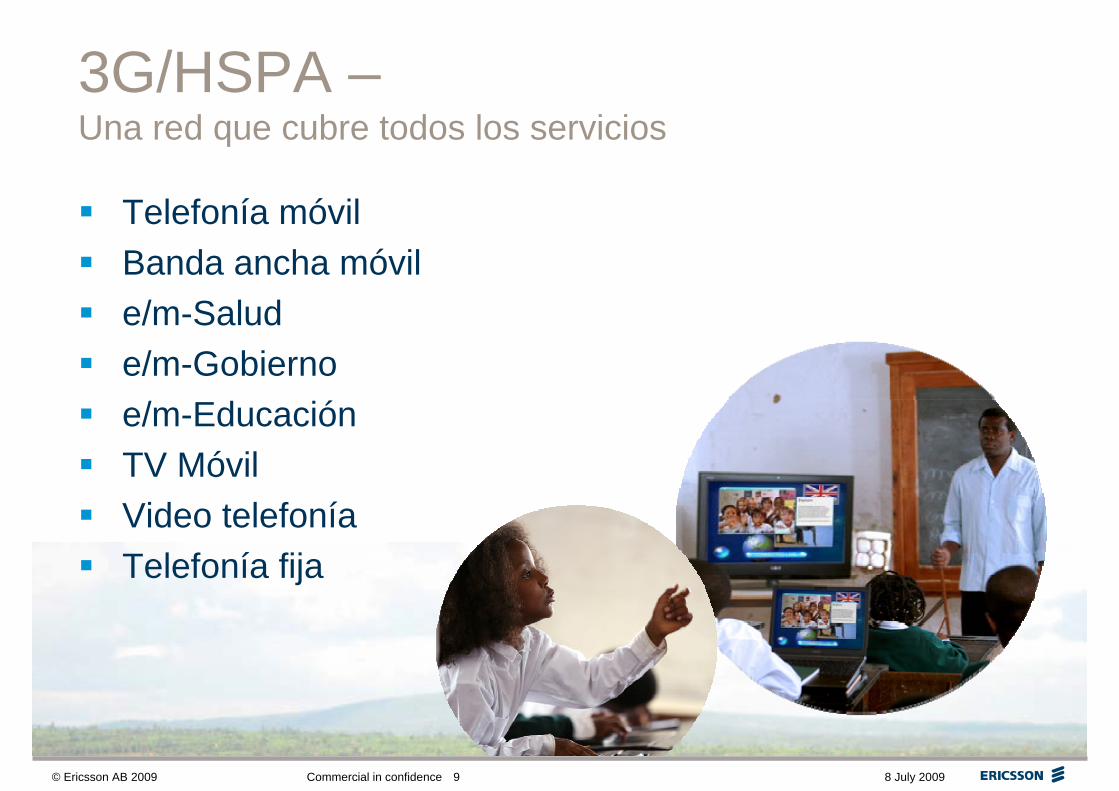
3G/HSPA –Una red que cubre todos los servicios
Telefonía móvilBanda ancha móvile/m-Salude/m-Gobiernoe/m-EducaciónTV MóvilVideo telefoníaTelefonía fija
© Ericsson AB 2009 Commercial in confidence 8 July 200910
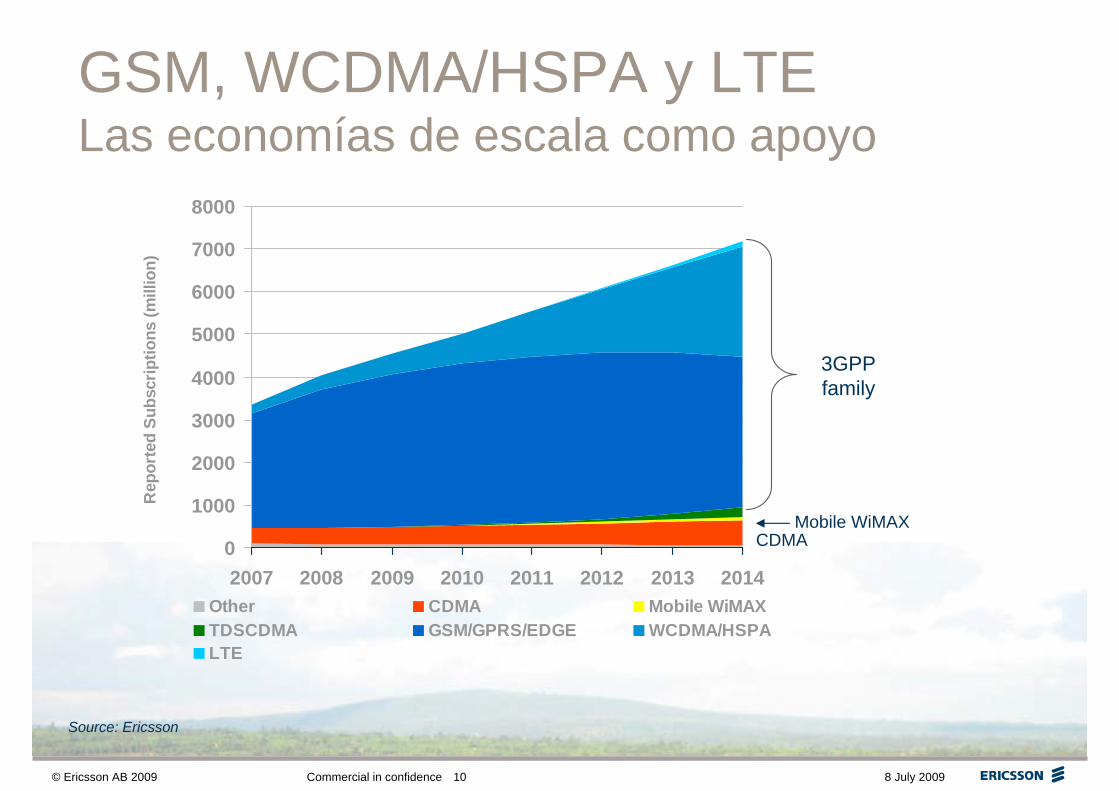
GSM, WCDMA/HSPA y LTE Las economías de escala como apoyo
Source: Ericsson
3GPP family
Mobile WiMAXCDMA0
1000
2000
3000
4000
5000
6000
7000
8000
2007 2008 2009 2010 2011 2012 2013 2014
Rep
orte
d Su
bscr
iptio
ns (m
illio
n)
Other CDMA Mobile WiMAXTDSCDMA GSM/GPRS/EDGE WCDMA/HSPALTE
© Ericsson AB 2009 Commercial in confidence 8 July 200911
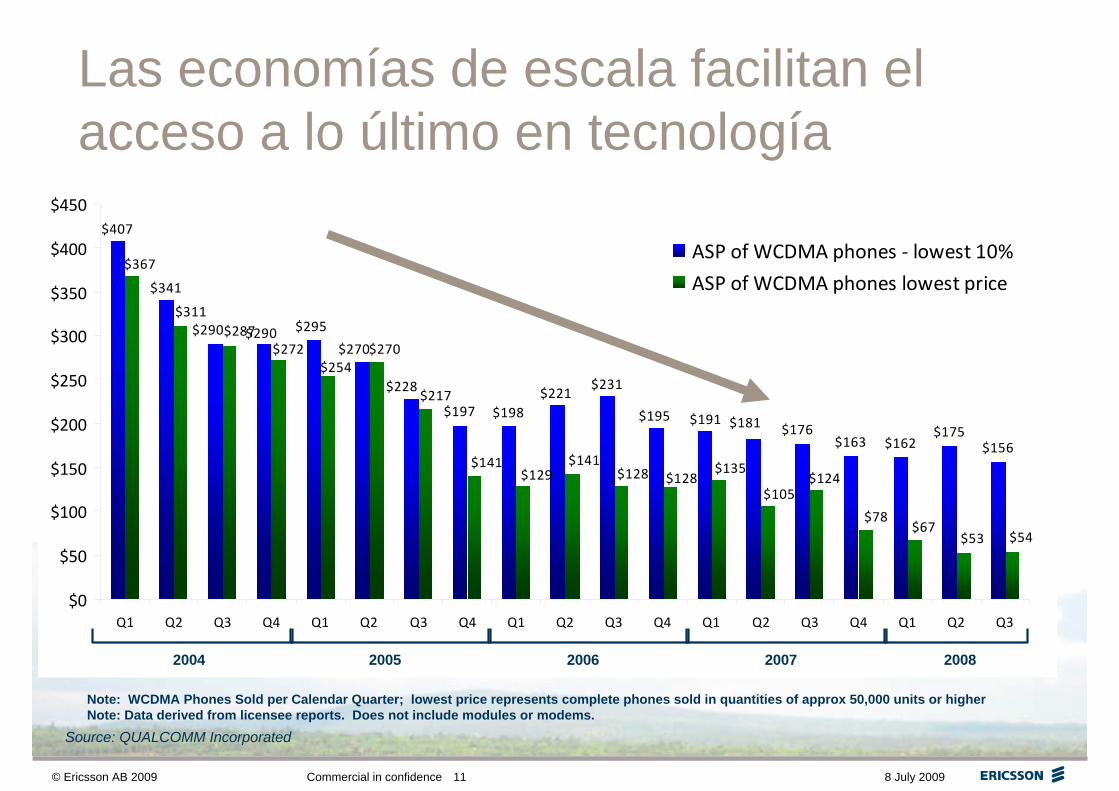
Las economías de escala facilitan el acceso a lo último en tecnología
Source: QUALCOMM Incorporated
Note: WCDMA Phones Sold per Calendar Quarter; lowest price represents complete phones sold in quantities of approx 50,000 units or higherNote: Data derived from licensee reports. Does not include modules or modems.
$163 $162$175
$156
$407
$341
$290 $290 $295
$270
$228
$197 $198$221
$231
$195 $191 $181 $176
$53 $54
$367
$311$287
$272$254
$270
$217
$141$129
$141$128 $128
$135
$105$124
$78$67
$0
$50
$100
$150
$200
$250
$300
$350
$400
$450
Q1 Q2 Q3 Q4 Q1 Q2 Q3 Q4 Q1 Q2 Q3 Q4 Q1 Q2 Q3 Q4 Q1 Q2 Q3
ASP of WCDMA phones ‐ lowest 10%
ASP of WCDMA phones lowest price
2004 2005 2006 2007 2008

© Ericsson AB 2009 Commercial in confidence 8 July 200912
Evolución continua de capacidades
3G
3G/HSPA
HSPA Evolution
LTE
2002 2005 2008/2009 2009
384 kbps
3.6Mbps
21/28/42 Mbps
~150Mbps
Peak rate
2007
7/14Mbps
LTE Advanced
20131 GbpsTarget
© Ericsson AB 2009 Commercial in confidence 8 July 200913
Banda ancha sustentable¿Como llegar a los segmentos de bajos ingresos en una forma rentable?
-Baja renta para banda ancha
-Terminales económicas
-Reducción de CAPEX
-Bajo OPEX
-Compartición de Infraestructura

© Ericsson AB 2009 Commercial in confidence 8 July 200914
>50% of PC households addressable at 10 USD/month- Bangladesh
Source: Ericsson ConsumerLab study in Bangladesh 2007Base: the 37% that were interested in getting broadband out of 2,500 interviews
0%
20%
40%
60%
80%
100%
0 5 10 15 20 25Broadband Subscription Cost per Household [USD/Month]
Add
ress
able
mar
ket*
Expensive Acceptable
Expensive
Cheap
Reasonable

© Ericsson AB 2009 Commercial in confidence 8 July 200915
Regional Broadband Tariffs – South East Asia
Sources: Service Provider websites, Dec 16 2008
MBB median
tariff: $21
Maxis (M) $22.65 TM(F)$22.36
Celcom & Maxis (M)$28.46
Celcom (M)$19.72
DiGi (M)$19.17
Globe (F)$21.05
Maxis (F) $25.56
Maxis (F)$14.52
Globe (F)$52.90
TM (F)$54.60
StarHub (C) $18.34 M1 (M) $18.90 Digitel (M) $21.14
TRUE (F) $25.81
SMART (F)$42.21
TRUE (F)$21.75
SMART (F)$63.48
Indosat (M)$51.75
SingTel (F)$22.95
GP (M) $14.90 Indosat (M) $10.35
M1 (M)$25.08
TM (F)$77.84
SingTel (F)$31.39
StarHub (C)$29.26
M1 (C)$33.84
SingTel (F)$43.50
SingTel & StarHub (M)$50.75
$-
$10
$20
$30
$40
$50
$60
$70
$80
- 1 000 2 000 3 000 4 000 5 000 6 000 7 000 8 000
Bandwidth [kbps]
Mon
thly
Tar
iff [U
S$]

© Ericsson AB 2009 Commercial in confidence 8 July 200916
Bringing down Cost per bit
Asset Sharing/NW Utilization
Transport
RNC & Core
RAN
Service differentiation
Terminals
x10 spectrum efficiency & extended coverage
Flexible Ethernet Migration & FTTx x5 capacity
Tunnelling, Flat-architecture/SAE>x10 RNC Capacity in 3 years, Terabit core
Economies of scale ⇒ $70 modems
Intelligent Traffic shaping and Priority Handling
Sharing sites and Transport Network

© Ericsson AB 2009 Commercial in confidence 8 July 200917
The base case Cost and cost drivers of Mobile Broadband
$/Sub/month
OPEX
Typical MBB network*Total cost ~7-10 $/Sub/month
CAPEX
Main cost drivers
International BW, 1.1
Sales & Marketing, License & Service Fees, 1.4
Customer Support, 0.6NW O&M, 0.8
RAN, 2.0
Core & Service Layer, 0.4Backhaul, 0.7
ITC, 0.4
0
1
2
3
4
5
6
7
8⇒ Number of Node Installations⇒ BH Traffic ⇒ BH Traffic
⇒ Number of Nodes & BH Traffic
⇒ Power, traffic, Maintenance, Site rental⇒ Number of subscribers &SLA
⇒ Campaigns, subs subsidies and licensefees
⇒ BH Traffic & Traffic mix
Source: Ericsson
*Usage: 3 GB (21 kbps in BH)Speed: 1.5 MbpsGSM Sites Available

© Ericsson AB 2009 Commercial in confidence 8 July 200918
Large cost differences for international bandwidth
Lowest lease price of STM-1 cables to/from the US. African prices are for cables connecting Africa and Europe or Asia.* Kenya: Expected price 2H 2009 when new cables are deployedSource: Ericsson
$400
$350$319
$300
$147
$94 $94
$21$39$51
Egypt
South
Africa
India
Kenya
*
Colombia Peru
Argenti
naKore
an R
ep
Singap
ore
Nordics
Mon
thly
cos
t for
Inte
rnat
ion
Gat
eway
C
apac
ity (U
SD
/Mbp
s/m
onth
)

© Ericsson AB 2009 Commercial in confidence 8 July 200919
HSPA results year oneClaro, Brazil (part 1)
Focus AreaClaro installs HSPA network to boost revenue and deliver innovative services such as television and video streaming and online gamingHSPA network used to deliver broadband access where fixed-line infrastructure is poor or doesn’t exist
Implementation of 3G/HSPA servicesNetwork launched November 2007Ideal spectrum (850MHz) to cost effectively serve the vast countryBy October 2008 HSPA technology rolled out in about 280 cities in 20 states of Brazil and available to >70 million people Broadband tariffs based on average throughput speed
* Q2 2008
Key Facts BrazilPopulation: 191,908,500GDP (per capita): US$ 9500Fixed line penetration: 20%Mobile penetration: 75%Internet penetration: 35.2%Broadband penetration: 3.5%
© Ericsson AB 2009 Commercial in confidence 8 July 200920
HSPA results year oneClaro, Brazil (part 2)
* Q2 2008
Achieved resultsThe HSPA network is the fastest broadband option available in many neighborhoodsBoth subscriber numbers and traffic levels have far exceeded Claro’s original expectationsData traffic volume soared twenty fold since the launch Service revenues up 19%, as 3G non-voice and Mobile Broadband revenues soared 58%*

© Ericsson AB 2009 Commercial in confidence 8 July 200921
Prepaid plans to address a mass market
Prepaid was essential to attract the next billion to mobile voice services
– 71% prepaid
Mobile broadband prepaid plans are under rollout all across Latin America and other regions

© Ericsson AB 2009 Commercial in confidence 8 July 200922
Rural HSPA targeting bottom of the pyramid Dialog Telekom, Sri Lanka (part1)
Key Facts Sri LankaPopulation: 21,324,000GDP (per capita): US$ 4,300 Fixed line penetration: 13%Mobile penetration: 40%Internet penetration: 1,4%Broadband penetration: 0.5%
Focus AreaTargets bottom of economic pyramid with rural mobile broadband leveraging HSPA technology
– rural economy generates $350 million/month compared to $110 million in the urban economy
Implementation of 3G/HSPA servicesHSPA services launched 2007, 3G 2006
– “a great opportunity from a financial perspective”
– “only requires a 20% incremental investment”
* By end 2008. HSPA launched 2007.

© Ericsson AB 2009 Commercial in confidence 8 July 200923
Rural HSPA targeting bottom of the pyramid Dialog Telekom, Sri Lanka (part 2)
Achieved results120k 3G subscribers, 30k HSPA users*Broadband commercially viable even among the poorestLeverage knowledge of the low-ARPU prepaid voice marketShared access & Sachet billing
0.56 USD/hour BB internet at 55 rural internet cafésIndividual access: Flat fee and bucket pricing
* By end 2008. HSPA launched 2007.

© Ericsson AB 2009 Commercial in confidence 8 July 200924
Soporte de la Regulaciónpara facilitar el mercado masivo
Acceso sin limites al espectro necesario Espectro armonizado a las recomendaciones internacionales Liberar serviciosCargo por licencias y contra prestaciones razonablesAplicación de impuestos después de crear cobertura y un sano negocioFacilitar compartición de partes de la red.Apoyar con la construcción rápida de la red de energía para el desarrollo rural
© Ericsson AB 2009 Commercial in confidence 8 July 200925
Resumen
La banda ancha ayuda a reducir la crisis económicaLa banda ancha móvil ayuda a los individuos, negocios, instituciones, la sociedad y la economía de las naciones
El regulador tiene un papel importante para que esto suceda
El operador requiere facilidades para invertir en zonas rurales en una manera rentable
El desarrollo tecnológico de EDGE/HSPA/LTE garantiza una gran economía de escala para banda ancha móvil / fija

© Ericsson AB 2009 Commercial in confidence 8 July 200926


