
July 15, 2021
REVENUE ESTIMATES OF M-68: ONE-TIME TAX ON EXTREME WEALTH
Powered by TCPDF (www.tcpdf.org)

The Parliamentary Budget Officer (PBO) supports Parliament by providing
economic and financial analysis for the purposes of raising the quality of
parliamentary debate and promoting greater budget transparency and
accountability.
Lead Analyst:
Louis Perrault, Advisor-Analyst
This report was prepared under the direction of:
Xiaoyi Yan, Director, Budgetary Analysis
Nancy Beauchamp, Carol Faucher and Rémy Vanherweghem assisted with
the preparation of the report for publication.
For further information, please contact [email protected]
Yves Giroux
Parliamentary Budget Officer
RP-2122-012-M_e
© Office of the Parliamentary Budget Officer, Ottawa, Canada, 2021
Table of Contents
Executive Summary 1
1. Introduction 2
2. Revenue Estimates 2
2.1. Updating the High-net-worth Family Database 2
2.2. Deriving a behavioural response 3
2.3. Results 4
2.4. Sources of Uncertainty 5
Appendix A: Wealth tax avoidance model 6
References 8
Notes 9

Revenue Estimates of M-68: One-time Tax on Extreme Wealth
1
Executive Summary
This report is in response to a request by Member of Parliament Nathaniel
Erskine-Smith (Beaches–East York) to estimate the revenues from
implementing a one-time tax on extreme wealth outlined in Motion M-68
placed on notice on February 11, 2021.1
Specifically, it presents PBO’s revenue estimates for imposing a one-time tax
on net wealth accumulated up to the end of April 2021 by Canadian resident
economic families. The proposed tax rate is 3% on net wealth over $10
million and 5% on net wealth over $20 million. The tax liability is to be paid
over a period of five years.
Summary Table 1 presents the estimated net revenues (gross revenues minus
administrative costs) of the proposed one-time tax on net wealth. The table
includes estimated revenues under different behavioural assumptions. The
first estimate in Summary Table 1 uses the consistent assumption of
behavioural response to annual wealth taxes in PBO’s previously published reports.2 Under this assumption, the total estimated net revenues is $44
billion over 5 years. The second estimate introduces new behavioural
assumptions considering the proposed measure would be a one-time tax on
wealth already accumulated. Using this model, PBO finds that the total
estimated net revenues is $60.7 billion over five years.
Estimated net revenues of the one-time wealth tax, by
fiscal years and behavioural assumptions.
$ Billions 2021-
2022
2022-
2023
2023-
2024
2024-
2025
2025-
2026 Total
35 per cent net wealth reduction
Net revenues 8.8 8.8 8.8 8.8 8.8 44.0
New behavioural assumption (15 and 20 per cent net wealth reduction)
Net revenues 12.1 12.1 12.1 12.1 12.1 60.7
Sources: PBO calculations; PBO High-net-worth Family Database
Note: Totals may not add due to rounding.
Summary Table 1

Revenue Estimates of M-68: One-time Tax on Extreme Wealth
2
1. Introduction
This report is in response to a request by Member of Parliament Nathaniel
Erskine-Smith (Beaches-East York) to estimate the revenues from
implementing a one-time tax on extreme wealth outlined in Motion M-68
placed on notice on February 11, 2021.3 The proposed tax has the following
features:
• A 3% tax on net wealth over $10 million and a 5% on net wealth
over $20 million that has been accumulated up to the end of April
2021 by Canadian resident economic families;
• Net wealth is defined as financial and non-financial assets minus
total liabilities;
• There are no exemptions for specific assets; and
• The amount of tax owed is to be paid in five equal payments over a
period of 5 years with no interest.
This report describes the PBO’s estimation of the tax revenues. First, the
PBO’s High-net-worth Family Database (HFD) is updated to reflect the latest
information available. The behavioural response to annual wealth taxes used
in the previously published reports is considered; in addition, a model is
developed to derive the behavioural response to the one-time wealth tax.
The tax revenues are then estimated incorporating the behavioural responses
and divided equally over a period of 5 fiscal years.
2. Revenue Estimates
2.1. Updating the High-net-worth Family Database
To construct the tax base for the proposed tax on accumulated net wealth,
the PBO’s HFD had to be projected to April 2021. PBO proceeded with the
projection in the same way as in the previous wealth tax reports, but
modified how it grows the top tail of the wealth distribution. The small
change in methodology, made to account for recent increases of wealth at
the very top, incorporated information from the Forbes World’s Billionaires List.4
The net wealth of individuals/families found in both the 2016’s Canadian Business Rich List (CB) and in the Forbes lists was updated using the growth

Revenue Estimates of M-68: One-time Tax on Extreme Wealth
3
in net wealth in Forbes from 2017 and 2021.5 For the entries that are not in
both publications, the average growth of net wealth from Canadian residents
present in the both lists was used. The final adjustment made to the top tail
is to incorporate new entrants from the Forbes 2021 list. The net wealth of
the new top tail is then divided in its components of financial assets, non-
financial assets, and total liabilities as in the original construction of the HFD.
The rest of the wealth distribution is updated by increasing the population
using growth rates from Statistics Canada’s Quarterly Demographic Estimates
up to Q1 2021, adjusted for the number of families in the top tail. Financial
assets, non-financial assets, and liabilities of each family were increased
proportionally and brought in line with the growth rates of their aggregate
totals in (a) the National Balance Sheet Accounts up to Q4 2020 and (b)
PBO’s Economic Model for Q1 2021. Adjustments are made to exclude the
growth stemming from the top tail of the distribution to avoid double
counting.
2.2. Deriving a behavioural response
Previous PBO evaluations of a wealth tax were based on the assumption that
families would reduce their reported wealth by 35% in response to the
imposition of a 1% annual tax on wealth, including future wealth. The
proposed tax measure considered in this report, by contrast, targets already
accumulated wealth and applies only once (even if it is be paid over 5 years).
Any future dynamic effects resulting from the imposition of the tax will not
affect its revenues. The only behavioural impact on tax revenues is avoidance
and evasion. This distinction required a change to the previously used
behavioural assumption that included dynamic considerations.
To capture the main behavioural responses to the one-time wealth tax, PBO
used a stylized model of wealth tax avoidance and evasion.6 Informed by the
observed avoidance/evasion behaviour with respect to the US estate tax and
the stylized model, PBO obtained a behavioural response that is a function of
the tax rate. The results of this back-of-the-envelope calculation implies that
for families facing a 3% tax rate, 15% of their wealth is likely to be
avoided/evaded. For those facing a 5% tax rate, the share of wealth
avoided/evaded will be 19.8%.7 For families with net wealth between $23.5
million and $24.9 million, just enough will be avoided/evaded to stay at the
$20 million threshold. The details of the stylized model and how the PBO
derived the key parameter of the model can be found in Appendix A.

Revenue Estimates of M-68: One-time Tax on Extreme Wealth
4
2.3. Results
This report presents two estimates of the revenues from the proposed one-
time tax on net wealth. One of the estimates uses the same behavioural
response assumed in previously published reports where there is a 35%
reduction of reported wealth due to the imposition of the tax; the second
estimate uses the modeled behavioural response as highlighted above. Note
that we present the scenario of no behavioural response as a benchmark to
highlight the importance of the behavioural response of families , but is not
considered to be plausible.
To complete the estimates, administrative costs of collecting the tax must be
considered. PBO assumes administrative costs to be 2% of the gross
revenues collected.8
Estimates shown in Table 2-1 are the revenues that will be collected over five
years as well the number of families that will face the wealth tax. These
estimates are broken down by gross revenues and administrative costs as
well as by behavioural assumptions.
Estimated Revenues of one-time wealth tax, under
different behavioural responses
Behavioural response assumptions
No behavioural
response
35% net wealth
reduction
New modeled
behavioural response
Number of families 87,149 46,805 68,686
Tax base ($ Billions) 1,892 1,008 1,403
Gross tax revenues (A)
($ Billions) 84.2 44.9 62.0
Administrative costs (B)
($ Billions) 1.7 0.9 1.2
Net revenues (A-B)
($ Billions) 82.5 44.0 60.7
Sources: PBO calculations; PBO High-net-worth Family Database
Note: Totals may not add due to rounding.
Table 2-1 also illustrates the change to the tax base, i.e. net wealth above $10
million, based on different behavioural response assumptions. Note that due
to the high wealth threshold and the unequal nature of the wealth
distribution, the reduction in reported wealth will lead to an even greater
reduction in the tax base.
M-68 proposes that the tax obligations be paid over 5 years. The annual
profile of revenues and administrative costs are assumed to be equally
divided over 5 fiscal years from 2021-2022 to 2025-2026.
Table 2-1

Revenue Estimates of M-68: One-time Tax on Extreme Wealth
5
2.4. Sources of Uncertainty
This report includes two sets of estimates of the revenues from the proposed
one-time tax on accumulated net wealth, using two different modelling
approaches to behavioural responses. This highlights the high uncertainty
about the true response to the imposition of this tax. Supplementary details
of the policy design and the enforcement of tax compliance will be crucial in
determining the true response of families facing the wealth tax. The absence
of robust information on assets and liabilities of taxpayers by the Canada
Revenue Agency is an additional source of uncertainty with respect to the
estimate, as it would complicate compliance and enforcement. Furthermore,
the asset valuation techniques prescribed by the legislation and the related
administrative cost can increase the uncertainty of the estimation.
In addition to behavioural responses, the true distribution of wealth above
$10 million remains uncertain. Caveats that applied to the creation of the
HFD remain valid, but how most of the database is brought forward from
2016 to 2021 may lead to an overstatement of wealth concentration. At the
same time, updating the very top of the net wealth distribution using Forbes
adds further uncertainty. As was the case in 2016, the Forbes list may be
undercounting the number of wealthy Canadian families, which would reduce
the amount of wealth at the top. However, there is substantial volatility in the
valuation of wealth at the top. The use of an average growth rate for the
missing entries in the Forbes 2021 found in Canadian Business Rich list of
2016 may overestimate the wealth at the top.
Finally, the collection of the tax revenues may be constrained by liquidity
issues. For families with high levels of wealth, much of this wealth tends to be
tied to business ownerships that can’t easily be sold to pay wealth tax
liabilities. Although the payment of tax owed is spread over five years, it may
not solve all issues stemming from liquidity constraints. Further provisions
may be necessary to fully address this problem. These considerations are not
taken into account in this report and may lead to further uncertainty with
respect to revenues raised by the tax.
Revenue Estimates of M-68: One-time Tax on Extreme Wealth
6
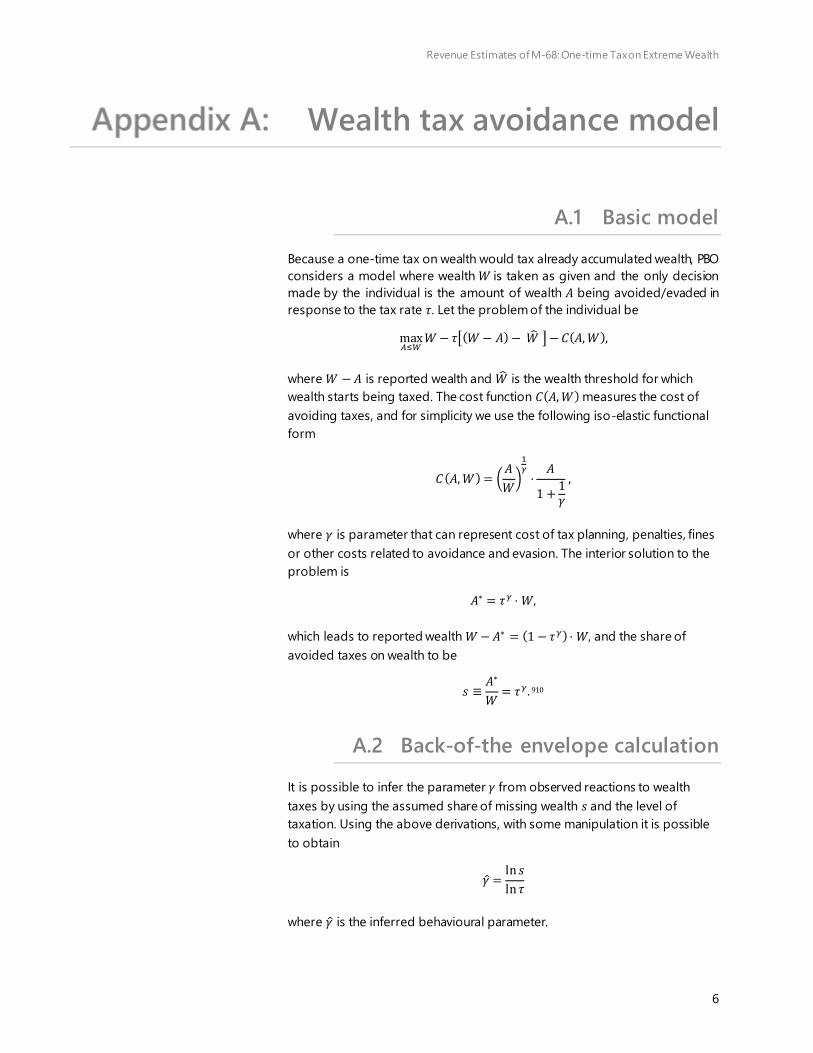
Wealth tax avoidance model
A.1 Basic model
Because a one-time tax on wealth would tax already accumulated wealth, PBO
considers a model where wealth 𝑊 is taken as given and the only decision
made by the individual is the amount of wealth 𝐴 being avoided/evaded in
response to the tax rate 𝜏. Let the problem of the individual be max𝐴≤𝑊 𝑊 − 𝜏[(𝑊 − 𝐴) − �̂� ] − 𝐶(𝐴, 𝑊), where 𝑊 − 𝐴 is reported wealth and �̂� is the wealth threshold for which
wealth starts being taxed. The cost function 𝐶(𝐴, 𝑊) measures the cost of
avoiding taxes, and for simplicity we use the following iso-elastic functional
form
𝐶(𝐴, 𝑊) = ( 𝐴𝑊)1𝛾 ⋅ 𝐴1 + 1𝛾 , where 𝛾 is parameter that can represent cost of tax planning, penalties, fines
or other costs related to avoidance and evasion. The interior solution to the
problem is 𝐴∗ = 𝜏𝛾 ⋅ 𝑊, which leads to reported wealth 𝑊 − 𝐴∗ = (1 − 𝜏𝛾) ⋅ 𝑊, and the share of
avoided taxes on wealth to be 𝑠 ≡ 𝐴∗𝑊 = 𝜏𝛾. 910
A.2 Back-of-the envelope calculation
It is possible to infer the parameter 𝛾 from observed reactions to wealth
taxes by using the assumed share of missing wealth 𝑠 and the level of
taxation. Using the above derivations, with some manipulation it is possible
to obtain
𝛾 = ln 𝑠ln 𝜏
where 𝛾 is the inferred behavioural parameter.

Revenue Estimates of M-68: One-time Tax on Extreme Wealth
7
For the US estate tax, there are important deductions that can lower the
effective tax rate payed on the estate at death. To take this into consideration
in a simple manner, it is possible to modify the model by introducing a
constant 𝛼 in front of reported wealth in the above problem. This constant
keeps the problem similar but now the tax rate is applied to the net-of-
deduction wealth. The share of the wealth being deducted is taken as given.
Solving the individual’s problem yields 𝑠 = (𝛼𝜏)𝛾. The PBO used Saez and Zucman’s (2019) estimate of 33% avoidance/evasion
rate of the US estate tax at the top of the wealth distribution, the maximum
tax rate of 40% and total deductions of 67.9% of the net estate for gross
estates above $50 million to obtained parameter 𝛾.11
The inferred behavioural parameter of wealth avoidance is 𝛾 = ln 0.33 / ln[(1 − 0.679) × 0.40] ≈ 0.54. This implies that for a tax rate of 5% the reduction in reported wealth will be 𝑠 = 19.8% (𝑠 = 15% for a tax rate of 3%).

Revenue Estimates of M-68: One-time Tax on Extreme Wealth
8
References
Saez, E., and G. Zucman. 2019. “Progressive wealth taxation”. BPEA Conference Draft, Fall.
Seim, D. 2017. “Behavioural Responses to Wealth Taxes: Evidence from Sweden”. American Economic Journal: Economic Policy, 395-421.
Slemrod, J. 2001 “A General Model of the Behavioral Response to Taxation”. International Tax and Finance, 8:119-128.

Revenue Estimates of M-68: One-time Tax on Extreme Wealth
9
Notes
1. Motion M-68. Retrieved from:
https://www.ourcommons.ca/members/en/nathaniel-erskine-
smith(88687)/motions/11102201
2. For information on the previous methodology see PBO costing note: Net
wealth tax on Canadian resident families . https://pbo-
dpb.gc.ca/en/blog/news/RP-2021-017-M--net-wealth-tax-canadian-resident-economic-families--impot-patrimoine-net-familles-
economiques-residant-au-canada
3. Ibid, Note 1.
4. Ibid, Note 2.
5. This assumes that the valuation from CB is the correct valuation and that
if there is a difference in the valuation between the two publications, the
error is proportional and stays the same.
6. The simple model of tax avoidance was proposed by Slemrod (2001) and
was applied to wealth taxation evasion in Seim (2017). For PBO’s purposes the model captures both avoidance, a variety of tax planning
activities whose goal is to directly reduce tax liability, and evasion
responses in a reduced-form manner.
7. Note that some families will evade enough such that they will not be
paying any wealth taxes.
8. Inspectorate General of Finances. 2014. “Relatif à la rationalisation du
coût de gestion des prélèvements obligatoires.” Retrieved from
http://www.igf.finances.gouv.fr/files/live/sites/igf/files/contributed/IGF%
20internet/2.RapportsPublics/2014/2014-M-021.pdf. [in French only]
9. For those close to threshold �̂�, the interior solution may lead to more
avoidance than needed. Therefore, many individuals would choose a level of avoidance 𝐴 just enough to reduce their wealth such that it is no
longer taxed. If the wealth tax also features different rates, then you will
see similar “bunching” behaviour around the thresholds.
10. Note that 𝛾 is the elasticity with respect to the tax rate, i.e. 𝜕𝑠𝜕𝜏 𝜏𝑠 = 𝛾
and that the elasticity of taxable wealth is 𝜕(𝑊 − 𝐴)𝜕(1 − 𝜏) 1 − 𝜏𝑊 − 𝐴 = 𝛾 𝜏𝛾−1(1 − 𝜏)1 − 𝜏𝛾 .
Revenue Estimates of M-68: One-time Tax on Extreme Wealth
10
11. The avoidance/evasion rate from the US estate tax incorporates dynamic
considerations, so the inferred parameter maybe considered as an upper
bound.


