Road Surface Management Using
PWS RSMS Software
Presented by Bob Strobel, UNH T2 Center

Introduction
Road Surface Management
What it is
Why to do it
What is involved
Learning Objectives:
The steps to implement a Road Surface Management System
Inventory
Condition Assessment / Surveys / Distresses
Repairs
Decisionmaking
Analysis
Management Plans
Using RSMS Software to implement your PMS
12/6/2011 UNH T2 Center 2
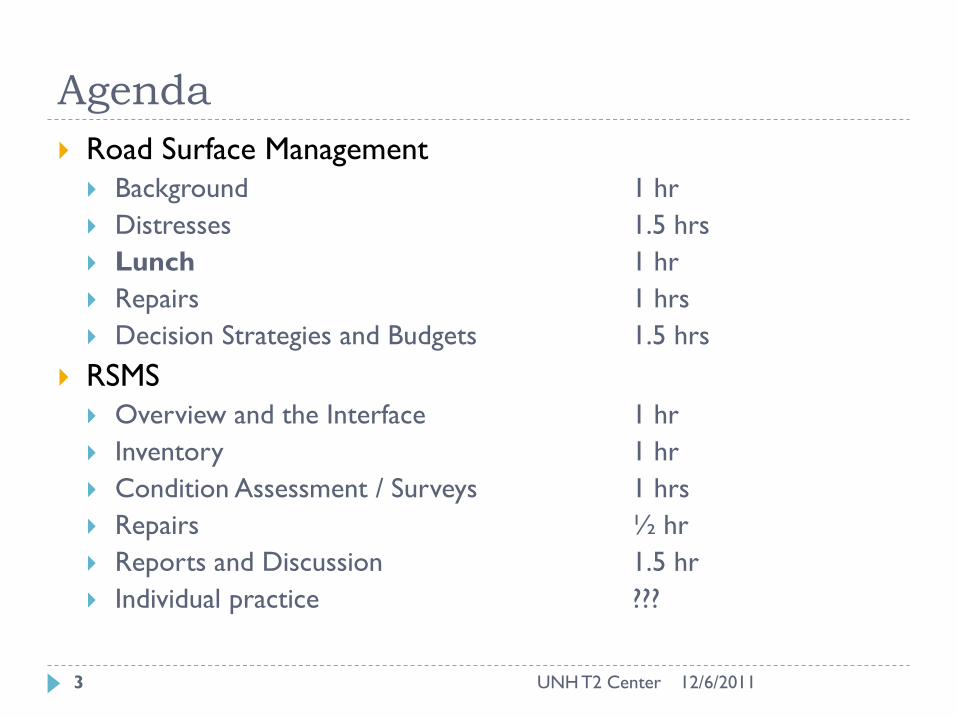
Agenda
Road Surface Management
Background 1 hr
Distresses 1.5 hrs
Lunch 1 hr
Repairs 1 hrs
Decision Strategies and Budgets 1.5 hrs
RSMS
Overview and the Interface 1 hr
Inventory 1 hr
Condition Assessment / Surveys 1 hrs
Repairs ½ hr
Reports and Discussion 1.5 hr
Individual practice ???
12/6/2011 UNH T2 Center 3

Vocabulary
Road Surface - / Pavement Management System (PMS)
Condition Assessment / Windshield Survey
What shape are your roads in? Determine the distresses and ratings
Distress
Indicators of stress or strain in the road surface such as cracks, potholes, rutting, etc.
Network
The collection of assets (roads) in an agency (town)
Project
A repair confined to a specific, limited area such as a single road, neighborhood, or subdivision
12/6/2011 UNH T2 Center 4

Lifecycle of a Road
0 4 8 12 16
Very Good
Good
Fair
Poor
Very Poor
Years
40% QUALITY
DROP
40% QUALITY
DROP
75% TIME
12% TIME
EACH $1 OF
REPAIR COST
HERE...
WILL COST
$4-8 IF
DELAYED TO
HERE
UNH Technology Transfer Center 5
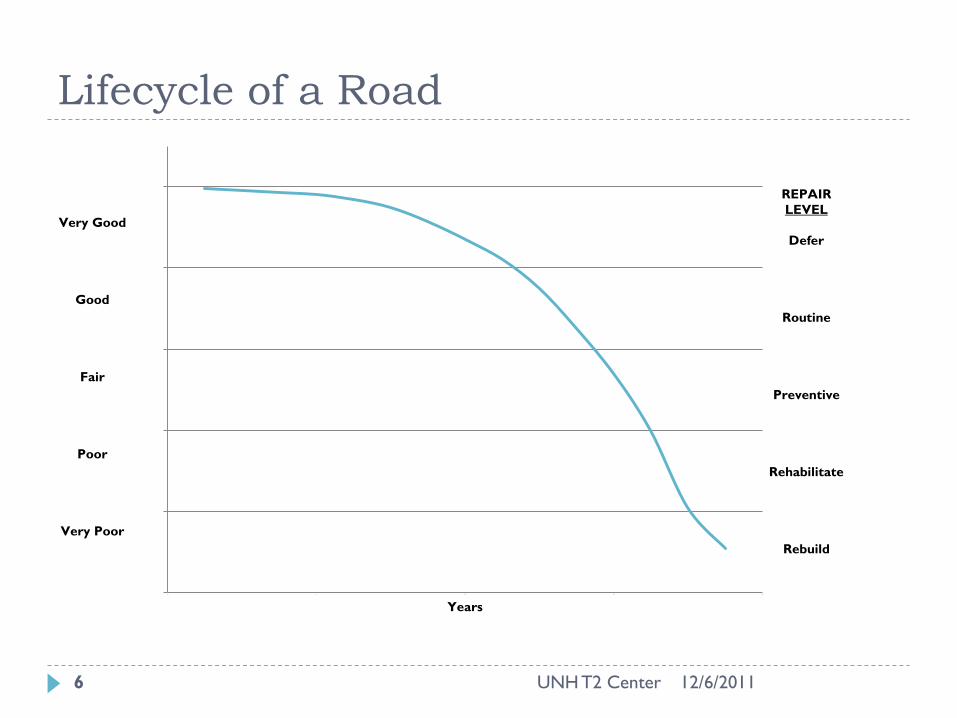
Lifecycle of a Road
0 4 8 12 16
REPAIR
LEVEL
Defer
Routine
Preventive
Rehabilitate
Rebuild
Very Good
Good
Fair
Poor
Very Poor
Years
12/6/2011 UNH T2 Center 6
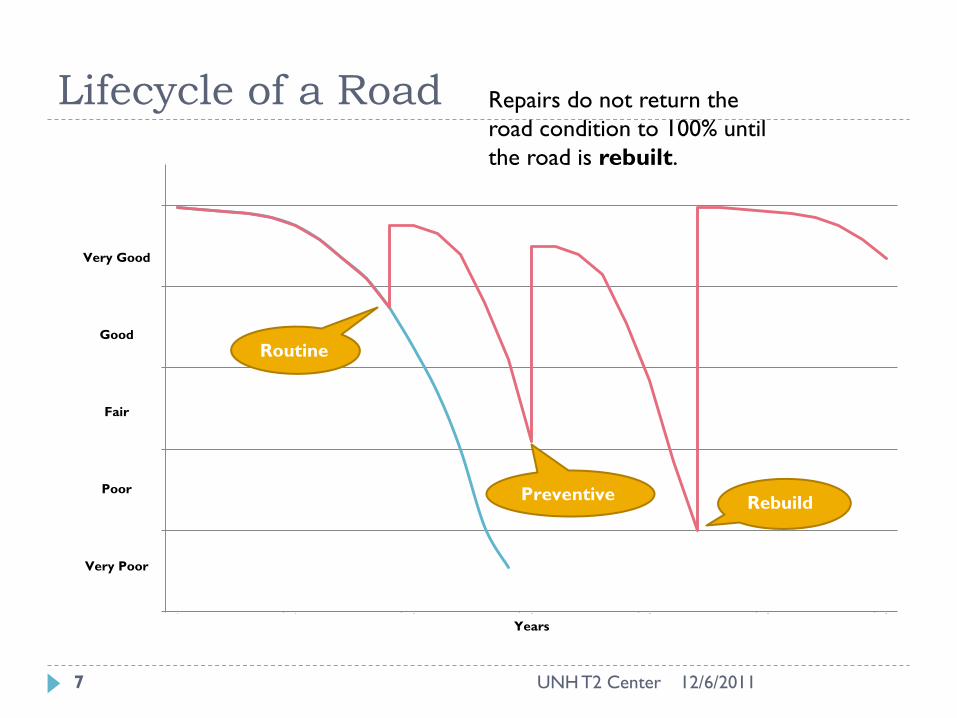
Lifecycle of a Road
0 5 10 15 20 25 30
Very Good
Good
Fair
Poor
Very Poor
Years
Routine
Preventive Rebuild
Repairs do not return the
road condition to 100% until
the road is rebuilt.
12/6/2011 UNH T2 Center 7
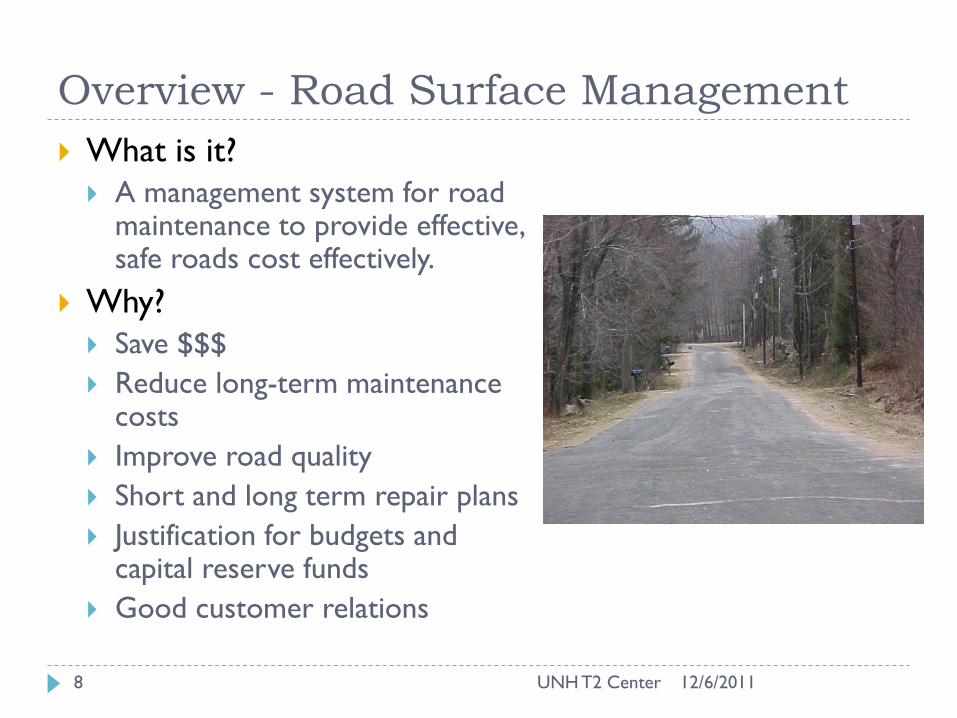
Overview - Road Surface Management
What is it?
A management system for road maintenance to provide effective, safe roads cost effectively.
Why?
Save $$$
Reduce long-term maintenance costs
Improve road quality
Short and long term repair plans
Justification for budgets and capital reserve funds
Good customer relations
12/6/2011 UNH T2 Center 8
Guiding Principles
Apply best technical and management practices
Plan maintenance and repair of network roads
Usable by all sizes of agencies
Flexible for specific considerations
Exceptions from normal practices based on specific conditions
High Roughness = shim and overlay, not just overlay
Curb reveal minimum = mill and overlay
12/6/2011 UNH T2 Center 9
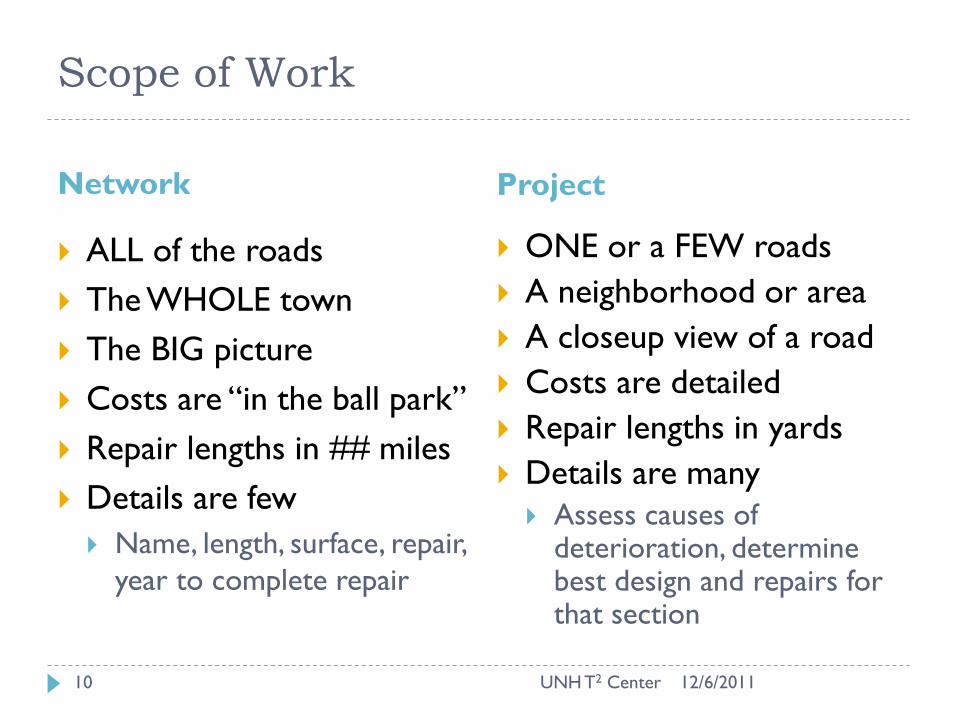
Scope of Work
Network Project
ALL of the roads
The WHOLE town
The BIG picture
Costs are “in the ball park”
Repair lengths in ## miles
Details are few
Name, length, surface, repair,
year to complete repair
ONE or a FEW roads
A neighborhood or area
A closeup view of a road
Costs are detailed
Repair lengths in yards
Details are many
Assess causes of deterioration, determine best design and repairs for that section
UNH T2 Center 12/6/2011 10
Road Surface Management
What is involved?
Inventory – what you maintain
Roads – surface type, length, width, name, other physical identifiers
Condition Assessment – what shape it is in
Distresses - Cracks, rutting, potholes, patching, dust, roughness
Repairs – what to do to it
What is used in your agency
Management Plan: Which repairs are highest priority?
How do I best expend my budget?
Keep my good roads good?
Worst first?
Mix it up?
Play politics ?
Complaints (‘My road is worse than your road’)?
12/6/2011 UNH T2 Center 11
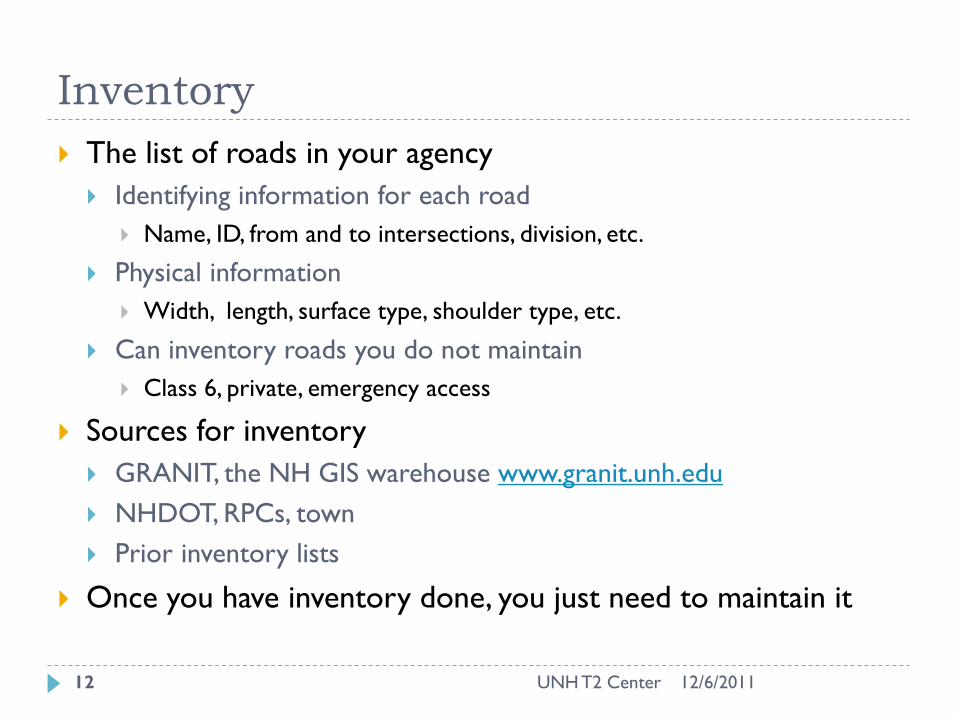
Inventory
The list of roads in your agency
Identifying information for each road
Name, ID, from and to intersections, division, etc.
Physical information
Width, length, surface type, shoulder type, etc.
Can inventory roads you do not maintain
Class 6, private, emergency access
Sources for inventory
GRANIT, the NH GIS warehouse www.granit.unh.edu
NHDOT, RPCs, town
Prior inventory lists
Once you have inventory done, you just need to maintain it
12/6/2011 UNH T2 Center 12
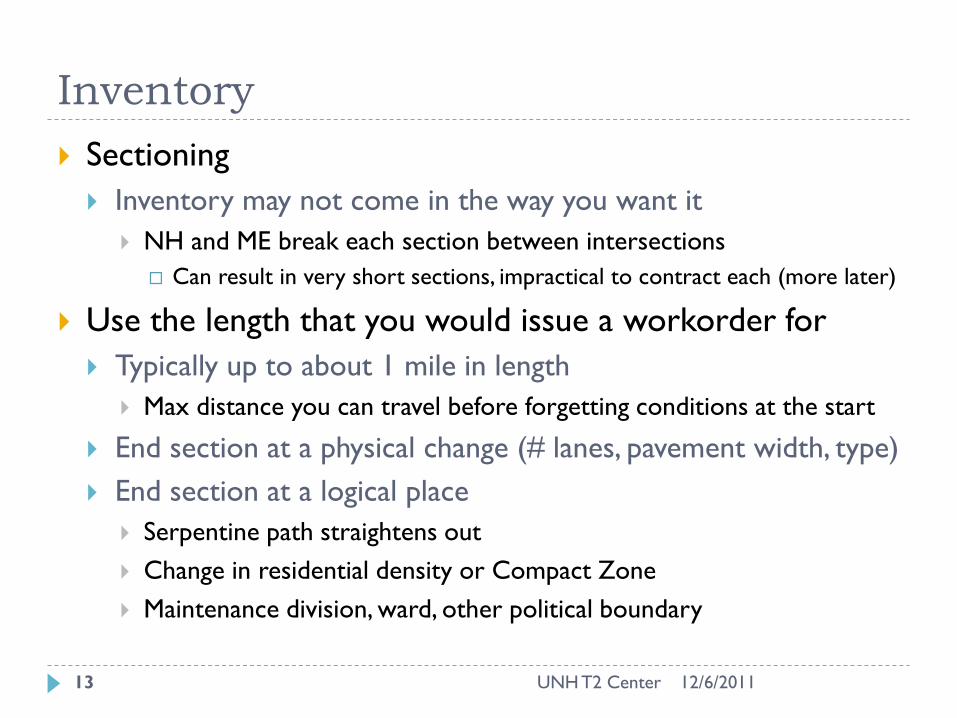
Inventory
Sectioning
Inventory may not come in the way you want it
NH and ME break each section between intersections
Can result in very short sections, impractical to contract each (more later)
Use the length that you would issue a workorder for
Typically up to about 1 mile in length
Max distance you can travel before forgetting conditions at the start
End section at a physical change (# lanes, pavement width, type)
End section at a logical place
Serpentine path straightens out
Change in residential density or Compact Zone
Maintenance division, ward, other political boundary
12/6/2011 UNH T2 Center 13
Distresses
An indicator of a problem stressing the road surface
Cracks
Potholes
Rutting
Dust
Washboarding
12/6/2011 UNH T2 Center 14
Distresses
Identify = which?
Severity = how bad?
Extent = how much?
12/6/2011 UNH T2 Center 15
Distresses
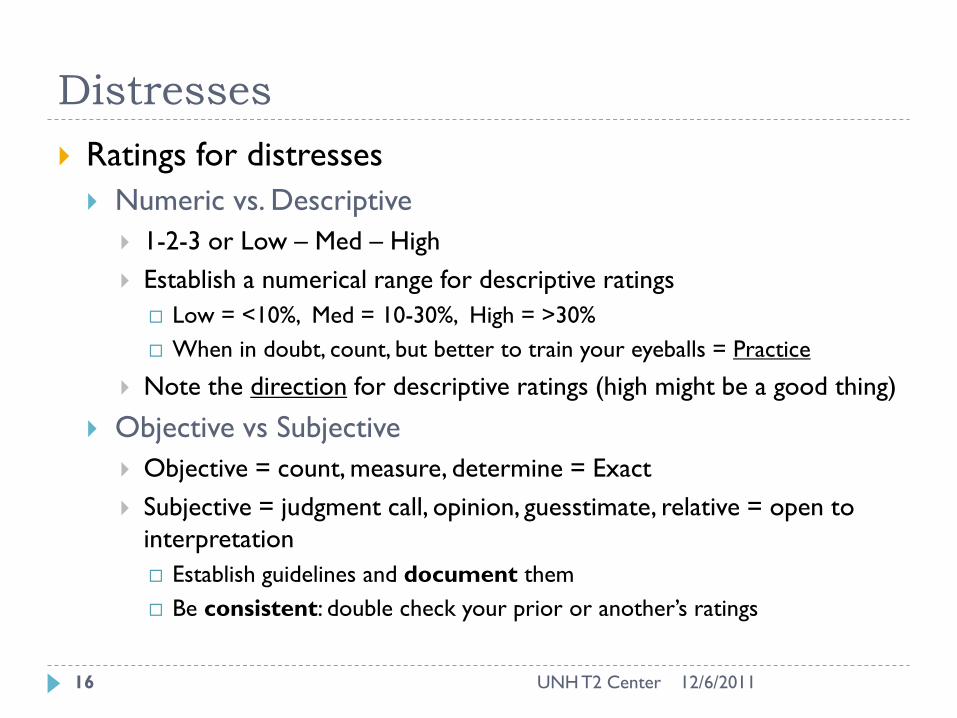
Ratings for distresses
Numeric vs. Descriptive
1-2-3 or Low – Med – High
Establish a numerical range for descriptive ratings
Low = <10%, Med = 10-30%, High = >30%
When in doubt, count, but better to train your eyeballs = Practice
Note the direction for descriptive ratings (high might be a good thing)
Objective vs Subjective
Objective = count, measure, determine = Exact
Subjective = judgment call, opinion, guesstimate, relative = open to
interpretation
Establish guidelines and document them
Be consistent: double check your prior or another’s ratings
12/6/2011 UNH T2 Center 16
Asphalt Road Surface Distresses
Alligator Cracking
Longitudinal/
Transverse
Cracking
Edge Cracking
Patching/Potholes
Roughness
Rutting
12/6/2011 UNH T2 Center 17
Alligator Cracking
Interconnected or interlaced cracks forming connected
irregular shaped polygons
Causes
Repeated Heavy Loads
Poor Drainage
12/6/2011 UNH T2 Center 18
Alligator Cracking
Severity
Low = cracks just visible
Medium = crack width < 1/8”, no
displaced pieces
High = crack width > 1/8” and/or
displaced pieces
12/6/2011 UNH T2 Center 19
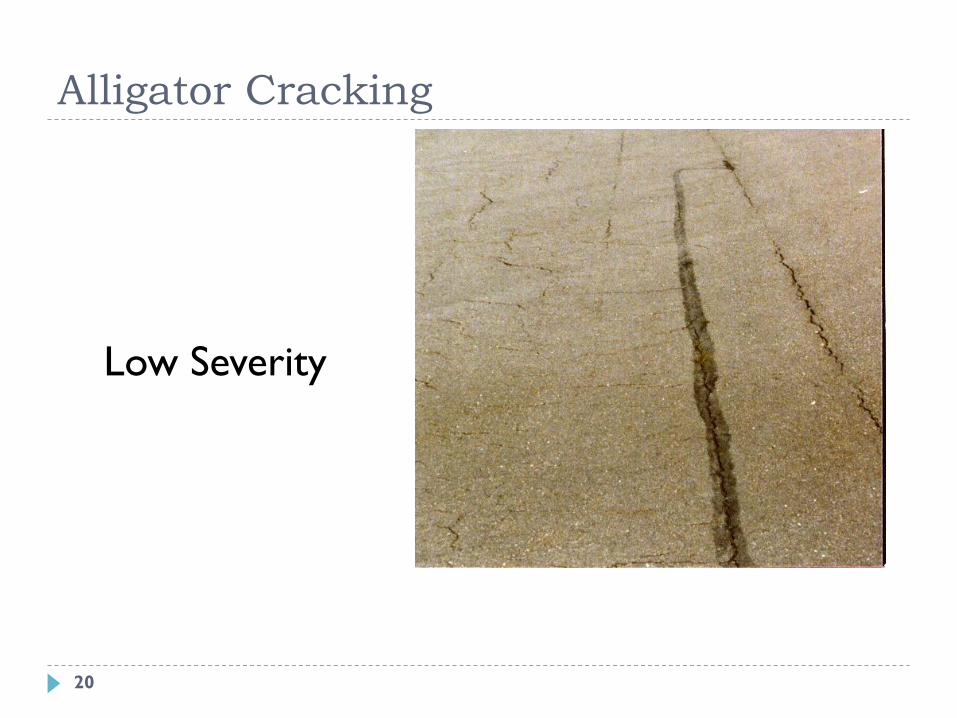
Alligator Cracking
Low Severity
20

Medium Severity
Alligator Cracking
21
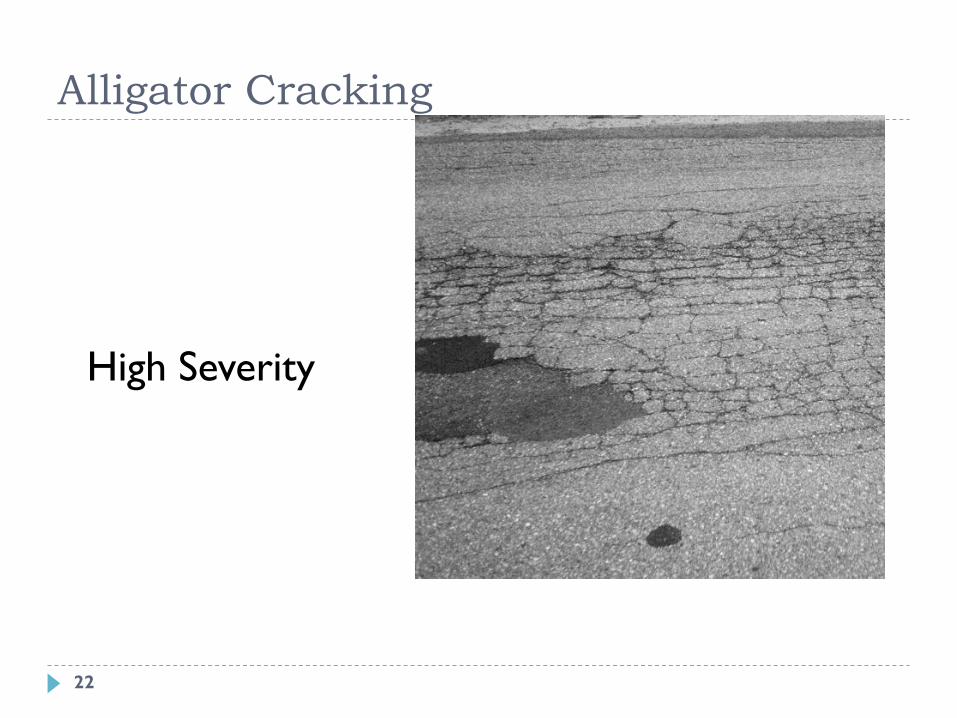
High Severity
Alligator Cracking
22
Alligator Cracking
Extent (percent of surface area)
Low = <10%
Medium = 10% to 30%
High = 30+%
12/6/2011 UNH T2 Center 23 23
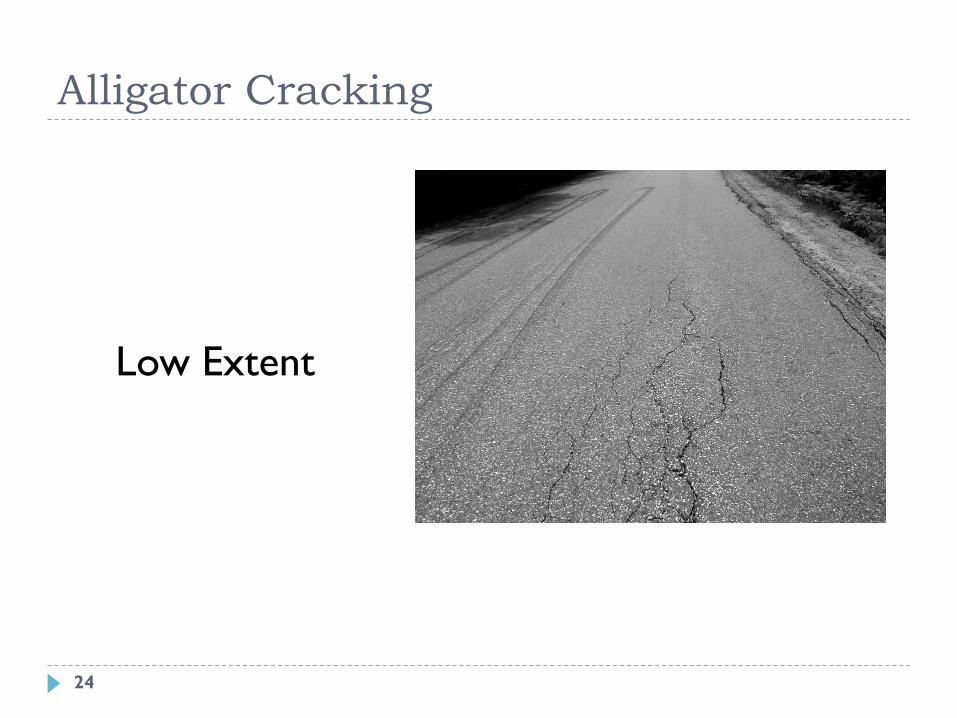
Low Extent
Alligator Cracking
24

Medium Extent
Alligator Cracking
25
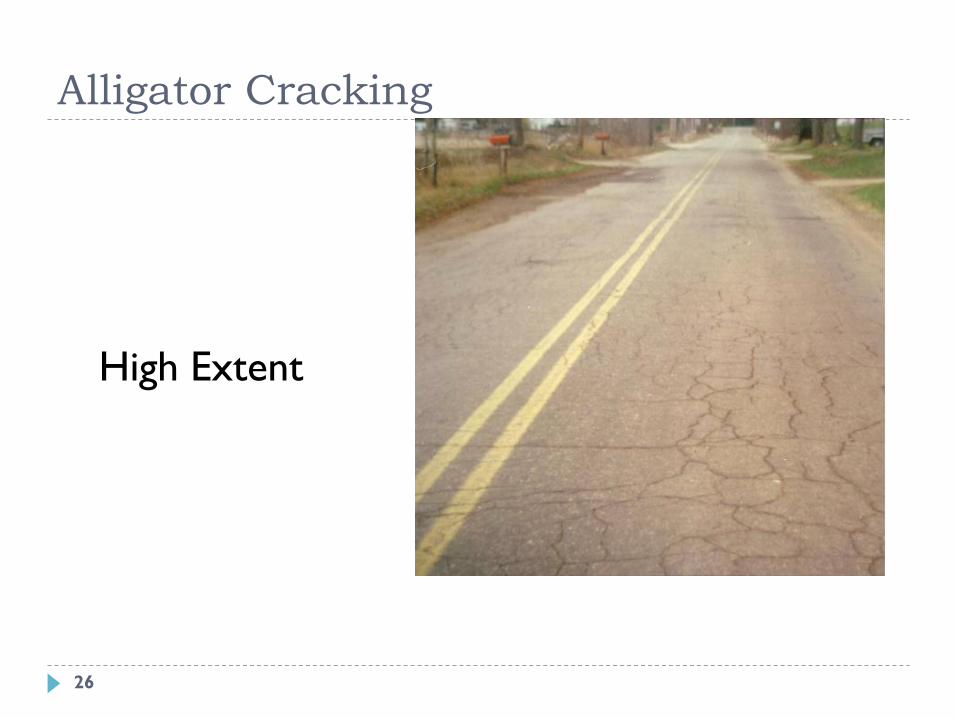
High Extent
Alligator Cracking
26
Longitudinal Cracking
Cracks/breaks parallel to center line
Causes
Poorly Constructed Paving Joints
Shrinkage/Temperature
Reflection
Settlement
12/6/2011 UNH T2 Center 27

Transverse Cracking
Cracks/breaks across roadway
Causes
Shrinkage/Temperature
Reflection
Culverts
Utility Cuts
12/6/2011 UNH T2 Center 28
Longitudinal/Transverse Cracking
Severity
Low = none or very narrow
Medium = ¼”
High = ¼” or larger
12/6/2011 UNH T2 Center 29
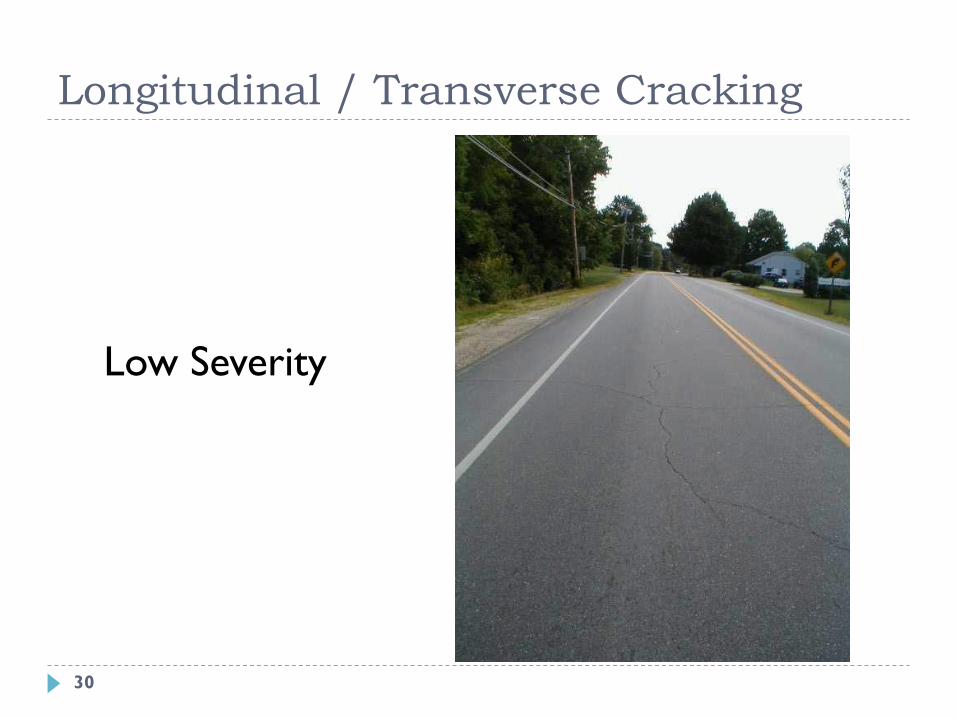
Longitudinal / Transverse Cracking
Low Severity
30
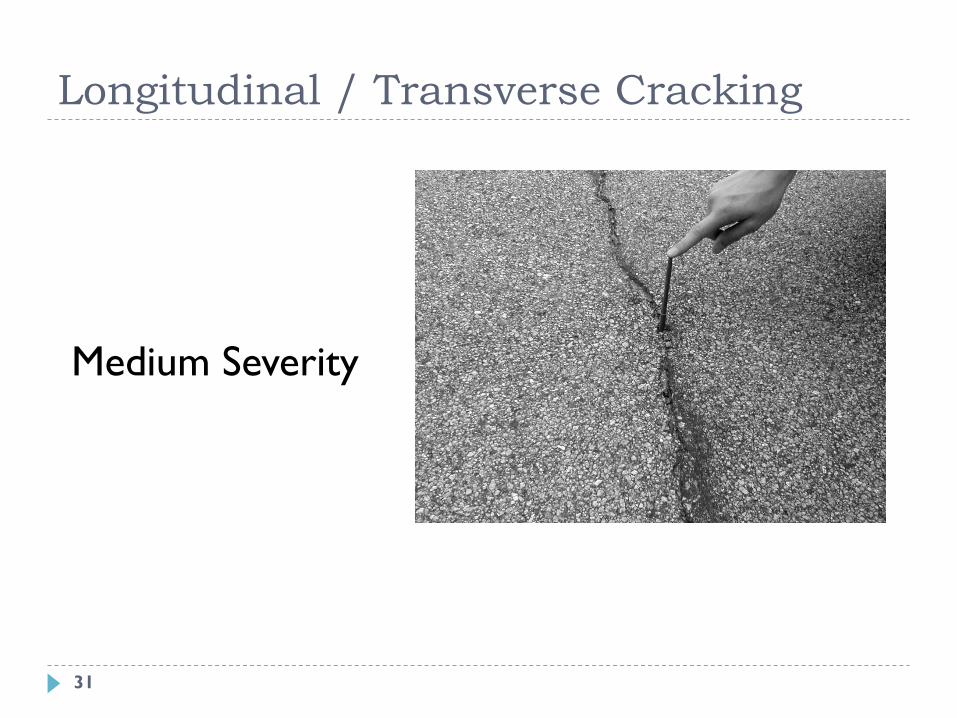
Medium Severity
Longitudinal / Transverse Cracking
31
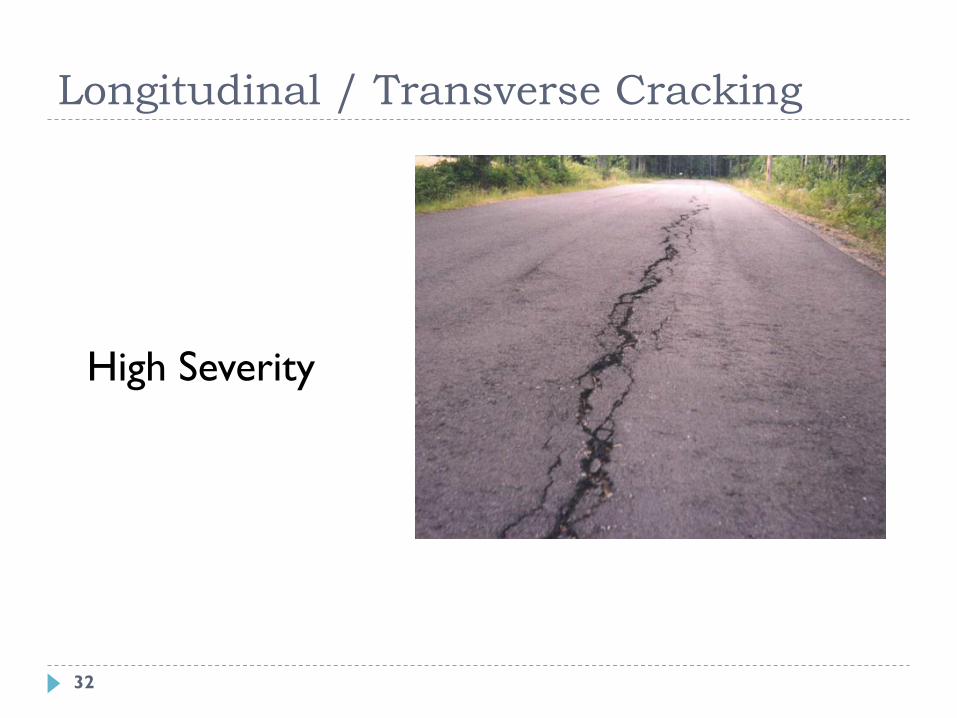
High Severity
Longitudinal / Transverse Cracking
32
Longitudinal / Transverse Cracking
Extent (Longitudinal Cracking)
Low = <10%
Medium = 10% to 30%
High = 30+%
12/6/2011 UNH T2 Center 33

Longitudinal / Transverse Cracking
Extent (Transverse Cracking)
Low = cracks > 50’ apart
Medium = cracks 25’ to 50’ apart
High = cracks < 25’ apart
12/6/2011 UNH T2 Center 34

Longitudinal / Transverse Cracking
Extent (longitudinal and transverse)
Low - If both occur, crack sealing is the best solution
Medium - If both occur to a degree that surface treatment is
the best maintenance option
High - if both occur to a degree that rehabilitation is the best
solution
12/6/2011 UNH T2 Center 35

Low Extent
Longitudinal / Transverse Cracking
36
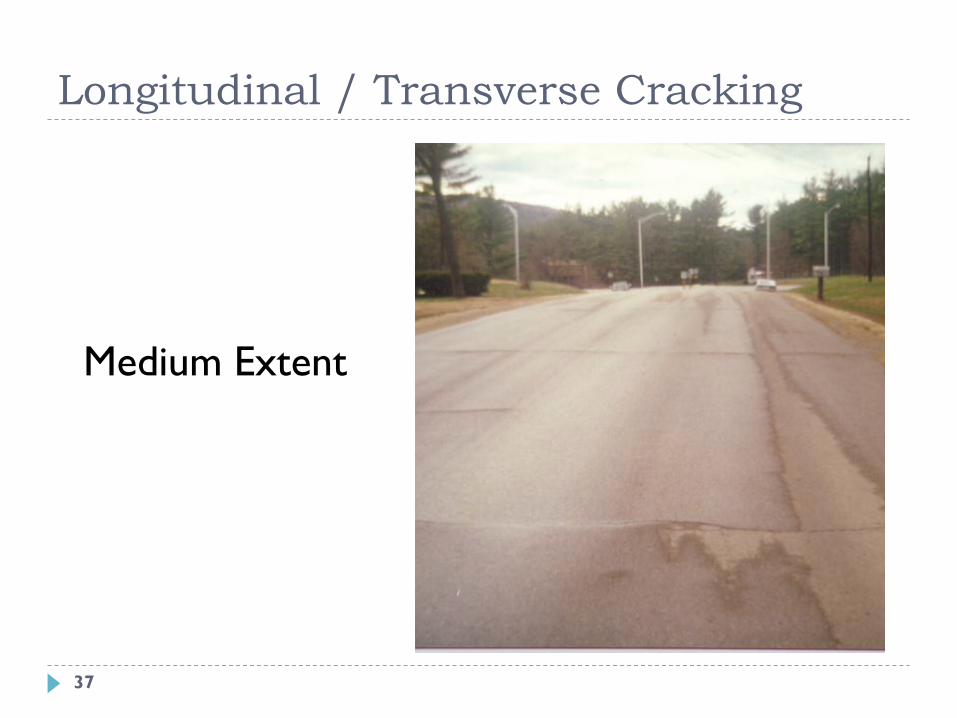
Medium Extent
Longitudinal / Transverse Cracking
37

High Extent
Longitudinal / Transverse Cracking
38

Edge Cracking
Cracking and/or loss of pavement edges
Causes
Loads on Edge of Pavement
Lack of Edge Support (Shoulders)
Materials
Moisture
Thermal (snow piles)
12/6/2011 UNH T2 Center 39

Edge Cracking
Severity
Low - thin cracks, < 12” from
pavement edge
Medium - larger cracks, < 24”
from pavement edge
High - breakup, > 24” from edge
12/6/2011 UNH T2 Center 40

Low Severity
Edge Cracking
41
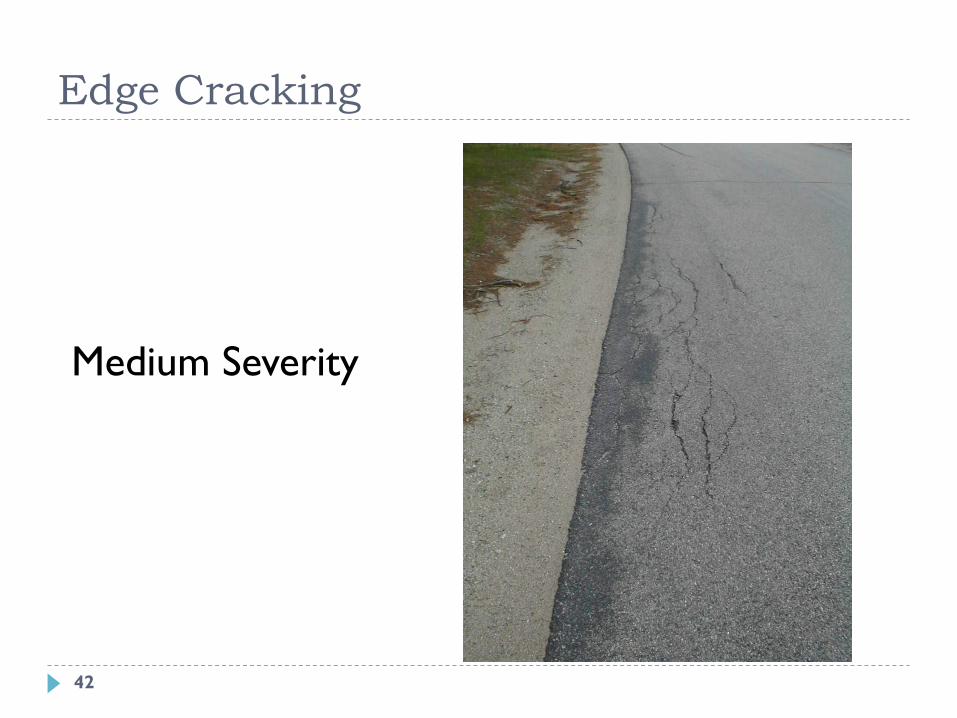
Medium Severity
Edge Cracking
42
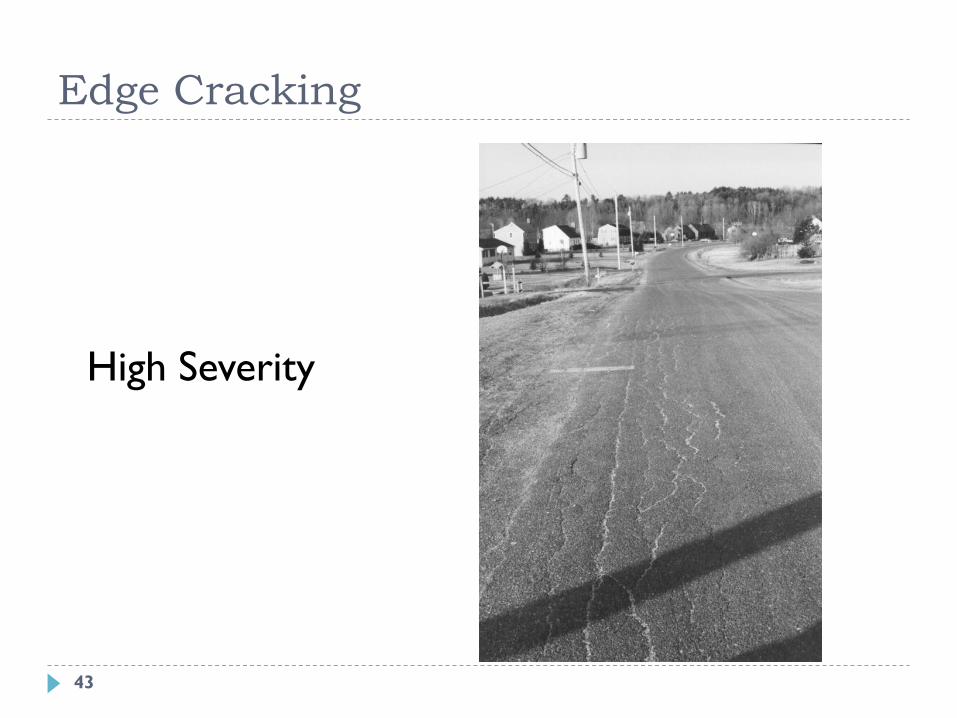
High Severity
Edge Cracking
43
Edge Cracking
Extent
Low = < 10%
Medium = 10% to 30%
High = 30+%
12/6/2011 UNH T2 Center 44
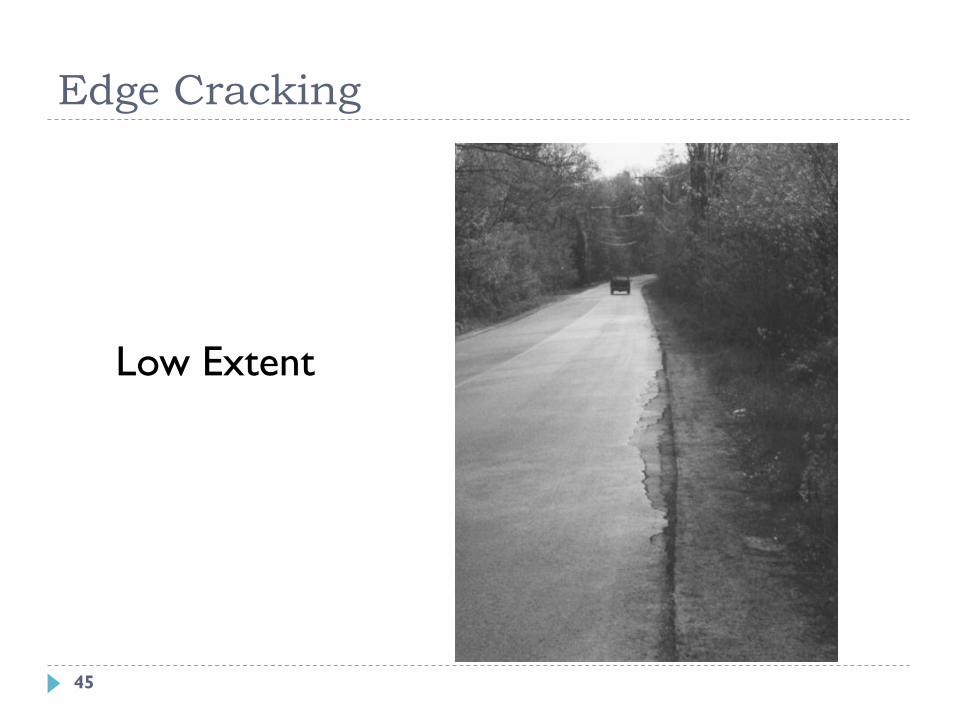
Low Extent
Edge Cracking
45
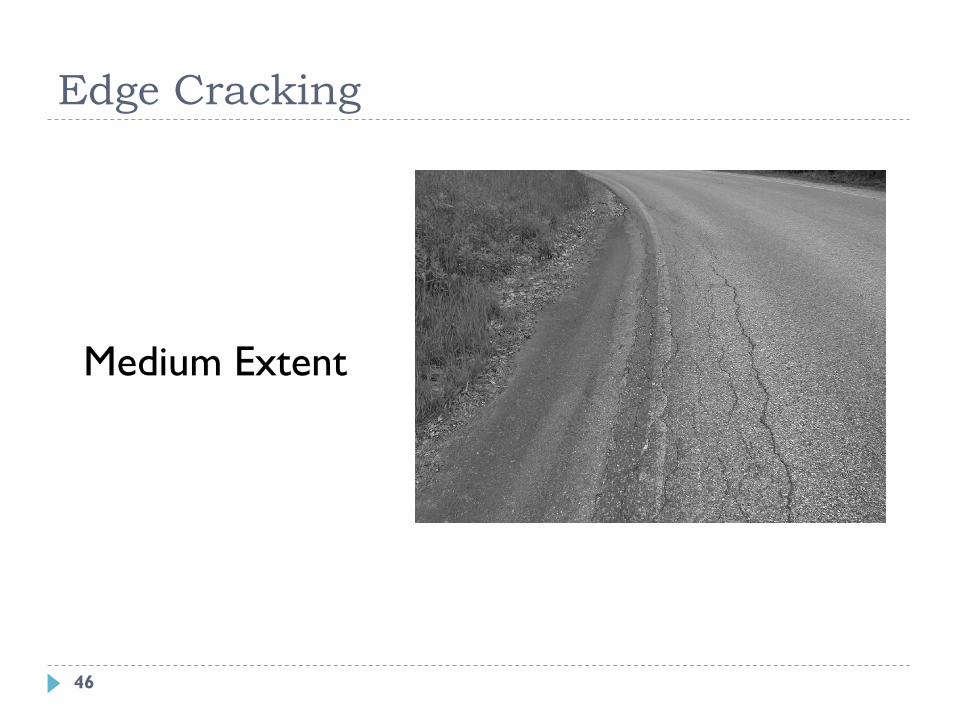
Medium Extent
Edge Cracking
46
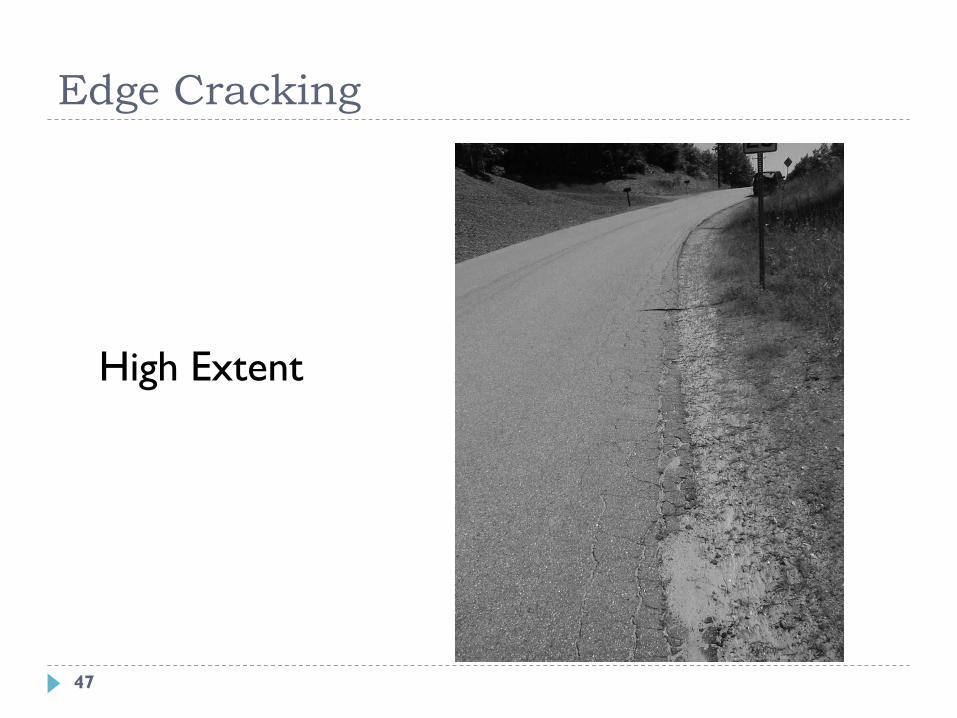
High Extent
Edge Cracking
47
Patching
Isolated small areas of new paving material placed over a
previous distress or in place of removed materials
Causes
Highway Departments
Utility Cuts
12/6/2011 UNH T2 Center 48
Patching
Extent (percent of road length)
Low = <10%
Medium = 10% to 30%
High = 30+%
12/6/2011 UNH T2 Center 49

Potholes
Bowl-shaped voids in pavement surface,
full or partial depth
Causes
Loads
Water in Base
Materials/Construction
12/6/2011 UNH T2 Center 50
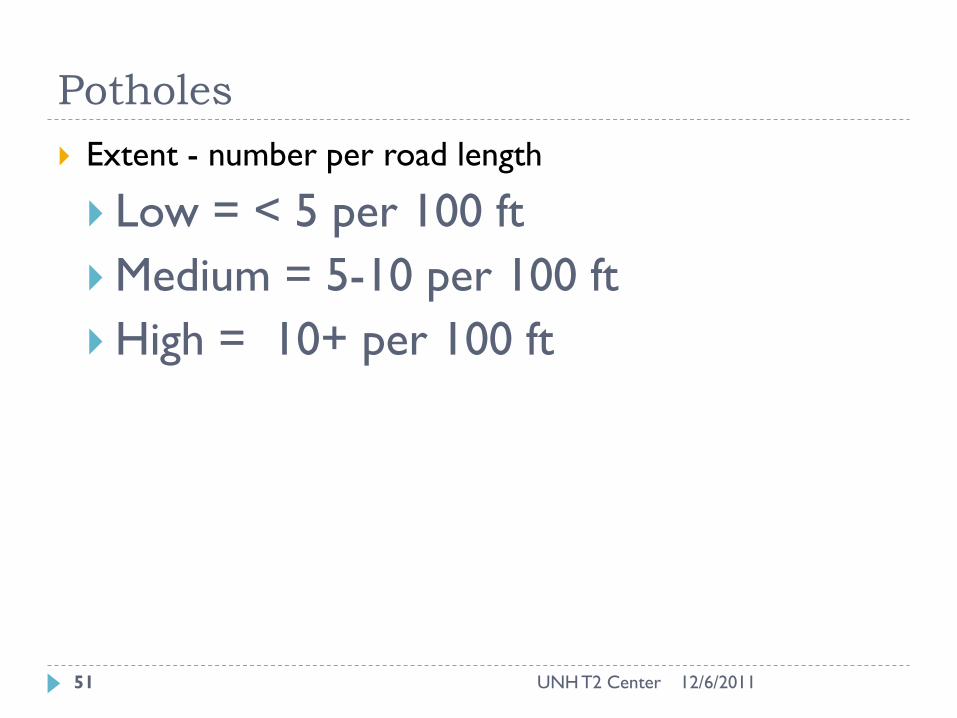
Potholes
Extent - number per road length
Low = < 5 per 100 ft
Medium = 5-10 per 100 ft
High = 10+ per 100 ft
12/6/2011 UNH T2 Center 51
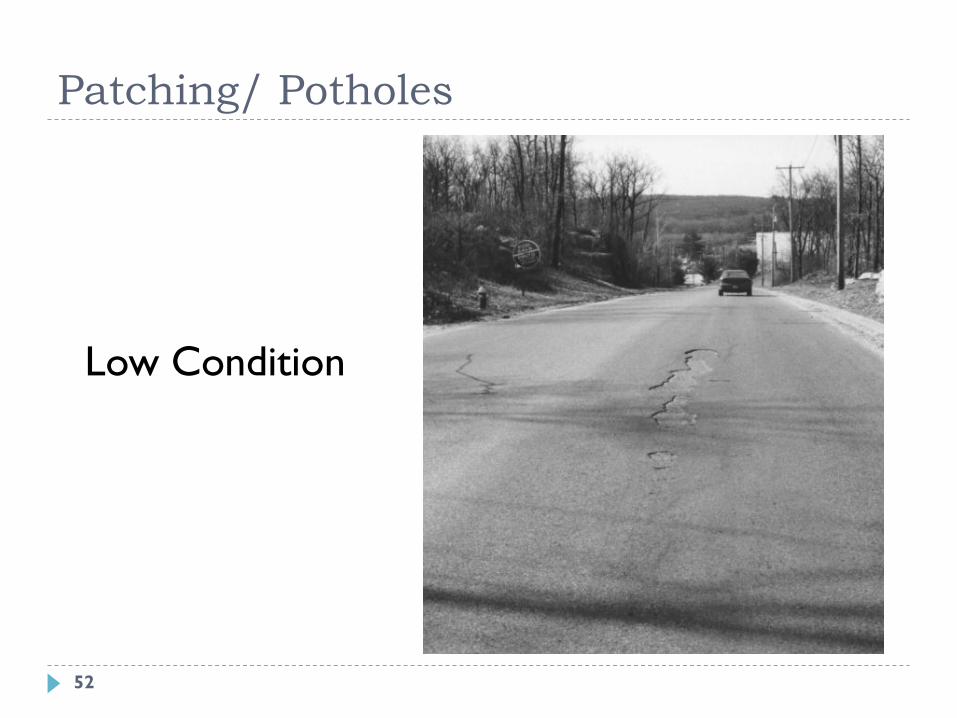
Patching/ Potholes
Low Condition
52
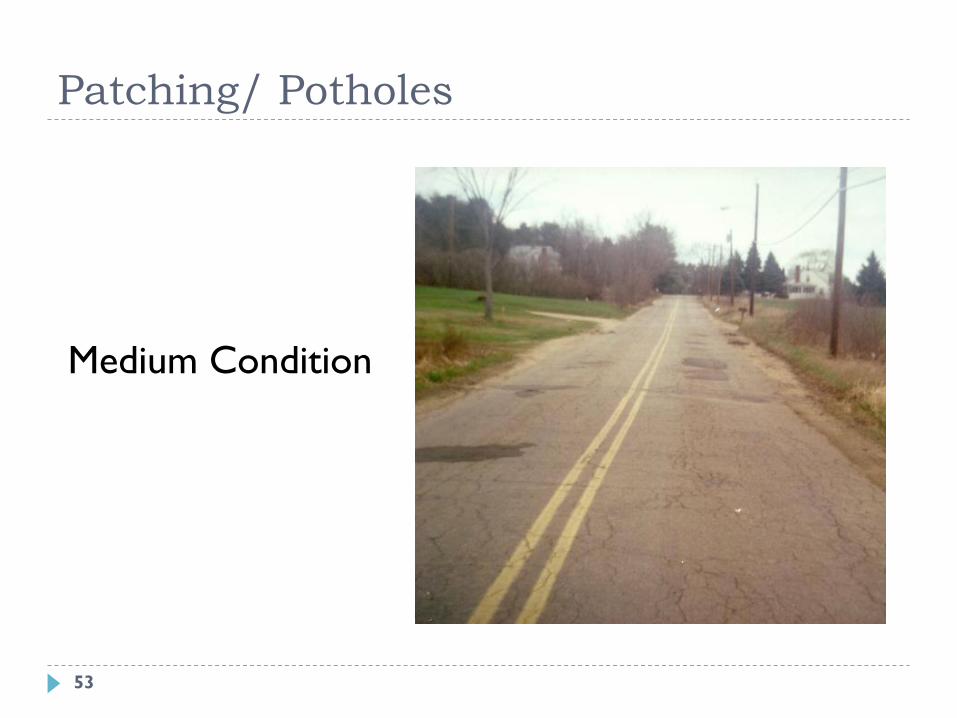
Medium Condition
Patching/ Potholes
53

High Condition
Patching/ Potholes
54

Roughness
All irregularities in the pavement surface that interfere
with a smooth ride
Causes
Shoulders
Ditch depth and slope
Soils
Erosion and obstructions
12/6/2011 UNH T2 Center 55
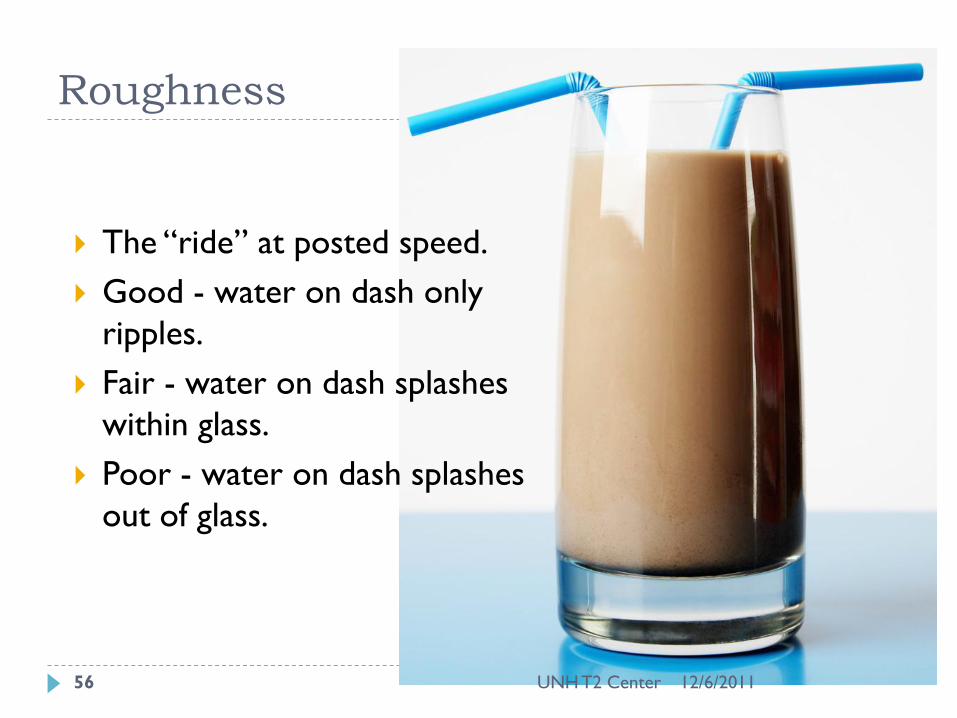
Roughness
The “ride” at posted speed.
Good - water on dash only
ripples.
Fair - water on dash splashes
within glass.
Poor - water on dash splashes
out of glass.
12/6/2011 UNH T2 Center 56
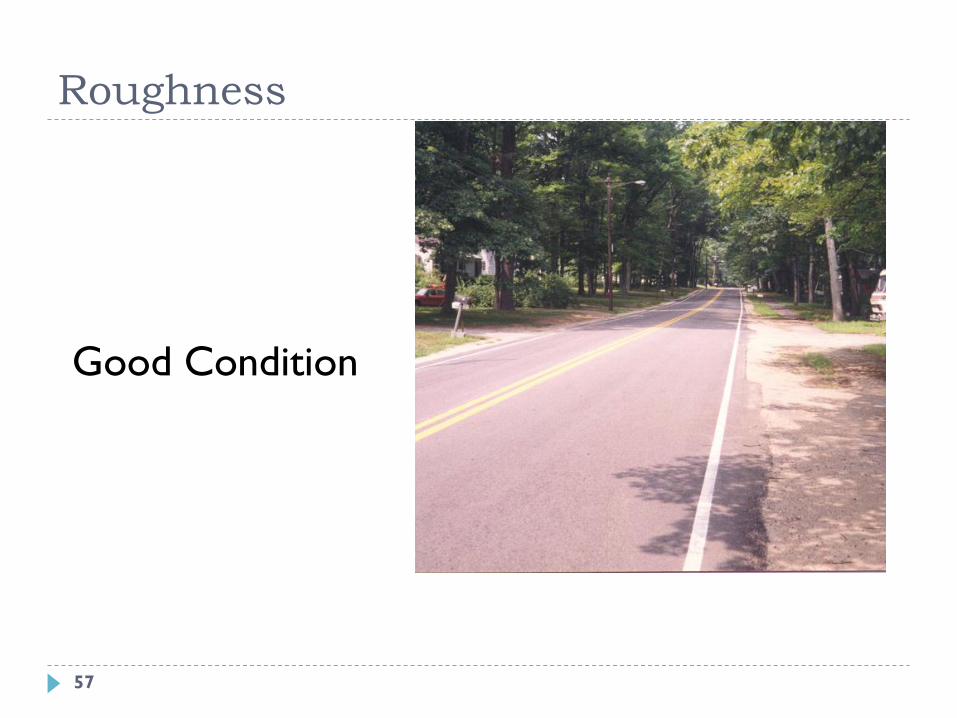
Good Condition
Roughness
57
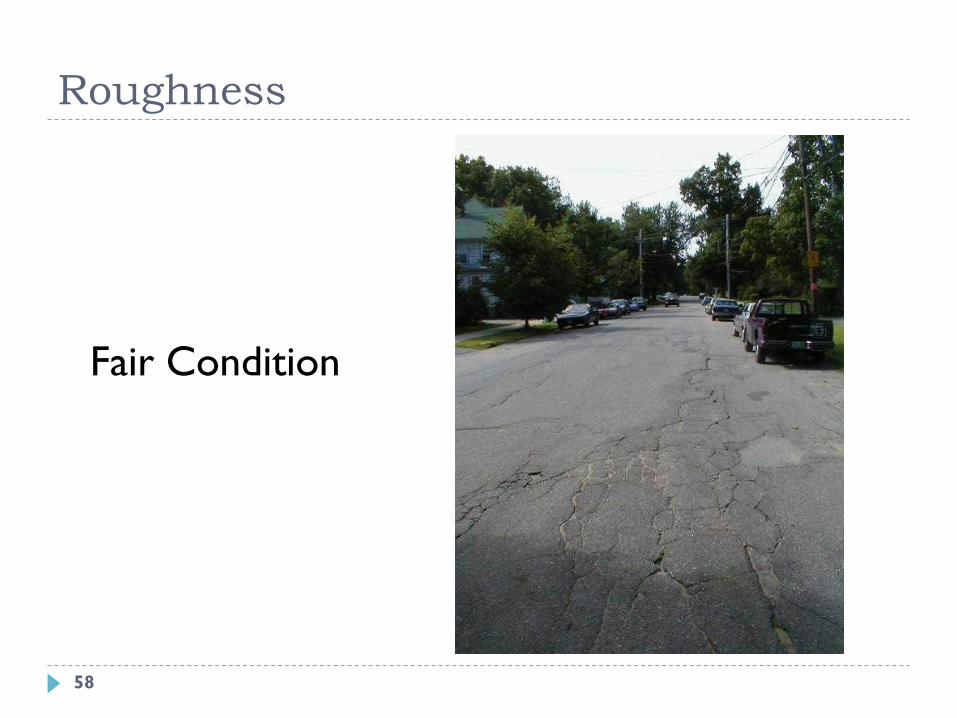
Fair Condition
Roughness
58
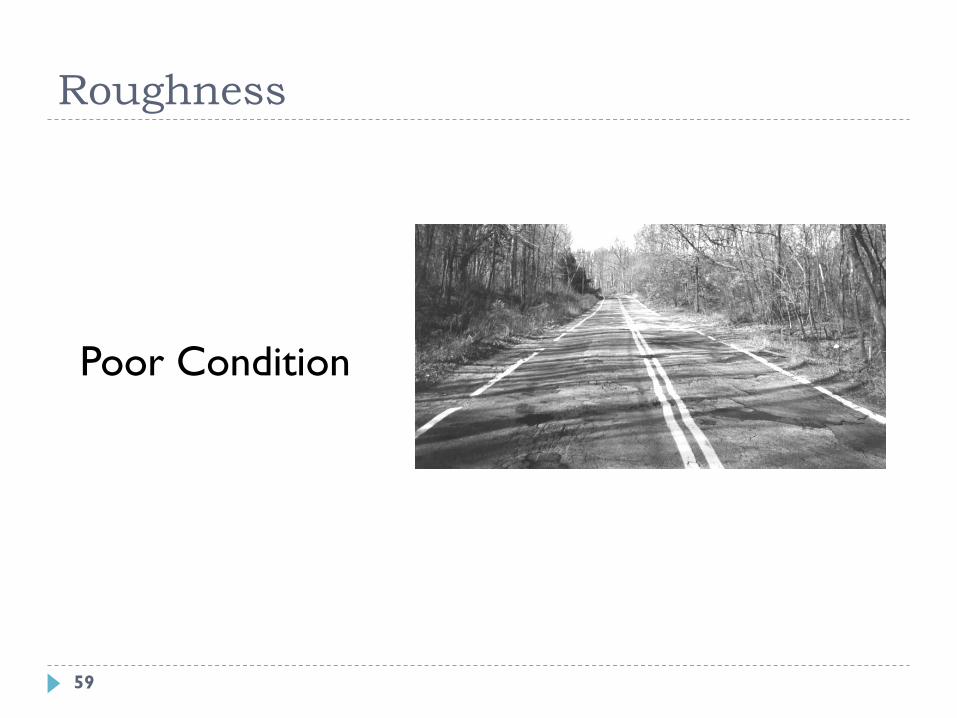
Poor Condition
Roughness
59
Rutting
Longitudinal depressions in one or both wheel paths
Causes
Loads
Improper compaction of mix
Poor subgrade structure
Can be easier to see when the road is wet (puddles)
12/6/2011 UNH T2 Center 60
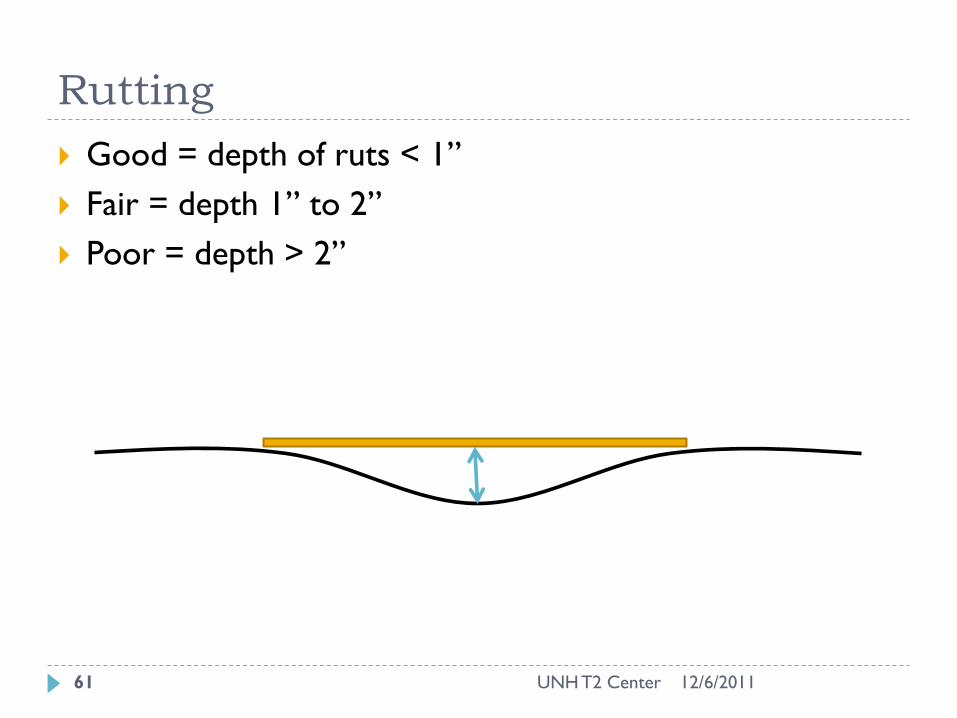
Rutting
Good = depth of ruts < 1”
Fair = depth 1” to 2”
Poor = depth > 2”
12/6/2011 UNH T2 Center 61
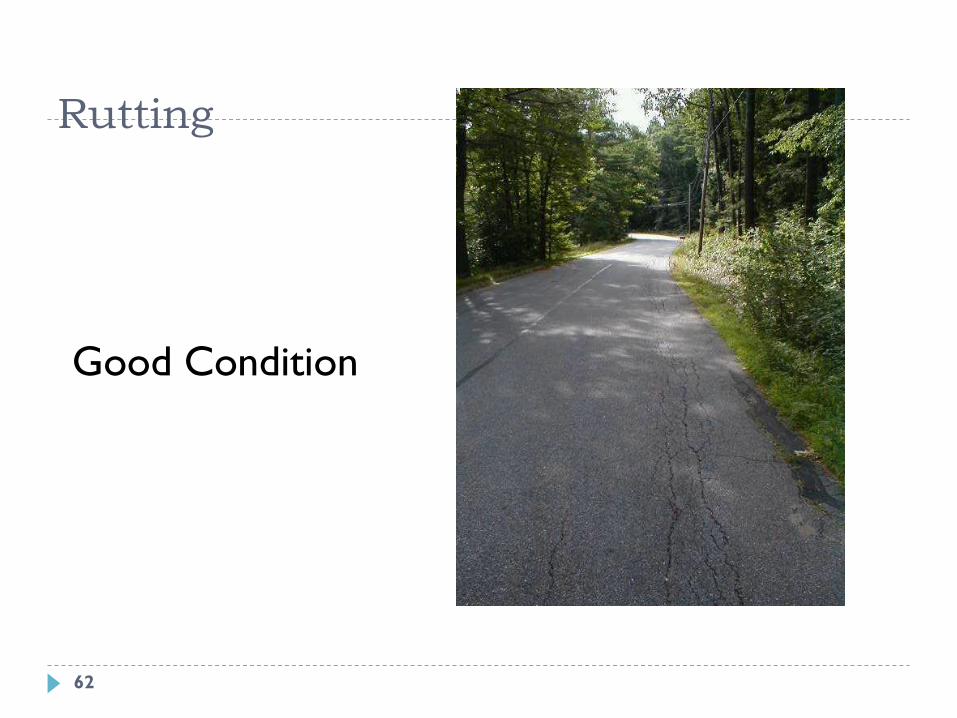
Rutting
Good Condition
62

Rutting
Fair Condition
63

Rutting
Poor Condition
64

Distress Rating Summary
12/6/2011 UNH T2 Center
Severity - Low - Med - High
Alligator Cracks 1/16” – 1/8” – 1/8”+
Long / Transverse Cracks <1/8” - <1/4” – 1/4”+
Edge Cracks
<1/8” less than 12” from edge
<1/4” less than 24” from edge
1/4”+ more than 24” from edge, breakup of surface
Extent - Low - Med - High
All Cracks but Transverse
<10% - 10-30% - 30%+
Transverse Cracks
50ft - 25-50ft - <25ft spacing
Patching
<10% - 10-30% - 30%+
Potholes
<5 – 5-10 – 10+ per 100ft
Roughness
best guess / use photos
65

66
Unpaved Roads
Surface Distresses
Primary Distresses
Cross Section
Roadside
Drainage
Dust
Traffic Induced
Distresses
Corrugations
Potholes
Rutting
Loose Aggregate
12/6/2011 UNH T2 Center 66

67
Cross Section
Does water drain off of road surface?
Condition Good - good crown, water flows off roadway
Fair - minimal crown and/or moderate amounts of ponding on roadway
Poor - water flows on roadway and/or large amounts of ponding
12/6/2011 UNH T2 Center 67
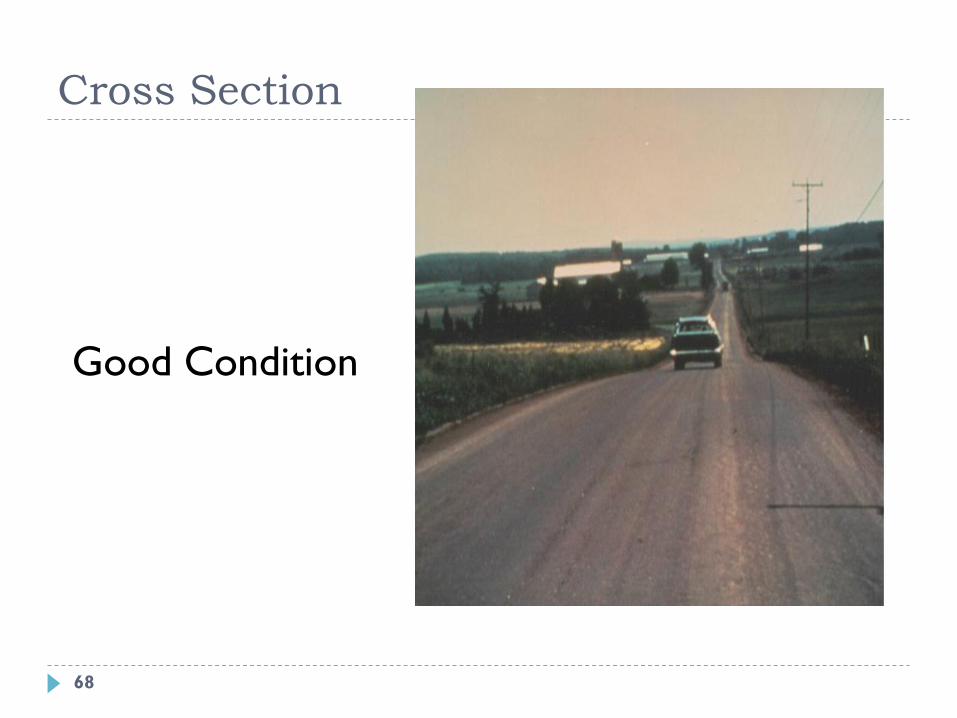
Cross Section
Good Condition
68
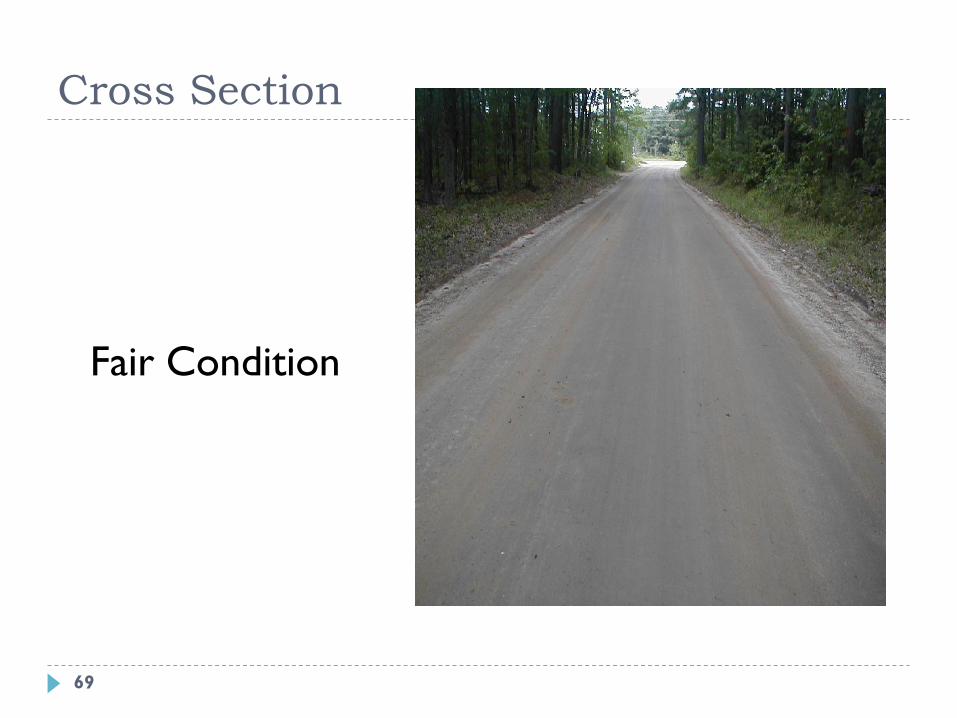
Fair Condition
Cross Section
69
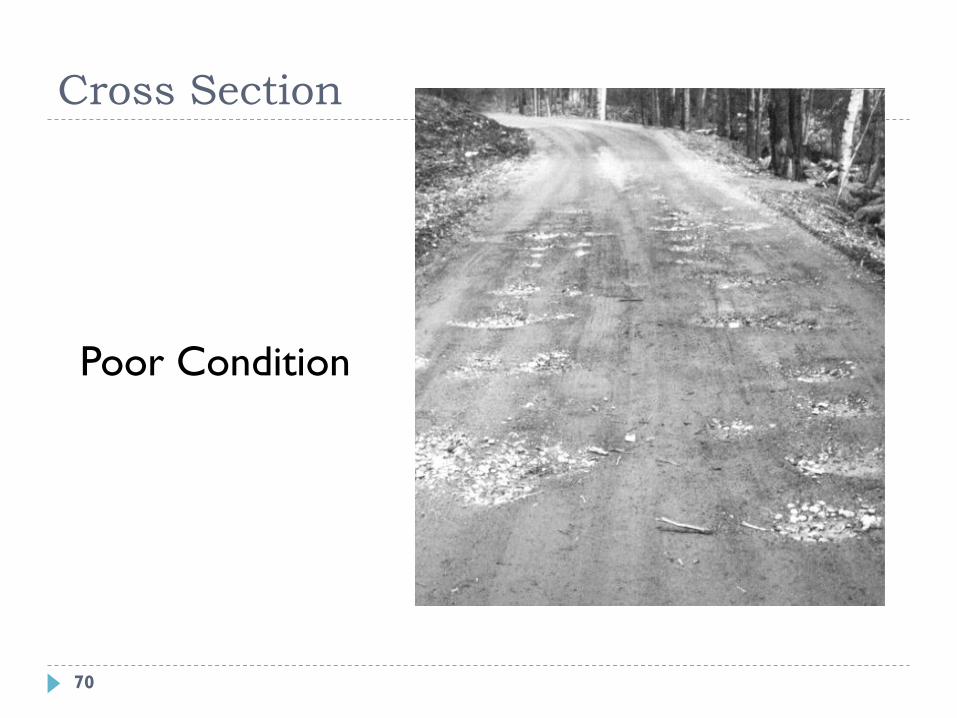
Poor Condition
Cross Section
70

71
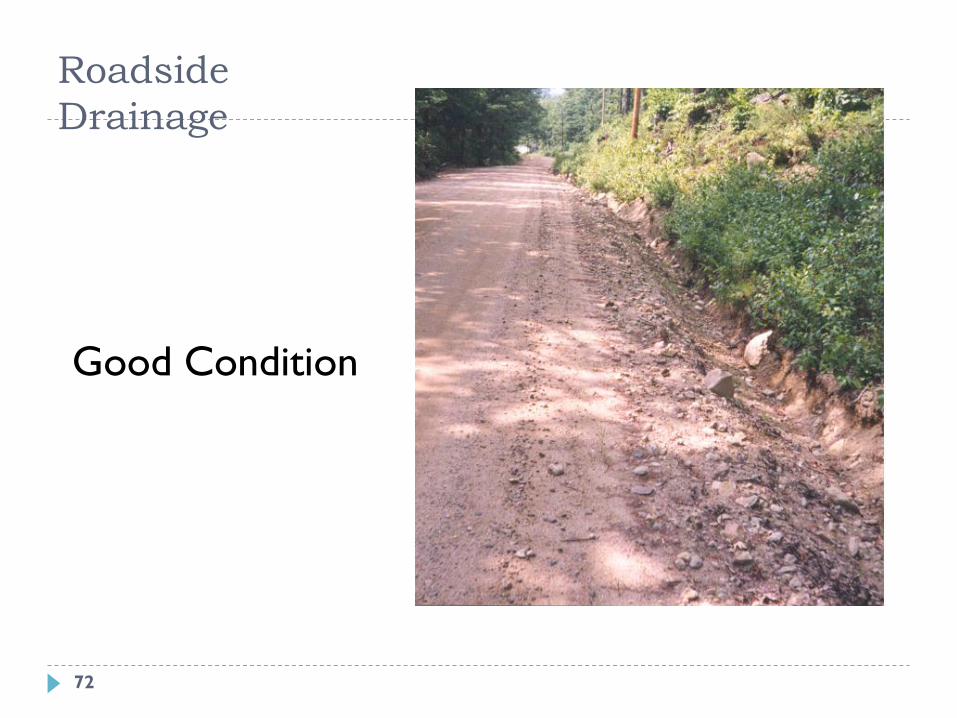
Roadside Drainage
Does water drain away from roadway?
Condition
Good - water flows in ditches & culverts
Fair - moderate amounts of water remains along roadside
Poor - large amounts of water remains along roadside
12/6/2011 UNH T2 Center 71
Roadside
Drainage
Good Condition
72
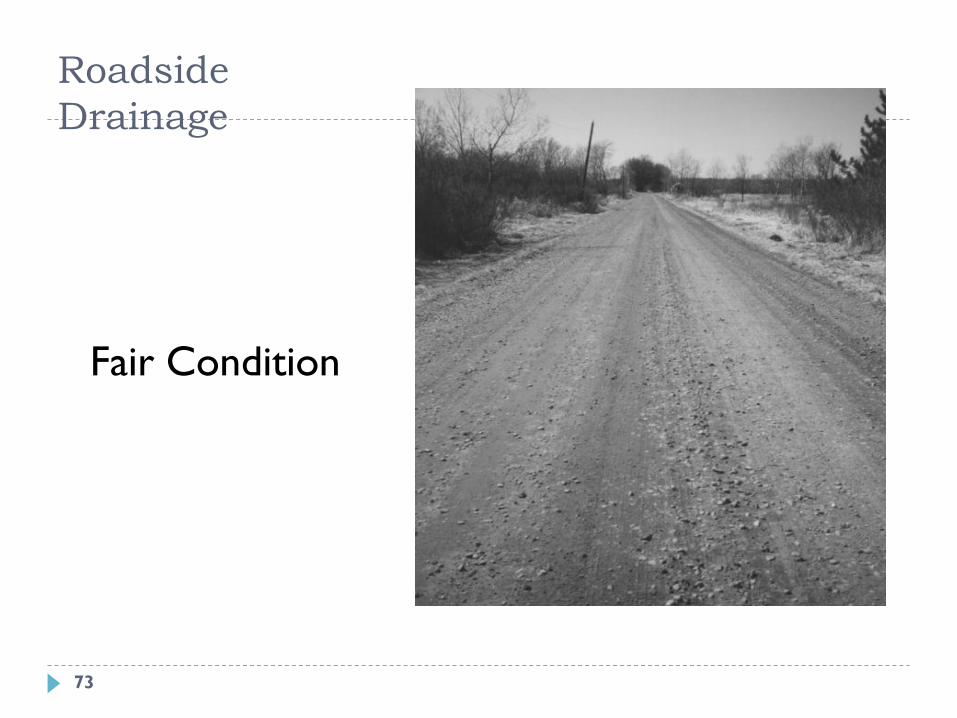
Fair Condition
Roadside
Drainage
73
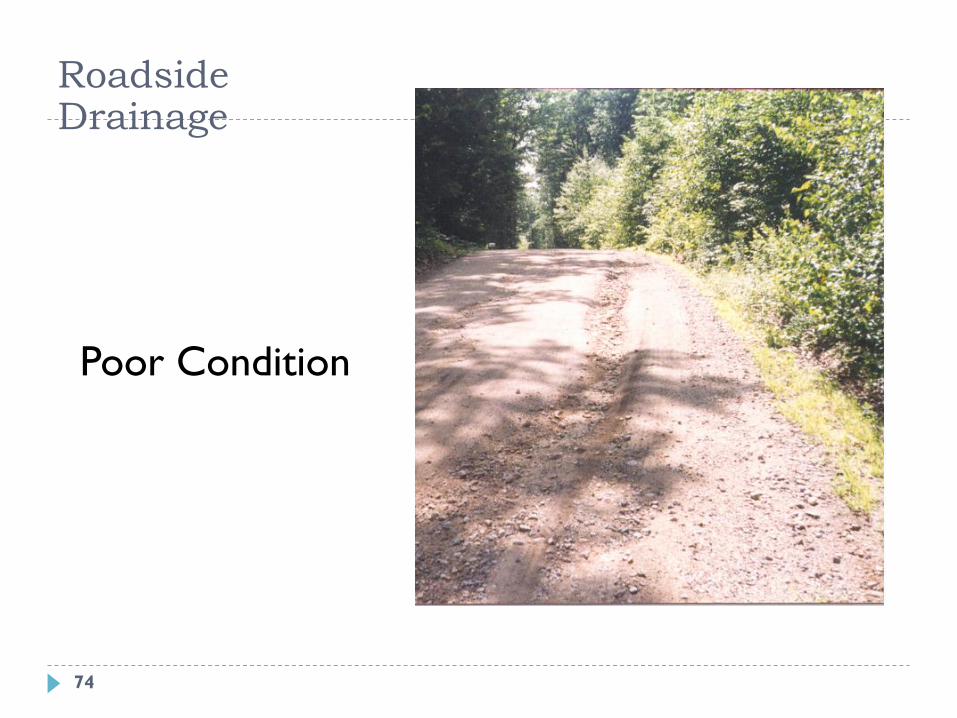
Poor Condition
Roadside Drainage
74
75
Corrugations
Washboard surface, ridges and valleys perpendicular to
direction of travel
Causes
Traffic
Moisture
Loose Aggregate
12/6/2011 UNH T2 Center 75
76
Corrugations
Severity
Low - < 1” deep
Medium - 1” to 3” deep
High - > 3” deep
12/6/2011 UNH T2 Center 76

Corrugations
Low Severity
77
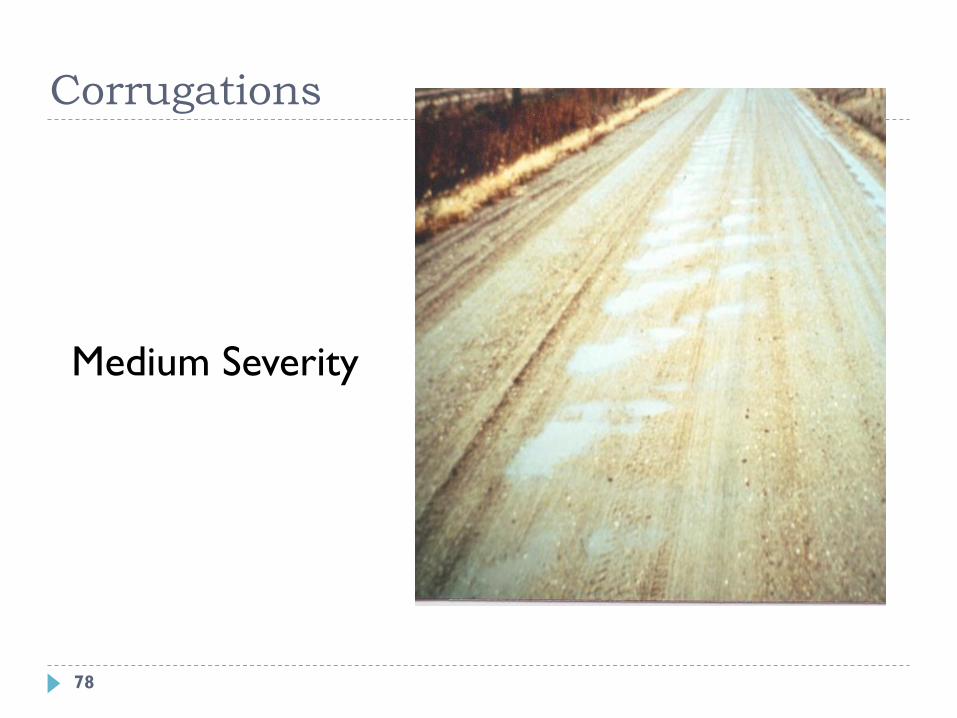
Corrugations
Medium Severity
78
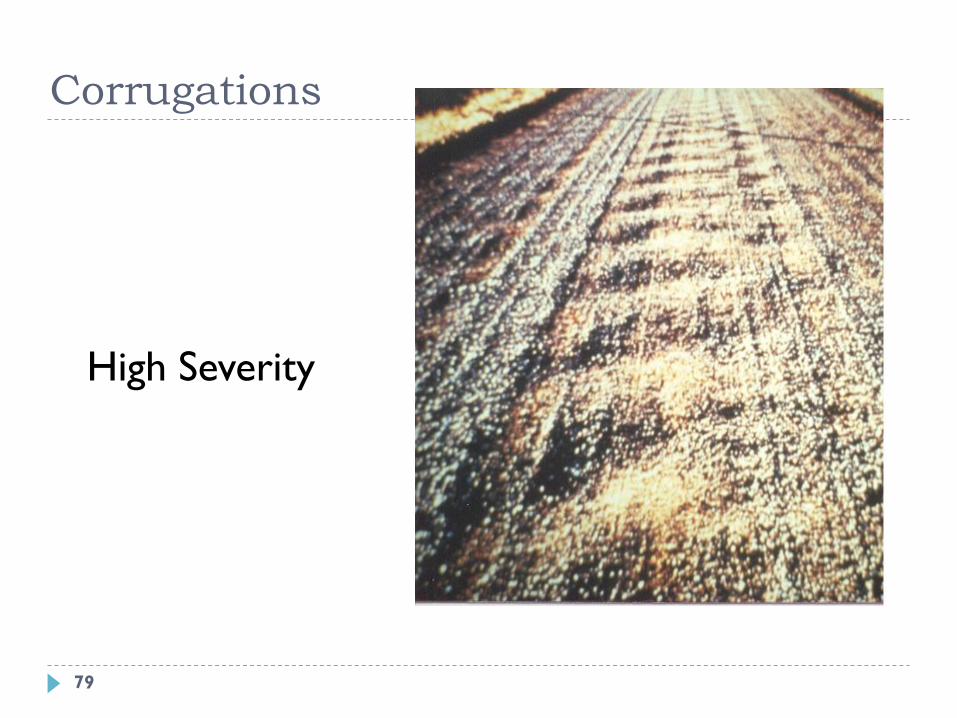
Corrugations
High Severity
79

80
Corrugations
Extent
Low - < 10%
Medium - 10% to 30%
High - > 30%
12/6/2011 UNH T2 Center 80
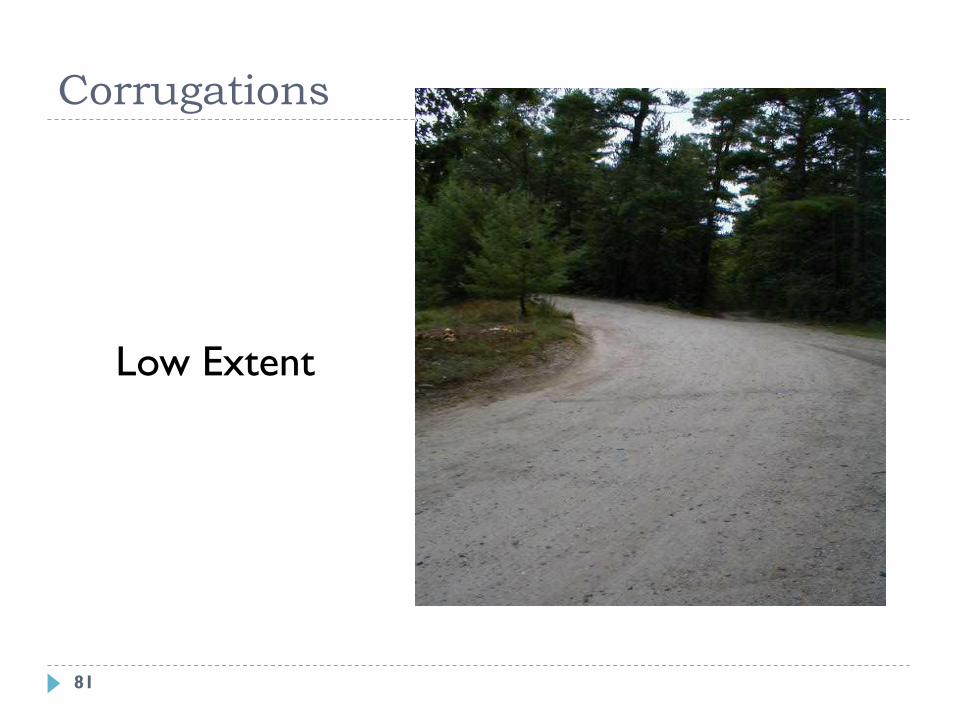
Corrugations
Low Extent
81
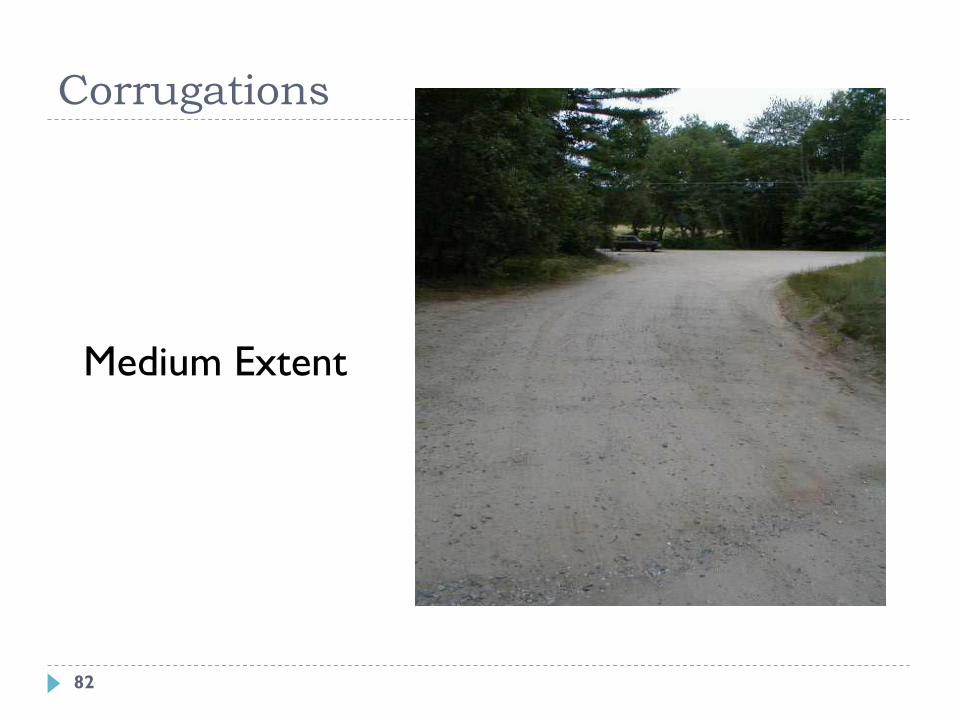
Corrugations
Medium Extent
82
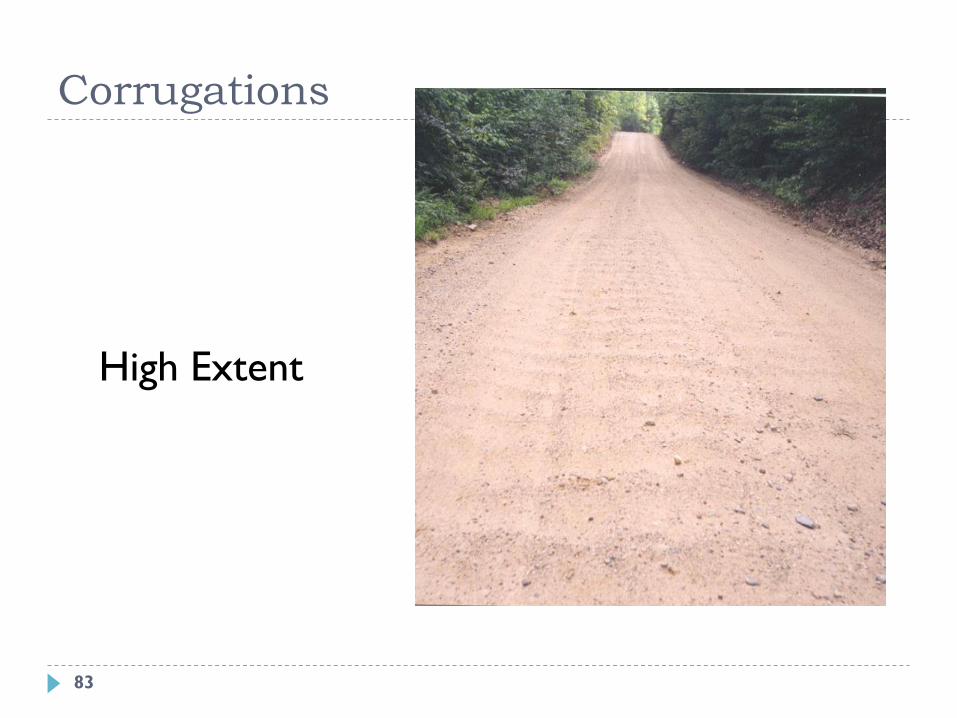
Corrugations
High Extent
83
84
Potholes
Bowl shaped depressions in road surface
Causes
Loads
Moisture
Loose Aggregates
12/6/2011 UNH T2 Center 84
85
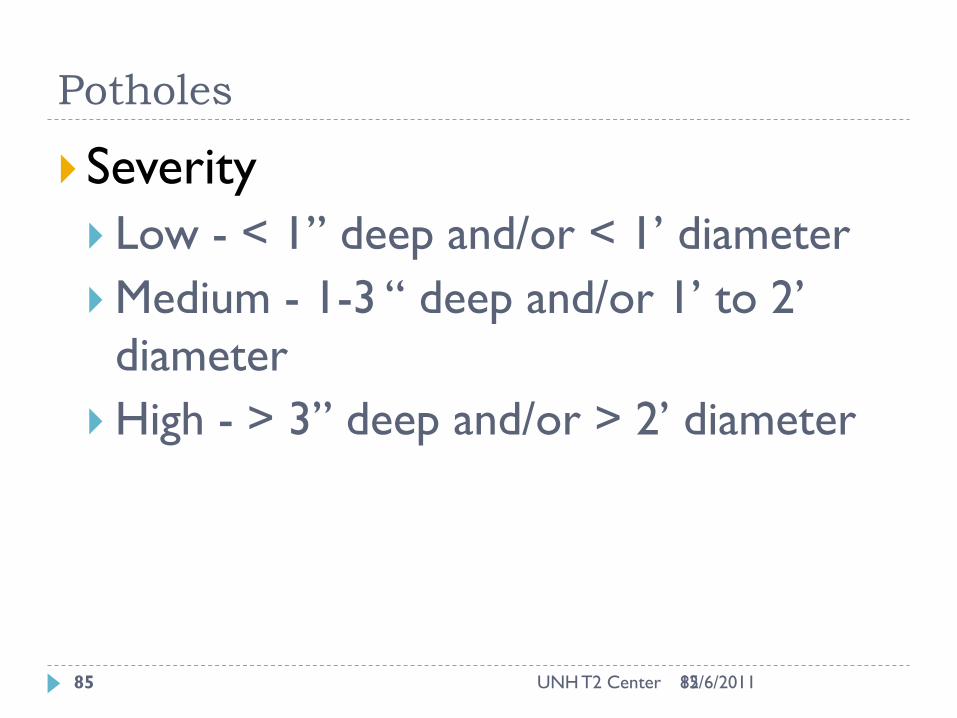
Potholes
Severity
Low - < 1” deep and/or < 1’ diameter
Medium - 1-3 “ deep and/or 1’ to 2’
diameter
High - > 3” deep and/or > 2’ diameter
12/6/2011 UNH T2 Center 85
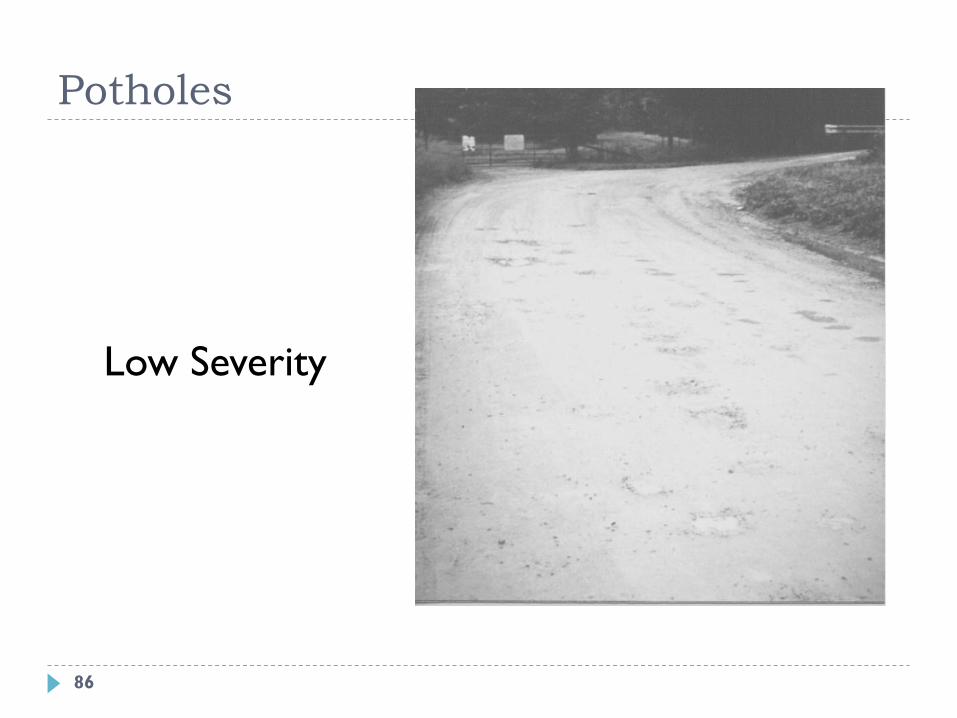
Potholes
Low Severity
86
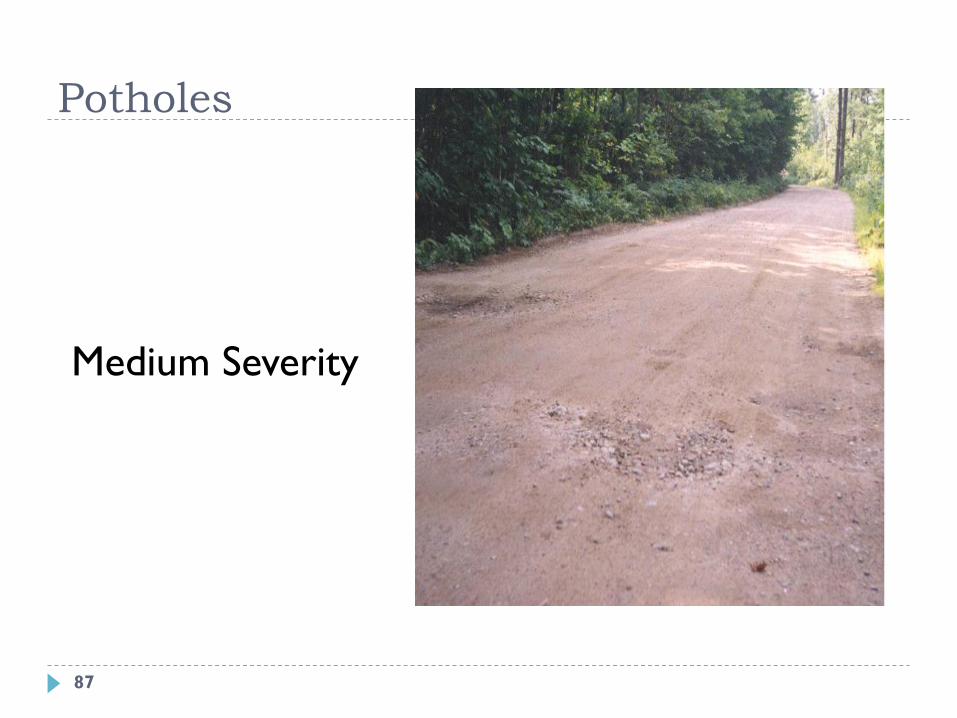
Potholes
Medium Severity
87

Potholes
High Severity
88
89
Potholes
Extent
Low - <10% and/or <5 per 100’ section
Medium - 10-30% and/or 5-10 per 100’
section
High - >30% and/or >10 per 100’
section
12/6/2011 UNH T2 Center 89

Potholes
Low Extent
90

Potholes
Medium Extent
91
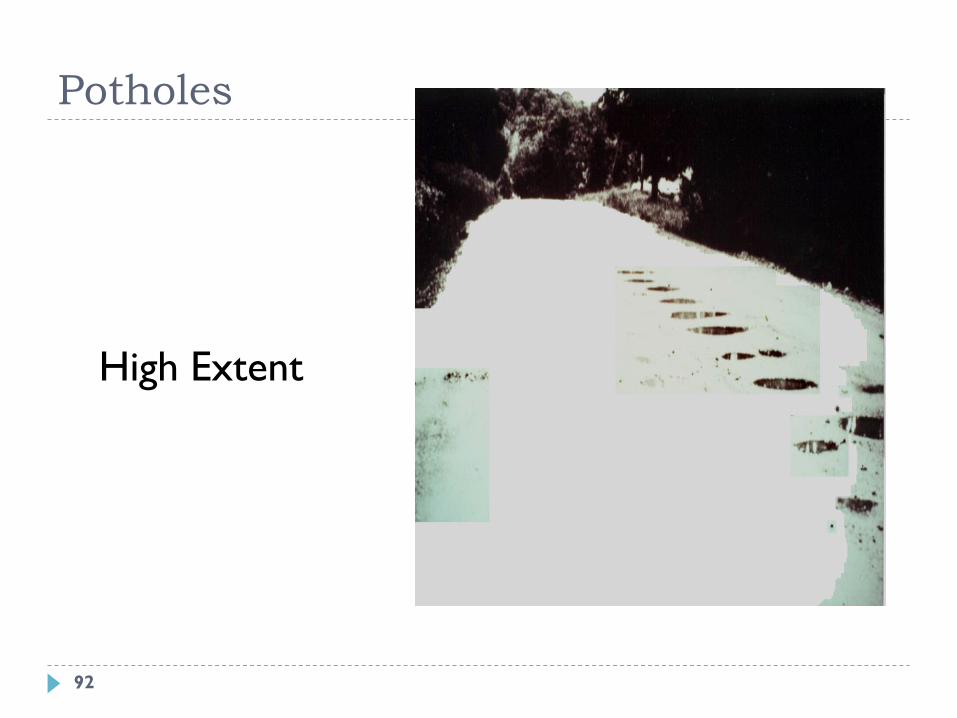
Potholes
High Extent
92
93
Rutting
Channels in wheel paths
Water flows along road rather than off it.
Causes
Traffic
Moisture
12/6/2011 UNH T2 Center 93

94
Rutting Depth Check
12/6/2011 UNH T2 Center 94
95
Rutting
Severity
Low - < 1” deep
Medium - 1” to 3”
High - > 3”
12/6/2011 UNH T2 Center 95
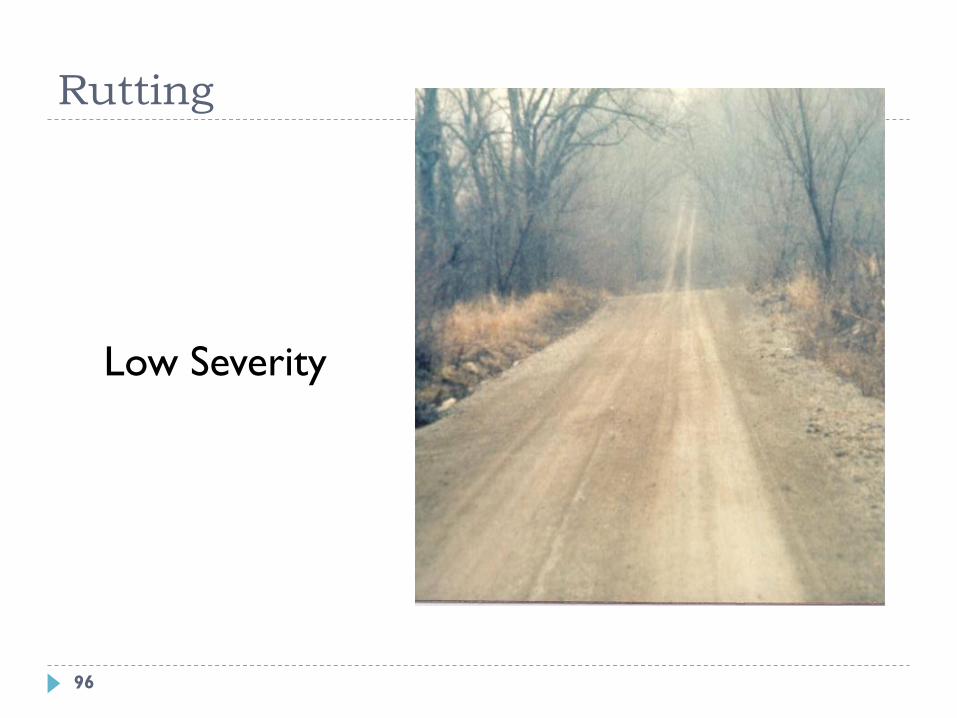
Rutting
Low Severity
96
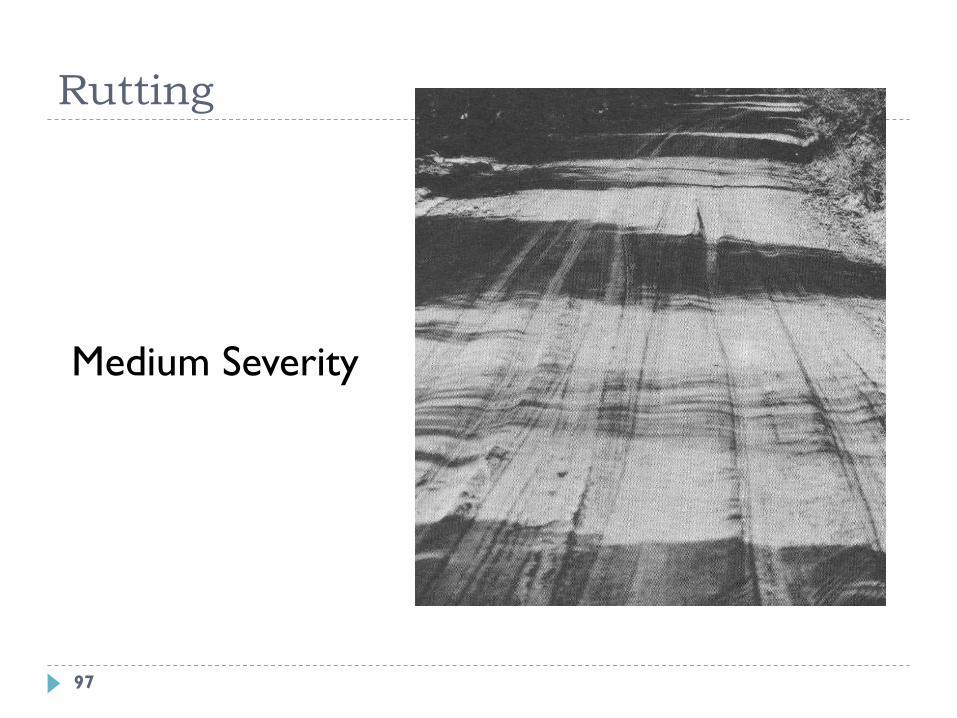
Rutting
Medium Severity
97
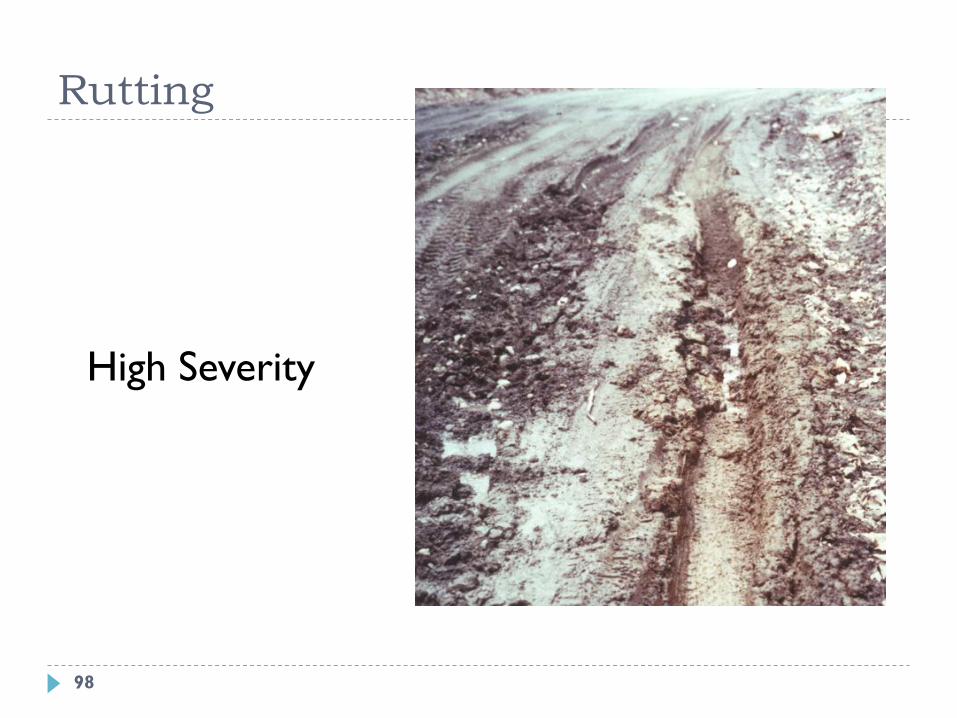
Rutting
High Severity
98
99
Rutting
Extent
Low - <10%
Medium - 10% to 30%
High - > 30%
12/6/2011 UNH T2 Center 99
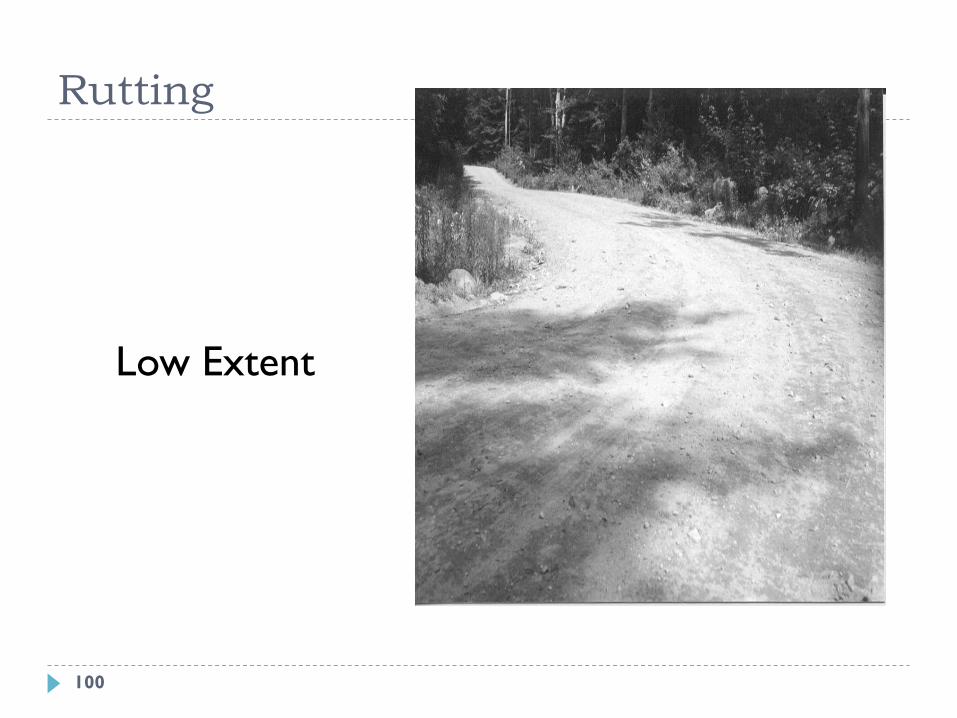
Rutting
Low Extent
100

Rutting
Medium Extent
101
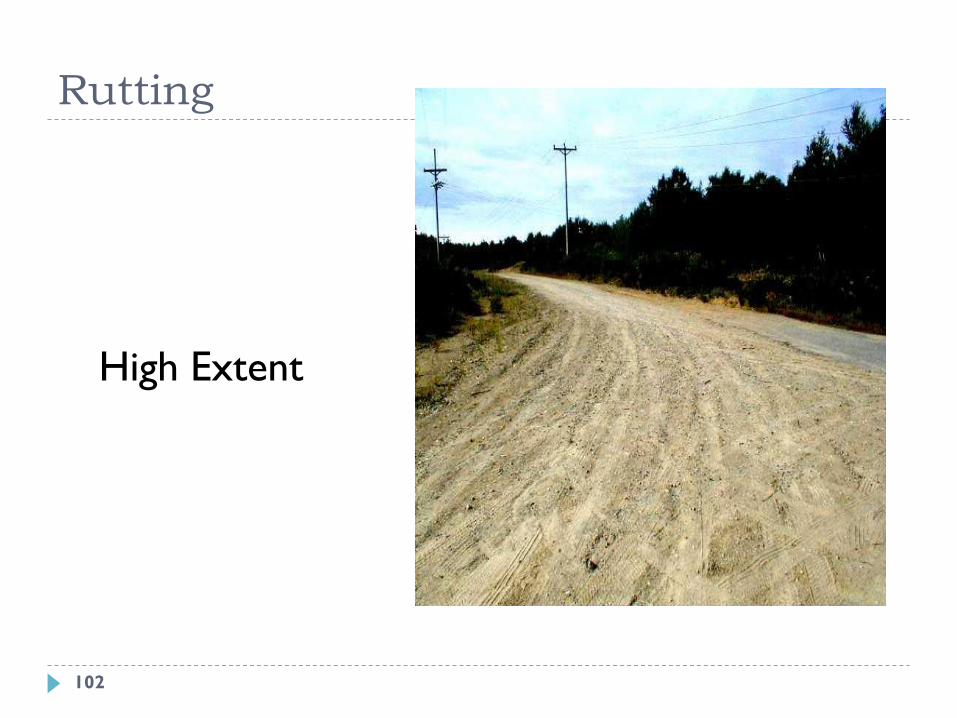
Rutting
High Extent
102
103
Loose Aggregate
Loose material, along shoulder or centerline
Causes
Improper Gradation
Traffic
12/6/2011 UNH T2 Center 103
104
Loose Aggregate
Severity
Low - < 2” deep
Medium - 2-4”
High - > 4”
12/6/2011 UNH T2 Center 104
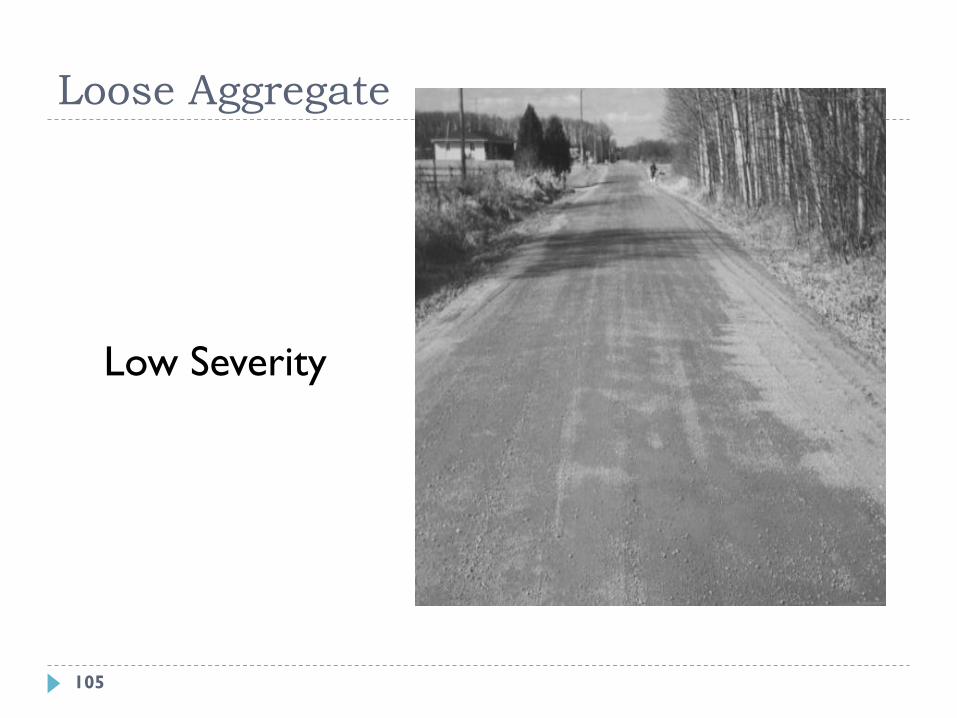
Loose Aggregate
Low Severity
105
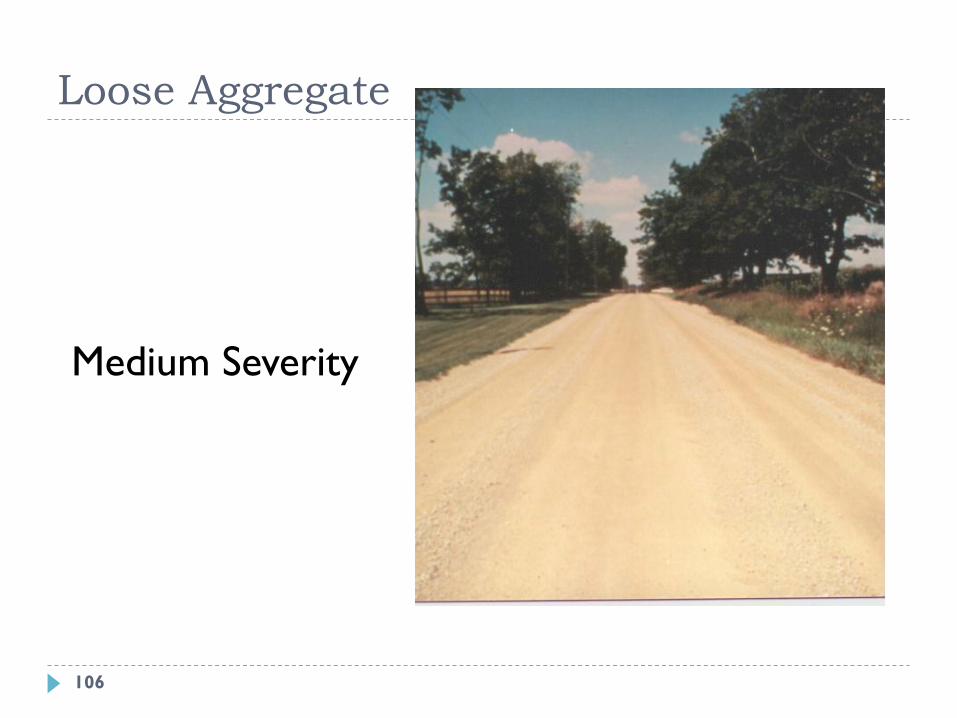
Loose Aggregate
Medium Severity
106
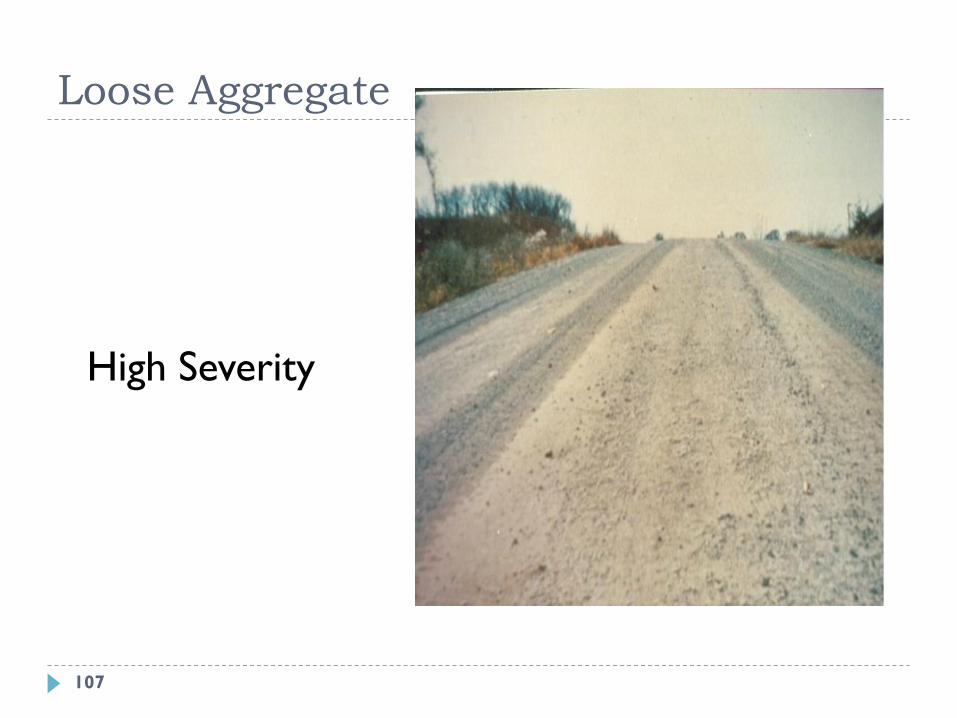
Loose Aggregate
High Severity
107
108
Loose Aggregate
Extent
Low - < 10%
Medium - 10% to 30%
High - > 30%
12/6/2011 UNH T2 Center 108
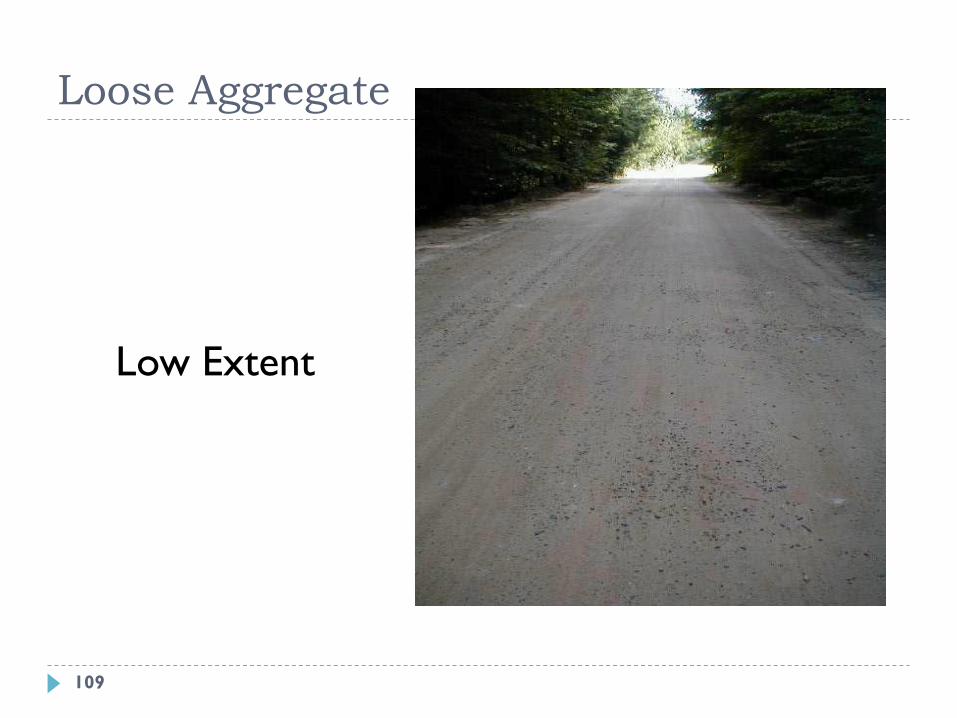
Loose Aggregate
Low Extent
109

Loose Aggregate
Medium Extent
110
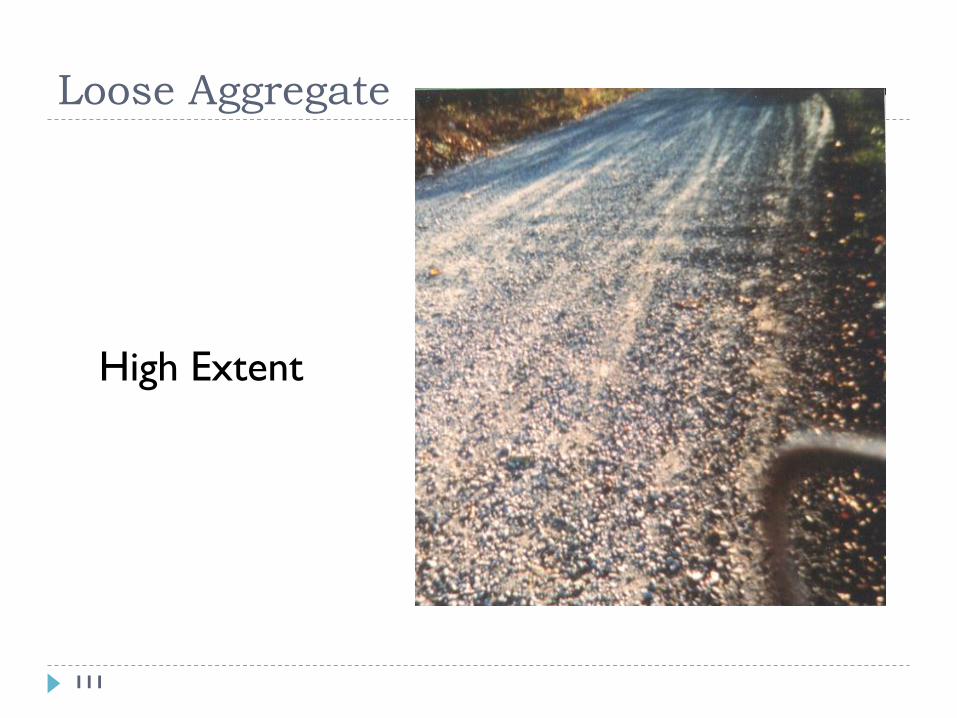
Loose Aggregate
High Extent
111
112
Dust
Loss of fine materials from road surface
Larger particles become unstable
Causes
Improper gradation
Traffic
12/6/2011 UNH T2 Center 112
113
Dust
Light - normal traffic produces thin dust
Medium - normal traffic produces moderately thick cloud
Heavy - normal traffic produces thick cloud
12/6/2011 UNH T2 Center 113

Dust
Light Condition
114
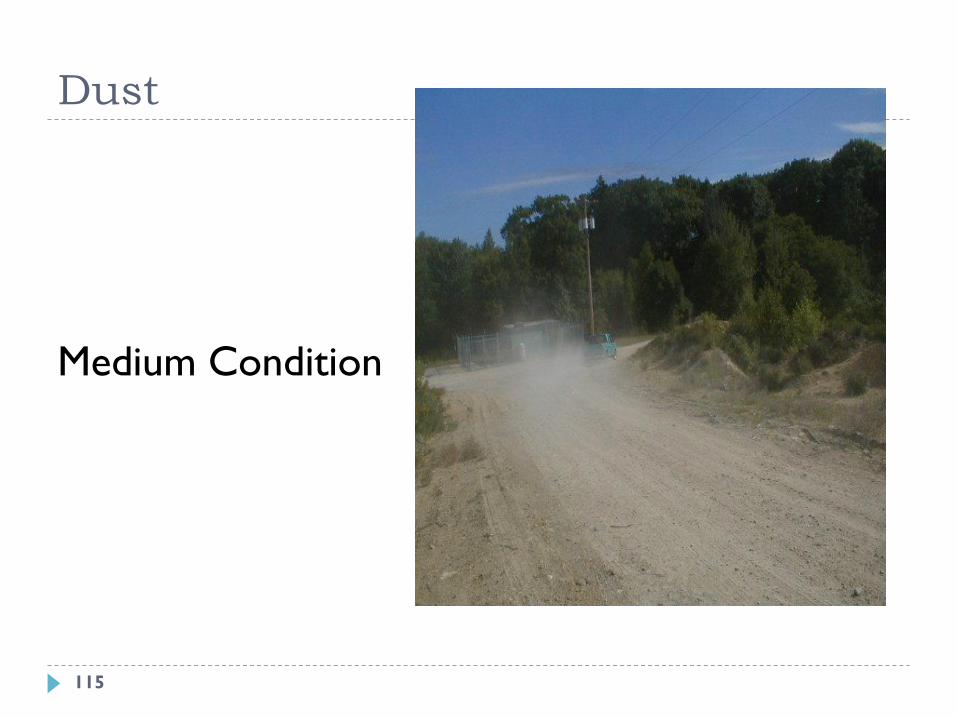
Dust
Medium Condition
115
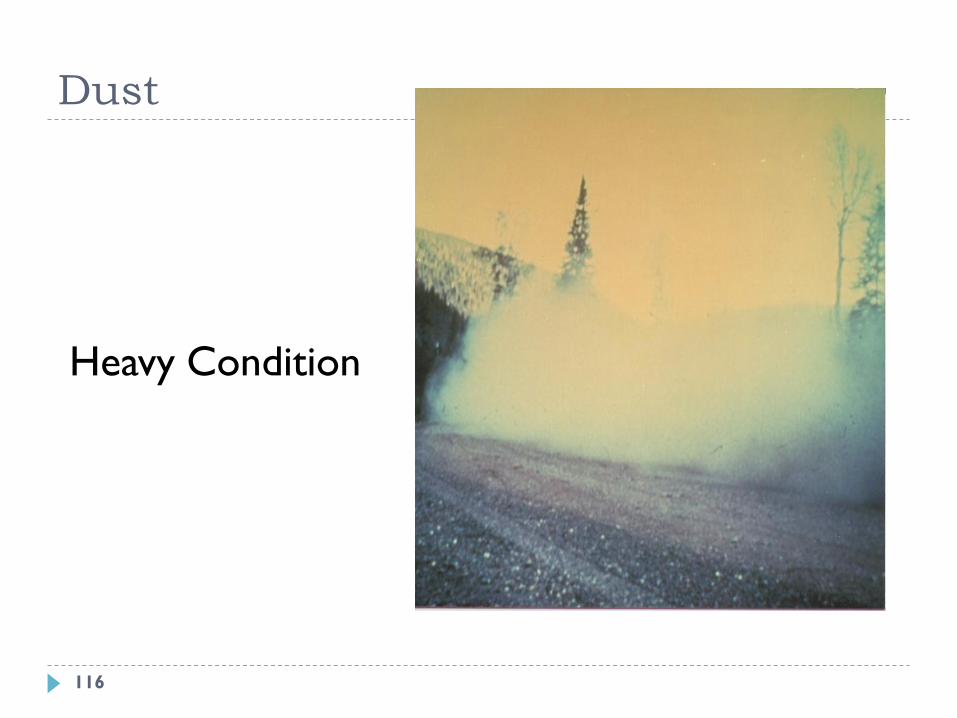
Dust
Heavy Condition
116
12/6/2011 UNH T2 Center
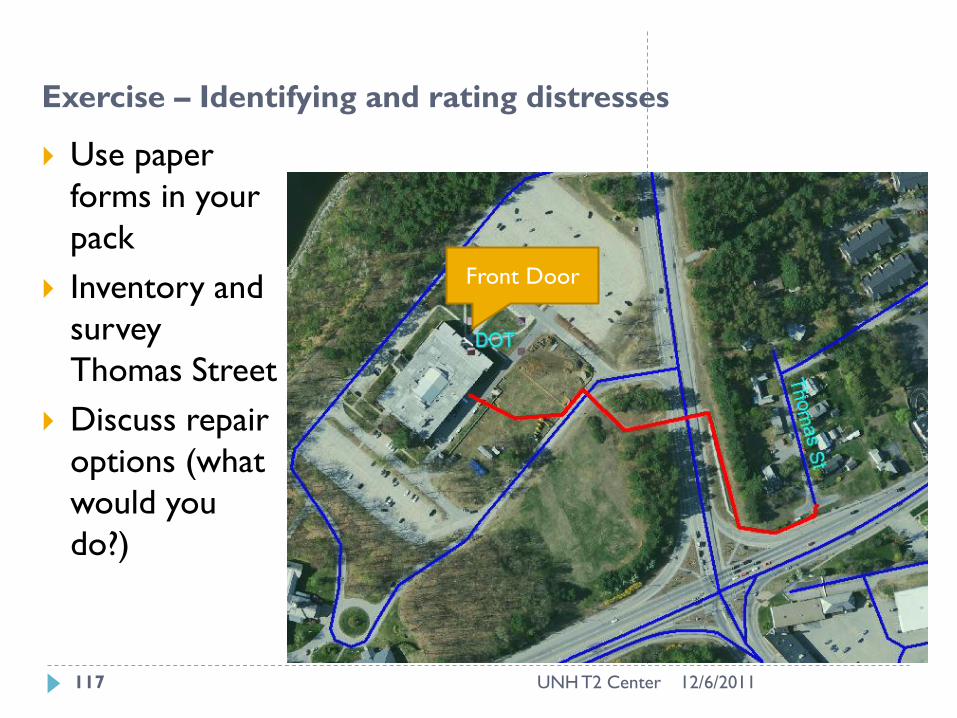
Use paper
forms in your
pack
Inventory and
survey
Thomas Street
Discuss repair
options (what
would you
do?)
Exercise – Identifying and rating distresses
Front Door
117

Distresses - Summary
Distresses: factors that affect the road surface
Practice identifying and rating them
Consistent ratings make for accurate repairs
Questions?
12/6/2011 UNH T2 Center 118
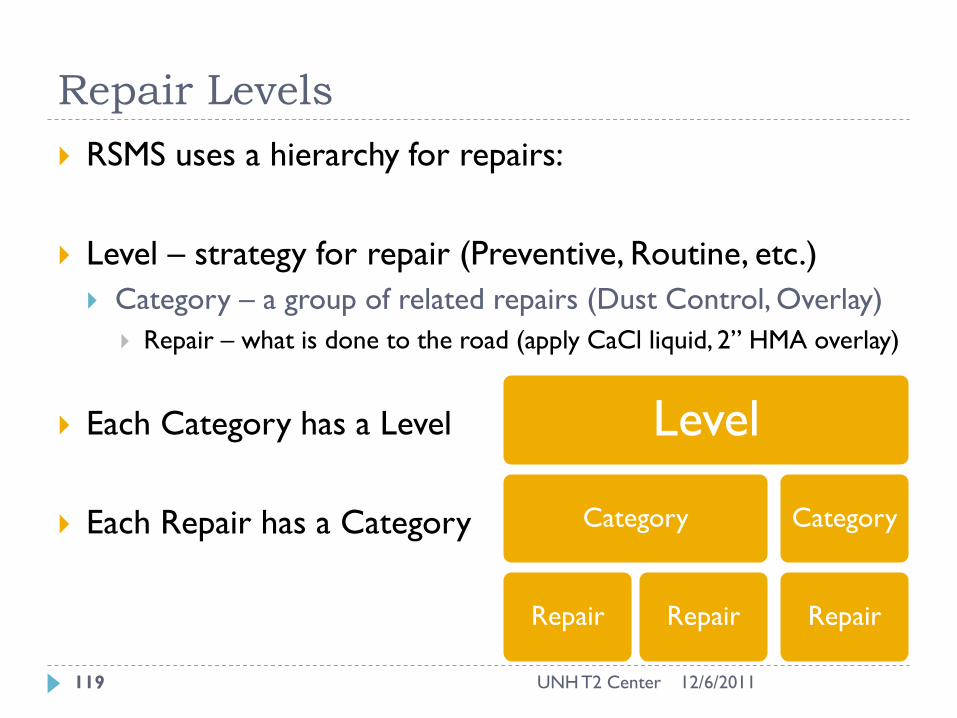
Repair Levels
RSMS uses a hierarchy for repairs:
Level – strategy for repair (Preventive, Routine, etc.)
Category – a group of related repairs (Dust Control, Overlay)
Repair – what is done to the road (apply CaCl liquid, 2” HMA overlay)
Each Category has a Level
Each Repair has a Category
Level
Category
Repair Repair
Category
Repair
12/6/2011 UNH T2 Center 119
Repair Levels
The Top grouping
Deferred maintenance
Routine maintenance (highest value)
Preventive maintenance
Rehabilitation
Rebuild (lowest value)
The values follow the ‘Best First’ strategy
RSMS determines this from the survey data
12/6/2011 UNH T2 Center 120
Deferred Maintenance
No action other than needed for dangerous or
emergency situation
No intent to extend useful life of road
Even without significant traffic, road will deteriorate
12/6/2011 UNH T2 Center 121
Routine Maintenance
Cleaning ditches and culverts
Asphalt Roads: Sealing cracks or patching potholes or
repairs to small areas
Unpaved Roads: Spot regraveling and grading
Usually performed by municipal crews
12/6/2011 UNH T2 Center 122
Preventive Maintenance
Repairs to prevent increased deterioration
Asphalt Roads: surface coats - chip seals or thin overlays
Unpaved Roads: Shaping and grading, add minor amounts
of gravel
Usually performed by municipal crews
12/6/2011 UNH T2 Center 123
Rehabilitation
Major repairs to the road surface
Asphalt Roads: Usually an overlay after surface
preparation
Unpaved Roads: Adding major amounts of gravel,
reshaping and compacting
Usually performed by contractors
12/6/2011 UNH T2 Center 124
Rebuild
Major repairs to structure and geometry
Excavate and replace subbase
New paved or gravel wearing surface
Major drainage repairs and construction
Performed by contractors
Funded by bonds or CRF
12/6/2011 UNH T2 Center 125

Exercise: group unpaved repairs into the appropriate Level:
Defer, Routine, Preventive, Rehabilitate, Rebuild
Regrade, add major gravel
Spot regravel
Grade Surface 2x / year
Reshape – blade
No Maintenance
Spot Regravel, add CaCl
Apply CaCl liquid
Rebuild
Routine
Routine (Defer)
Rehabilitate
Defer
Routine
Preventive / Routine
Repair Levels
12/6/2011 UNH T2 Center 126
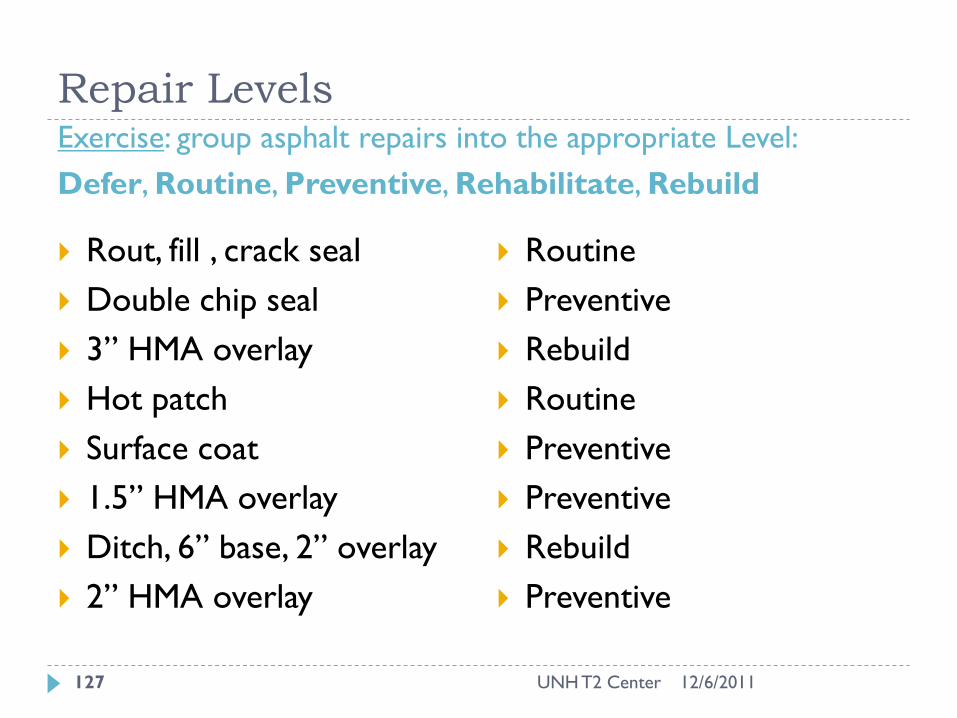
Repair Levels Exercise: group asphalt repairs into the appropriate Level:
Defer, Routine, Preventive, Rehabilitate, Rebuild
Rout, fill , crack seal
Double chip seal
3” HMA overlay
Hot patch
Surface coat
1.5” HMA overlay
Ditch, 6” base, 2” overlay
2” HMA overlay
Routine
Preventive
Rebuild
Routine
Preventive
Preventive
Rebuild
Preventive
12/6/2011 UNH T2 Center 127
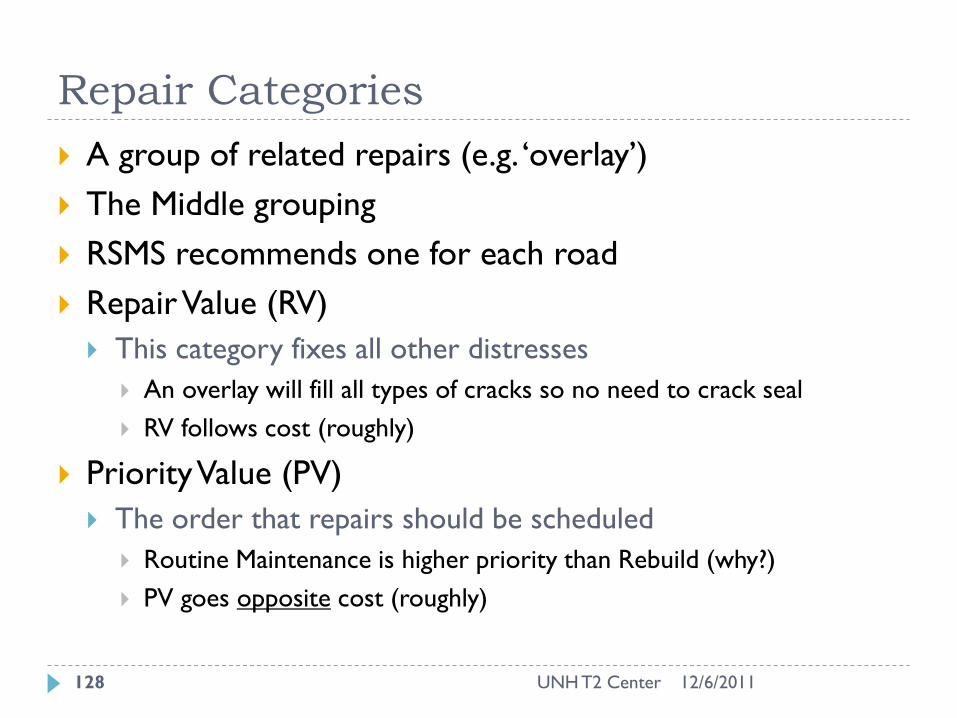
Repair Categories
A group of related repairs (e.g. ‘overlay’)
The Middle grouping
RSMS recommends one for each road
Repair Value (RV)
This category fixes all other distresses
An overlay will fill all types of cracks so no need to crack seal
RV follows cost (roughly)
Priority Value (PV)
The order that repairs should be scheduled
Routine Maintenance is higher priority than Rebuild (why?)
PV goes opposite cost (roughly)
12/6/2011 UNH T2 Center 128

Lifecycle of a Road
0 4 8 12 16
Very Good
Good
Fair
Poor
Very Poor
Years
40%
QUALITY
DROP
40%
QUALITY
DROP
75% TIME
12% TIME
EACH $1 OF
REPAIR
COST
HERE...
WILL COST
$4-8 IF
DELAYED
TO HERE
0 4 8 12 16
REPAIR
LEVEL
Defer
Routine
Preventive
Rehab
Rebuild
Years
12/6/2011 UNH T2 Center 129

Repair Categories
A group of related repairs (e.g. ‘overlay’)
The Middle grouping
RSMS recommends one for each road
Repair Value (RV)
This category fixes all other distresses
An overlay will fill all types of cracks so no need to crack seal
RV follows cost (roughly)
Priority Value (PV)
The order that repairs should be scheduled
Routine Maintenance is higher priority than Rebuild
PV goes opposite cost (roughly)
12/6/2011 UNH T2 Center 130
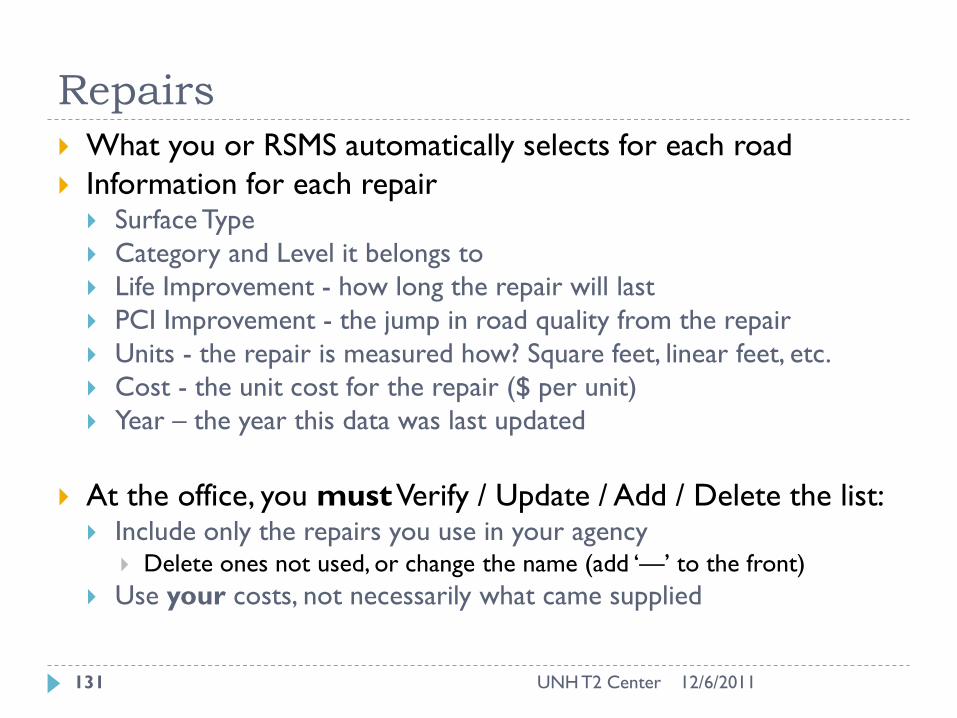
Repairs
What you or RSMS automatically selects for each road
Information for each repair Surface Type
Category and Level it belongs to
Life Improvement - how long the repair will last
PCI Improvement - the jump in road quality from the repair
Units - the repair is measured how? Square feet, linear feet, etc.
Cost - the unit cost for the repair ($ per unit)
Year – the year this data was last updated
At the office, you must Verify / Update / Add / Delete the list: Include only the repairs you use in your agency
Delete ones not used, or change the name (add ‘—’ to the front)
Use your costs, not necessarily what came supplied
12/6/2011 UNH T2 Center 131

Repairs
0 5 10 15 20 25 30
Very Good
Good
Fair
Poor
Very Poor
Years
PCI Improve-
ment (percentage)
PCI Improve-
ment
(percentage)
PCI Improvement
(percentage)
Repair Lifetime Repair
Lifetime
12/6/2011 UNH T2 Center 132

Review
12/6/2011 UNH T2 Center
1. A distress is ____________ of a _______________
with the road.
2. All repairs fall into in both a _______ and a _______.
3. Distresses can be rated how?
A) Severity B) Extent C) Both D) All
4. Which is the most expensive repair level?
5. Define ‘Best First’ and Worst First’.
133

Repairs - Summary
Repairs are grouped into a Level and Category
Review and edit your repair listing to what you use
Adjust costs and descriptions
Questions?
12/6/2011 UNH T2 Center 134

Decisionmaking
The RSMS Process:
1) Inventory – what roads do you maintain
2) Condition Survey – what shape are they in
• distresses, severity and extent, other factors
3) Repairs – what repairs do I use
4) Analysis – match the repair to the road
5) Management Plan – the repair schedule
and budget
Easy
Long
Easy
Very Easy
(RSMS)
Difficult
12/6/2011 UNH T2 Center
Decisions to be made by you!
135

Decisionmaking
Distress and Ratings Repair Category
12/6/2011 UNH T2 Center
Med / Low Longitudinal /
Transverse Cracks
Med / Med Alligator Cracks
Med / Med Edge Cracks
Med Patching / Potholes
Med Roughness
Low Rutting
Crack Seal
Overlay
Crack Seal
Patch
Satisfactory
Satisfactory
136
The RSMS Process
12/6/2011 UNH T2 Center
Lets take a look at each step in more detail
Inventory
Condition Rating
Analysis
Management Plan
137
Inventory
Generating Inventory
Use a map (SHP) file as the source
Available from GRANIT, MassGIS, MEGIS for free
www.granit.unh.edu
www.mass.gov/mgis
http://www.edc.uri.edu/RIGIS/
Concord data is already loaded on your PC
On your CDs will be data for your town
12/6/2011 UNH T2 Center 138
Inventory
12/6/2011 UNH T2 Center
You must know some information about your source SHP
Each column contains data you may want to use in RSMS
Most SHP files contain metadata, a description file (HTML) of
what the SHP file contains for data, source, when collected, by
whom, etc.
Contains descriptions of the fields and their values / content
SHP files contain a LOT of unusable fields ([DYNSEGID], counters)
Contains unmatchable fields ([SHLDTYPE], [SURFTYPE] are numbers)
These numbers may not be the numbers you need
RSMS pulls in the road list from a digital map file (SHP)
Add the SHP file to the map first
Then convert it to the RSMS table
139
Inventory – Field matching (NH)
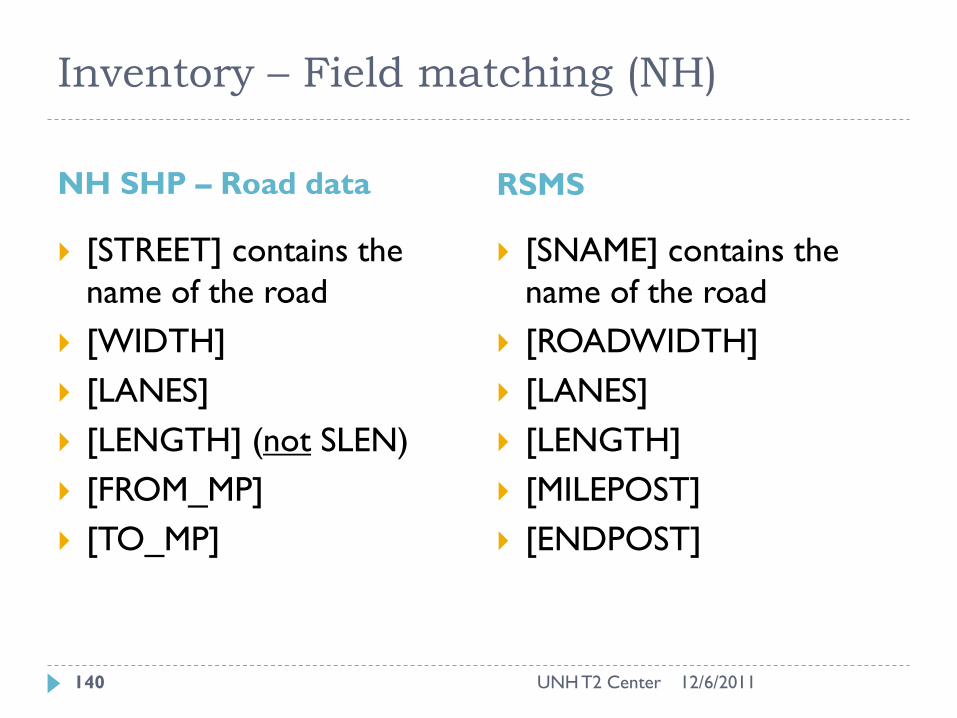
NH SHP – Road data RSMS
12/6/2011 UNH T2 Center
[STREET] contains the
name of the road
[WIDTH]
[LANES]
[LENGTH] (not SLEN)
[FROM_MP]
[TO_MP]
[SNAME] contains the
name of the road
[ROADWIDTH]
[LANES]
[LENGTH]
[MILEPOST]
[ENDPOST]
140
Inventory
12/6/2011 UNH T2 Center
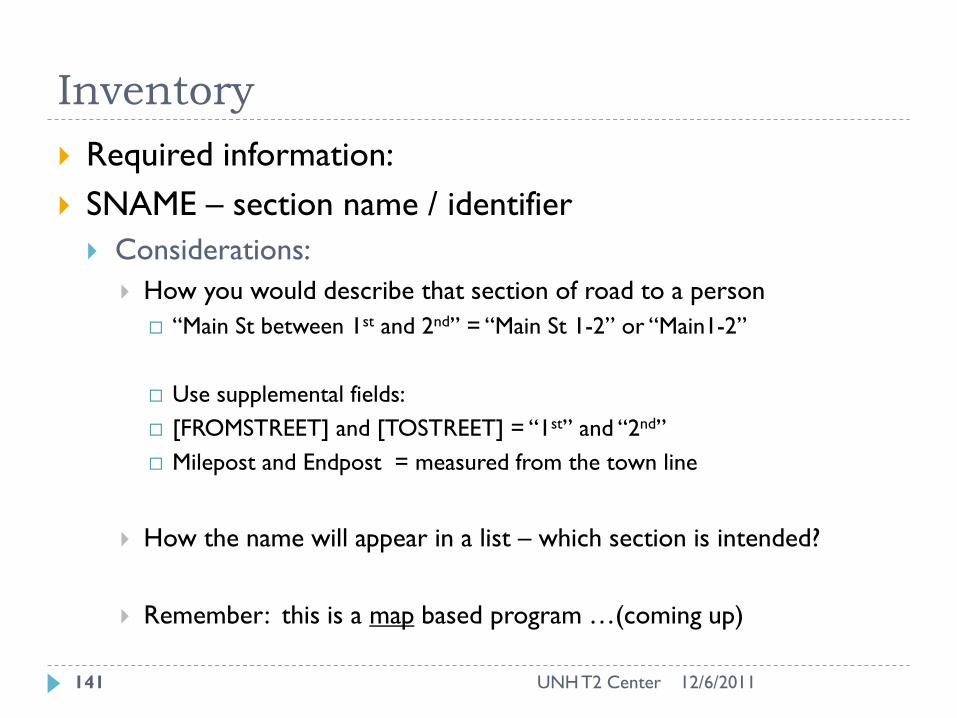
Required information:
SNAME – section name / identifier
Considerations:
How you would describe that section of road to a person
“Main St between 1st and 2nd” = “Main St 1-2” or “Main1-2”
Use supplemental fields:
[FROMSTREET] and [TOSTREET] = “1st” and “2nd”
Milepost and Endpost = measured from the town line
How the name will appear in a list – which section is intended?
Remember: this is a map based program …(coming up)
141
Inventory
Break – split one mapped section into two
Select the road
Select the break point
Break
Inventory data is saved for both sections
Merge – join two adjacent sections into one
Select the roads
Merge
Choose one road’s Inventory data to save to the new section
Width, surface type, notes, etc. are transferred
All survey data for BOTH sections is abandoned
12/6/2011 UNH T2 Center 142

Inventory
12/6/2011 UNH T2 Center
Required information:
WIDTH
LENGTH of the section
SURFACE TYPE (may be a number – lookup metadata)
TRAFFIC
IMPORTANCE
Additional, optional info:
Shoulder type and width, division, from/to street, class,
lanes, RIN, jurisdiction, inventory year
143

Inventory
12/6/2011 UNH T2 Center
TRAFFIC - relative scale
Scale used is up to you for your town
Use a reference road for ‘high’
Can translate ADT counts into a scale (tool coming)
IMPORTANCE – relative scale
School, emergency service, municipal service locations
How many people affected?
EMD can supply ratings as well
144
Inventory
12/6/2011 UNH T2 Center
Other items of interest
Add additional fields of use for your agency
Political district / ward
Urban Compact Zone
Watershed / Environmental/ Reduced Salt Usage
Sidewalks
Collect the data that you need to make your arguments
Coordinate with your management plan
145
Surveys
12/6/2011 UNH T2 Center
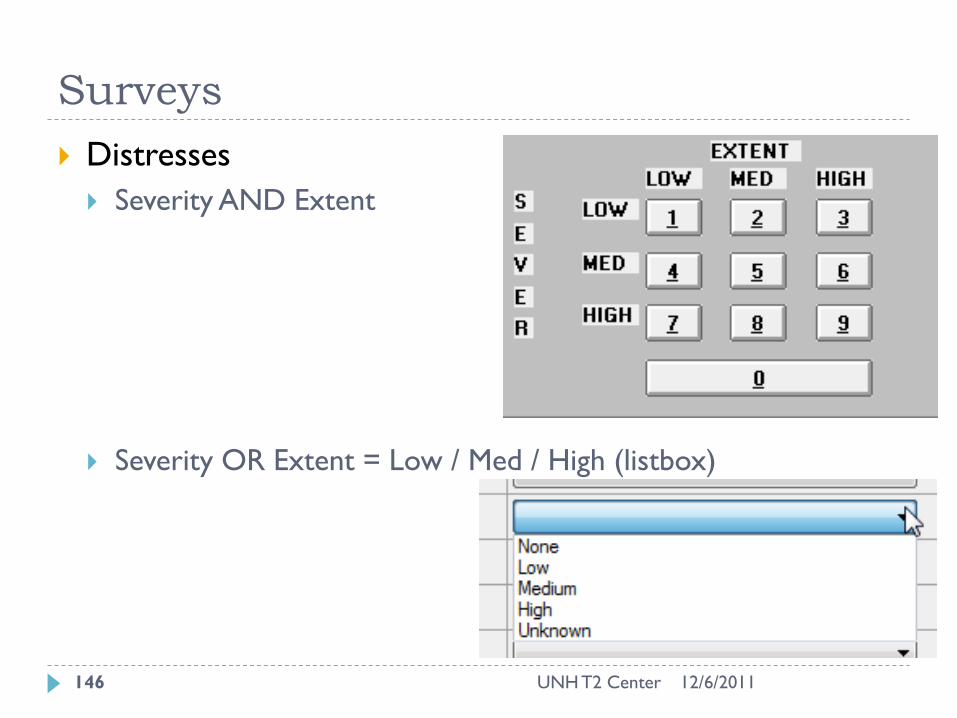
Distresses
Severity AND Extent
Severity OR Extent = Low / Med / High (listbox)
146
Surveys
12/6/2011 UNH T2 Center
Distresses – the key distress determines the CATEGORY
Surveys are where you collect the information that affects
the repair selection
You still have to select the best repair within the category
Some other factors in determining which repair:
Shim and overlay or just overlay?
Do I have a minimum curb reveal? Do I mill AND overlay?
While I am contracting this section, should I add in sidewalk
ramps to the work so I save costs?
147
Surveys - Flags
12/6/2011 UNH T2 Center
Flag – question with a Yes / No answer
Do I have ADA issues in this section?
Do I have poor drainage here?
If ‘Yes’ then:
Consider adding ramps and bumps to sidewalks
Fix drainage before fixing the road
Logic: ‘Yes’ values can apply a percentage change in the
selected repair
Poor Drainage = ‘Yes’ = fix drainage = costs increase 25%
148
Surveys – Factors
12/6/2011 UNH T2 Center
Factors – a rating scale or a numerical value
Drainage = Good / Fair / Poor
Roughness = Teethknocker / Rough / Smooth / Sheet of glass
Curb reveal = under 2” / 2”+
Patching = percentage needed
Appears as a listbox or an text entry box
Logic: Factors affect the decisionmaking process by:
switching repairs (‘overlay’ becomes ‘mill and overlay’ or
‘ shim and overlay’)
Calculating costs (if repair selection = patching, calculate the
percentage needed * length * width * cost)
149
Surveys – Info
12/6/2011 UNH T2 Center
Info –a text or listbox to record notes for a section
Notes pertaining to the condition of the section typed in
‘Need sidewalk ramps at Main and 1st’
Road rater recommendations for repair = “crack seal”
Notes that occur often and appear in a listbox
Sidewalk condition = ‘None / Good / Fair / Poor’
Does not enter into decisionmaking
150

Surveys – New Features
12/6/2011 UNH T2 Center
Flags, factors, info are user determined
You configure what you want to collect, what is looks like,
what and how it affects the repair choice
Turn on / off whether they are collected
Collected as part of the survey so is date stamped
Can be used in reports and queries
Print a list of non-ADA compliant roads
Print a list of roads with poor drainage
151
Surveys - Discussion
12/6/2011 UNH T2 Center
What are some other decision-makers that you use when
determining which repairs to select?
What information do you need to collect to use them?
152

Analysis
12/6/2011 UNH T2 Center
We have recorded:
Inventory – what you have
Conditions – what shape it is in
The last steps:
Analysis
Management Plans
153
Analysis
12/6/2011 UNH T2 Center
The easy part since RSMS does it for you
For each section, RSMS:
Finds the key distress
Looks up the repair category for that distress
Records the repair category
What you need to do:
Inventory
Condition surveys
Pick the repair from the category afterward (maybe…)
Analysis is done at the close of the survey automatically or through a menu command
154
Decisionmaking
How RSMS determines
the repair category:
1) Lookup each distress
and list the corresponding
repair category.
2) Lookup the RV for each
category on the list.
3) The largest RV becomes
the repair category.
12/6/2011 UNH T2 Center 155
Management Plan
12/6/2011 UNH T2 Center
This is where YOUR skills in decisionmaking come foremost
RSMS provides you with a bunch of info to make decisions
easier, but you still have to make them.
156

Management Plan
12/6/2011 UNH T2 Center
What is a management plan?
A multiyear plan for maintenance of roads to maintain / improve
their performance in a cost effective manner
Typically a 5 / 10 / 15 / 20 year plan
Network level (remember this?)
A guideline for budgets and project scheduling
157
Management Plan - Discussion
12/6/2011 UNH T2 Center
Discuss how you develop a management plan:
How many years do you plan?
What determines the timeframe?
Does the plan determine the budget or vice versa?
What considerations do you include for the budget?
Tax rate / resident or council approval rate / warrant process
How do you determine your priority roads to repair?
How do you allocate funds to repairs? By repair type? repair
level (routine, preventive, etc.)?
158

Management Plan
12/6/2011 UNH T2 Center
To consider:
Apply best technical and management practices
Roads that are not repaired will continue to deteriorate
‘Keep good roads good’ or ‘Best First’
Routine maintenance gives the most bang for the buck
Bad roads will remain bad
You cannot predict needed repairs than 5 years in advance
You can budget for repair level 5-20 years
Roughly, you want to apply no more than 2 preventive repairs
(crack seals, surface coat) before a rehab/rebuild is due
159
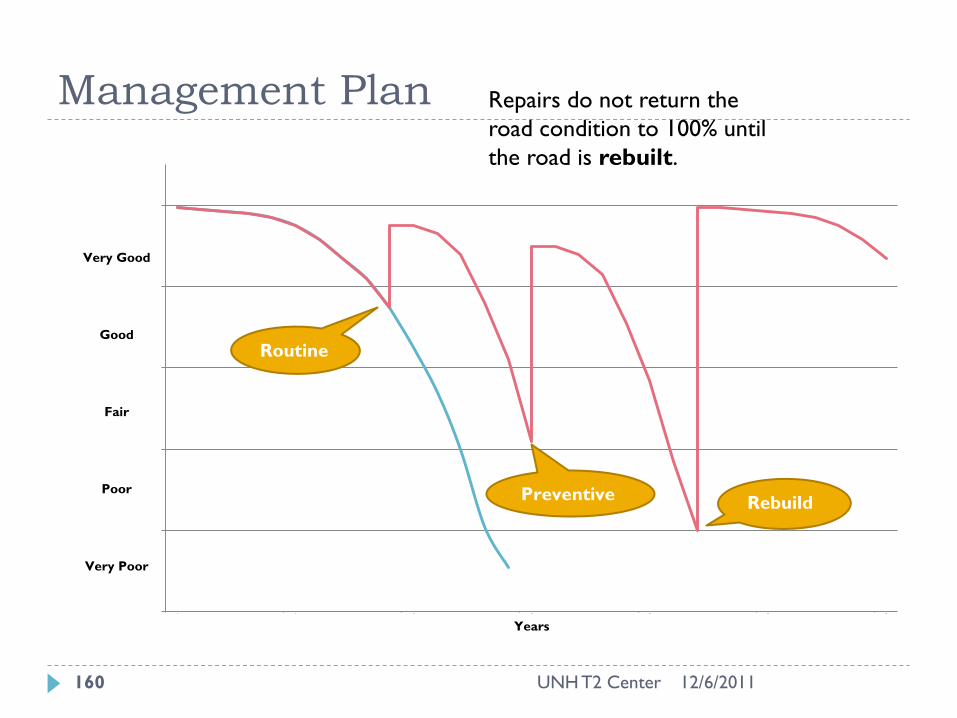
Management Plan
0 5 10 15 20 25 30
Very Good
Good
Fair
Poor
Very Poor
Years
Routine
Preventive Rebuild
Repairs do not return the
road condition to 100% until
the road is rebuilt.
12/6/2011 UNH T2 Center 160

Management Plan
12/6/2011 UNH T2 Center
Allocate by Level, sort by priority Budget %
1. Routine: complete all that can be scheduled ___
2. Preventive: complete all that can be scheduled ___
3. Rehab: use majority of leftover funds ___
4. Rebuild: use remaining funds ___
5. Repeat each year to year 5
6. Look at the repair lifetime to determine the next
needed repair for each road; budget accordingly
7. Remember the curve: budget for routine and preventive
repairs when they are due
161

Management Plan
12/6/2011 UNH T2 Center
Capital Improvement Plan
Used mainly for rebuilding roads and for major repairs
Limited lifetime; usually bonded
Used to build an acceptable road performance level
Can determine CIP requirements using the maintenance
backlog
Roads that are not rehab/rebuilt when needed are added to
the backlog
162
Summary – RSMS Process
Inventory – what you have
Condition Survey – distress identification and rating
Repairs – what you do to stop the distresses
Management Plan –multi-year repair plan to optimize
road performance and costs
12/6/2011 UNH T2 Center 163
More Information on CD
RSMS general manual
Distress identification manual 03031
Cost effectiveness of pavement maintenance
12/6/2011 UNH T2 Center 164


![POWER SLEEVE [BB386EVO] — TL-PWS 86 — TL …...POWER SLEEVE [BB386EVO] — TL-PWS 86 — TL-PWS Is Jk9—ÄlJ— TC-PWS 86Y—JL-ey (IRA) 00 —[*13 -30 < D 0) TL-PWS < — PWS](https://cdn.vdocument.in/doc/165x107/5f4dbd9d5303f80626076142/power-sleeve-bb386evo-a-tl-pws-86-a-tl-power-sleeve-bb386evo-a-tl-pws.jpg)

