Robert Davis
Hickman, Williams & Company
Steel Founders Society of America
March 23, 2011

Three area’s of interest
• World Production of Ferroalloys
• High Carbon Ferro Chromium
• Ferro Molybdenum

Globally, North America is a minor factor in the production of ferroalloys. The North American producers account for only 1.47% of all ferroalloy and specialty alloy production. Over 80% of the ferroalloys that are consumed in the United States are imported.

2000 5.30% of World Market
2004 2.14% of World Market – (1.20%
US)
2008 1.47% of World Market – (0.6%
US)

Asia
29.8%
Africa
20.5%
N. America
1.7%
S. America
5.6%
Europe
17.4%
Former CIS
19.2%
U.S.
3.6%
Others
2.1%

Africa17%
Asia39%
CIS20%
Europe11%
North America0.9%
U.S.1.2%
Other5%
South America6%
World Production of Ferroalloys26,300,000 MT produced in 2004
Source: USGS 2010

Africa12%
Asia56%
CIS14%
Europe6%
North America0.9%
U.S.0.6%
Other5%
South America5%
World Production of Ferroalloys36,100,000 MT produced in 2008
Source: USGS 2010

0
10
20
30
40
50
60
Asia Africa CIS Europe South America
U.S.
World Production of FerroalloysPercent of Total Production by Country
2000
2004
2008
Source: USGS 2010

0
500,000
1,000,000
1,500,000
2,000,000
2,500,000
3,000,000
3,500,000
4,000,000
4,500,000
5,000,000
2004 2005 2006 2007 2008
Africa, World ProductionMetric Tons
South Africa
Zimbabwe
Source: USGS 2010

0
200,000
400,000
600,000
800,000
1,000,000
1,200,000
1,400,000
1,600,000
1,800,000
2,000,000
2004 2005 2006 2007 2008
Former CIS, World ProductionMetric Tons
Kazakhstan
Russia
Ukraine
Source: USGS 2010

0
100,000
200,000
300,000
400,000
500,000
600,000
700,000
800,000
900,000
2004 2005 2006 2007 2008
Europe, World ProductionMetric Tons
Norway
Finland
France
Source: USGS 2010

0
200,000
400,000
600,000
800,000
1,000,000
1,200,000
1,400,000
2004 2005 2006 2007 2008
“America's” World ProductionMetric Tons
Canada
Mexico
United States
Brazil
Source: USGS 2010

0
200,000
400,000
600,000
800,000
1,000,000
1,200,000
2004 2005 2006 2007 2008
"Other" countries, World ProductionMetric Tons
Australia
India
Source: USGS 2010
0
2,000,000
4,000,000
6,000,000
8,000,000
10,000,000
12,000,000
14,000,000
16,000,000
18,000,000
20,000,000
2004 2005 2006 2007 2008
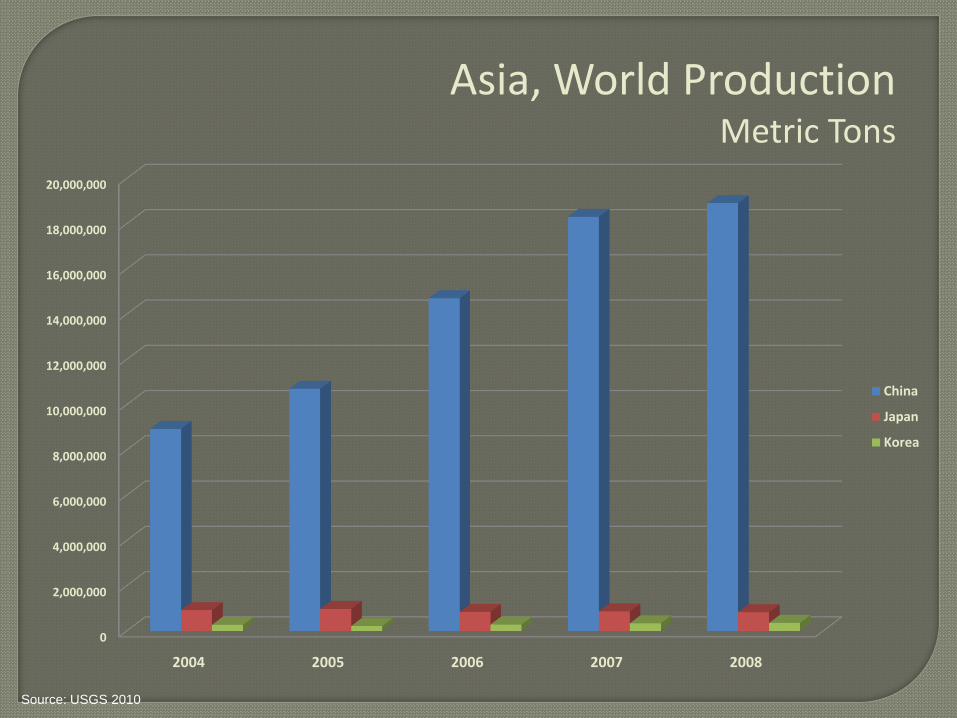
Asia, World ProductionMetric Tons
China
Japan
Korea
Source: USGS 2010

0
2,000,000
4,000,000
6,000,000
8,000,000
10,000,000
12,000,000
14,000,000
16,000,000
18,000,000
20,000,000
S. Africa Ukraine Norway Brazil India China
Largest Producers, by GeographicLocation, Metric Tons
2004
2005
2006
2007
2008
Source: USGS 2010

NORWAY INDIA
Ferro Manganese
• 215,000 Metric Tons
Ferro Silicon
• 210,000 Metric Tons
Silico Manganese
• 200,000 Metric Tons
Ferro Chromium
• 750,000 Metric Tons
Ferro Manganese
• 170,000 Metric Tons
Silico Manganese
• 90,000 Metric Tons
Source: USGS 2010

BRAZIL UKRAINE
Silico Manganese
• 350,000 Metric Tons
Ferro Manganese
• 340,000 Metric Tons
Ferro Chromium
• 196,000 Metric Tons
Silico Manganese
• 894,400 Metric Tons
Ferro Manganese
• 362,400 Metric Tons (BF)
Ferro Silicon
• 152,800 Metric Tons
Source: USGS 2010

SOUTH AFRICA CHINA
Ferro Chromium
• 3,100,000 Metric Tons
Ferro Manganese
• 610,000 Metric Tons
Silico Manganese
• 260,000 Metric Tons
Ferro Silicon
• 4,900,000 Metric Tons
Silico Manganese
• 4,500,000 Metric Tons
Ferro Manganese
• 2,100,000 Metric Tons
• 600,000 Metric Tons (BF)
Ferro Chromium
• 1,400,000 Metric Tons
Source: USGS 2010
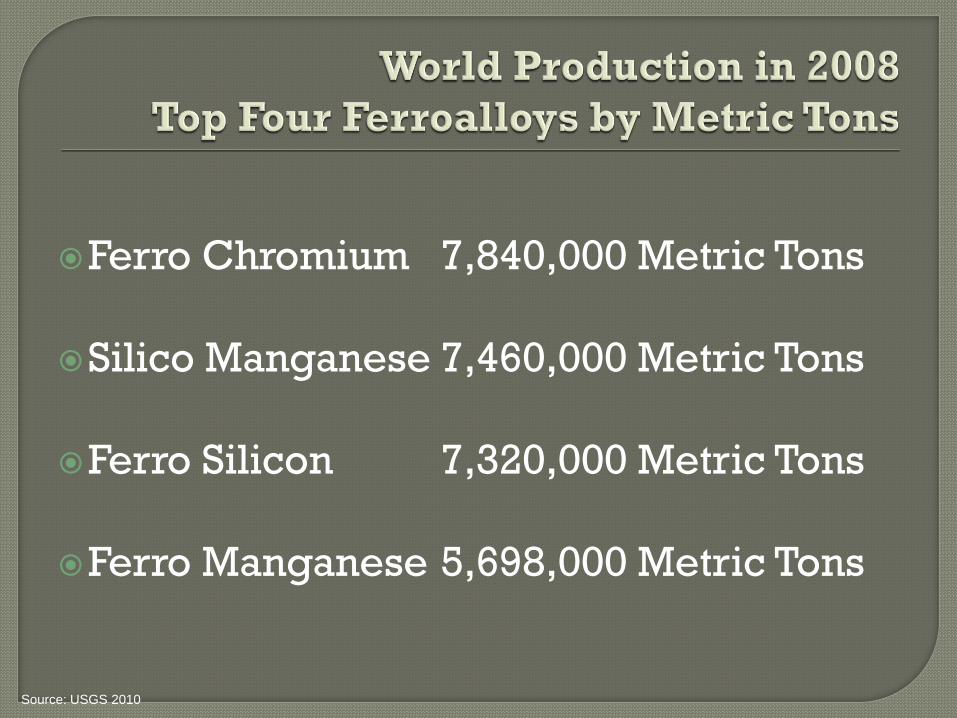
Ferro Chromium 7,840,000 Metric Tons
Silico Manganese 7,460,000 Metric Tons
Ferro Silicon 7,320,000 Metric Tons
Ferro Manganese 5,698,000 Metric Tons
Source: USGS 2010

Chromite Ore Mining
World Producers
Consumption / Importers to U.S.

World Resources of Chromite Ore are
greater than 12 Billion Tons of shipping
grade ore.
Sufficient supply to meet demand for
centuries.
About 95% of the worlds Chromite
resources are geographically
concentrated in Kazakhstan and South
Africa.
Source: USGS 2010

Country 2008 2009 2010
(Units are in million metric tons)
India 3.30 3.76 3.80
Kazakhstan 3.70 3.33 3.40
South Africa 9.60 6.87 8.50
Other 4.90 5.34 6.30
Total 21.50 19.30 22.00
One active chromite mine in the U.S. (North Western
U.S.)
In 2008, 94% of Chromite Ore was smelted in electric
arc furnaces to produce Ferro Chrome for the
metallurgical industry.
Source: USGS 2010

In 2008, the United States consumed about 10% of the worlds chromite ore production.
Forms were chromite ore, chromium chemicals, Ferro Chromium alloys, chromium metal and stainless steel.
In 2010, the United States consumed only about 2% of the worlds chromite ore production.
Source: USGS 2010


The major Ferro Chromium producing
countries are:
South Africa 3.1 million Metric Tons
China 1.4 million Metric Tons
Kazakhstan 1.2 million Metric Tons
India 750,000 Metric Tons
Russia 530,000 Metric Tons
Zimbabwe 150,000 Metric Tons
Source: USGS 2010

0
500,000
1,000,000
1,500,000
2,000,000
2,500,000
3,000,000
3,500,000
Ferro Chrome ProducersMetric Tons
2008
Source: USGS 2010

U.S. production of Ferro Chrome halted in
2008.
One plant in Marietta Ohio, that made
Nitrided Ferro Chrome.
South African Chrome is typically a
charge chrome (48 to 52% Cr).
Other producers vary in Cr – C – Si
ratios.
Source: USGS 2010


China’s role as a chromium consumer
grew along with its stainless steel
producing industry.
China’s stainless steel production
exceeded that of the U.S. in 2004.
By 2008, China’s stainless steel
production was 335% greater than that of
the United States.
Source: USGS 2010
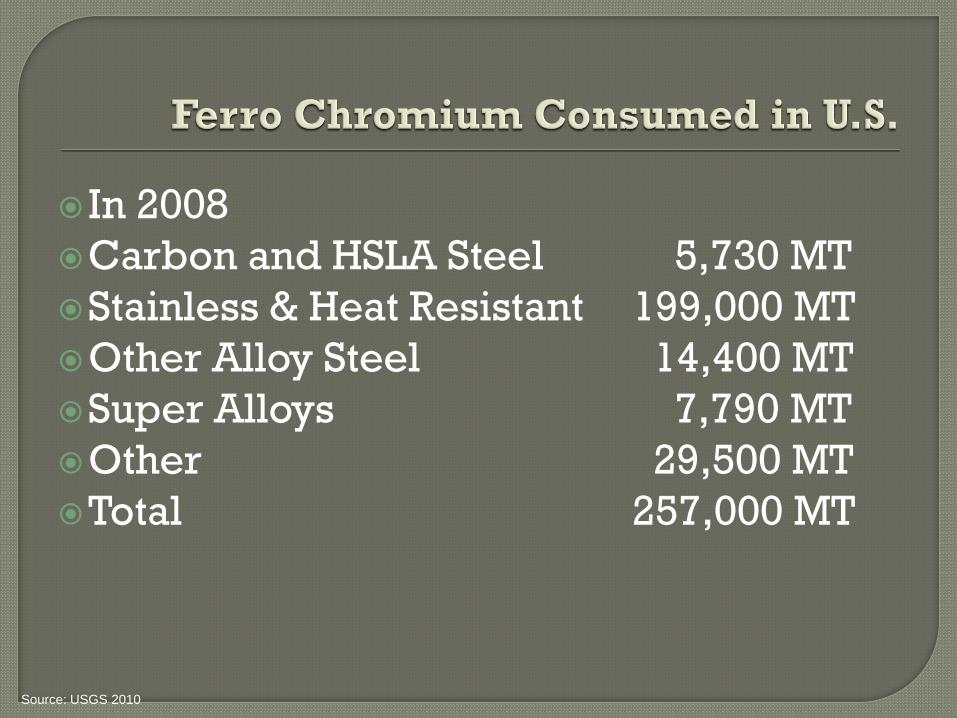
In 2008
Carbon and HSLA Steel 5,730 MT
Stainless & Heat Resistant 199,000 MT
Other Alloy Steel 14,400 MT
Super Alloys 7,790 MT
Other 29,500 MT
Total 257,000 MT
Source: USGS 2010
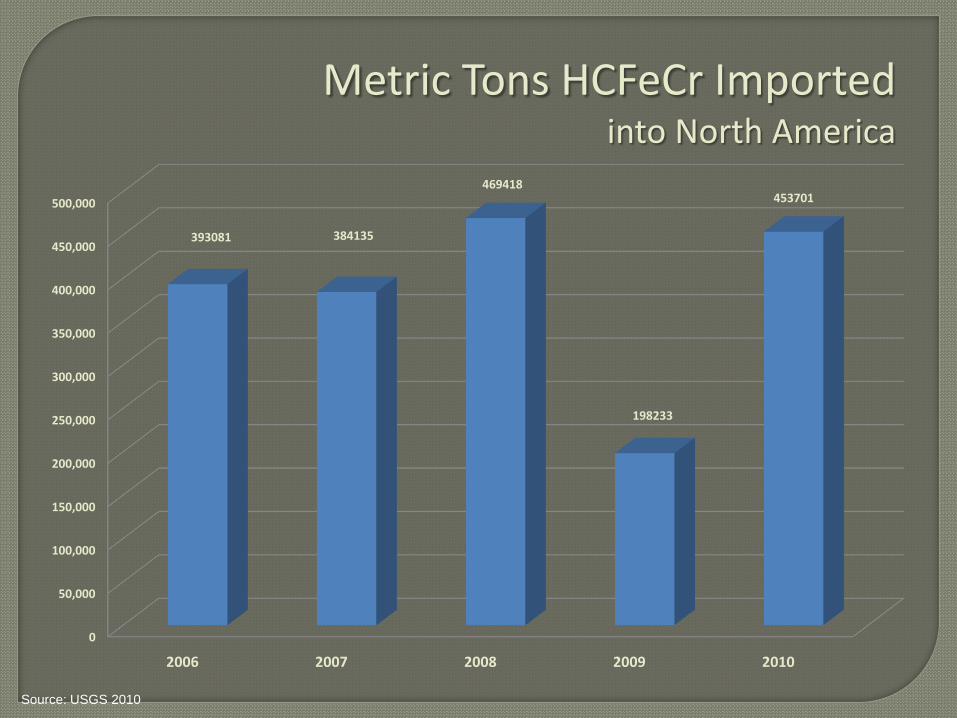
0
50,000
100,000
150,000
200,000
250,000
300,000
350,000
400,000
450,000
500,000
2006 2007 2008 2009 2010
393081 384135
469418
198233
453701
Metric Tons HCFeCr Importedinto North America
Source: USGS 2010

0
20,000
40,000
60,000
80,000
100,000
120,000
140,000
160,000
2006 2007 2008 2009 2010
61,500
152,000
29,357
17,76625,819
Metric Tons of HCFeCr sold by DLA
Source: USGS 2010

0
100,000
200,000
300,000
400,000
500,000
600,000
2006 2007 2008 2009 2010
454,581
536,135
498,775
215,999
479,520
Imports plus DLA Sales of HcFeCr
Imported
DLA
Total
Source: USGS 2010

Source: Ryan’s Notes

0
50,000
100,000
150,000
200,000
250,000
Metric Tons HCFeCr Imported into U.S., Plus DLA Sales
2006
2007
2008
2009
2010
Source: USGS 2010

42%
22%
10%
13%
13%
2006 Importers, HcFeCr454,581 Metric Tons
South Africa Kazakhstan Russia Zimbabwe DLA
Source: USGS 2010

44%
23%
8%
7%
6%
12%
2008 Importers of HCFeCr498,775 Metric Tons
South Africa Kazakhstan Russia Zimbabwe DLA India
Source: USGS 2010

51%
24%
7%
4%
5%3% 2% 2% 2%
2010 Importers of HCFeCr479,520 Metric Tons
South Africa Kazakhstan Russia Zimbabwe DLA India Albania Turkey Sweden
Source: USGS 2010


0
10,000
20,000
30,000
40,000
50,000
60,000
70,000
80,000
90,000
World Mine ProductionMetric Tons of Contained Mo
2004
2005
2006
2007
2008
Source: Indexmundi.com

0
10,000
20,000
30,000
40,000
50,000
60,000
70,000
80,000
90,000
China United States Chile Peru Canada
World Mine ProductionMetric Tons of contained Mo
2004
2005
2006
2007
2008
Source: indexmundi.com
0
10,000
20,000
30,000
40,000
50,000
60,000
70,000
80,000
90,000
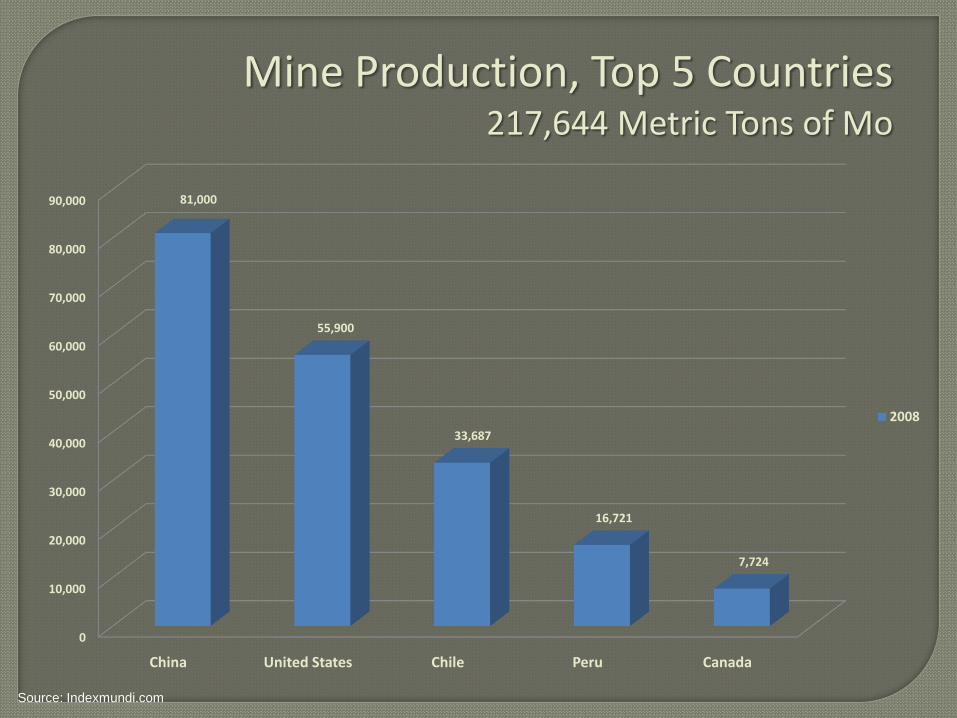
China United States Chile Peru Canada
81,000
55,900
33,687
16,721
7,724
Mine Production, Top 5 Countries217,644 Metric Tons of Mo
2008
Source: Indexmundi.com
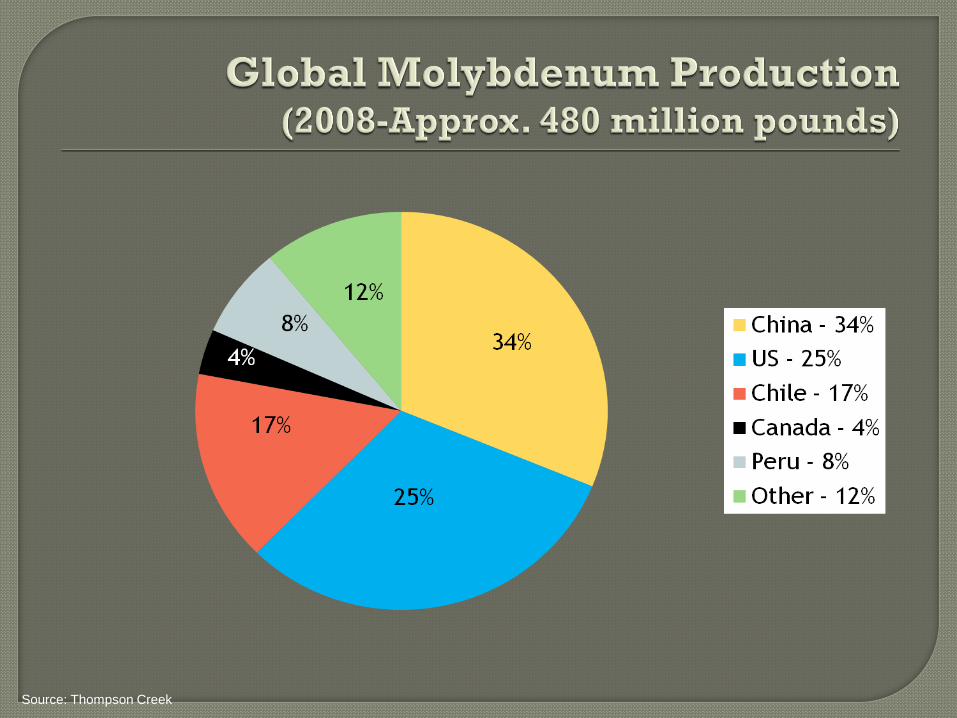
Source: Thompson Creek
0
10,000
20,000
30,000
40,000
50,000
60,000
70,000
80,000
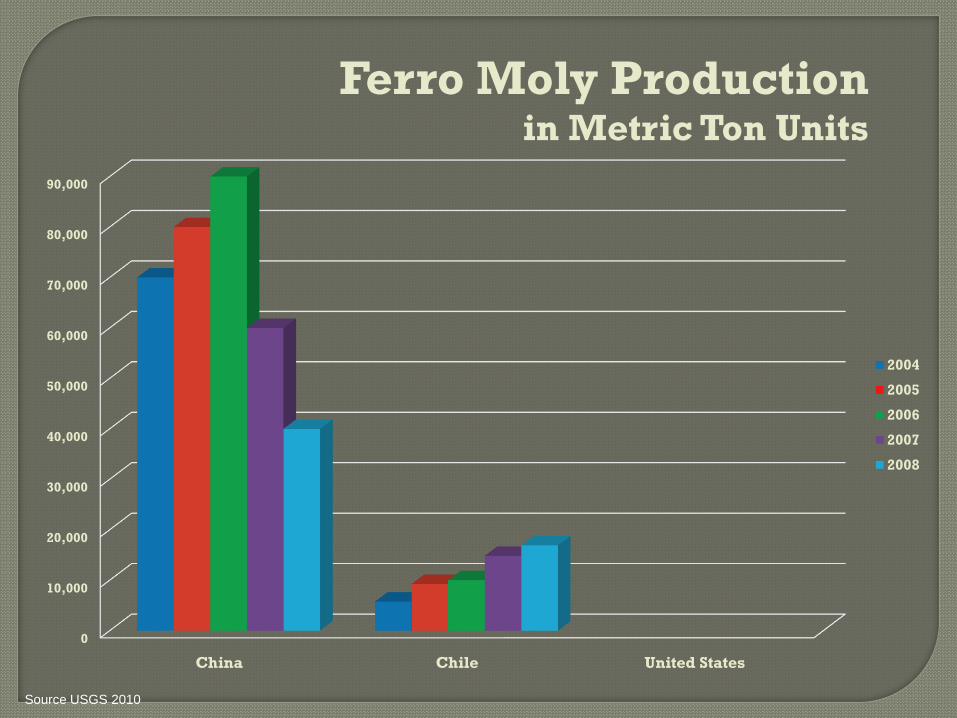
90,000
China Chile United States
Ferro Moly Productionin Metric Ton Units
2004
2005
2006
2007
2008
Source USGS 2010
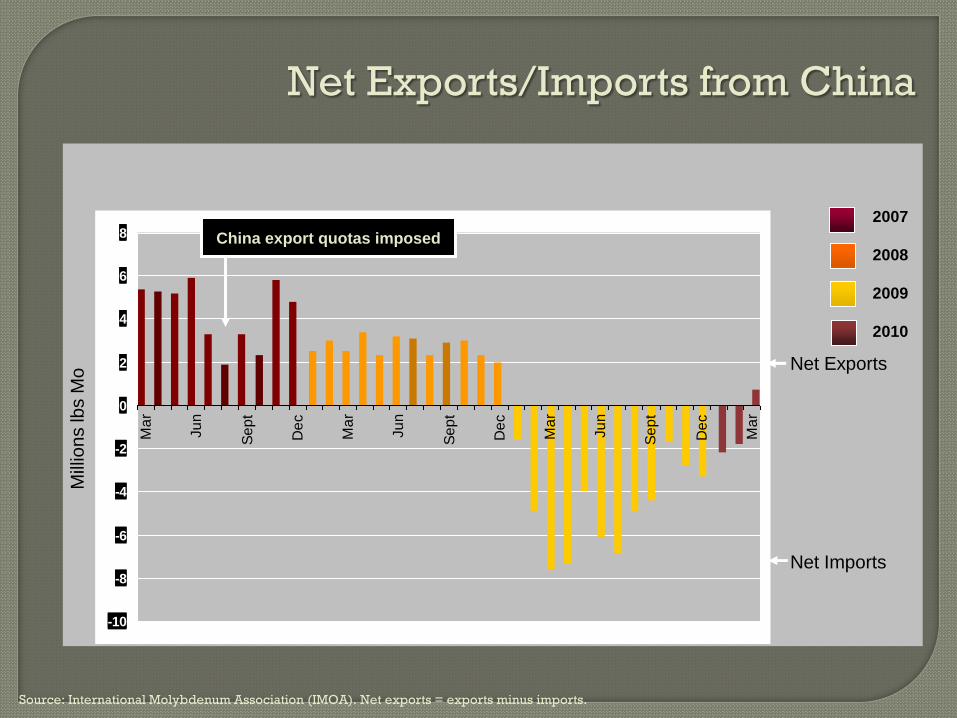
-10
-8
-6
-4
-2
0
2
4
6
8
Ma
r
Ju
n
Se
pt
De
c
Ma
r
Ju
n
Se
pt
De
c
Ma
r
Ju
n
Se
pt
De
c
Ma
r
Mill
ion
s lb
s M
o
2007
2008
2009
2010
Net Exports/Imports from China
Source: International Molybdenum Association (IMOA). Net exports = exports minus imports.
China export quotas imposed
Net Exports
Net Imports
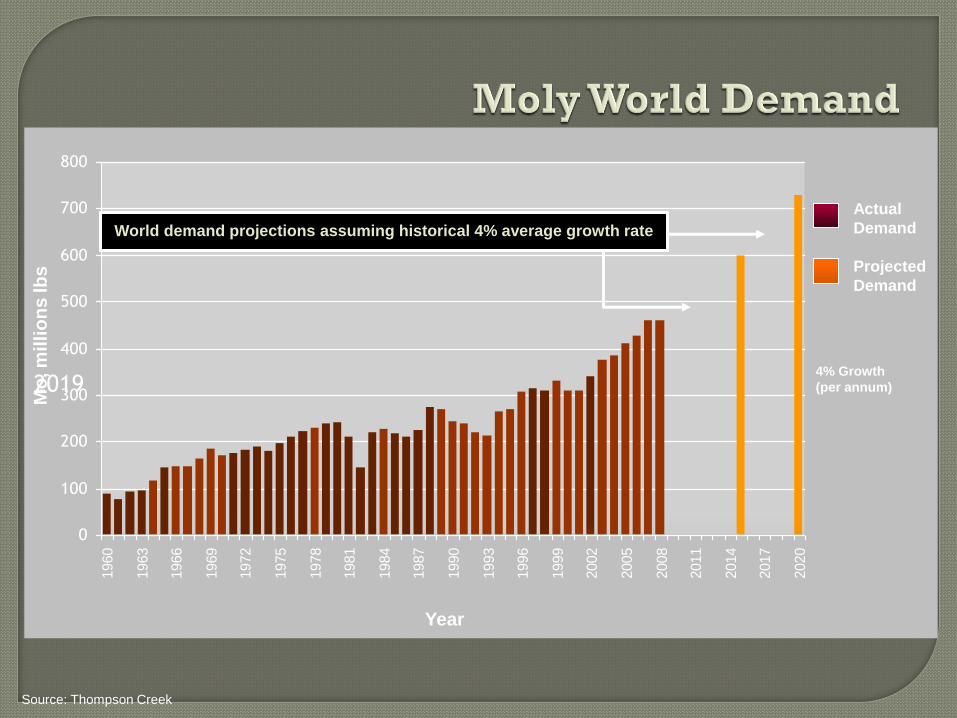
2019
0
100
200
300
400
500
600
700
800
1960
1963
1966
1969
1972
1975
1978
1981
1984
1987
1990
1993
1996
1999
2002
2005
2008
2011
2014
2017
2020
Actual
Demand
Projected
Demand
Year
Mo
, m
illi
on
s lb
s
4% Growth
(per annum)
World demand projections assuming historical 4% average growth rate
Source: Thompson Creek

Source: SMR GmbH

Main Driver: Oil Exploration and Development
• Increased demand for production: drilling
and pipelines
• Remote sources: deeper drilling, longer pipelines
• High-sulfur fuels including heavy oils and tar
sands: corrosive
• Nuclear power resurgence
• New and retrofit of coal fired power plants to super
critical operating levels
• Natural gas and oil fired plants
• Wind energy
Source: Thompson Creek

Main Driver: Capital Projects
A. Chemical Processing
• Petrochemical
• Desalinization
• Pulp & paper
• Food processing
• Pharmaceutical
B. Architectural
C. Power Generation: Nuclear, Coal, and Gas
Source : Thompson Creek

Approx. % Mo
Tool Steel 1-5%
High Speed Steel 5-9%
Foundry/Cast Iron up to 15%
Moly Metal 99.5%
Super alloys 4-16%
Chemicals
- Catalysts 8-20%
- Lubricants up to 15%
- Other 1-3%
Source: Thompson Creek

A. Moly is a metal for developed economies
• Rapid industrialization results in shift of consumption to
China, Korea, India, Brazil, and Russia
B. Industrial and Regulatory requirements demand
better steels
• CO2 reduction - Coal fired power plant, new & retrofits
• Tighter environmental standards – Tougher sulfur
emission standards results in new generation of de-
sulfurization catalysts with increased molybdenum
loading.
• Fuel economy – stronger and lighter steels improve
power efficiency in automobiles and trucks
Source: Thompson Creek

• Short-term: Recovery underway
• Demand supported by new uses and
continued energy/infrastructure investment
• Supply constrained: Development of major
new mines delayed by financial crisis
• Medium term: price strength anticipated as
world economy continues to grow
Source: Thompson Creek