Corporate B oard: R ole, D uties & Com position / V olum e 9 , Issue 1 , 2013
50
ROLE OF INDEPENDENT DIRECTOR IN CORPORATE
GOVERNANCE – REFERENCE TO INDIA
Indrajit Dube*, Aparup Pakhira**
Abstract
A company is the common platform of various stakeholders, such as customers, employees, investors, shareholders etc.. It is an instrument that can attract huge capital for doing business. Every transaction in a company should be fair and transparent to its stakeholders. A company having good Corporate Governance and an effective Board of Directors attract investors and ensure investment. Independence of the Board is critical to ensure that the board fulfills its role objectively and holds the management accountable to the company. The practice across jurisdictions indicates that the presence of Independent Director is answer to that. The present write up delves into the current scenario in Indian Corporate Sector and examine the role of Independent Director in Corporate Governance, in particular. Keywords: Corproate Governance, Board of Directors, Independent Director, India
*R ajiv G andhi School of Intellectual P roperty L aw , Indian Institute of Technology K haragpur, India
**R ajiv G andhi School of Intellectual P roperty L aw , Indian Institute of Technology K haragpur, India
1 Introduction & Conceptual Approach A company is the congregation (common platform) of various stakeholders, such as customers, employees, investors, shareholders etc.. It is an instrument that can attract huge capital for doing business. This has become imperative in today’s globalized business world where companies need to access global pools of capital, need to tie-up with vendors on mega collaborations and also need to live in harmony with the community. Every transaction in a company should be fair and transparent to its stakeholders. A company having good Corporate Governance and an effective Board of Directors attract investors and ensure investment. Independence of the Board is critical to ensure that the board fulfills its role objectively and holds the management accountable to the company. The practice across jurisdictions indicates that the presence of Independent Director is answer to that. For the last two decades, corporate scholars have dealt with the issues of Corporate Governance. Across all jurisdictions, it has been felt that the issues like governance failure, corporate fraud etc. may be resolved through the introduction of Independent Director. But, experience has not always been in the affirmative. It has been experienced that, in spite of good number of Independent Directors in the board, companies have failed. Independent Directors were introduced voluntarily as a measure of good governance in the United States (U.S.) in the 1950s before they were mandated by law1. After the Cadbury Committee Report (UK)2 in the year 2002, development with regard to Independent Director in US and UK witnessed proliferation. In India, the concept of Independent Director was conceived in the later part of 1990s’, when the Securities and Exchange Board of India (SEBI) mandated that all large public listed companies in India are to have
1 Jeffrey N. Gordon, The rise of Independent Directors in the United States, 1950-2005, of Shareholder value and Stock Market Prices, 59 Stan. L. Rev. 1465, 1473. 2Available at http://www.ecgi.org/codes/documents/cadbury.pdf, [Cadbury report], last visited on 4th November 2011 at 09:00 hrs.
Corporate B oard: R ole, D uties & Com position / V olum e 9 , Issue 1 , 2013
51
a minimum number of Independent Directors3 for the independence of the board and smooth Corporate Governance. Just as the global Corporate Governance movement was going into a bit of hibernation, there came the Enron debacle of 2001. The collapse of Enron was one of the largest bankruptcies in US history. The stock price dramatically collapsed from $80 per share to $.30 per share. The collapse was mainly due to the management’s fraudulent practices. Enron lied about its profits and when the deception was unfolded, investors and creditors pulled back their financial resources, which finally caused the company to face bankruptcy. Over expansion and excessive borrowings have also contributed to the company’s eventual demise. The finances were a disaster, resulting due to poor management and intentional deception and fraud. Poor management, maybe, referred to as systemic Corporate Governance failure. CEO, Bernard Ebbers, became wealthy from the increasing price of his holdings in WorldCom common stock. In the year 2000, WorldCom suffered a serious slowdown when U.S. Justice Board asked them to abandon the merger with Sprint Corporation. By that time, WorldCom’s stock started declining and Ebbers was in immense pressure from the banks to cover margin calls on his WorldCom stock. Later in 2002, Ebbers was replaced by Mr. John Sidgmore. After Ebbers resignation, it was revealed that under his direction, Mr. Scott Sullivan (CFO), Mr. David Myers (Controller) and Mr. Buford Yates (Director of General Accounting) and the company used fraudulent accounting practices from the year 1999 to 2000. The U.S. Securities and Exchange Commission (SEC) launched an investigation into this matter on June 26, 2002 and it was estimated that company’s total assets were inflated at the rate $11 billion. On July 21, 2002, WorldCom filed for bankruptcy protection under Chapter 114. This case reemphasised the importance of Corporate Governance and an interesting fact is that there were many Independent Directors in WorldCom. A similar experience stands in case of Satyam in India. The case of Satyam Computer came to light with a successful effort on the part of investors to prevent an attempt by the minority shareholding promoters to use the firm’s cash reserves to buy two companies owned by them, i.e., Maytas Properties and Maytas Infra. As a result, an attempt of expansion on Satyam’s part was aborted, which in turn led to a collapse in price of company’s stock followed by a shocking confession by Mr. Ramalinga Raju, the then CEO of Satyam. The truth was that the promoters had decided to inflate the revenue and profit figures of Satyam by manipulating their balance sheet consisting of non-existent assets, cash reserves and liabilities. After Satyam, ‘Corporate Governance’ came out of the hitherto dusty academic closets and moved centre stage in India, accompanied by other scandals involving large US companies, such as WorldCom, Qwest, Global Crossing and Andersen and companies in other jurisdictions. After having shaken the foundations of the business world, that too in the stronghold of capitalism, these scandals triggered another vigorous phase of reforms in Corporate Governance and naturally, the institution of Independent Director came into limelight. The activities and functions of Independent Directors were under scrutiny. It was not only in Satyam that Independent Directors showed lack of commitment; earlier, in the case of Enron, WorldCom and other companies, Corporate Governance as well as Independent Directors failed to perform effectively. But that did not suggest that directors were ineffective. The Satyam scandal exposed flaws, but its recovery showed that decent hands at its helm, like Mr. Kiran Karnik and Mr. Deepak Parekh, could make a real difference. In all the above cases, it was presumed that there was lack of Corporate Governance and that was due to failure of Independent Director. In this backdrop, the present research work moves beyond the conceptualization of Independent Director. It addresses concerns of various factors which must be considered for better Corporate Governance: How far do they justify their position and duties; What are the criteria to be an Independent Director; whether these criteria are enough for smooth running of a public listed company, where public at a large have invested their money; What role do they play being an Independent Director and can they really justify their position being an independent member or person who is not involved in affairs of a company; What
3 Securities and Exchange Board of India (SEBI), smdrp/policy/cir-10/2000 dated Feb. 21, 2000, available at http://www.securities.ru/public/public98/sebi/sebiacts/000221-100700.htm , last visited on 3rd November 2011 at 16:54 hrs. 4 11 U.S.C. § 1108.
Corporate B oard: R ole, D uties & Com position / V olum e 9 , Issue 1 , 2013
52
are the disclosures to qualify as independent? Considering Enron5, Parlamat6, Satyam7, Amri hospital8 and many other cases which have raised eyebrows of corporate philosophers, scholars and many other corporate law authorities, revisiting the concept of Independent Director in the frame of Corporate Governance is a desideratum in contemporary times. The present write up delves into the current scenario in Indian Corporate Sector with regard to links, if any, and examine the role of Independent Director in Corporate Governance, in particular. The present research has been based on analytical methods. The business/commercial reports, including corporate governance reports, books, articles and research papers have been thoroughly studied and analyzed. The researcher has relied on Prowess CIMS database [organization catalog and classify the reports of corporate governance for listed companies in India] for the purpose of Corporate Governance reports. The companies listed in National Stock Exchange and Bombay Stock Exchange have been selected for analysis. Running of Prowess Client Software has pulled out 27000 companies from the database listed in different time frames. Filter of market capitalization was applied to the selected data from 2006 onwards. A large number of missing values have been found in the data selected by the software. Data has been cleaned further and data set of 2000 listed companies has been received. The average market capitalization of each company has been computed through technical process. The data has been cleaned further based on consistency and commencement of Corporate Governance Reporting under listing agreement in India (i.e., 2002). The sorting has brought down the data to 186 listed companies. Again, the average of the average market capitalization of selected 186 listed companies have been worked out. The data has been sorted in the ascending order and 40 companies from the top and 40 from the bottom of the list have been finally selected for analysis. Information about Independent Director and Corporate Governance of those companies for the last five years have been catalogued and classified. The criterion for analyzing the data has been based on Clause 49 of Listing Agreement in India, principles of Corporate Governance of OECD and Corporate Governance parameter developed by credit rating agencies in India9. The entire analysis has been categorized in two parts: one, on attributes of Independent Director and the other, on issues of Corporate Governance. The entire analysis has been categorized in two parts: one on issues of Corporate Governance and the other on attributes of Independent Director. For the aspect of Corporate Governance, shareholding pattern, board structure, number of meetings attended by board members, number of committees in the board, type of directors heading each committee, disclosures by company, risk factor disclosed by the company and adoption of ethical code have been looked into. On the other hand, the educational qualification, experience, remuneration, number of directorships held in other companies, past relationship with the company, number of board meetings and AGM attended by independent directors have been traced. The entire data has been subsequently analyzed. About 400 Corporate Governance Reports have been thoroughly studied in course of the present work. To find out the impact of Independent Director on corporate Board and their independence in discharge of duties, the following parameters have been examined:
i. Qualification of Independent Director; ii. Experience of Independent Director; iii. Types of remuneration received by the Independent Director; iv. Number of Other Companies in which Independent Director holds position;
5An ENRON Scandal Available at http://finance.laws.com/enron-scandal-summary last visited on Aug 15, 2012. 6The Parmalat scandal: Europe’s ten-billion euro black hole(6 January 2004) ICFI Available at http://www.wsws.org/articles/2004/jan2004/parm-j06.shtmllast visited on Aug 15, 2012. 7Sudhakar V. Balachandran(July 1, 2009) The Satyam Scandal Available at http://www.forbes.com/2009/01/07/satyam-raju-governance-oped-cx_sb_0107balachandran.html last visited on last visited on Aug 15, 2012. 889 killed in AMRI hospital fire; six board members arrested(December 10, 2011) NDTV, http://www.ndtv.com/article/india/kolkata-89-killed-in-amri-hospital-fire-six-board-members-arrested-15661Last visited on visited on Aug 15, 2012. 9 Investment Information and Credit Rating Agencies of India Ltd. (ICRA Ltd.) and See, Chapter 2.
Corporate B oard: R ole, D uties & Com position / V olum e 9 , Issue 1 , 2013
53
v. Past Relationship with the Company; vi. Board Meeting attended by Independent Director during the year.
On the side of Corporate Governance, the following have been studied:
i. Shareholding pattern ii. Board composition iii. Number of meetings attended by Board members iv. Number of committees in the Board v. Type of directors heading each committee vi. Disclosures by company
vii. Risk factor disclosed by the company viii. Adoption of ethical code
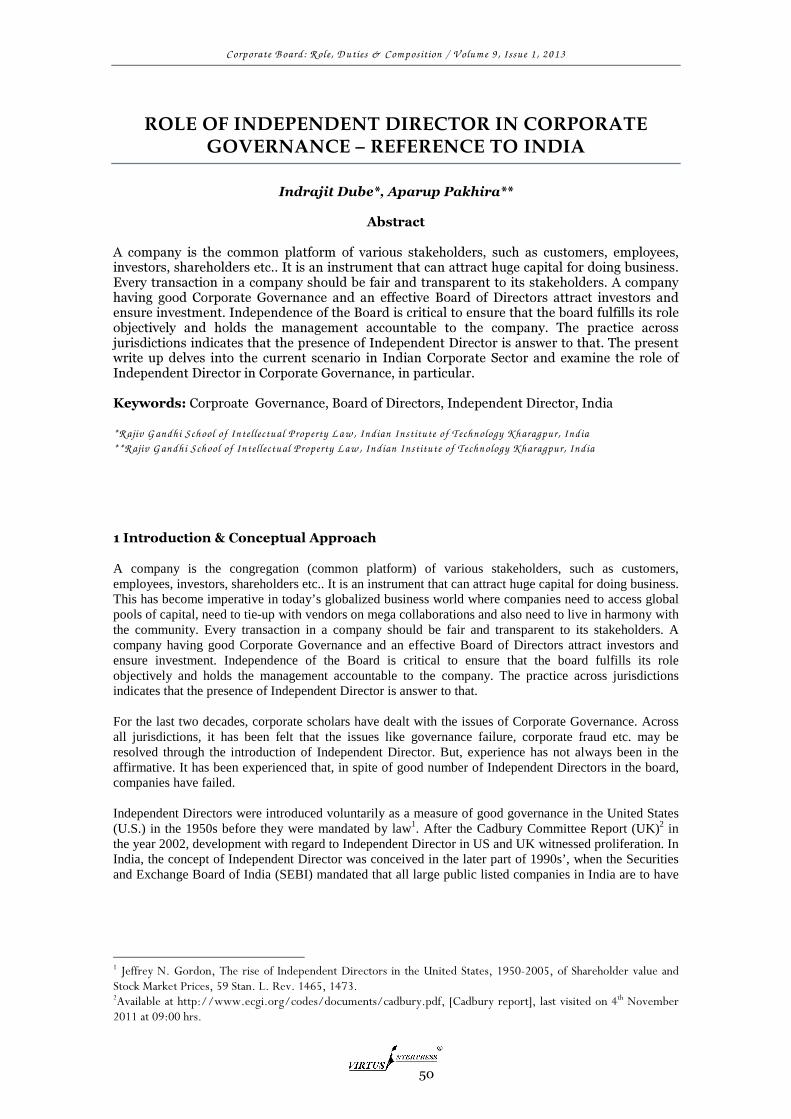
The researcher has thereafter attempted to establish the relationship between Independent Director and Corporate Governance in three steps: • Comparative analysis of Independent Directors between HMC and LMC • Status analysis of Corporate Governance practices the companies • Comparative influence of Independent Director on Corporate Governance practices in the
respective Companies.
Figure R1.1. Relationship between Independent Director and Corporate Governance
2 Analysis of Independent Director The researcher has analyzed the Independent Director status in the companies having market capitalization below and above the average respectively. Subsequent to that, a comparative approach has been adopted to indicate the differences in practice with regard to Independent Directors in the two categories. 2.1 Companies having market capitalization below average:
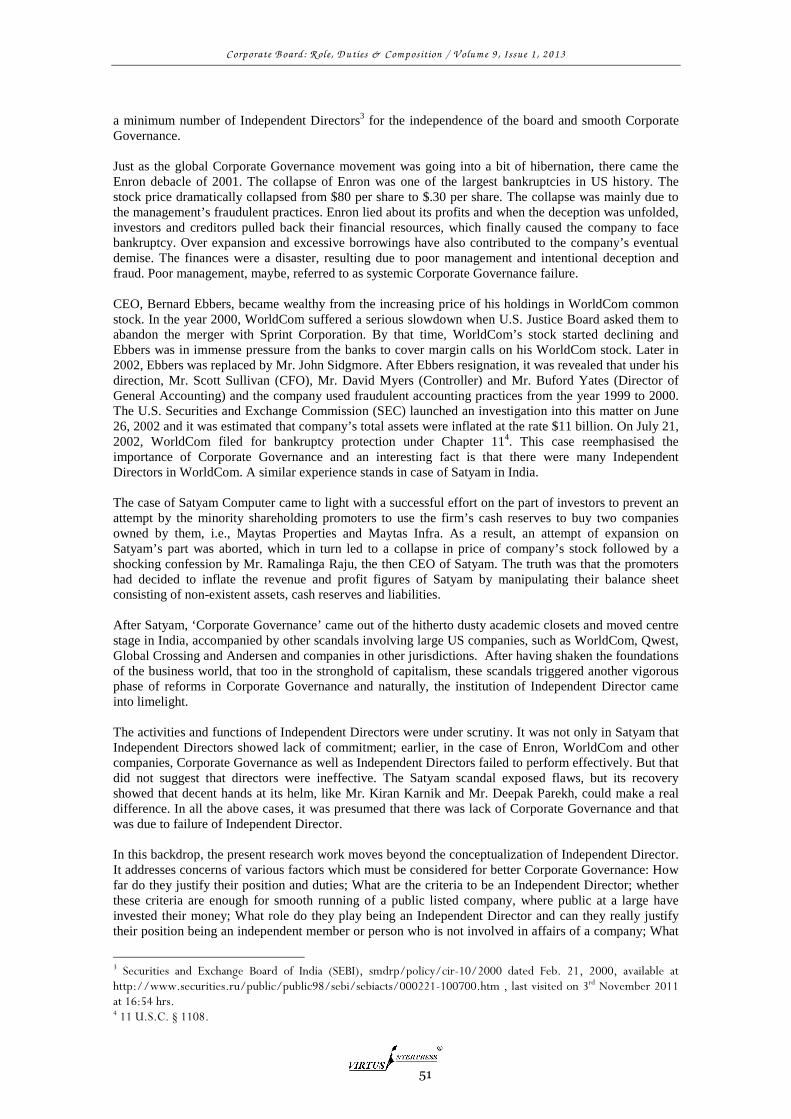
Figure ID L 1.1. Qualification of Independent Director
Independence of Independent Director
• Qualification
• Experience
• Remunerations
• Past-Relation with Company
• Multiple Directorship
Efficiency of Independent Director
• Director in Multiple Board
• Number of Board Meeting and AGM attended
Corporate Governance Status
Equitable Treatment to Shareholder &
Stakeholder
• Shareholding Patterns
• Board Composition
Efficiency & Independence of Corporate Board
• Number of Board Meetings
• Number of Committes in the Board
• Type of Director heading each Committee
Disclosure & Transparency
• Disclosure by Company in relation to non risk factots
• Disclosure relating Risk factor
• Adoption of Ethical Code
Corporate B oard: R ole, D uties & Com position / V olum e 9 , Issue 1 , 2013
54
The qualification of Independent Director includes graduates, postgraduates and professionals, which is collectively 3% of the total results. There is only 1% under the other category and they are from Indian Administrative Services. It is observed that in almost 394 cases, 84% of the total reports, qualification of Independent Directors has not been disclosed. Disclosure regarding qualification of Independent Director is poor.
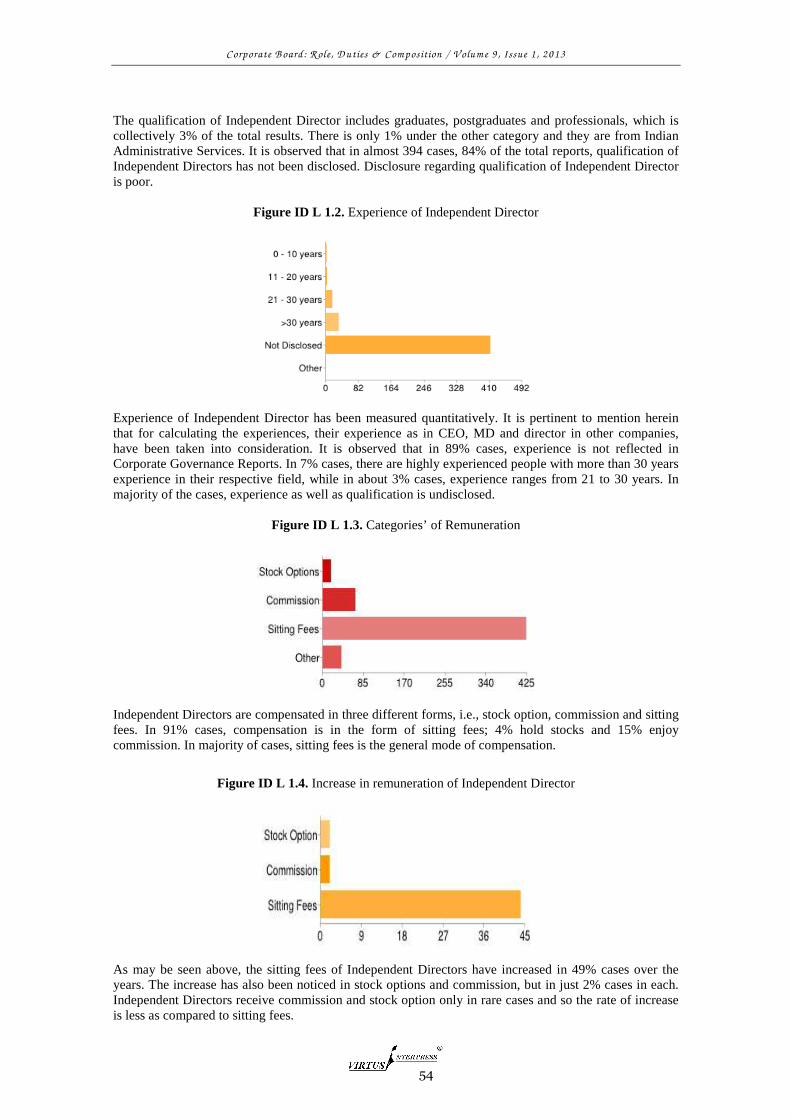
Figure ID L 1.2. Experience of Independent Director
Experience of Independent Director has been measured quantitatively. It is pertinent to mention herein that for calculating the experiences, their experience as in CEO, MD and director in other companies, have been taken into consideration. It is observed that in 89% cases, experience is not reflected in Corporate Governance Reports. In 7% cases, there are highly experienced people with more than 30 years experience in their respective field, while in about 3% cases, experience ranges from 21 to 30 years. In majority of the cases, experience as well as qualification is undisclosed.
Figure ID L 1.3. Categories’ of Remuneration
Independent Directors are compensated in three different forms, i.e., stock option, commission and sitting fees. In 91% cases, compensation is in the form of sitting fees; 4% hold stocks and 15% enjoy commission. In majority of cases, sitting fees is the general mode of compensation.
Figure ID L 1.4. Increase in remuneration of Independent Director
As may be seen above, the sitting fees of Independent Directors have increased in 49% cases over the years. The increase has also been noticed in stock options and commission, but in just 2% cases in each. Independent Directors receive commission and stock option only in rare cases and so the rate of increase is less as compared to sitting fees.

Corporate B oard: R ole, D uties & Com position / V olum e 9 , Issue 1 , 2013
55
Figure: ID L 1.5. Unchanged Remuneration of Independent Director
While 49% companies have indicated an increase in sitting fees, the same has remained unchanged in 24% cases. In 9% cases, stock option has also remained unchanged; with regard to commission, no information is available in the reports.
Figure ID L 1.6. Decrease in Remunerations of Independent Director – Decrease
The decrease with regard to remuneration has been relatively negligible with only 4% companies indicating a decrease.
Figure ID L 1.7. Number of Companies Independent Director holds position
To trace the involvement of Independent Directors, their attachment with different companies has been found out. It is observed that 48% Independent Directors are attached with less than three companies while 24% are attached with more than nine companies. Another 14% are attached with almost 4-6 companies. Thus, the attachment of Independent Directors appears to be on the lower side, indicative of their better involvement in the company affairs.

Corporate B oard: R ole, D uties & Com position / V olum e 9 , Issue 1 , 2013
56
Figure ID L 1.8: Past relationship with the Company
In 70% cases, almost 324, past relationship of the Independent Director with the present company has not been disclosed. There is no relation with the company in 22% cases while in 5% and 3 % cases, they have discharged duty as director and executive director of the same company respectively. Disclosure about the Independent Director’s past relation with the company is poor.
Figure ID L 1.9. Number of Board meeting attended by Independent Director
The analysis discloses that in 18% cases, Independent Directors attended more than 50% meetings of the company, in 9% cases they have attended just half the number of meetings, in 31% cases they have attended less than 50% of the meetings while just 35% Independent Directors appear to have attended all the meetings. 7% did not attend a single meeting. Attendance in meetings does not appear to be too encouraging for Independent Directors. 2.2 Companies having market capitalization above the average
Figure ID H 1.1. Qualification of Independent Director
Non-disclosure of information with regard to qualification of Independent Directors is almost 31%. However, of the companies which disclose qualification, an impressive 36% , 21%, 17% and 16% of
Corporate B oard: R ole, D uties & Com position / V olum e 9 , Issue 1 , 2013
57
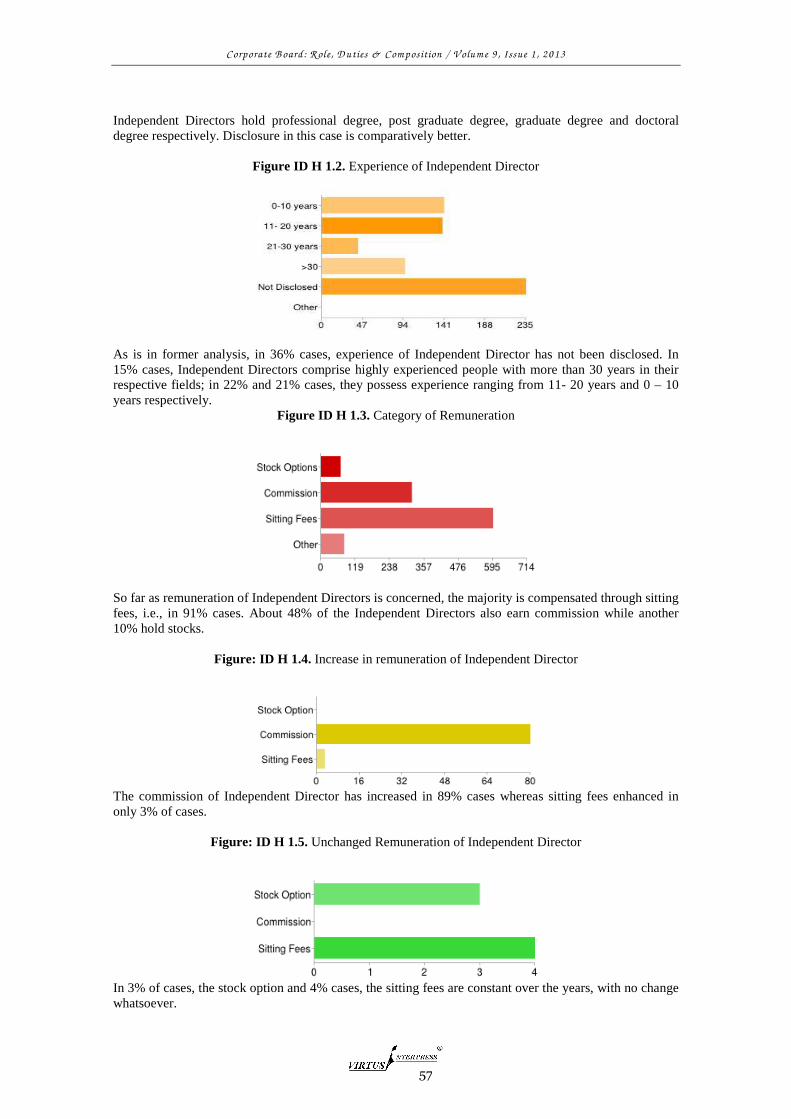
Independent Directors hold professional degree, post graduate degree, graduate degree and doctoral degree respectively. Disclosure in this case is comparatively better.
Figure ID H 1.2. Experience of Independent Director
As is in former analysis, in 36% cases, experience of Independent Director has not been disclosed. In 15% cases, Independent Directors comprise highly experienced people with more than 30 years in their respective fields; in 22% and 21% cases, they possess experience ranging from 11- 20 years and 0 – 10 years respectively.
Figure ID H 1.3. Category of Remuneration
So far as remuneration of Independent Directors is concerned, the majority is compensated through sitting fees, i.e., in 91% cases. About 48% of the Independent Directors also earn commission while another 10% hold stocks.
Figure: ID H 1.4. Increase in remuneration of Independent Director
The commission of Independent Director has increased in 89% cases whereas sitting fees enhanced in only 3% of cases.
Figure: ID H 1.5. Unchanged Remuneration of Independent Director
In 3% of cases, the stock option and 4% cases, the sitting fees are constant over the years, with no change whatsoever.
Corporate B oard: R ole, D
Figure ID H 1.6.
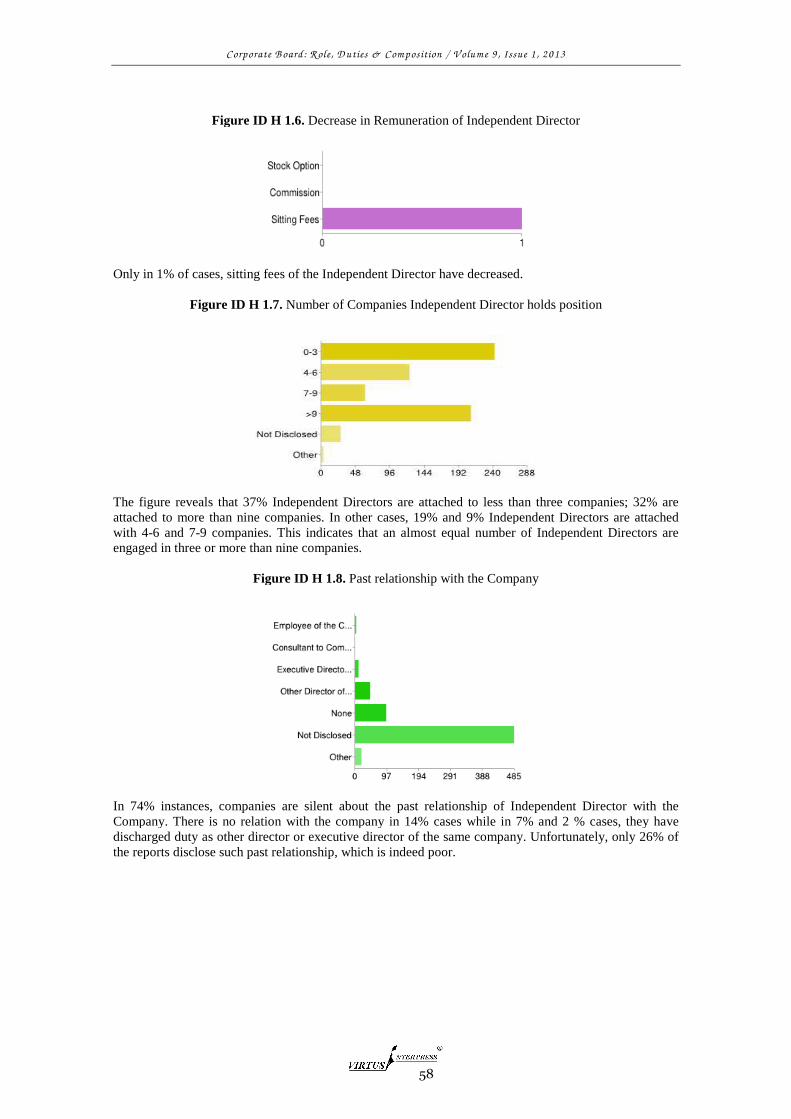
Only in 1% of cases, sitting fees of the Independent Director have decreased.
Figure ID H 1.7. Number of Companies Independent Director holds position
The figure reveals that 37% Independent Directors are attached to less than three companies; 32% are attached to more than nine companies. In other cases, 19% and 9% Independent Directors are attached with 4-6 and 7-9 companies. This indicates that an almost equal number of Independent Directors are engaged in three or more than nine companies.
Figure ID H 1.8.
In 74% instances, companies are silent about the past relationship of Independent Director with the Company. There is no relation with the company in 14% cases while in 7% and 2 % cases, they have discharged duty as other director or executive director of the same company. Unfortunately, only 26% of the reports disclose such past relationship, which is indeed poor.
Corporate B oard: R ole, D uties & Com position / V olum e 9 , Issue 1 , 2013
58
Figure ID H 1.6. Decrease in Remuneration of Independent Director
sitting fees of the Independent Director have decreased.
Number of Companies Independent Director holds position
The figure reveals that 37% Independent Directors are attached to less than three companies; 32% are n nine companies. In other cases, 19% and 9% Independent Directors are attached
9 companies. This indicates that an almost equal number of Independent Directors are engaged in three or more than nine companies.
Figure ID H 1.8. Past relationship with the Company
In 74% instances, companies are silent about the past relationship of Independent Director with the Company. There is no relation with the company in 14% cases while in 7% and 2 % cases, they have
r or executive director of the same company. Unfortunately, only 26% of the reports disclose such past relationship, which is indeed poor.
Decrease in Remuneration of Independent Director
Number of Companies Independent Director holds position
The figure reveals that 37% Independent Directors are attached to less than three companies; 32% are n nine companies. In other cases, 19% and 9% Independent Directors are attached
9 companies. This indicates that an almost equal number of Independent Directors are
In 74% instances, companies are silent about the past relationship of Independent Director with the Company. There is no relation with the company in 14% cases while in 7% and 2 % cases, they have
r or executive director of the same company. Unfortunately, only 26% of

Corporate B oard: R ole, D uties & Com position / V olum e 9 , Issue 1 , 2013
59
Figure ID H 1.9. Number of Board meeting attended by Independent Director
It is observed from data that attendance in Board meetings is impressive in case of Independent Directors. In 15% and 69% cases, they have attended all meetings or more than 50% of the meetings. In 11% of the cases, attendance is as low as less than 50%. 3% did not attend a single meeting. 2.3 Comparison between Independent Director in LMC and HMC10:
Figure ID C 1.1. Qualification of Independent Director
Qualification of person, to some extent discloses measurement of his/her efficiency and capacity to deliver in given circumstances. Qualified people are expected to have clarity and vision in future activities of the company. On comparative scale, the disclosure by the companies’ having high market capitalization is better than its counterpart. Directors with doctoral degree are more in the high market capitalization category, so also the number of graduates, postgraduates and professionals. Non-disclosure of qualification in both the categories is quite high; that does not indicate that those Independent Directors do not have any qualification; such disclosure would have indicated good Governance practices.
10The red line is indicative of companies with above average market capitalization (HMC), while the blue line is indicative of companies with below average market capitalization (LMC).
0
100
200
300
400
500
600
700
Graduate Post
Graduate
Professional Doctorate Not
Disclosed
Other
Corporate B oard: R ole, D uties & Com position / V olum e 9 , Issue 1 , 2013
60
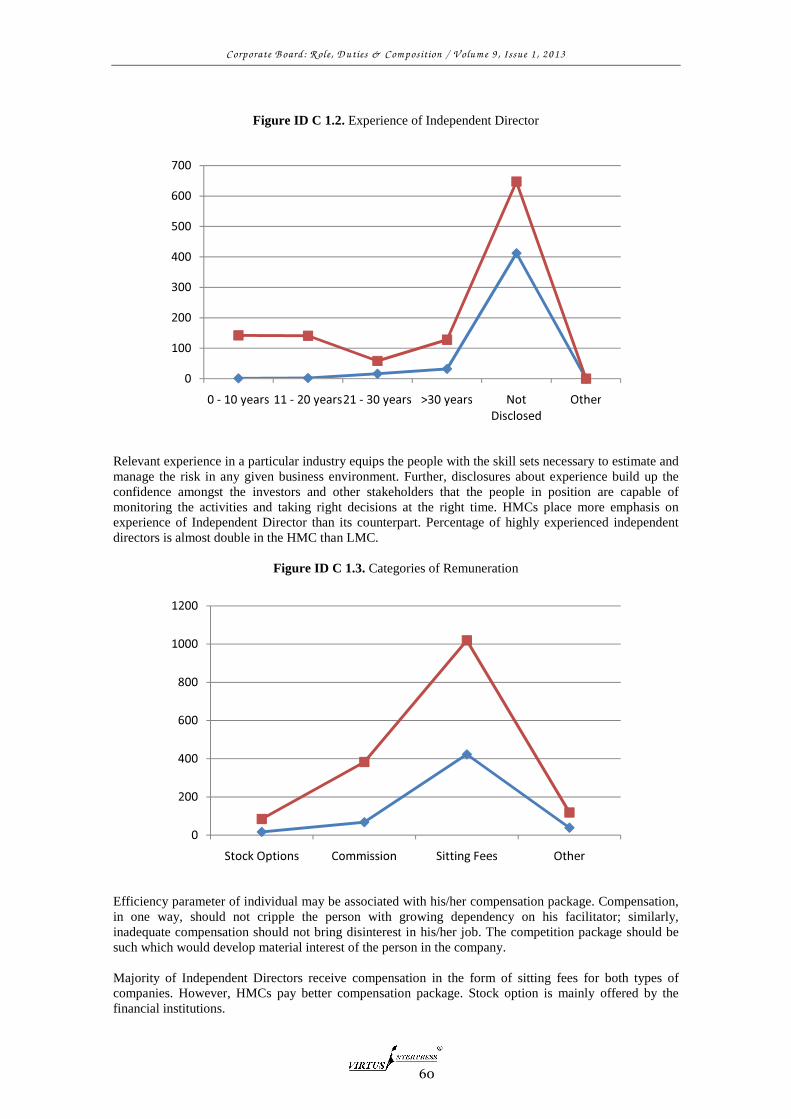
Figure ID C 1.2. Experience of Independent Director
Relevant experience in a particular industry equips the people with the skill sets necessary to estimate and manage the risk in any given business environment. Further, disclosures about experience build up the confidence amongst the investors and other stakeholders that the people in position are capable of monitoring the activities and taking right decisions at the right time. HMCs place more emphasis on experience of Independent Director than its counterpart. Percentage of highly experienced independent directors is almost double in the HMC than LMC.
Figure ID C 1.3. Categories of Remuneration
Efficiency parameter of individual may be associated with his/her compensation package. Compensation, in one way, should not cripple the person with growing dependency on his facilitator; similarly, inadequate compensation should not bring disinterest in his/her job. The competition package should be such which would develop material interest of the person in the company. Majority of Independent Directors receive compensation in the form of sitting fees for both types of companies. However, HMCs pay better compensation package. Stock option is mainly offered by the financial institutions.
0
100
200
300
400
500
600
700
0 - 10 years 11 - 20 years21 - 30 years >30 years Not
Disclosed
Other
0
200
400
600
800
1000
1200
Stock Options Commission Sitting Fees Other
Corporate B oard: R ole, D uties & Com position / V olum e 9 , Issue 1 , 2013
61
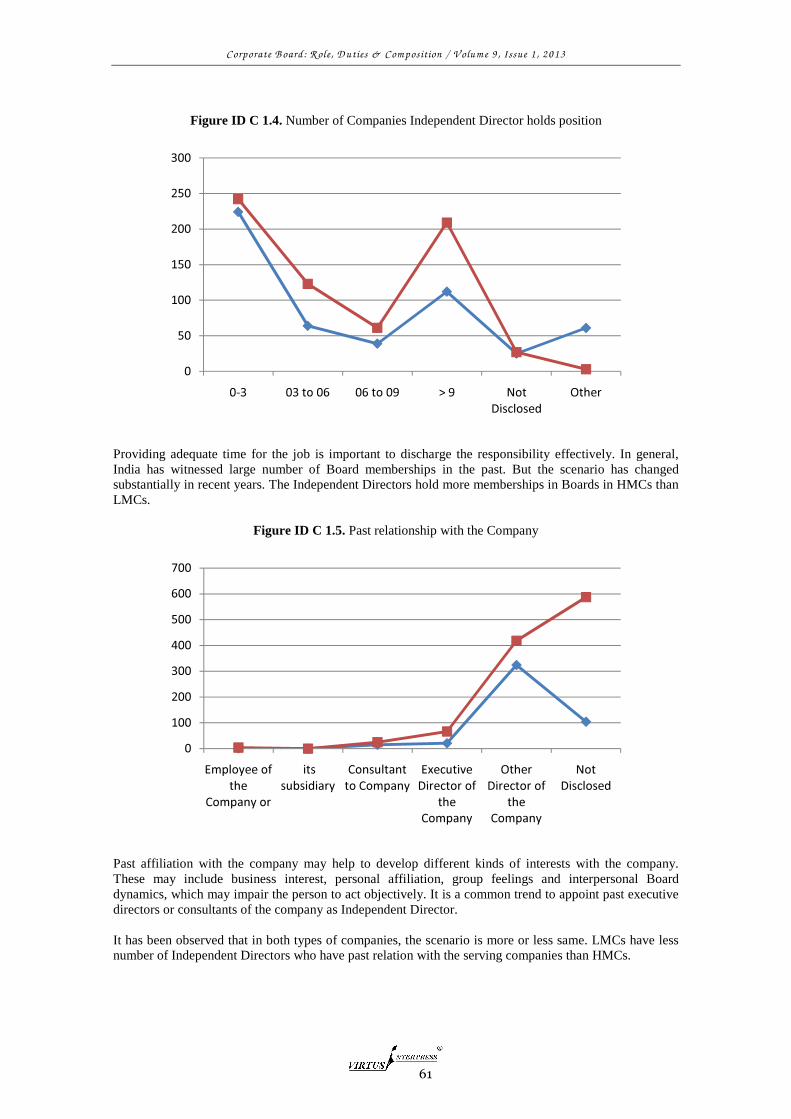
Figure ID C 1.4. Number of Companies Independent Director holds position
Providing adequate time for the job is important to discharge the responsibility effectively. In general, India has witnessed large number of Board memberships in the past. But the scenario has changed substantially in recent years. The Independent Directors hold more memberships in Boards in HMCs than LMCs.
Figure ID C 1.5. Past relationship with the Company
Past affiliation with the company may help to develop different kinds of interests with the company. These may include business interest, personal affiliation, group feelings and interpersonal Board dynamics, which may impair the person to act objectively. It is a common trend to appoint past executive directors or consultants of the company as Independent Director. It has been observed that in both types of companies, the scenario is more or less same. LMCs have less number of Independent Directors who have past relation with the serving companies than HMCs.
0
50
100
150
200
250
300
0-3 03 to 06 06 to 09 > 9 Not
Disclosed
Other
0
100
200
300
400
500
600
700
Employee of
the
Company or
its
subsidiary
Consultant
to Company
Executive
Director of
the
Company
Other
Director of
the
Company
Not
Disclosed
Corporate B oard: R ole, D uties & Com position / V olum e 9 , Issue 1 , 2013
62
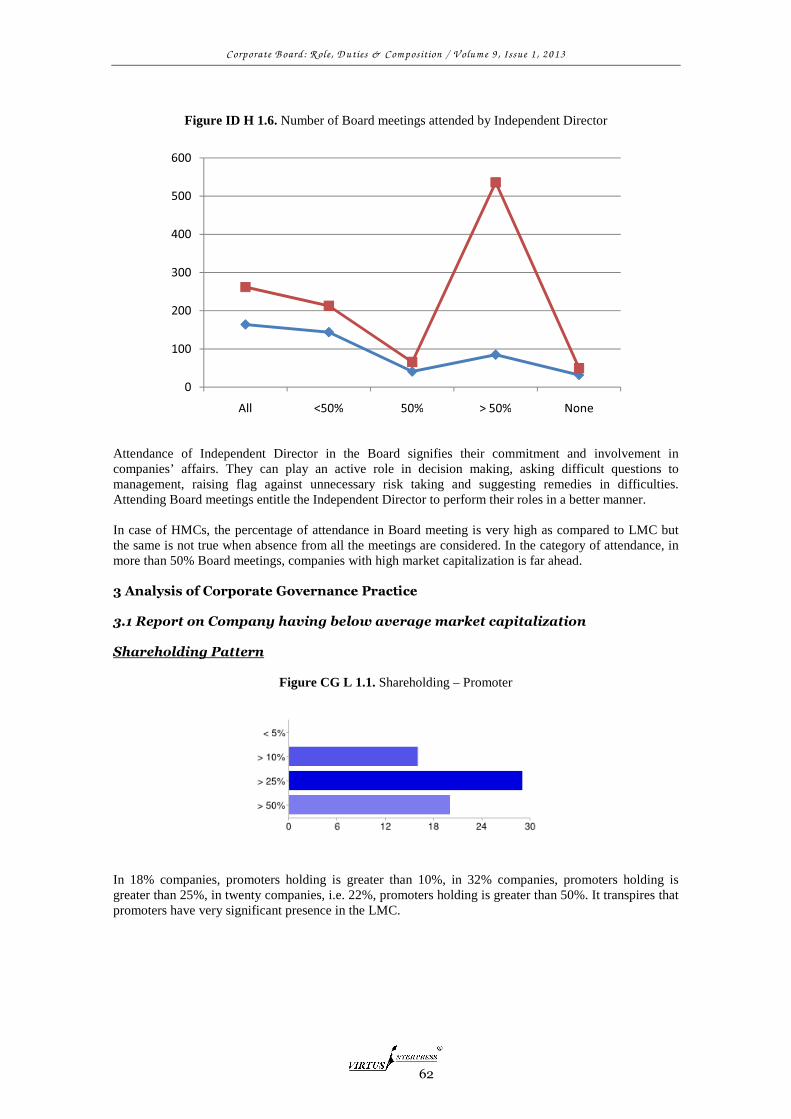
Figure ID H 1.6. Number of Board meetings attended by Independent Director
Attendance of Independent Director in the Board signifies their commitment and involvement in companies’ affairs. They can play an active role in decision making, asking difficult questions to management, raising flag against unnecessary risk taking and suggesting remedies in difficulties. Attending Board meetings entitle the Independent Director to perform their roles in a better manner. In case of HMCs, the percentage of attendance in Board meeting is very high as compared to LMC but the same is not true when absence from all the meetings are considered. In the category of attendance, in more than 50% Board meetings, companies with high market capitalization is far ahead. 3 Analysis of Corporate Governance Practice 3.1 Report on Company having below average market capitalization Shareholding Pattern
Figure CG L 1.1. Shareholding – Promoter
In 18% companies, promoters holding is greater than 10%, in 32% companies, promoters holding is greater than 25%, in twenty companies, i.e. 22%, promoters holding is greater than 50%. It transpires that promoters have very significant presence in the LMC.
0
100
200
300
400
500
600
All <50% 50% > 50% None
Corporate B oard: R ole, D uties & Com position / V olum e 9 , Issue 1 , 2013
63
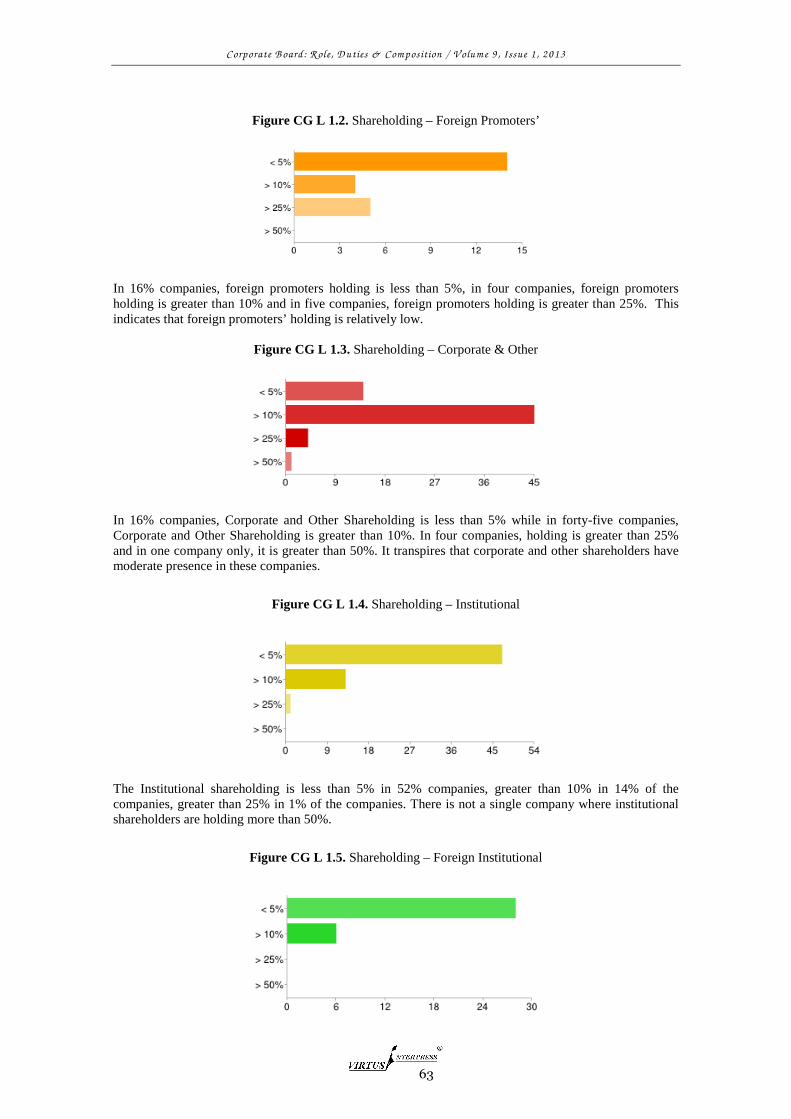
Figure CG L 1.2. Shareholding – Foreign Promoters’
In 16% companies, foreign promoters holding is less than 5%, in four companies, foreign promoters holding is greater than 10% and in five companies, foreign promoters holding is greater than 25%. This indicates that foreign promoters’ holding is relatively low.
Figure CG L 1.3. Shareholding – Corporate & Other
In 16% companies, Corporate and Other Shareholding is less than 5% while in forty-five companies, Corporate and Other Shareholding is greater than 10%. In four companies, holding is greater than 25% and in one company only, it is greater than 50%. It transpires that corporate and other shareholders have moderate presence in these companies.
Figure CG L 1.4. Shareholding – Institutional
The Institutional shareholding is less than 5% in 52% companies, greater than 10% in 14% of the companies, greater than 25% in 1% of the companies. There is not a single company where institutional shareholders are holding more than 50%.
Figure CG L 1.5. Shareholding – Foreign Institutional
Corporate B oard: R ole, D uties & Com position / V olum e 9 , Issue 1 , 2013
64
As may be seen above, in 31% companies, foreign institutional shareholding is less than 5%, in 7% companies, foreign institutional shareholding is greater than 10%. There is no company with more than 26% foreign institutional shareholding.
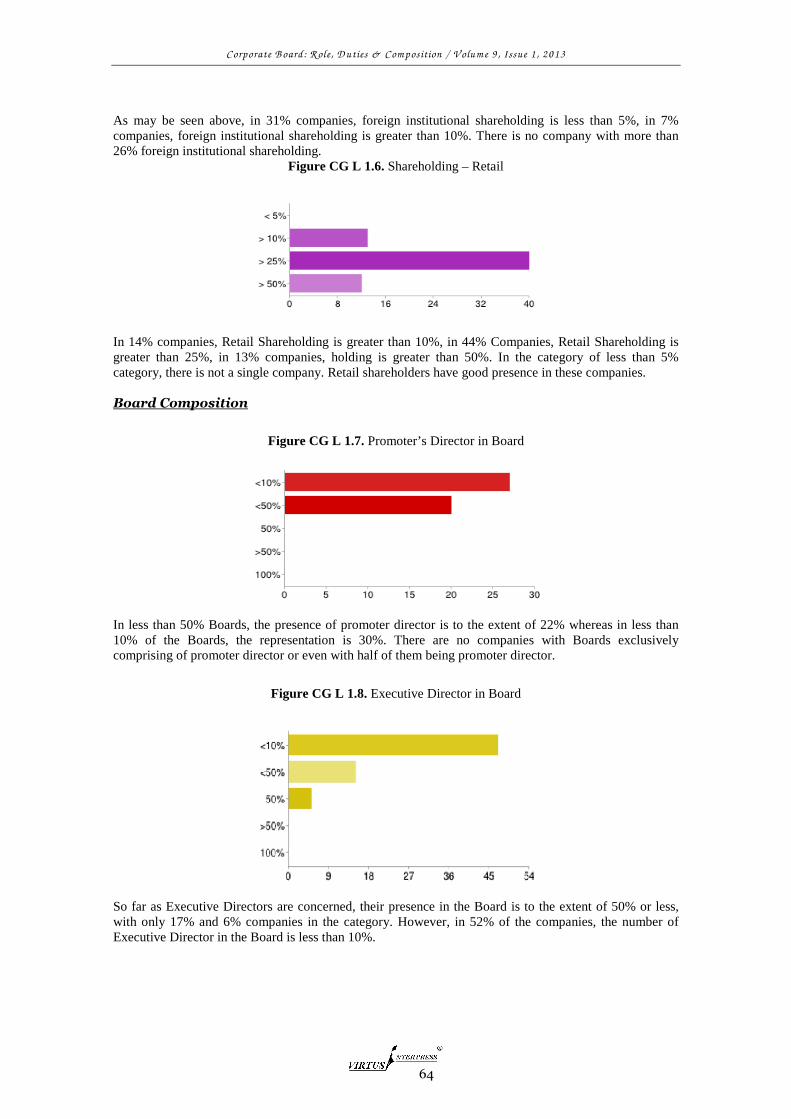
Figure CG L 1.6. Shareholding – Retail
In 14% companies, Retail Shareholding is greater than 10%, in 44% Companies, Retail Shareholding is greater than 25%, in 13% companies, holding is greater than 50%. In the category of less than 5% category, there is not a single company. Retail shareholders have good presence in these companies. Board Composition
Figure CG L 1.7. Promoter’s Director in Board
In less than 50% Boards, the presence of promoter director is to the extent of 22% whereas in less than 10% of the Boards, the representation is 30%. There are no companies with Boards exclusively comprising of promoter director or even with half of them being promoter director.
Figure CG L 1.8. Executive Director in Board
So far as Executive Directors are concerned, their presence in the Board is to the extent of 50% or less, with only 17% and 6% companies in the category. However, in 52% of the companies, the number of Executive Director in the Board is less than 10%.
Corporate B oard: R ole, D uties & Com position / V olum e 9 , Issue 1 , 2013
65
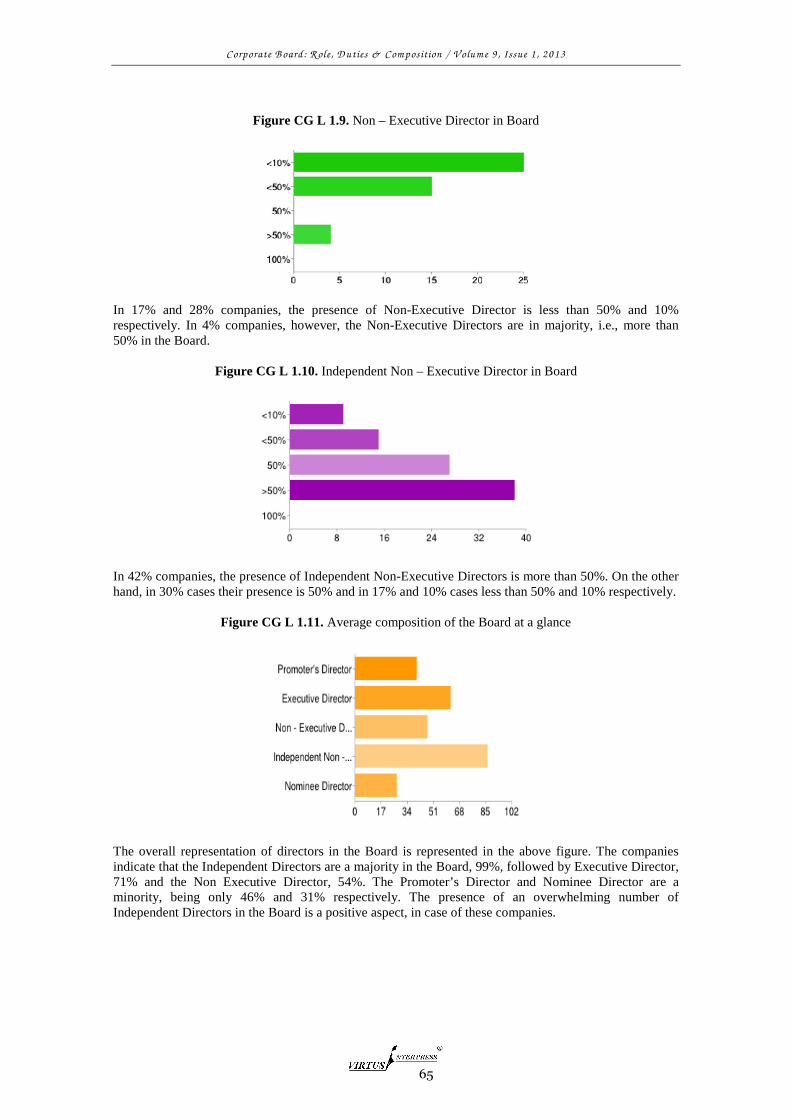
Figure CG L 1.9. Non – Executive Director in Board
In 17% and 28% companies, the presence of Non-Executive Director is less than 50% and 10% respectively. In 4% companies, however, the Non-Executive Directors are in majority, i.e., more than 50% in the Board.
Figure CG L 1.10. Independent Non – Executive Director in Board
In 42% companies, the presence of Independent Non-Executive Directors is more than 50%. On the other hand, in 30% cases their presence is 50% and in 17% and 10% cases less than 50% and 10% respectively.
Figure CG L 1.11. Average composition of the Board at a glance
The overall representation of directors in the Board is represented in the above figure. The companies indicate that the Independent Directors are a majority in the Board, 99%, followed by Executive Director, 71% and the Non Executive Director, 54%. The Promoter’s Director and Nominee Director are a minority, being only 46% and 31% respectively. The presence of an overwhelming number of Independent Directors in the Board is a positive aspect, in case of these companies.

Corporate B oard: R ole, D
Figure CG L 1.12.
The number of Board meetings is generally four in a given year, though in some companies, it extends to even seven for a year (39%). Very few companies, just 1%, have more tha Different Committees in the Board
Figure CG L 1.13.
As per Listing Agreement, Clause 49 (See Appendix A), all the companies are supposed to have Audit Committee, Remuneration Committee and Shareholder Grieis there in almost all the companies, but Remuneration and Shareholder Grievance Committee is present in 82% and 83% companies respectively. Risk Management Committee is only in one company. In 24% companies, there are other committees like research and development committee, share transfer committee and executive committee. But the composition and function of these committees have not been illustrated in the report.
Figure CG L 1.14.
As per Clause 49 of Listing Agreement, Independent Non Audit Committee, which is complied in 97% cases. But in 2% and 1% cases, it has been seen that the Non - Executive Director and Executive Director are headi
4
5 to 7
8 to 10
>10
Corporate B oard: R ole, D uties & Com position / V olum e 9 , Issue 1 , 2013
66
Figure CG L 1.12. Frequency of Board Meetings
The number of Board meetings is generally four in a given year, though in some companies, it extends to even seven for a year (39%). Very few companies, just 1%, have more than 12 meetings.
Different Committees in the Board
Figure CG L 1.13. Different Committees in Board
As per Listing Agreement, Clause 49 (See Appendix A), all the companies are supposed to have Audit Committee, Remuneration Committee and Shareholder Grievance Committee. Though Audit Committee is there in almost all the companies, but Remuneration and Shareholder Grievance Committee is present in 82% and 83% companies respectively. Risk Management Committee is only in one company. In 24%
re other committees like research and development committee, share transfer committee and executive committee. But the composition and function of these committees have not been
Figure CG L 1.14. Chairman of Audit Committee
As per Clause 49 of Listing Agreement, Independent Non - Executive Director is supposed to head the Audit Committee, which is complied in 97% cases. But in 2% and 1% cases, it has been seen that the Non
Executive Director and Executive Director are heading the committees.
0 20 40 60
The number of Board meetings is generally four in a given year, though in some companies, it extends to n 12 meetings.
As per Listing Agreement, Clause 49 (See Appendix A), all the companies are supposed to have Audit vance Committee. Though Audit Committee
is there in almost all the companies, but Remuneration and Shareholder Grievance Committee is present in 82% and 83% companies respectively. Risk Management Committee is only in one company. In 24%
re other committees like research and development committee, share transfer committee and executive committee. But the composition and function of these committees have not been
Executive Director is supposed to head the Audit Committee, which is complied in 97% cases. But in 2% and 1% cases, it has been seen that the Non

Corporate B oard: R ole, D
Figure CG L 1.15.
As per Clause 49 of Listing Agreement, Remuneration Committee is to be headed by Independent Non Executive Director and the same has been complied with in 84% cases. But in 2% coCEO/MD, i.e. Executive Directors, are heading the committee. Here the percentage of compliance is slightly less than audit committee.
Figure CG L 1.16.
As per Clause 49 of Listing Agreement, ShaIndependent Non - Executive Director. The same is true for only 66% of the companies. In 11% and 9% cases, the Non - Executive Director and Executive Director heads the committee.
Figure CG L 1.17.
The Risk management committee is not common to all the companies. Only few companies have them. In the present study, only 2 companies have such Committee and they are headed by Independent Non Executive Directors.
Corporate B oard: R ole, D uties & Com position / V olum e 9 , Issue 1 , 2013
67
Figure CG L 1.15. Chairman of Remuneration Committee
As per Clause 49 of Listing Agreement, Remuneration Committee is to be headed by Independent Non Executive Director and the same has been complied with in 84% cases. But in 2% coCEO/MD, i.e. Executive Directors, are heading the committee. Here the percentage of compliance is slightly less than audit committee.
Figure CG L 1.16. Chairman of Shareholder Grievance Committee
As per Clause 49 of Listing Agreement, Shareholder Grievance Committee is to be headed by Executive Director. The same is true for only 66% of the companies. In 11% and 9%
Executive Director and Executive Director heads the committee.
Figure CG L 1.17. Chairman of Risk Management Committee
The Risk management committee is not common to all the companies. Only few companies have them. In the present study, only 2 companies have such Committee and they are headed by Independent Non
As per Clause 49 of Listing Agreement, Remuneration Committee is to be headed by Independent Non - Executive Director and the same has been complied with in 84% cases. But in 2% companies, the CEO/MD, i.e. Executive Directors, are heading the committee. Here the percentage of compliance is
Chairman of Shareholder Grievance Committee
reholder Grievance Committee is to be headed by Executive Director. The same is true for only 66% of the companies. In 11% and 9%
The Risk management committee is not common to all the companies. Only few companies have them. In the present study, only 2 companies have such Committee and they are headed by Independent Non -
Corporate B oard: R ole, D
Figure CG L 1.18.
The Compensation Committee is headed by Independent Non one case only, the CEO/MD heads the committee. Disclosure by the Company
Figure CG L 1.19.
Disclosure is the cornerstone of Corporate Governance practice. It is indicative of better practice. Disclosure by the company is sacrosanct for the outsiders, as they have no alternative means to collect information about the company. They rely on disclosure for the purposes of investment in the company. In 99% cases ‘Related Party Transaction’, in 67% cases ‘Remuneration of Directors’ and in 28% cases ‘Management Discussion and Analysis’ have been disclosed. DisclosureMechanism’, ‘Accounting Treatment’, ‘Brief Resume of Directors’ and other information is available in less than 20% cases. There are no disclosures available regarding Employee Welfare Scheme, Business Human Right Policy, Environmental Policy and Protection of Stakeholder. Disclosures by the companies do not seem satisfactory.
Figure CG L 1.20.
Corporate B oard: R ole, D uties & Com position / V olum e 9 , Issue 1 , 2013
68
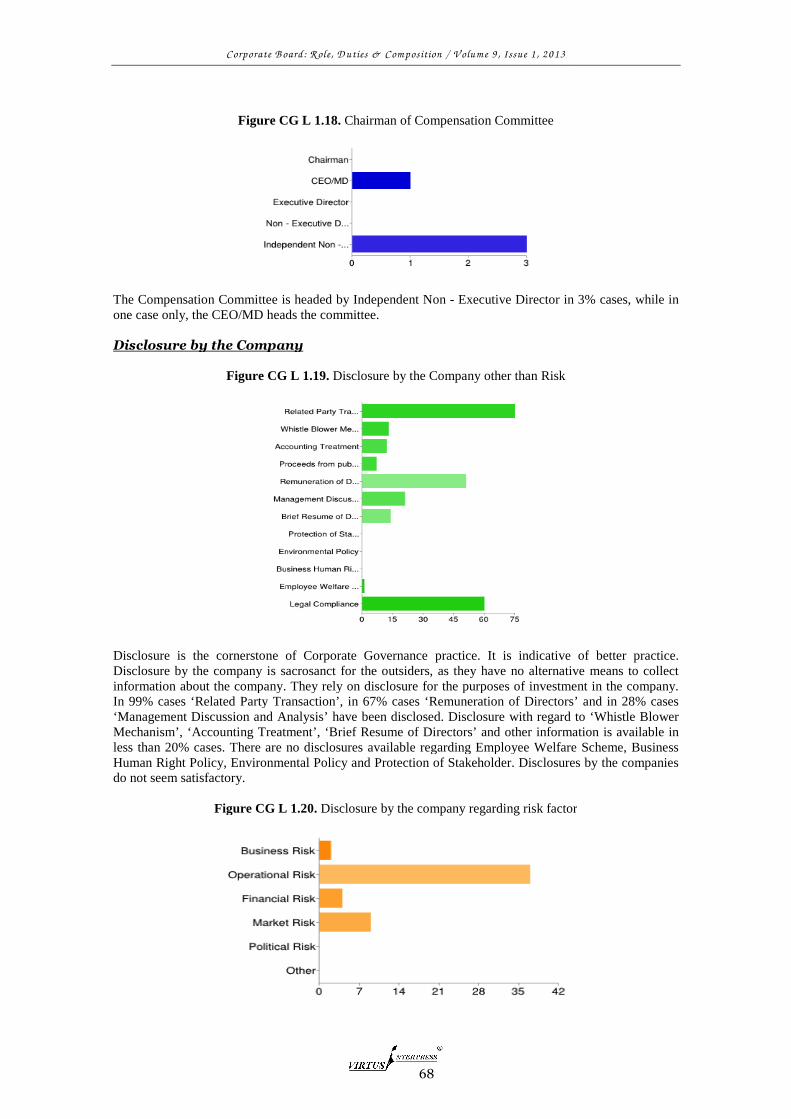
ure CG L 1.18. Chairman of Compensation Committee
The Compensation Committee is headed by Independent Non - Executive Director in 3% cases, while in one case only, the CEO/MD heads the committee.
Disclosure by the Company
Figure CG L 1.19. Disclosure by the Company other than Risk
Disclosure is the cornerstone of Corporate Governance practice. It is indicative of better practice. Disclosure by the company is sacrosanct for the outsiders, as they have no alternative means to collect
ut the company. They rely on disclosure for the purposes of investment in the company. In 99% cases ‘Related Party Transaction’, in 67% cases ‘Remuneration of Directors’ and in 28% cases ‘Management Discussion and Analysis’ have been disclosed. Disclosure with regard to ‘Whistle Blower Mechanism’, ‘Accounting Treatment’, ‘Brief Resume of Directors’ and other information is available in less than 20% cases. There are no disclosures available regarding Employee Welfare Scheme, Business
vironmental Policy and Protection of Stakeholder. Disclosures by the companies
Figure CG L 1.20. Disclosure by the company regarding risk factor
Executive Director in 3% cases, while in
Disclosure is the cornerstone of Corporate Governance practice. It is indicative of better practice. Disclosure by the company is sacrosanct for the outsiders, as they have no alternative means to collect
ut the company. They rely on disclosure for the purposes of investment in the company. In 99% cases ‘Related Party Transaction’, in 67% cases ‘Remuneration of Directors’ and in 28% cases
with regard to ‘Whistle Blower Mechanism’, ‘Accounting Treatment’, ‘Brief Resume of Directors’ and other information is available in less than 20% cases. There are no disclosures available regarding Employee Welfare Scheme, Business
vironmental Policy and Protection of Stakeholder. Disclosures by the companies
Disclosure by the company regarding risk factor

Corporate B oard: R ole, D
So far as risk factors are concerned, the analysis reveals that such disclosuresrisks (80% companies), Market risks (20% companies), Financial risks (9 % companies) and Business Risk (4%). Political risk does not seem to have found mention in any of the companies’ reports.
Figure CG L 1.21.
The presence of ethical code is good with almost 71% companies formulating its own ethical code. However, in 29% cases, no such code exists. 3.2 Report on Company having above average market capitalization
Figure CG H 1.1.
In 3% companies, promoters holding is less than 5%; in 6% companies, it is greater than 10%; in nineteen companies, 21%, promoters holding is greater than 25% while in 56 companies, 62%, promoters’ holding is greater than 50%. It is clear that in majority of cases, promoters are holding more than 50% shares and naturally, they are in a controlling position in these companies.
Figure CG H 1.2.
In 83% companies, foreign promoters holding are the same is more than 10% and more than 25% respectively.
Corporate B oard: R ole, D uties & Com position / V olum e 9 , Issue 1 , 2013
69
So far as risk factors are concerned, the analysis reveals that such disclosures mainly relate to operational risks (80% companies), Market risks (20% companies), Financial risks (9 % companies) and Business Risk (4%). Political risk does not seem to have found mention in any of the companies’ reports.
Figure CG L 1.21. Ethical Code formulated by Companies
The presence of ethical code is good with almost 71% companies formulating its own ethical code. However, in 29% cases, no such code exists.
3.2 Report on Company having above average market capitalization
Figure CG H 1.1. Shareholding – Promoter
In 3% companies, promoters holding is less than 5%; in 6% companies, it is greater than 10%; in nineteen companies, 21%, promoters holding is greater than 25% while in 56 companies, 62%, promoters’ holding
is clear that in majority of cases, promoters are holding more than 50% shares and naturally, they are in a controlling position in these companies.
Figure CG H 1.2. Shareholding – Foreign Promoters’
In 83% companies, foreign promoters holding are less than 5%. In only 3% companies and 1% company, the same is more than 10% and more than 25% respectively.
mainly relate to operational risks (80% companies), Market risks (20% companies), Financial risks (9 % companies) and Business Risk (4%). Political risk does not seem to have found mention in any of the companies’ reports.
The presence of ethical code is good with almost 71% companies formulating its own ethical code.
3.2 Report on Company having above average market capitalization
In 3% companies, promoters holding is less than 5%; in 6% companies, it is greater than 10%; in nineteen companies, 21%, promoters holding is greater than 25% while in 56 companies, 62%, promoters’ holding
is clear that in majority of cases, promoters are holding more than 50% shares and
less than 5%. In only 3% companies and 1% company,
Corporate B oard: R ole, D
Figure CG H 1.3.
In 63% companies, corporate and other shareholding is less than 5% while in 24% companies, and other shareholding is greater than 10%. Corporate shareholding is not significant in the Indian context.
Figure CG H 1.4.
As seen above, 82% of the companies have Institutional shareholding of less than 5% ancompanies have institutional shareholding of more than 25%. Institutional shareholder is mostly limited to 5% and is relatively less.
Figure CG H1.5.
Foreign institutional shareholding is less than 5%and greater than 25% in 32% companies.
Corporate B oard: R ole, D uties & Com position / V olum e 9 , Issue 1 , 2013
70
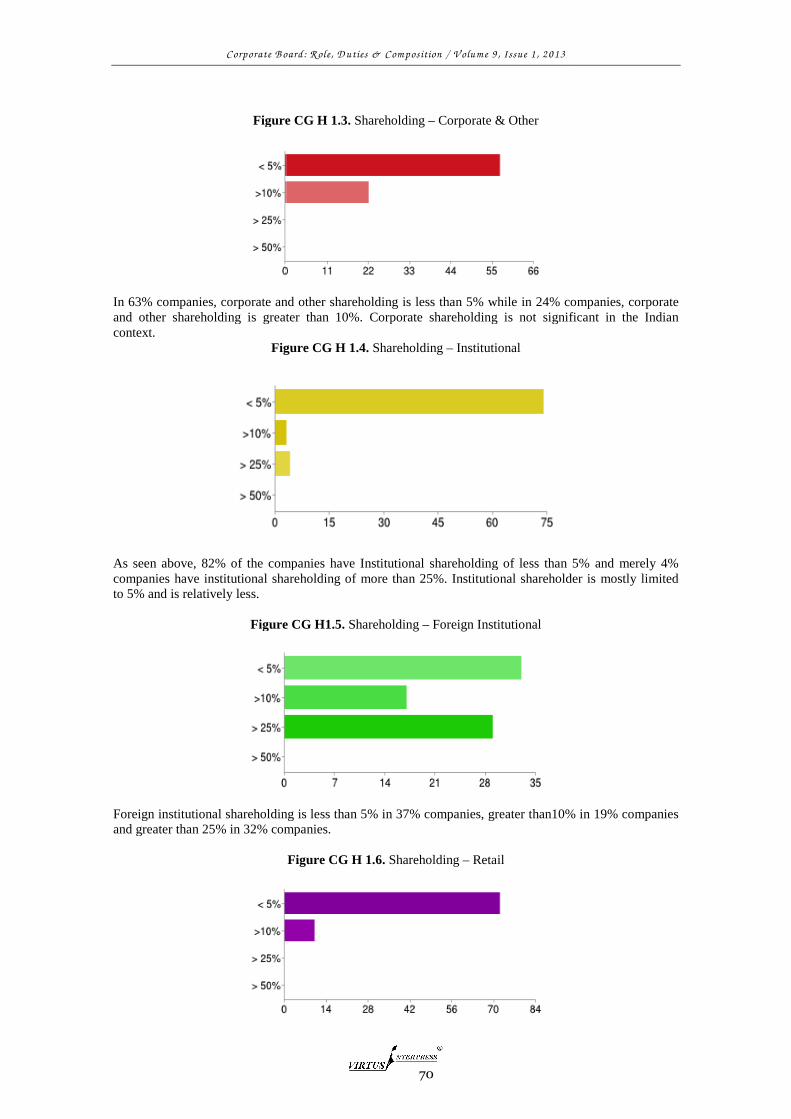
Figure CG H 1.3. Shareholding – Corporate & Other
In 63% companies, corporate and other shareholding is less than 5% while in 24% companies, and other shareholding is greater than 10%. Corporate shareholding is not significant in the Indian
Figure CG H 1.4. Shareholding – Institutional
As seen above, 82% of the companies have Institutional shareholding of less than 5% ancompanies have institutional shareholding of more than 25%. Institutional shareholder is mostly limited
Figure CG H1.5. Shareholding – Foreign Institutional
Foreign institutional shareholding is less than 5% in 37% companies, greater than10% in 19% companies and greater than 25% in 32% companies.
Figure CG H 1.6. Shareholding – Retail
In 63% companies, corporate and other shareholding is less than 5% while in 24% companies, corporate and other shareholding is greater than 10%. Corporate shareholding is not significant in the Indian
As seen above, 82% of the companies have Institutional shareholding of less than 5% and merely 4% companies have institutional shareholding of more than 25%. Institutional shareholder is mostly limited
in 37% companies, greater than10% in 19% companies

Corporate B oard: R ole, D
So far as retail shareholding is concerned, about 80% of the companies have less than 5 %, while 11% of the companies have more than 10%. There are no companies with more than 25% retail shareholding. Board Composition
Figure CG H 1.7.
The presence of Promoter’s Director in the Board is not very prominent, with 54% companies having less than 10% such directors and another 20% companies having less than 50% such directors. In 4% cases only, they dominate the Board, i.e., they are in majority with more than 50% such directors.
Figure CG H 1.8.
In 9% cases, Executive Directors are more than 50% in the Board and 50% respectively. In 50% cases, they are less than 50% and in 8% cases, they are less than 10%. Executive Directors are in good number in the Board.
Figure CG H 1.9.
In 40% cases, the Non-Executive Directors dominate the Board with 50% such directors. In 10% cases, they are constitute half of the Board members and in 11% and 4% cases, they are less than 50% and less than 10% respectively. Non-executive directors have vcompanies.
Corporate B oard: R ole, D uties & Com position / V olum e 9 , Issue 1 , 2013
71
So far as retail shareholding is concerned, about 80% of the companies have less than 5 %, while 11% of e more than 10%. There are no companies with more than 25% retail shareholding.
Figure CG H 1.7. Promoter’s Director in Board
The presence of Promoter’s Director in the Board is not very prominent, with 54% companies having less 10% such directors and another 20% companies having less than 50% such directors. In 4% cases
only, they dominate the Board, i.e., they are in majority with more than 50% such directors.
Figure CG H 1.8. Executive Director in Board
utive Directors are more than 50% in the Board and 50% respectively. In 50% cases, they are less than 50% and in 8% cases, they are less than 10%. Executive Directors are in good number
Figure CG H 1.9. Non – Executive Director in Board
Executive Directors dominate the Board with 50% such directors. In 10% cases, they are constitute half of the Board members and in 11% and 4% cases, they are less than 50% and less
executive directors have very good presence in the Board of these
So far as retail shareholding is concerned, about 80% of the companies have less than 5 %, while 11% of e more than 10%. There are no companies with more than 25% retail shareholding.
The presence of Promoter’s Director in the Board is not very prominent, with 54% companies having less 10% such directors and another 20% companies having less than 50% such directors. In 4% cases
only, they dominate the Board, i.e., they are in majority with more than 50% such directors.
utive Directors are more than 50% in the Board and 50% respectively. In 50% cases, they are less than 50% and in 8% cases, they are less than 10%. Executive Directors are in good number
Executive Directors dominate the Board with 50% such directors. In 10% cases, they are constitute half of the Board members and in 11% and 4% cases, they are less than 50% and less
ery good presence in the Board of these
Corporate B oard: R ole, D
Figure CG H 1.10.
As seen in the figure above, in 24% companies, Independent Directors constitute more than and less than 50%. Near about 29% companies Independent Director is quite high.
Figure CG H 1.11.
The composition of the Boards in HMC is as follows: Independent Director in 81 coDirector in 72 companies, Non-Executive Director in 70 companies, Executive Director in 68 companies and Nominee Director in 15 companies. Independent directors have the highest presence. Except Nominee Director, other types of directodifference with other category is very marginal.
Figure CG H 1.12.
The number of meeting in these companies is very impressive with 49% companies having 5 to 7 meetinin a year and another 26% companies having 8 to 10 meetings.
5 to 7
8 to 10
>10
Corporate B oard: R ole, D uties & Com position / V olum e 9 , Issue 1 , 2013
72
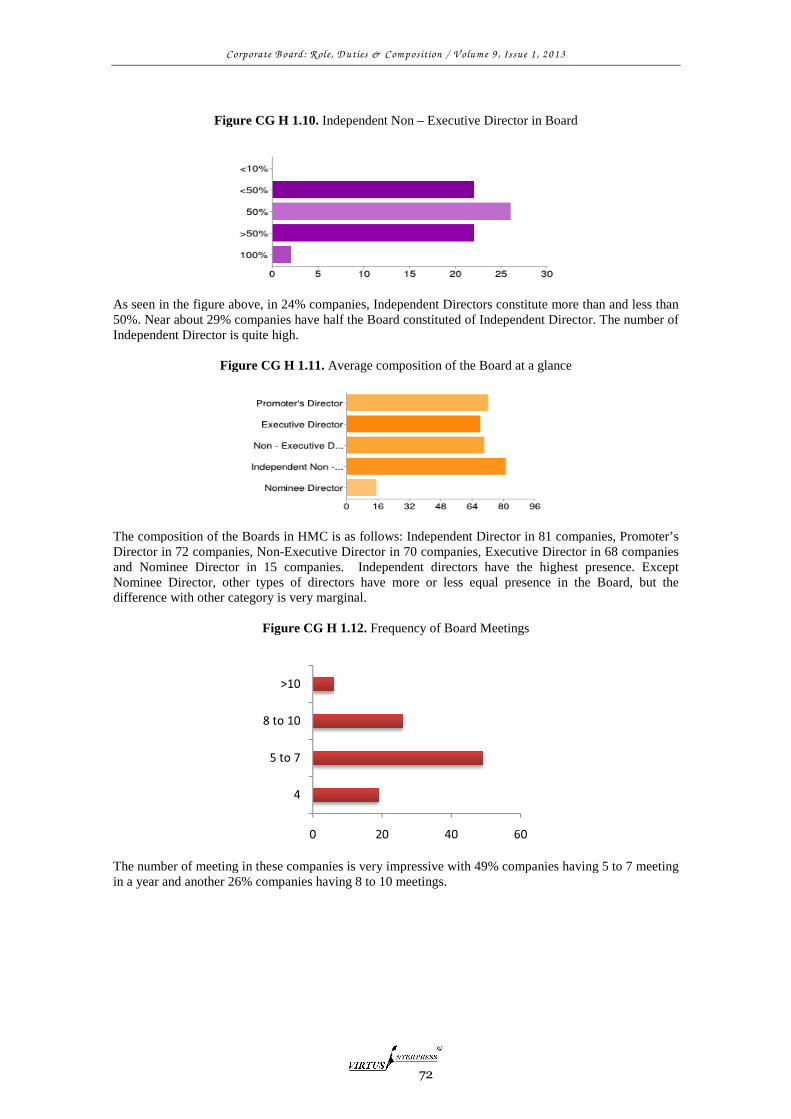
Figure CG H 1.10. Independent Non – Executive Director in Board
As seen in the figure above, in 24% companies, Independent Directors constitute more than and less than 50%. Near about 29% companies have half the Board constituted of Independent Director. The number of Independent Director is quite high.
Figure CG H 1.11. Average composition of the Board at a glance
The composition of the Boards in HMC is as follows: Independent Director in 81 companies, Promoter’s Executive Director in 70 companies, Executive Director in 68 companies
and Nominee Director in 15 companies. Independent directors have the highest presence. Except Nominee Director, other types of directors have more or less equal presence in the Board, but the difference with other category is very marginal.
Figure CG H 1.12. Frequency of Board Meetings
The number of meeting in these companies is very impressive with 49% companies having 5 to 7 meetinin a year and another 26% companies having 8 to 10 meetings.
0 20 40 60
4
5 to 7
8 to 10
>10
Executive Director in Board
As seen in the figure above, in 24% companies, Independent Directors constitute more than and less than have half the Board constituted of Independent Director. The number of
mpanies, Promoter’s Executive Director in 70 companies, Executive Director in 68 companies
and Nominee Director in 15 companies. Independent directors have the highest presence. Except rs have more or less equal presence in the Board, but the
The number of meeting in these companies is very impressive with 49% companies having 5 to 7 meeting
Corporate B oard: R ole, D
Different Committees in the Board
Figure CG H 1.13.
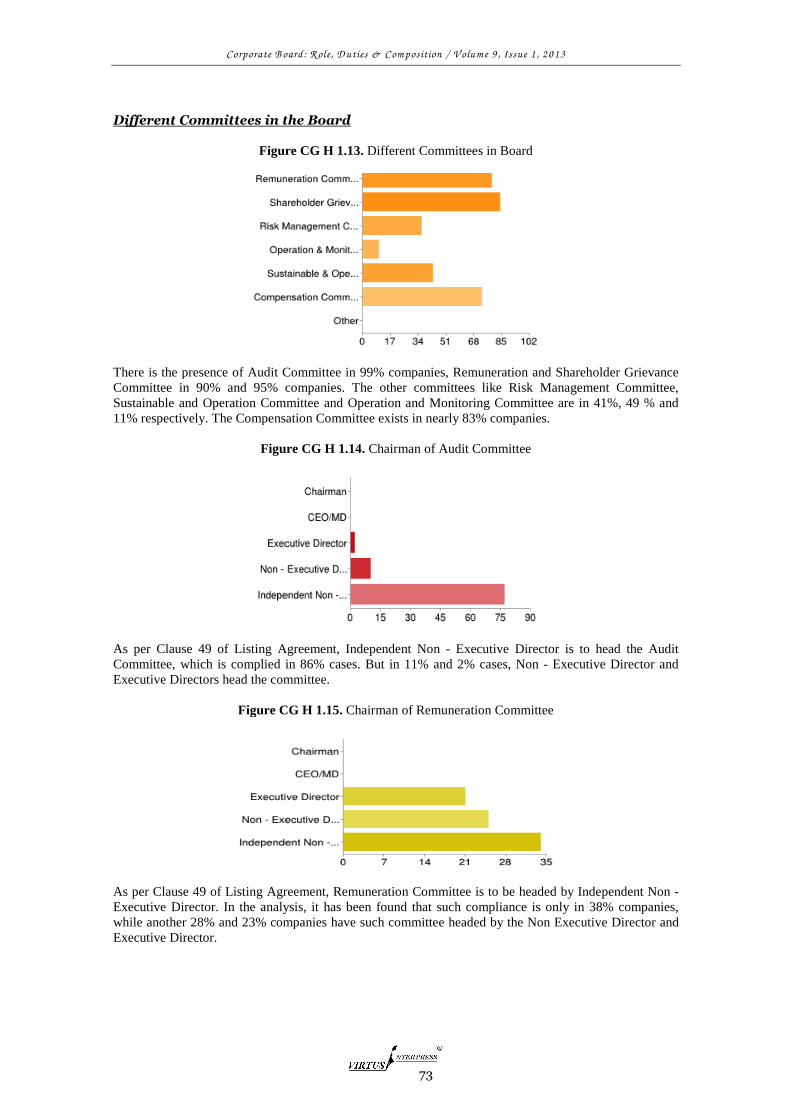
There is the presence of Audit Committee in 99% companies, Remuneration and Shareholder Grievance Committee in 90% and 95% companies. The other committees like Risk Management Committee, Sustainable and Operation Committee and Operation and Monitoring Committee are in 41%, 49 % and 11% respectively. The Compensation Committee exists in nearly 83% companies.
Figure CG H 1.14.
As per Clause 49 of Listing Agreement, Independent Non Committee, which is complied in 86% cases. But in 11% and 2% cases, Non Executive Directors head the committee.
Figure CG H 1.15.
As per Clause 49 of Listing Agreement, Remuneration Committee is to be headed by Independent Non Executive Director. In the analysis, it has been found that such complwhile another 28% and 23% companies have such committee headed by the Non Executive Director and Executive Director.
Corporate B oard: R ole, D uties & Com position / V olum e 9 , Issue 1 , 2013
73
Different Committees in the Board
Figure CG H 1.13. Different Committees in Board
There is the presence of Audit Committee in 99% companies, Remuneration and Shareholder Grievance tee in 90% and 95% companies. The other committees like Risk Management Committee,
Sustainable and Operation Committee and Operation and Monitoring Committee are in 41%, 49 % and 11% respectively. The Compensation Committee exists in nearly 83% companies.
Figure CG H 1.14. Chairman of Audit Committee
As per Clause 49 of Listing Agreement, Independent Non - Executive Director is to head the Audit Committee, which is complied in 86% cases. But in 11% and 2% cases, Non - Executive Director and
irectors head the committee.
Figure CG H 1.15. Chairman of Remuneration Committee
As per Clause 49 of Listing Agreement, Remuneration Committee is to be headed by Independent Non Executive Director. In the analysis, it has been found that such compliance is only in 38% companies, while another 28% and 23% companies have such committee headed by the Non Executive Director and
There is the presence of Audit Committee in 99% companies, Remuneration and Shareholder Grievance tee in 90% and 95% companies. The other committees like Risk Management Committee,
Sustainable and Operation Committee and Operation and Monitoring Committee are in 41%, 49 % and
Executive Director is to head the Audit Executive Director and
As per Clause 49 of Listing Agreement, Remuneration Committee is to be headed by Independent Non - iance is only in 38% companies,
while another 28% and 23% companies have such committee headed by the Non Executive Director and
Corporate B oard: R ole, D
Figure CG H 1.16.
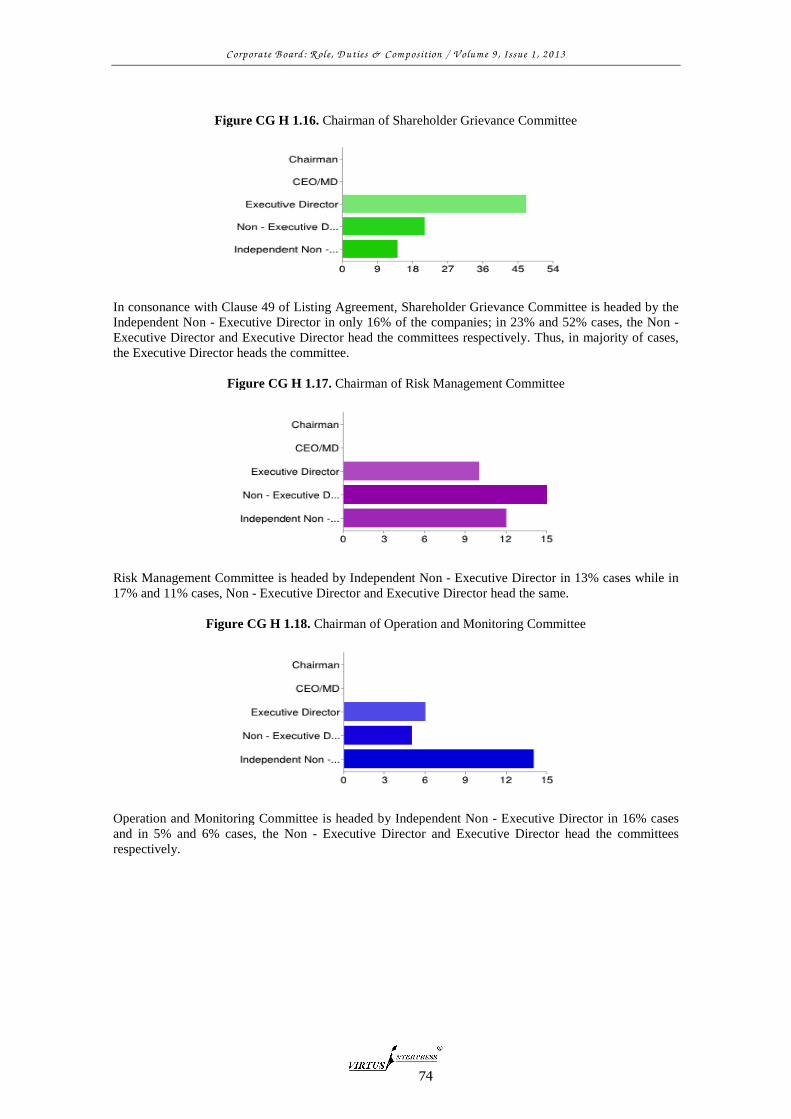
In consonance with Clause 49 of ListinIndependent Non - Executive Director in only 16% of the companies; in 23% and 52% cases, the Non Executive Director and Executive Director head the committees respectively. Thus, in majority othe Executive Director heads the committee.
Figure CG H 1.17.
Risk Management Committee is headed by Independent Non 17% and 11% cases, Non - Executive Director
Figure CG H 1.18.
Operation and Monitoring Committee is headed by Independent Non and in 5% and 6% cases, the Non respectively.
Corporate B oard: R ole, D uties & Com position / V olum e 9 , Issue 1 , 2013
74
Figure CG H 1.16. Chairman of Shareholder Grievance Committee
In consonance with Clause 49 of Listing Agreement, Shareholder Grievance Committee is headed by the Executive Director in only 16% of the companies; in 23% and 52% cases, the Non
Executive Director and Executive Director head the committees respectively. Thus, in majority othe Executive Director heads the committee.
Figure CG H 1.17. Chairman of Risk Management Committee
Risk Management Committee is headed by Independent Non - Executive Director in 13% cases while in Executive Director and Executive Director head the same.
Figure CG H 1.18. Chairman of Operation and Monitoring Committee
Operation and Monitoring Committee is headed by Independent Non - Executive Director in 16% cases and in 5% and 6% cases, the Non - Executive Director and Executive Director head the committees
Chairman of Shareholder Grievance Committee
g Agreement, Shareholder Grievance Committee is headed by the Executive Director in only 16% of the companies; in 23% and 52% cases, the Non -
Executive Director and Executive Director head the committees respectively. Thus, in majority of cases,
Executive Director in 13% cases while in and Executive Director head the same.
Chairman of Operation and Monitoring Committee
Executive Director in 16% cases tor and Executive Director head the committees

Corporate B oard: R ole, D
Figure CG H 1.19.
As per Clause 49 of Listing Agreement, Sustainable and Environmental Committee is to be headed by Independent Non - Executive Director and that is complied in 27% cases. But in 14% and 17% cases, the Non - Executive Director and Executive Director is heading it respectively.
Figure CG H 1.20.
The Compensation Committee in headed by 42%, while in other cases, it is generally headed by the Executive Director, 20%, and Non Executive Director, 16%. Disclosure by the Company
Figure CG H 1.21.
The importance of disclosure by companies cannot be understated. The companies in above average market capitalization category have impressive disclosure patterns. Related Party Transaction is disclosed
Corporate B oard: R ole, D uties & Com position / V olum e 9 , Issue 1 , 2013
75
Figure CG H 1.19. Chairman of Sustainable and Environmental Committee
As per Clause 49 of Listing Agreement, Sustainable and Environmental Committee is to be headed by ecutive Director and that is complied in 27% cases. But in 14% and 17% cases, the
Executive Director and Executive Director is heading it respectively.
Figure CG H 1.20. Chairman of Compensation Committee
The Compensation Committee in headed by the Independent Non- Executive Director in 38 companies, 42%, while in other cases, it is generally headed by the Executive Director, 20%, and Non Executive
Disclosure by the Company
Figure CG H 1.21. Disclosure by the Company other than Risk
The importance of disclosure by companies cannot be understated. The companies in above average market capitalization category have impressive disclosure patterns. Related Party Transaction is disclosed
Chairman of Sustainable and Environmental Committee
As per Clause 49 of Listing Agreement, Sustainable and Environmental Committee is to be headed by ecutive Director and that is complied in 27% cases. But in 14% and 17% cases, the
Executive Director in 38 companies, 42%, while in other cases, it is generally headed by the Executive Director, 20%, and Non Executive
The importance of disclosure by companies cannot be understated. The companies in above average market capitalization category have impressive disclosure patterns. Related Party Transaction is disclosed
Corporate B oard: R ole, D
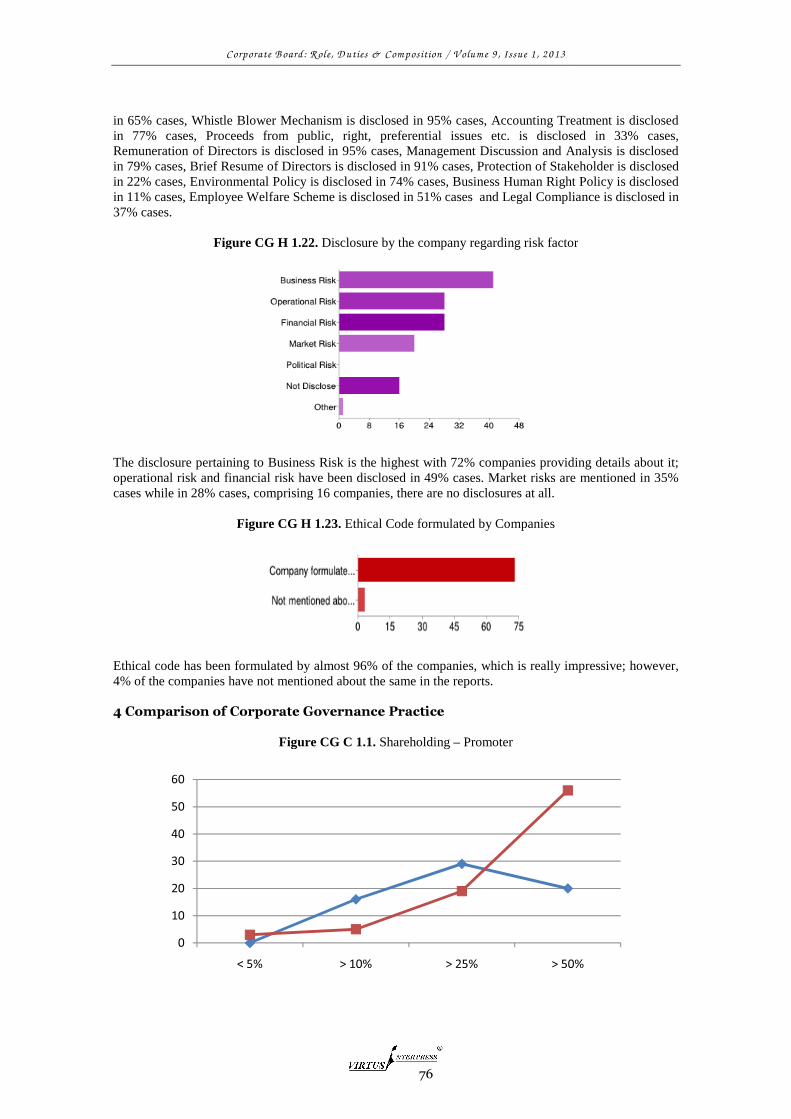
in 65% cases, Whistle Blower Mechanism is diin 77% cases, Proceeds from public, right, preferential issues etc. is disclosed in 33% cases, Remuneration of Directors is disclosed in 95% cases, Management Discussion and Analysis is disclosed in 79% cases, Brief Resume of Directors is disclosed in 91% cases, Protection of Stakeholder is disclosed in 22% cases, Environmental Policy is disclosed in 74% cases, Business Human Right Policy is disclosed in 11% cases, Employee Welfare Scheme is disclosed 37% cases.
Figure CG H 1.22.
The disclosure pertaining to Business Risk is the highest with 72% companies providing details about it; operational risk and financial risk have been disclosed in 49% cases. Market risks are mentioned in 35% cases while in 28% cases, comprising 16 companies, there are no disclosures at all.
Figure CG H 1.23.
Ethical code has been formulated by almost 96% of the companies, which is really impressive; however, 4% of the companies have not mentioned about the same in the reports. 4 Comparison of Corporate Governance Practice
Figure CG C 1.1.
0
10
20
30
40
50
60
< 5%
Corporate B oard: R ole, D uties & Com position / V olum e 9 , Issue 1 , 2013
76
in 65% cases, Whistle Blower Mechanism is disclosed in 95% cases, Accounting Treatment is disclosed in 77% cases, Proceeds from public, right, preferential issues etc. is disclosed in 33% cases, Remuneration of Directors is disclosed in 95% cases, Management Discussion and Analysis is disclosed
9% cases, Brief Resume of Directors is disclosed in 91% cases, Protection of Stakeholder is disclosed in 22% cases, Environmental Policy is disclosed in 74% cases, Business Human Right Policy is disclosed in 11% cases, Employee Welfare Scheme is disclosed in 51% cases and Legal Compliance is disclosed in
Figure CG H 1.22. Disclosure by the company regarding risk factor
The disclosure pertaining to Business Risk is the highest with 72% companies providing details about it; and financial risk have been disclosed in 49% cases. Market risks are mentioned in 35%
cases while in 28% cases, comprising 16 companies, there are no disclosures at all.
Figure CG H 1.23. Ethical Code formulated by Companies
mulated by almost 96% of the companies, which is really impressive; however, 4% of the companies have not mentioned about the same in the reports.
4 Comparison of Corporate Governance Practice
Figure CG C 1.1. Shareholding – Promoter
> 10% > 25% > 50%
sclosed in 95% cases, Accounting Treatment is disclosed in 77% cases, Proceeds from public, right, preferential issues etc. is disclosed in 33% cases, Remuneration of Directors is disclosed in 95% cases, Management Discussion and Analysis is disclosed
9% cases, Brief Resume of Directors is disclosed in 91% cases, Protection of Stakeholder is disclosed in 22% cases, Environmental Policy is disclosed in 74% cases, Business Human Right Policy is disclosed
in 51% cases and Legal Compliance is disclosed in
Disclosure by the company regarding risk factor
The disclosure pertaining to Business Risk is the highest with 72% companies providing details about it; and financial risk have been disclosed in 49% cases. Market risks are mentioned in 35%
mulated by almost 96% of the companies, which is really impressive; however,
> 50%
Corporate B oard: R ole, D uties & Com position / V olum e 9 , Issue 1 , 2013
77
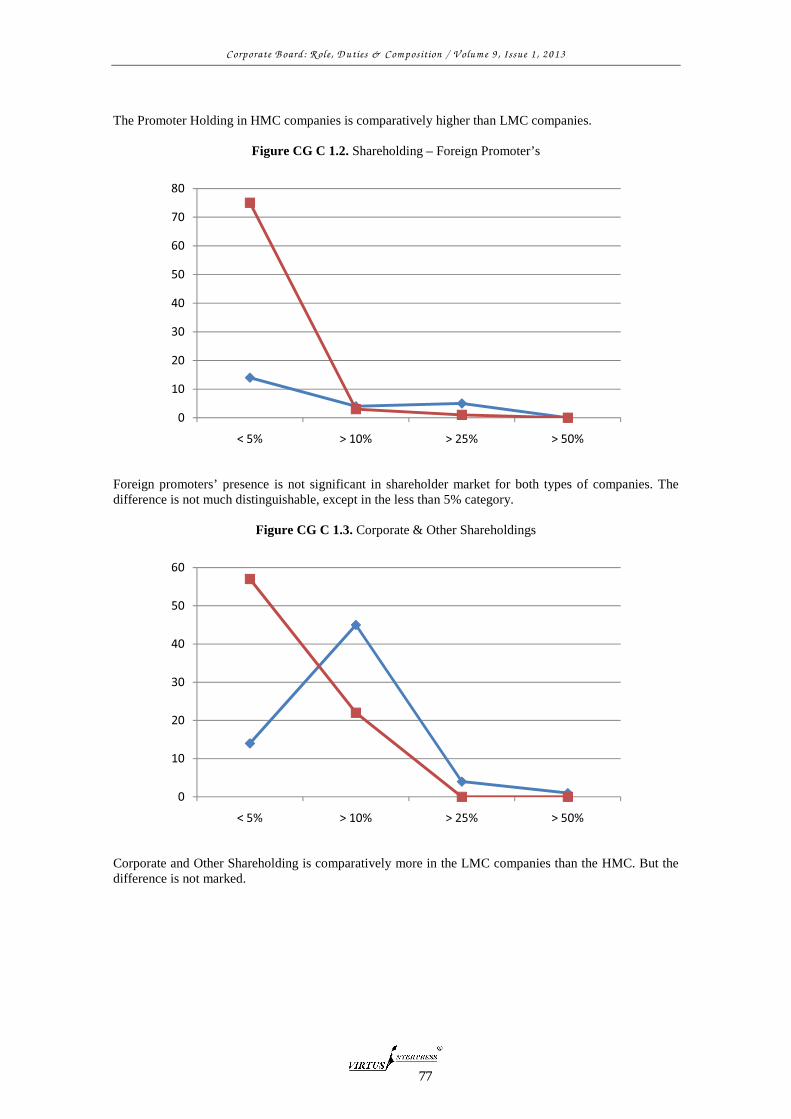
The Promoter Holding in HMC companies is comparatively higher than LMC companies.
Figure CG C 1.2. Shareholding – Foreign Promoter’s
Foreign promoters’ presence is not significant in shareholder market for both types of companies. The difference is not much distinguishable, except in the less than 5% category.
Figure CG C 1.3. Corporate & Other Shareholdings
Corporate and Other Shareholding is comparatively more in the LMC companies than the HMC. But the difference is not marked.
0
10
20
30
40
50
60
70
80
< 5% > 10% > 25% > 50%
0
10
20
30
40
50
60
< 5% > 10% > 25% > 50%
Corporate B oard: R ole, D uties & Com position / V olum e 9 , Issue 1 , 2013
78
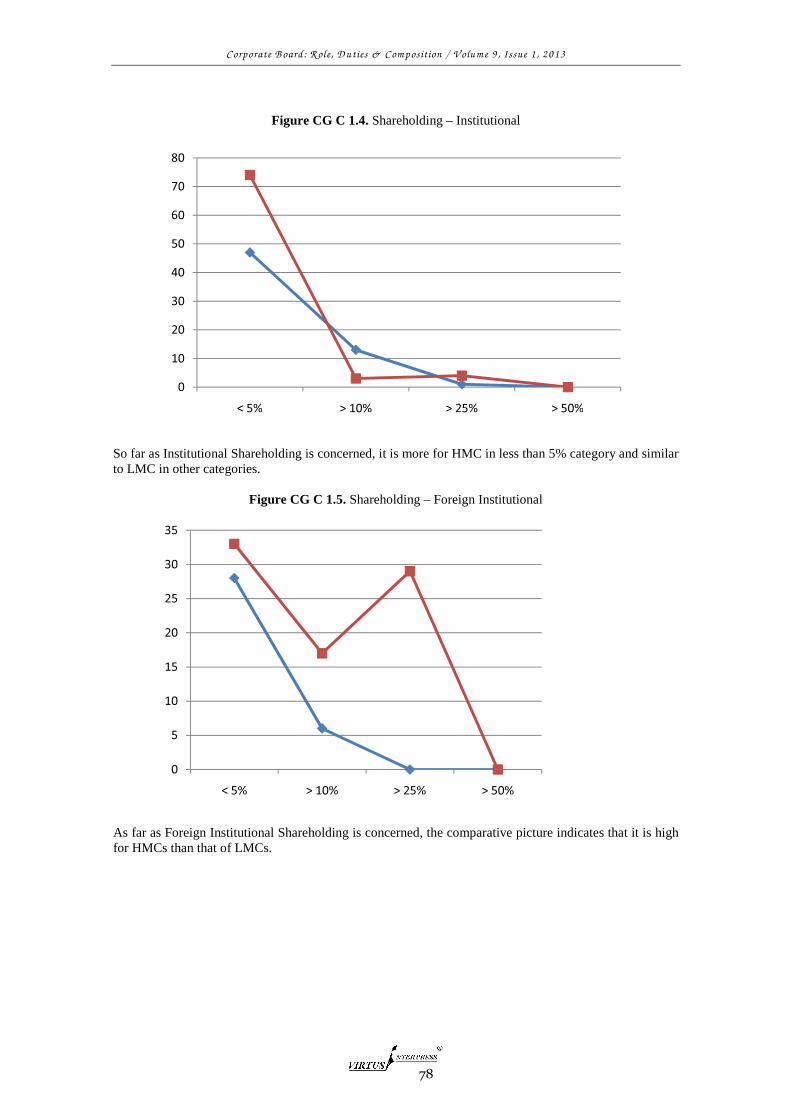
Figure CG C 1.4. Shareholding – Institutional
So far as Institutional Shareholding is concerned, it is more for HMC in less than 5% category and similar to LMC in other categories.
Figure CG C 1.5. Shareholding – Foreign Institutional
As far as Foreign Institutional Shareholding is concerned, the comparative picture indicates that it is high for HMCs than that of LMCs.
0
10
20
30
40
50
60
70
80
< 5% > 10% > 25% > 50%
0
5
10
15
20
25
30
35
< 5% > 10% > 25% > 50%
Corporate B oard: R ole, D
The comparative figure shows that Retail shareholding is greater in LMC than in HMC.
Figure CG C 1.7.
There is no significant difference in the composition of the Board. In HMC companies, the number of Independent Directors as well as promoter director is more as compared to LMC.
0
10
20
30
40
50
60
70
80
< 5%
0
10
20
30
40
50
60
70
80
90
100
Promoter's
Director
Corporate B oard: R ole, D uties & Com position / V olum e 9 , Issue 1 , 2013
79
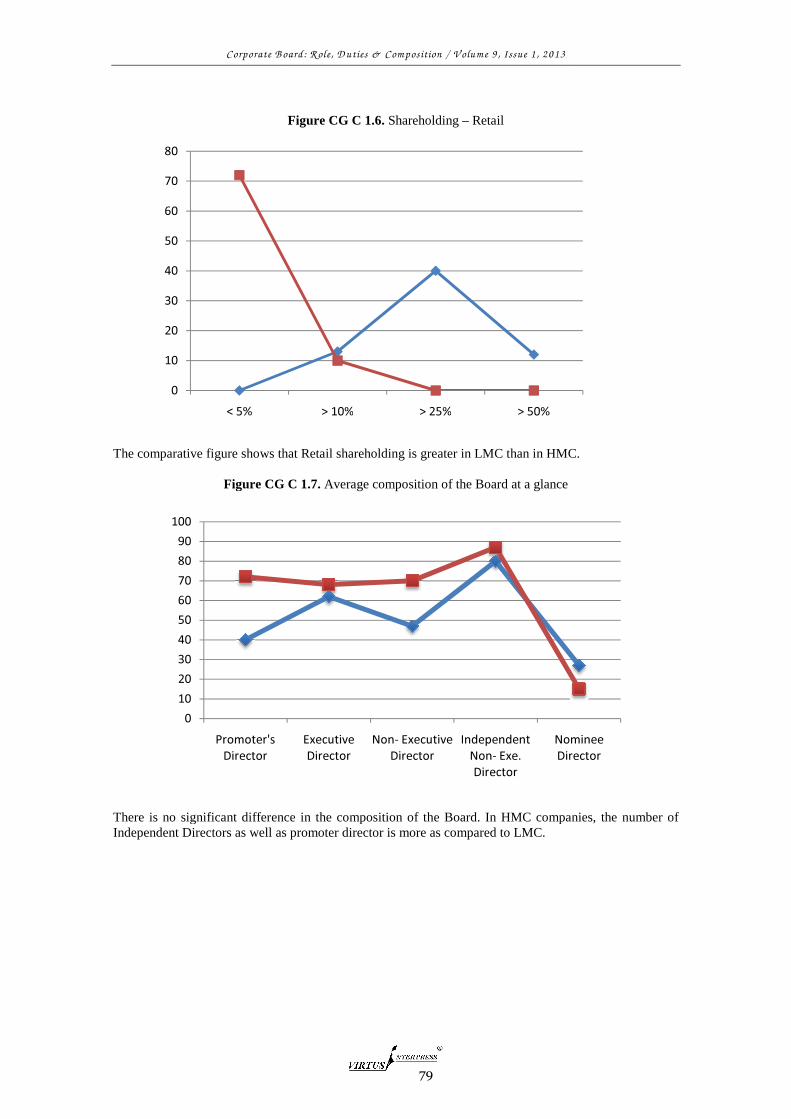
Figure CG C 1.6. Shareholding – Retail
The comparative figure shows that Retail shareholding is greater in LMC than in HMC.
Figure CG C 1.7. Average composition of the Board at a glance
There is no significant difference in the composition of the Board. In HMC companies, the number of Independent Directors as well as promoter director is more as compared to LMC.
> 10% > 25% > 50%
Executive
Director
Non- Executive
Director
Independent
Non- Exe.
Director
Nominee
Director
The comparative figure shows that Retail shareholding is greater in LMC than in HMC.
There is no significant difference in the composition of the Board. In HMC companies, the number of
Nominee
Director
Corporate B oard: R ole, D
Figure CG 1.8.
Frequency of Board Meetings in HMC is greater than that of LMC with most of the companies having 5 to 7 meeting in a year.
Figure CG C 1.9.
In HMC, the numbers of different Board committees are more than its ccommittees is way beyond the statutory prescriptions.
0
10
20
30
40
50
60
4
0
10
20
30
40
50
60
70
80
90
100
Corporate B oard: R ole, D uties & Com position / V olum e 9 , Issue 1 , 2013
80
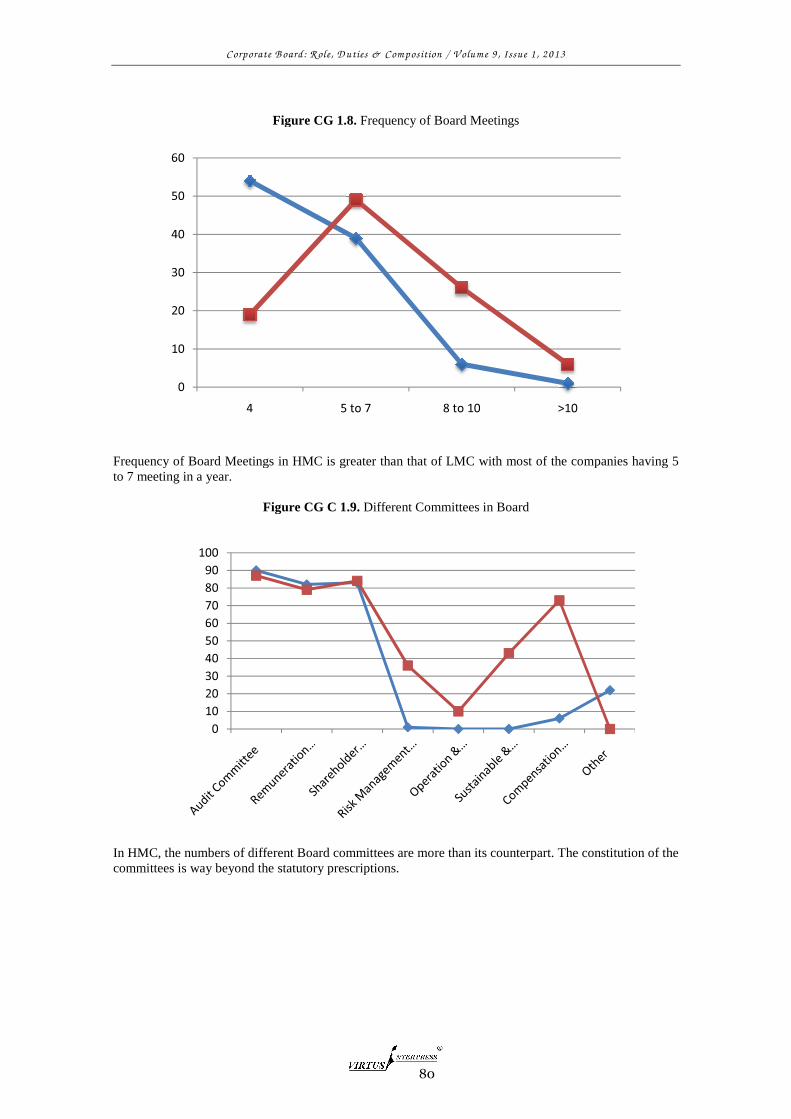
Figure CG 1.8. Frequency of Board Meetings
Frequency of Board Meetings in HMC is greater than that of LMC with most of the companies having 5
Figure CG C 1.9. Different Committees in Board
In HMC, the numbers of different Board committees are more than its counterpart. The constitution of the committees is way beyond the statutory prescriptions.
5 to 7 8 to 10 >10
Frequency of Board Meetings in HMC is greater than that of LMC with most of the companies having 5
ounterpart. The constitution of the
>10

Corporate B oard: R ole, D
Figure CG C 1.10.
Disclosure by companies is treated as one of the most important yardsticks to measure corporate governance practice. In this regard, HMCs is in far better position than LMCs. There are no disclosures in the matter of ‘protection of stakeholder’, ‘environmental policy’ and ‘business human right’ in the companies in the latter.
Figure CG C 1.11.
The disclosure of risks by HMC is far superior than that of LMC, as may be seen above. They make all disclosures pertaining to Operations, Financial matters, Market etc., which are less in case of the LMCs.
0102030405060708090
0
5
10
15
20
25
30
35
40
45
Business
Risk
Operational
Corporate B oard: R ole, D uties & Com position / V olum e 9 , Issue 1 , 2013
81
Figure CG C 1.10. Disclosure by the Company other than Risk
Disclosure by companies is treated as one of the most important yardsticks to measure corporate rnance practice. In this regard, HMCs is in far better position than LMCs. There are no disclosures in
the matter of ‘protection of stakeholder’, ‘environmental policy’ and ‘business human right’ in the
Figure CG C 1.11. Disclosure by company regarding risk factor
The disclosure of risks by HMC is far superior than that of LMC, as may be seen above. They make all disclosures pertaining to Operations, Financial matters, Market etc., which are less in case of the LMCs.
Operational
Risk
Financial
Risk
Market Risk Political Risk Other
Disclosure by companies is treated as one of the most important yardsticks to measure corporate rnance practice. In this regard, HMCs is in far better position than LMCs. There are no disclosures in
the matter of ‘protection of stakeholder’, ‘environmental policy’ and ‘business human right’ in the
The disclosure of risks by HMC is far superior than that of LMC, as may be seen above. They make all disclosures pertaining to Operations, Financial matters, Market etc., which are less in case of the LMCs.
Other

Corporate B oard: R ole, D uties & Com position / V olum e 9 , Issue 1 , 2013
82
Figure CG 1.12. Ethical Code formulated by Companies
The ethical code of managerial practices formulated and disclosed is approximately twice the number for HMCs as compared to LMCs. 5 Findings of Data Analysis A. The qualification and experience of the Independent Director is comparatively better in case of
HMCs, which may be correlated to overall performance of the company and the same may be measured in terms of market capitalization. Investors are expected to feel a certain degree of confidence on the companies reflecting human capital, which have skill set and business insight to handle the challenges in a volatile business environment. Independent Director brings the necessary experience and wisdom to the business, which lead the company towards sustainable growth. The same is reflected here too.
B. With regard to remuneration, it may be asserted that the same is directly proportional to the involvement of an individual in business/ employment. The remuneration of Independent Directors has witnessed a higher escalation over the years in case of HMCs, the same is at a lower level in case of LMCs, though both have witnessed increase in the years. It may be deduced that the people who have worked as Independent Directors in the Board of HMCs have been sufficiently motivated and involved in the work. The same is also demonstrated through their attendance in Board meetings and chairmanship/memberships of different committees in the Board.
C. The membership of Independent Directors in different Boards is inversely proportional to their performance and involvement with the company. The analysis of the data has revealed mixed results with HMCs having such directors in more than nine Boards as well as less than three Boards. On the contrary, in LMC Independent Directors are rather involved in less number of Boards at a time. It indicates that the personal efficiency of the individual Director prevails over availability of time.
D. Disclosures relating to Independent Directors are inadequate as per regulatory and international prescriptions in India; HMC has demonstrated better disclosure about the Independent Director’s past relationship with the company than LMC. Such disclosure further improves in case of risk and non-risk factors and adoption of ethical code.
E. In the category of HMC, Independent Directors hold the chairmanship in most of the Board committees which lead to better disclosures in terms of risk factor and other ancillary matters like related party transaction, whistle blower policy, environmental policy, employee welfare scheme, business human rights policy and legal compliance; in the category of LMC, though there are number of Independent Directors in the Board, they do not hold the chairmanship of prominent Board committees and the disclosure pattern is poor. This indicates that presence of Independent Director effectively enhances corporate disclosure.
0
10
20
30
40
50
60
70
80
Company formulated its own ethical code Not mentioned about ethical code
CGL25
CGH28
Corporate B oard: R ole, D uties & Com position / V olum e 9 , Issue 1 , 2013
83
F. In the Board committees where Independent Director holds chairmanship, the frequency of meetings is higher than others. These companies also provide details of matters discussed and decisions taken indicative of higher transparency levels than companies with low market capitalization.
G. Attendance of Independent Directors, in HMCs, in the Board meetings is significantly higher than those of LMC, with a difference of almost 30%. This indicates that where Independent Directors actively participate in policymaking and decision-making, the companies perform better.
H. Average Promoter Shareholdings in both categories of companies are on the higher side. So, the concept of monitoring by Independent Directors does not fit within the organizational structure of Board. Rather, they mainly discharge advisory role. This observation may be defended from the data obtained from HMCs.
I. Other than Promoter’s Holding, there are different types of shareholding including Institutional, Corporate, Foreign and Retail and the HMC have wider shareholder investment as compared to companies to LMC. This indicates that the presence of Independent Directors and consequently, Corporate Governance, influence investment decision-making by the Investors.
J. Overall, the presence of Independent Directors in corporate Board makes significant difference to Corporate Governance practices. In large number of LMC companies, the presence of directors, marked as Independent Director, have not been supported by any details about those directors; so their effectiveness is questionable. The companies in the other category however, furnish clear and specific details, including resume, about their Independent Directors.
6 Concluding Note "In recent years, the Boards of directors of large, publicly held companies have been in the spotlight of the corporate governance debate. In response to highly publicized allegations of unchecked managerial abuses,… some reformers have identified independent outside directors as a possible solution."11 Corporate governance reformers generally presume (1) that outside independent Boards are better than non-independent Boards and (2) that the more independent a Board is, the better it in bringing efficiency within company. "[I]ndependent director helps in proper functioning of the corporate, because of the fact, they do not have a material interest with the company and they will really represent the interest of all the investors and small shareholders. Presumption lies on the issue that executive or promoter directors are interested in making the wealth for themselves and not interested in the well-being of all the stakeholder and they are not perfectly faithful. Accordingly, corporate law steps in to provide alternative monitoring mechanisms. Chief among them is the Board of directors, especially the independent directors. In many of the cases, it is evident that CEO of company hides the real picture of the company from the potential investor and its stakeholders. So, the person who is knowledgeable in the similar kind of business, who does not possess any relation with internal management of company will act independently for benefit of its shareholder and stakeholders."12 In the present write up, the positive impact of the presence of Independent Director in Corporate Governance has been established. In the circumstances, strengthening the institution of Independent Director is important and the same will lead to good Governance, which is the sine qua non for sustainable growth.
11Laura Lin (1995-96), The Effectiveness of Outside Directors as a Corporate Governance Mechanism: Theories and Evidence, 90 Nw. U.L. Rev. 898. 12Indrajit Dube, Corporate Governance (Lexis Nexis Butterworths Wadhwa, 2009) pp. 130-131.


