
Report
September 2018
Rother Valley Railway Economic Impacts Report
Rother Valley Railway Limited
Our ref: 22707603


Steer has prepared this material for Rother Valley Railway Limited. This material may only be used within the context and scope for which Steer has prepared it and may not be relied upon in part or whole by any third party or be used for any other purpose. Any person choosing to use any part of this material without the express and written permission of Steer shall be deemed to confirm their agreement to indemnify Steer for all loss or damage resulting therefrom. Steer has prepared this material using professional practices and procedures using information available to it at the time and as such any new information could alter the validity of the results and conclusions made.
Report
September 2018
Rother Valley Railway Economic Impacts Report
Prepared by:
Prepared for:
Steer
28-32 Upper Ground
London SE1 9PD
Rother Valley Railway Limited
+44 20 7910 5000
www.steergroup.com
Our ref: 22707603

Rother Valley Railway Economic Impacts Report | Report
September 2018
Contents
Executive Summary ............................................................................................................. i
The Rother Valley Railway ‘Missing Link’ ............................................................................ i
Local Economic Context ......................................................................................................ii
Transport Impacts – Operational Stage.............................................................................. vi
1 Introduction .............................................................................................................. 1
The Rother Valley Railway ‘Missing Link’ ........................................................................... 1
The Economic Impact Report ............................................................................................. 1
2 Scheme Context and Description ............................................................................... 2
Background & History ......................................................................................................... 2
Scheme Location & Wider Area ......................................................................................... 4
Scheme Description – The ‘Missing Link’ ........................................................................... 7
The Kent and East Sussex Railway (KESR) .......................................................................... 9
3 Description of Scheme Impacts ................................................................................ 13
The Role of Tourism.......................................................................................................... 13
Impacts of the Rother Valley Railway ............................................................................... 15
4 Impacts on the Local Economy ................................................................................. 20
Overview ........................................................................................................................... 20
Current Demand Profile ................................................................................................... 20
Drivers of Additional Visitor Demand ............................................................................... 23
Estimate of Additional Visitor Demand – Summary ......................................................... 31
Economic Benefits of Additional Visitor Demand ............................................................ 33
The KESR Investment Plan ................................................................................................ 37
Additional Volunteer Spend ............................................................................................. 38
Direct Employment Benefits ............................................................................................ 39
Summary of Operational Impacts .................................................................................... 39
Benefits to the Local Economy – Construction Stage ....................................................... 42
Summary of Local Economic Impacts ............................................................................... 42
5 Transport Related Economic Impacts ....................................................................... 45
Overview ........................................................................................................................... 45
Rother Valley Railway Economic Impacts Report | Report
September 2018
Level Crossing Impacts ..................................................................................................... 45
Highway Impacts from Change in Car Kilometres Travelled ............................................ 46
National Rail Revenue Impacts ......................................................................................... 51
Summary of Transport Impacts ........................................................................................ 52
6 Assessment of Fit with Policy .................................................................................. 53
VisitEngland Strategic Framework ................................................................................... 53
National Trust Policy from Practice .................................................................................. 54
The South East LEP Growth Deal and Strategic Economic Plan ....................................... 55
East Sussex County Council Plan ...................................................................................... 55
Rother District Core Strategy ........................................................................................... 56
Salehurst and Robertsbridge Neighbourhood Development Plan ................................... 56
Summary........................................................................................................................... 57
7 Conclusions ............................................................................................................. 58
Figures
Figure 1-1: Existing and Proposed Rail Links.................................................................................. i
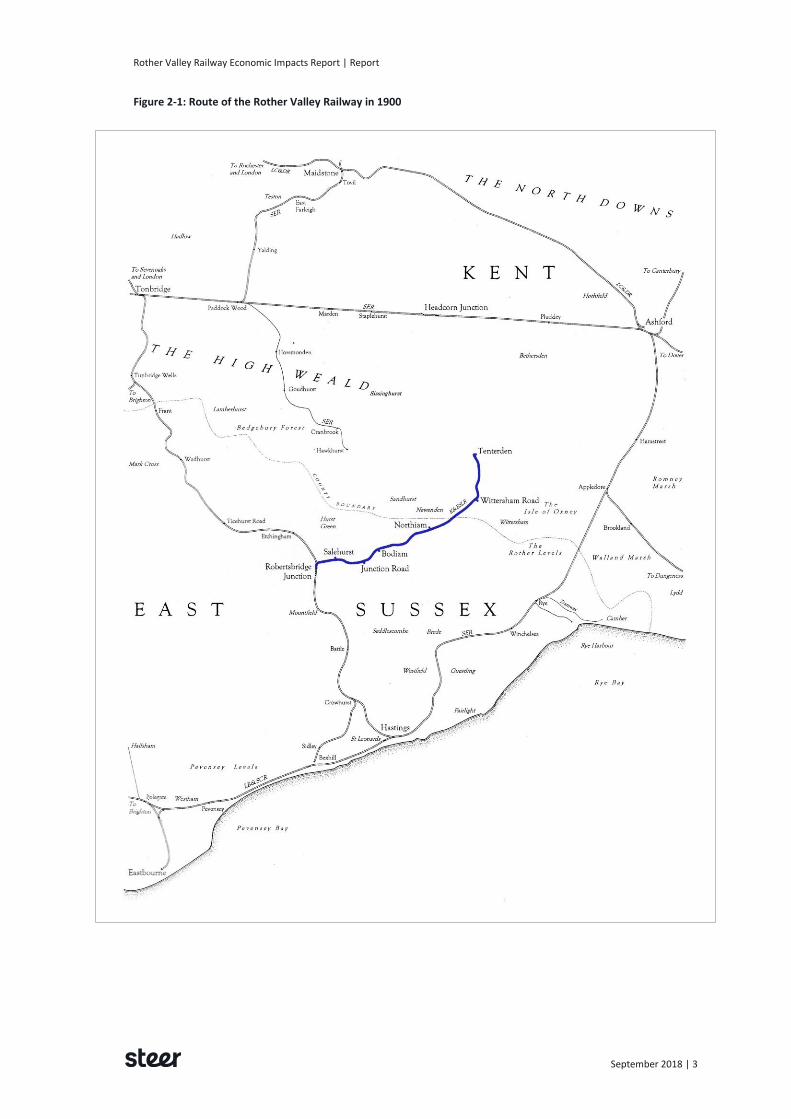
Figure 2-1: Route of the Rother Valley Railway in 1900 ............................................................... 3
Figure 2-2: Scheme Location ........................................................................................................ 6
Figure 2-3: Rother Valley Railway ‘Missing Link’ .......................................................................... 8
Figure 2-4: Future Car Parking on the KESR ................................................................................ 12
Figure 3-1: Rother Valley Railway Impacts ................................................................................. 16
Figure 4-1: Economic Impacts ..................................................................................................... 20
Figure 4-2: Origins of 2017 KESR Visitors by Population ............................................................ 22
Figure 4-3: Existing and Future KESR Catchments by Road Travel ............................................. 25
Figure 4-4: 2011 Tourism Expenditures (Multiplier Values) by District in the South East (£m) . 35
Figure 4-5: KESR Demand Profile ................................................................................................ 43
Figure 4-6: Annual Local Economic Benefit (£m, 2018 prices) ................................................... 44
Figure 5-1: Driving Journey Time and Distance to Robertsbridge and Tenterden ..................... 47
Rother Valley Railway Economic Impacts Report | Report
September 2018
Tables
Table 1-1: Total Local Economic Benefit - Construction Phase plus 10 years of Operation (£m,
2018 prices) .................................................................................................................................. iv
Table 1-2: Summary of the Potential Economic Impact of the Rother Valley Railway (2018
prices) ............................................................................................................................................ v
Table 1-3: Summary of Highway Transport Impacts .................................................................... vi
Table 2-1: Levels of Deprivation by District in East Sussex (2015) ............................................... 4
Table 2-2: Gross Value Added per Head at Current Basic Prices (2016) ...................................... 5
Table 4-1: Top-10 Ticket Sales by Origin Local Authority Population ......................................... 21
Table 4-2: Proportion of KESR Tickets by Origin Region ............................................................. 21
Table 4-3: Population within Road Travel Catchment ................................................................ 23
Table 4-4: New Rail Catchment to KESR ..................................................................................... 26
Table 4-5: Largest ‘Mosaic’ Population Groups in South East London by Population................ 27
Table 4-6: Cost of Travel between London Terminals and Robertsbridge ................................. 28
Table 4-7: Comparable Heritage Railways .................................................................................. 29
Table 4-8: Summary of Additional Visitor Demand arising from the Rother Valley Railway ..... 31
Table 4-9: Initial Economic Impact of the Rother Valley Railway (2018 prices) ......................... 36
Table 4-10: Visitor Impact Sensitivity Tests (2018 prices) .......................................................... 37
Table 4-11: Potential Economic Impact of Long-Term Investment Plan (2018 prices) .............. 38
Table 4-12: Initial Operational Stage Local Economic Benefits – Summary ............................... 39
Table 4-13: Local Economic Impact of Heritage Railways - Benchmarks ................................... 40
Table 4-14: Yield per Passenger .................................................................................................. 40
Table 4-15: Rother Valley Railway Initial Economic Value to Turnover Ratio ............................ 41
Table 4-16: Construction Impacts (2018 prices) ......................................................................... 42
Table 4-17: Summary of Initial Local Economic Impacts (2018 Prices) ...................................... 43
Table 4-18: Total Initial Local Economic Benefit - Construction Phase plus 10 years of Operation
(£m, 2018 prices) ........................................................................................................................ 44
Table 5-1: Level Crossings – Highway Disbenefits ...................................................................... 45
Table 5-2: Typical Time and Distance Savings ............................................................................ 48
Table 5-3: Summary of Highway Impacts ................................................................................... 50
Table 5-4: Car Trips per Day at Robertsbridge............................................................................ 51
Table 5-5: Additional Rail Demand and Revenue on the National Rail Network ....................... 52
Table 6-1: Rother Valley Railway Fit with Policy ......................................................................... 57

Rother Valley Railway Economic Impacts Report | Report
September 2018
Table 7-1: Total Local Economic Benefit - Construction Phase plus 10 years of Operation (£m,
2018 prices) ................................................................................................................................ 58

Rother Valley Railway Economic Impacts Report | Report
September 2018 | i
Executive Summary
The Rother Valley Railway ‘Missing Link’
The Rother Valley Railway (RVR) proposal is to restore a section of a former railway line to
connect the Kent and East Sussex (KESR) heritage railway with Robertsbridge and the national
rail network. The 2.2 mile (3.5 km) ‘missing link’ would enable the existing heritage train
service to operate along 14 miles of line between Tenterden and Robertsbridge. In doing so,
both the railway and other visitor attractions along the route would become accessible by rail,
in addition to road.
Both KESR and RVR are registered charities1 with objectives to preserve, restore and operate
the railway for technical, historical and educational purposes. The RVR is supported by Rother
District Council, East Sussex County Council and Kent County Council, with letters of support
presented in the TWOA Consultation Report.
The delivery of the Rother Valley Railway is forecast to generate local economic benefits of up
to £35.0 million over the two-year construction period (2019 - 2020) and the first ten years of
operation, and up to £4.6 million of local economic benefits per year from 2030. It will
generate approximately 34 jobs in the construction phase (temporary FTE over two years) and
up to 85 in the operational phase (FTE permanent jobs). Additional rail revenues of
approximately £355,000 per annum would accrue to the mainline rail operator.
The existing KESR route and stations is shown (blue line) in Figure 1-1 below, and the proposed
Rother Valley Railway would complete the link between Bodiam and Robertsbridge. The
project is estimated to cost £5.3m and, subject to the TWAO being approved, is forecast to
open in 2021. It is also expected to have small positive transport benefits on the local highway
network.
Figure 1-1: Existing and Proposed Rail Links
1 Registered charity numbers: KESR – 262481; RVR – 1088452
Rother Valley Railway Economic Impacts Report | Report
September 2018 | ii
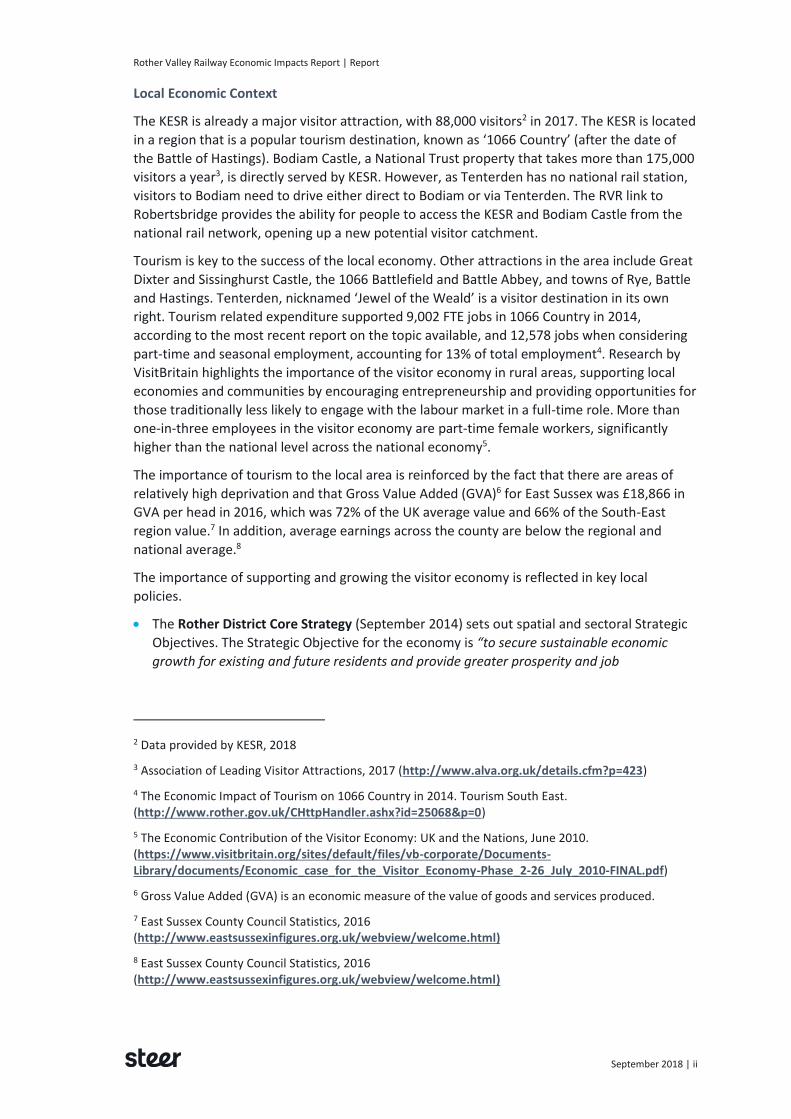
Local Economic Context
The KESR is already a major visitor attraction, with 88,000 visitors2 in 2017. The KESR is located
in a region that is a popular tourism destination, known as ‘1066 Country’ (after the date of
the Battle of Hastings). Bodiam Castle, a National Trust property that takes more than 175,000
visitors a year3, is directly served by KESR. However, as Tenterden has no national rail station,
visitors to Bodiam need to drive either direct to Bodiam or via Tenterden. The RVR link to
Robertsbridge provides the ability for people to access the KESR and Bodiam Castle from the
national rail network, opening up a new potential visitor catchment.
Tourism is key to the success of the local economy. Other attractions in the area include Great
Dixter and Sissinghurst Castle, the 1066 Battlefield and Battle Abbey, and towns of Rye, Battle
and Hastings. Tenterden, nicknamed ‘Jewel of the Weald’ is a visitor destination in its own
right. Tourism related expenditure supported 9,002 FTE jobs in 1066 Country in 2014,
according to the most recent report on the topic available, and 12,578 jobs when considering
part-time and seasonal employment, accounting for 13% of total employment4. Research by
VisitBritain highlights the importance of the visitor economy in rural areas, supporting local
economies and communities by encouraging entrepreneurship and providing opportunities for
those traditionally less likely to engage with the labour market in a full-time role. More than
one-in-three employees in the visitor economy are part-time female workers, significantly
higher than the national level across the national economy5.
The importance of tourism to the local area is reinforced by the fact that there are areas of
relatively high deprivation and that Gross Value Added (GVA)6 for East Sussex was £18,866 in
GVA per head in 2016, which was 72% of the UK average value and 66% of the South-East
region value.7 In addition, average earnings across the county are below the regional and
national average.8
The importance of supporting and growing the visitor economy is reflected in key local
policies.
• The Rother District Core Strategy (September 2014) sets out spatial and sectoral Strategic
Objectives. The Strategic Objective for the economy is “to secure sustainable economic
growth for existing and future residents and provide greater prosperity and job
2 Data provided by KESR, 2018
3 Association of Leading Visitor Attractions, 2017 (http://www.alva.org.uk/details.cfm?p=423)
4 The Economic Impact of Tourism on 1066 Country in 2014. Tourism South East. (http://www.rother.gov.uk/CHttpHandler.ashx?id=25068&p=0)
5 The Economic Contribution of the Visitor Economy: UK and the Nations, June 2010. (https://www.visitbritain.org/sites/default/files/vb-corporate/Documents-Library/documents/Economic_case_for_the_Visitor_Economy-Phase_2-26_July_2010-FINAL.pdf)
6 Gross Value Added (GVA) is an economic measure of the value of goods and services produced.
7 East Sussex County Council Statistics, 2016 (http://www.eastsussexinfigures.org.uk/webview/welcome.html)
8 East Sussex County Council Statistics, 2016 (http://www.eastsussexinfigures.org.uk/webview/welcome.html)

Rother Valley Railway Economic Impacts Report | Report
September 2018 | iii
opportunities for all.” From this, a number of objectives have been derived, including “to
develop key existing sectors, including tourism.”
• One of the four priorities set out in the East Sussex County Council Plan (April 2018) is to
drive sustainable economic growth, and the plan notes an intention to build on the
county’s existing strength in culture and tourism. The plan suggests an intended outcome
of “growing the visitor economy by raising the visibility of East Sussex, enhancing
perceptions, increasing the number of visitors to the coast, and increasing length of stay
and spend” by 2021.
• The South East Local Enterprise Partnership Strategic Economic Plan (March 2014)9 aims
to generate 200,000 private sector jobs, complete 100,000 homes and lever investment
totaling £10 billion for the national economy. The Strategic Economic Plan highlights the
importance of the tourism sector in the South East, currently accounting for 6.6% of total
employment and 2.7% of total economic output, as well as employing 96,000 people across
the region. The visitor economy is especially important in rural areas. The Local Enterprise
Partnership (LEP) is focusing its efforts on sectors of the economy where it has, or could
have, a strong competitive advantage.
• The Salehurst and Robertsbridge Neighborhood Development Plan (April 2018) includes
an objective to “foster a sustainable community that promotes employment creation,
across commercial, retail, and industrial sites”.
Local Economic Impact - Summary
The analysis presented in this report seeks to value the additional local economic benefits that
would be delivered by the construction and operation of the Rother Valley Railway. We have
estimated the benefits associated with both the construction and operational phases of the
project, based on published evidence, growth in heritage rail elsewhere, and our professional
judgement.
This report considers both the impact of the Rother Valley Railway as a ‘stand-alone’ scheme,
and the impacts of the associated KESR Investment Programme, which will only go ahead if the
Rother Valley Railway is implemented. KESR expect the Investment Programme, combined
with delivery of the RVR, to increase passenger numbers to between 150,000 and 200,000 per
annum, comparable to other heritage railways elsewhere.
Local Economic Impact
In total, we estimate that the delivery of the Rother Valley Railway, and the realization of the
KESR Investment Plan, could generate up to £35.0 million of local economic benefits over the
two-year construction period (2019 - 2020) and the subsequent ten years of operation. This
would generate up to 85 permanent jobs in the operational phase, in addition to 34 temporary
roles (over two years) in the construction phase.
Of these benefits, £17.3 million are attributable solely to the RVR, and £17.7 million to the
resultant KESR Investment Programme, as summarized in Table 1-1. The Rother Valley Railway
forms the critical element in the overall strategy that aims to deliver a step-change in
passenger numbers for the KESR.
9 Available at: https://www.southeastlep.com/our-strategy/strategic-economic-plan/ An updated Strategic Economic Plan is currently under development, and expected to be published before the end of 2018.
Rother Valley Railway Economic Impacts Report | Report
September 2018 | iv
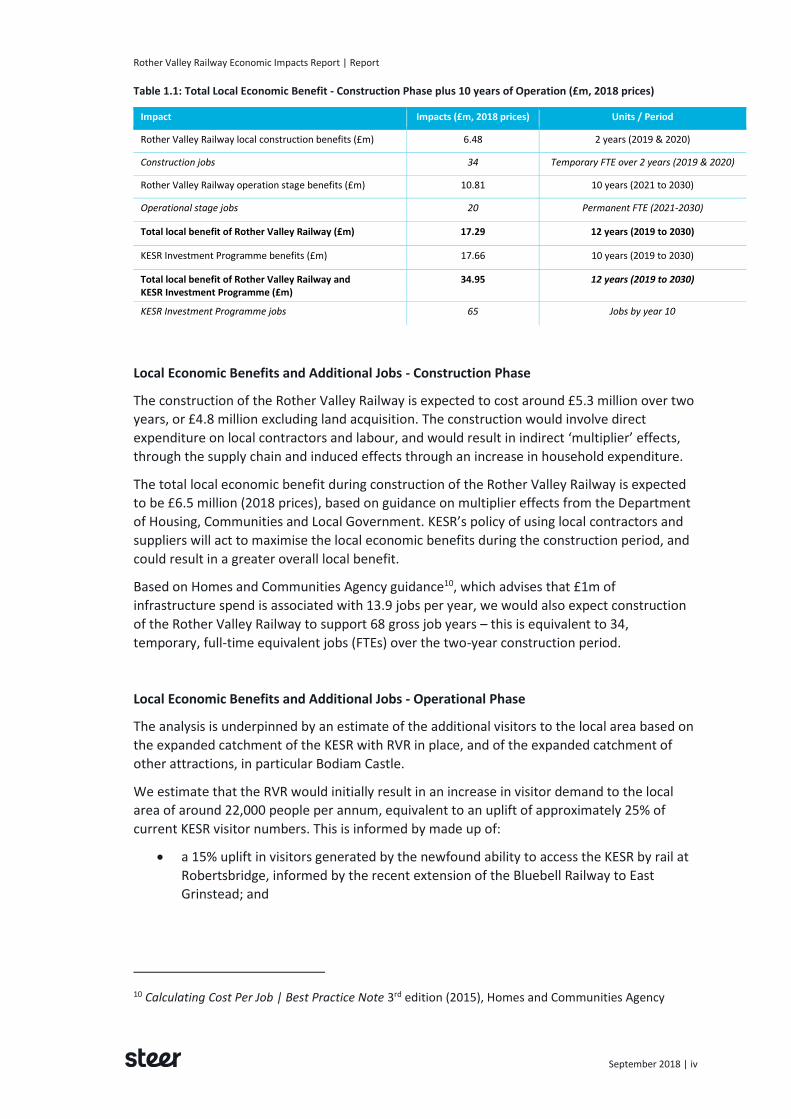
Table 1.1: Total Local Economic Benefit - Construction Phase plus 10 years of Operation (£m, 2018 prices)
Impact Impacts (£m, 2018 prices) Units / Period
Rother Valley Railway local construction benefits (£m) 6.48 2 years (2019 & 2020)
Construction jobs 34 Temporary FTE over 2 years (2019 & 2020)
Rother Valley Railway operation stage benefits (£m) 10.81 10 years (2021 to 2030)
Operational stage jobs 20 Permanent FTE (2021-2030)
Total local benefit of Rother Valley Railway (£m) 17.29 12 years (2019 to 2030)
KESR Investment Programme benefits (£m) 17.66 10 years (2019 to 2030)
Total local benefit of Rother Valley Railway and KESR Investment Programme (£m)
34.95 12 years (2019 to 2030)
KESR Investment Programme jobs 65 Jobs by year 10
Local Economic Benefits and Additional Jobs - Construction Phase
The construction of the Rother Valley Railway is expected to cost around £5.3 million over two
years, or £4.8 million excluding land acquisition. The construction would involve direct
expenditure on local contractors and labour, and would result in indirect ‘multiplier’ effects,
through the supply chain and induced effects through an increase in household expenditure.
The total local economic benefit during construction of the Rother Valley Railway is expected
to be £6.5 million (2018 prices), based on guidance on multiplier effects from the Department
of Housing, Communities and Local Government. KESR’s policy of using local contractors and
suppliers will act to maximise the local economic benefits during the construction period, and
could result in a greater overall local benefit.
Based on Homes and Communities Agency guidance10, which advises that £1m of
infrastructure spend is associated with 13.9 jobs per year, we would also expect construction
of the Rother Valley Railway to support 68 gross job years – this is equivalent to 34,
temporary, full-time equivalent jobs (FTEs) over the two-year construction period.
Local Economic Benefits and Additional Jobs - Operational Phase
The analysis is underpinned by an estimate of the additional visitors to the local area based on
the expanded catchment of the KESR with RVR in place, and of the expanded catchment of
other attractions, in particular Bodiam Castle.
We estimate that the RVR would initially result in an increase in visitor demand to the local
area of around 22,000 people per annum, equivalent to an uplift of approximately 25% of
current KESR visitor numbers. This is informed by made up of:
• a 15% uplift in visitors generated by the newfound ability to access the KESR by rail at
Robertsbridge, informed by the recent extension of the Bluebell Railway to East
Grinstead; and
10 Calculating Cost Per Job | Best Practice Note 3rd edition (2015), Homes and Communities Agency
Rother Valley Railway Economic Impacts Report | Report
September 2018 | v
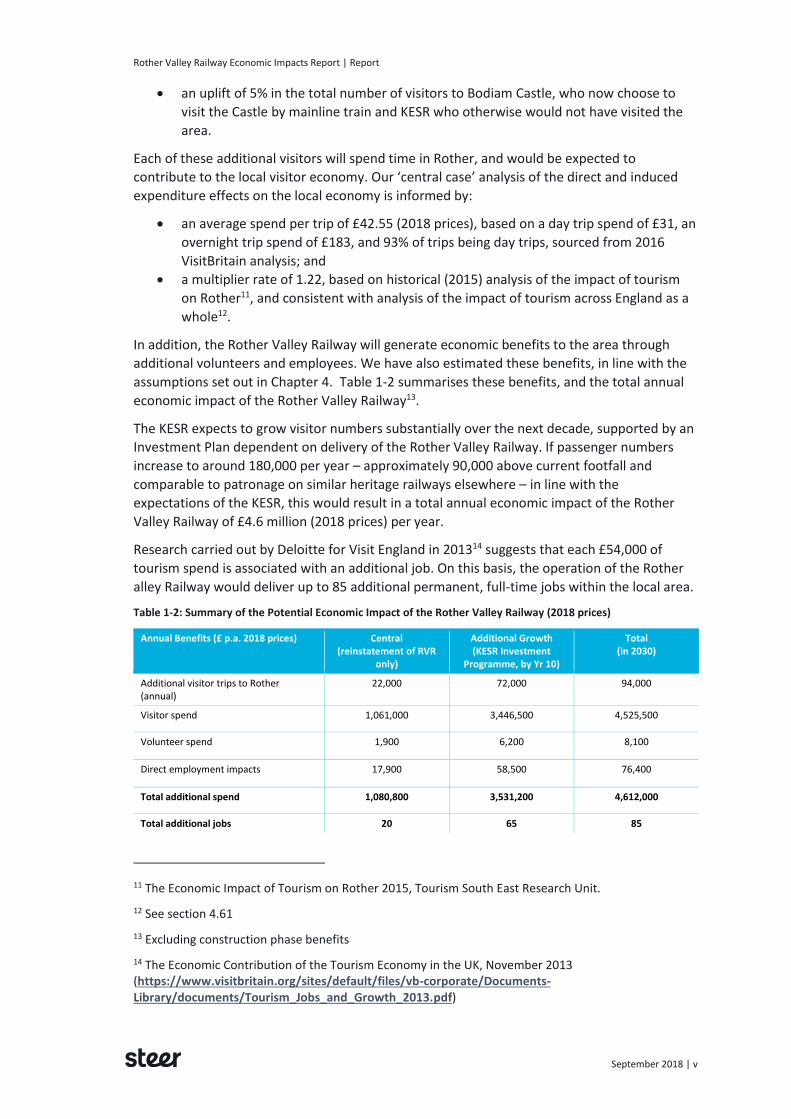
• an uplift of 5% in the total number of visitors to Bodiam Castle, who now choose to
visit the Castle by mainline train and KESR who otherwise would not have visited the
area.
Each of these additional visitors will spend time in Rother, and would be expected to
contribute to the local visitor economy. Our ‘central case’ analysis of the direct and induced
expenditure effects on the local economy is informed by:
• an average spend per trip of £42.55 (2018 prices), based on a day trip spend of £31, an
overnight trip spend of £183, and 93% of trips being day trips, sourced from 2016
VisitBritain analysis; and
• a multiplier rate of 1.22, based on historical (2015) analysis of the impact of tourism
on Rother11, and consistent with analysis of the impact of tourism across England as a
whole12.
In addition, the Rother Valley Railway will generate economic benefits to the area through
additional volunteers and employees. We have also estimated these benefits, in line with the
assumptions set out in Chapter 4. Table 1-2 summarises these benefits, and the total annual
economic impact of the Rother Valley Railway13.
The KESR expects to grow visitor numbers substantially over the next decade, supported by an
Investment Plan dependent on delivery of the Rother Valley Railway. If passenger numbers
increase to around 180,000 per year – approximately 90,000 above current footfall and
comparable to patronage on similar heritage railways elsewhere – in line with the
expectations of the KESR, this would result in a total annual economic impact of the Rother
Valley Railway of £4.6 million (2018 prices) per year.
Research carried out by Deloitte for Visit England in 201314 suggests that each £54,000 of
tourism spend is associated with an additional job. On this basis, the operation of the Rother
alley Railway would deliver up to 85 additional permanent, full-time jobs within the local area.
Table 1-2: Summary of the Potential Economic Impact of the Rother Valley Railway (2018 prices)
Annual Benefits (£ p.a. 2018 prices) Central (reinstatement of RVR
only)
Additional Growth (KESR Investment
Programme, by Yr 10)
Total (in 2030)
Additional visitor trips to Rother (annual)
22,000 72,000 94,000
Visitor spend 1,061,000 3,446,500 4,525,500
Volunteer spend 1,900 6,200 8,100
Direct employment impacts 17,900 58,500 76,400
Total additional spend 1,080,800 3,531,200 4,612,000
Total additional jobs 20 65 85
11 The Economic Impact of Tourism on Rother 2015, Tourism South East Research Unit.
12 See section 4.61
13 Excluding construction phase benefits
14 The Economic Contribution of the Tourism Economy in the UK, November 2013 (https://www.visitbritain.org/sites/default/files/vb-corporate/Documents-Library/documents/Tourism_Jobs_and_Growth_2013.pdf)

Rother Valley Railway Economic Impacts Report | Report
September 2018 | vi
Transport Impacts – Operational Stage
An assessment has also been made of the transport impacts associated with the Rother Valley
Railway during the operational phase.
Highway Impacts
Highway impacts are summarised in Table 1-3. The summary of highway impacts shows that,
while there would be disbenefits from delay at level crossings, and additional congestion
caused by new car trips to Robertsbridge, these would be outweighed by positive benefits
from:
• shorter journeys, as a proportion of visitors instead drive a shorter distance to access the
KESR at Robertsbridge rather than Tenterden; and
• modal shift, as a small proportion of users switch to accessing the KESR by rail rather than
road.
The scale of disbenefits alone, at around £10,500 per annum, represents less than 1% of the
annual local economic benefits, of £1.1m, that are presented above.
Table 1-3: Summary of Highway Transport Impacts
Transport Impact Description Annual Benefits (£,2018 prices)
Disbenefits from level crossing Disbenefits from the delay impacts of the level crossings on the A21 and B224 (estimated by Mott MacDonald in 2010 prices and uplifted using CPI). Worst case taken for overall value.
-2,900 to -6,300
Disbenefits from new car trips - additional congestion
Potential congestion disbenefits from any additional car-based visitor trips (new car trips) that are attracted to KESR by the ability to access at Robertsbridge rather than Tenterden.
-4,200
Benefits to users (visitors to KESR) from re-routeing to Robertsbridge
Benefits in the form of reduced journey times to ‘existing’ car users who transfer to access the KESR at Robertsbridge rather than Tenterden (they make shorter trips).
18,600
Decongestion benefits from re-routeing
Benefits from reduced congestion and accidents resulting from the reduction in vehicle mileage from the above.
4,200
Benefits from mode shift – decongestion
Potential benefits from any modal shift of current car-based visitors to rail.
5,800
Overall Highway Transport Impacts 18,100
Rail Revenues
The Rother Valley Railway would generate significant additional rail revenue to the national
rail network as people access the KESR and Bodiam by train. The estimated additional revenue
has been calculated at £355,000 per annum (2018 prices) from trips to/from Robertsbridge,
based on 22,000 additional two-way National Rail journeys and an average fare of £20,
informed by analysis of current ticket prices to/from London.
However, the overall transport impacts are modest in comparison with the local economic
benefits, delivering a net positive of £18,100 per year.
Rother Valley Railway Economic Impacts Report | Report
September 2018 | vii
Overall Conclusion
The Rother Valley Railway is forecast to generate local economic benefits of up to £35.0m –
including those from the KESR Investment Programme dependent on the delivery of the KESR
– over the two-year construction period and subsequent ten years of operation. This equates
to up to £4.6 million per annum from 2030.
These benefits would be achieved at an overall cost of around £5.3m. If this was a public-
sector investment, the level of benefits compared to the costs (through the benefit-cost ratio)
would demonstrate a strong case for funding as a regeneration-led project, aligned to the
stated policy objective of supporting the growth of the visitor economy.
However, as the investment is fully funded by charitable donations, the local economic
benefits and additional jobs would be achieved at no net cost to the public sector.
Rother Valley Railway Economic Impacts Report | Report
September 2018 | 1
The Rother Valley Railway ‘Missing Link’
1.1 The Rother Valley Railway proposal is to restore a section of a former railway line to connect
the Kent and East Sussex heritage railway with Robertsbridge and the national rail network.
The ‘missing link’ would enable the existing heritage train service to operate along 14 miles of
line between Tenterden and Robertsbridge. In doing so, both the heritage railway and other
visitor attractions along the route would become accessible by national rail, in addition to
road.
1.2 A planning application for the proposed link was submitted by Rother Valley Railway Limited
(“the Company”) on 30 June 2014 and was unanimously approved by Rother District Council
on 17 March 2017, following detailed consultations with relevant statutory bodies and other
key stakeholders. Although it is not a document required by the relevant statutory procedure,
this Economic Impact Report has been prepared by Steer to support, and assist in the
understanding of, the Company’s application dated 19 April 2018 for an Order under the
Transport & Works Act 1992. That Order, if made, would confer statutory authorization for the
railway as well as compulsory powers to acquire the necessary interests in third party land to
complete the missing link.
The Economic Impact Report
1.3 This report summarises the local economic impacts that are expected as a result of the
scheme. Through additional tourism demand, the Rother Valley Railway is expected to
generate benefits to the local economy, in addition to transport-related impacts.
1.4 The remainder of the report is structured as follows:
• Section 2 sets out the context for the Rother Valley Railway, including scheme description
and location, and the current and future operation of the Kent and East Sussex Railway;
• Section 3 qualitatively describes the scheme benefits and impacts;
• Section 4 provides quantification of the benefits of the Rother Valley Railway to the local
economy;
• Section 5 details the transport- related economic impacts;
• Section 6 assesses the extent to which the Rother Valley Railway fits with existing policy;
• Section 7 provides a summary and the conclusions of the study.
1 Introduction

Rother Valley Railway Economic Impacts Report | Report
September 2018 | 2
Background & History
2.1 In 1900 the Rother Valley Railway became operational to serve Tenterden from Robertsbridge
in East Sussex (see Figure 2-1). The railway line broadly followed the course of the River Rother
and its tributary, the Newmill Channel. In 1903 the Tenterden terminus was renamed
Rolvenden and the railway was extended 1.5 miles to the present Tenterden Town station.
The name of the railway was changed in 1904 to the Kent & East Sussex Light Railway, and in
1905 the railway was further extended to join the South Eastern and Chatham Railway at
Headcorn.
2.2 The railway was closed to passenger services on the 2 January 1954, and the section of track
from Tenterden to Headcorn was lifted the following year. Freight services continued between
Robertsbridge and Tenterden until June 1961, when the line was closed completely, except for
the short section between the main line and Hodsons Mill at Robertsbridge, which survived as
a private siding until 1969.
2.3 Following the closure of the line, the Kent & East Sussex Railway Preservation Society was
formed, which resulted in the purchase of the section of the line between Tenterden and
Bodiam. This section of line was gradually restored and train services are now in operation.
2.4 It was not possible, at that time, to purchase that part of the rail corridor between Bodiam and
Robertsbridge, and the track was lifted. A separate company, Rother Valley Railway Ltd, a
wholly-owned subsidiary of the Rother Valley Railway Trust, was formed in 1991 to restore
this 3.5 kilometre missing rail link between Bodiam and Robertsbridge. The reconstructed
section would connect with the Kent & East Sussex Railway at Bodiam, providing 14 miles of
continuous track from Tenterden to Robertsbridge.
2 Scheme Context and Description
Rother Valley Railway Economic Impacts Report | Report
September 2018 | 3
Figure 2-1: Route of the Rother Valley Railway in 1900

Rother Valley Railway Economic Impacts Report | Report
September 2018 | 4
Scheme Location & Wider Area
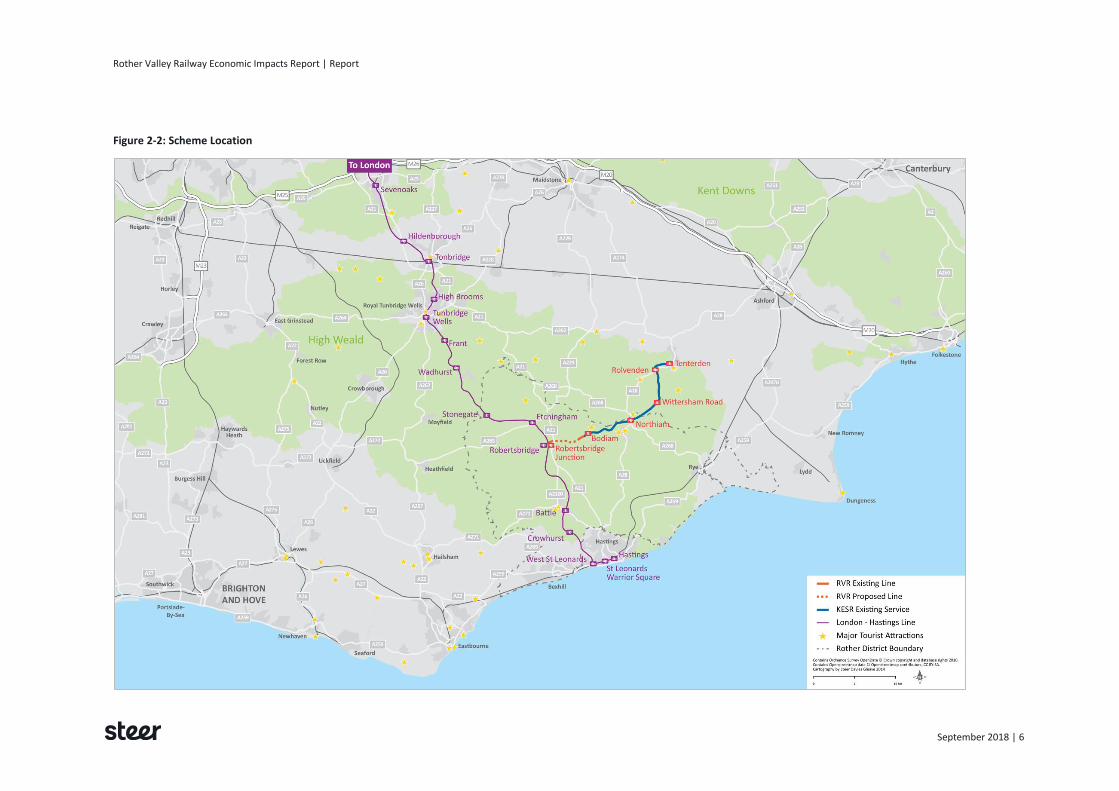
2.5 The Rother Valley Railway is located in East Sussex, within the Rother District and High Weald
Area of Outstanding Natural Beauty (AONB) (see Figure 2-2). The missing link would connect
the villages of Robertsbridge and Bodiam, and connect with the existing heritage rail line to
Tenterden in Kent.
2.6 Robertsbridge sits on the A21, which connects the village to London in the north (30 miles to
the M25, and 56 miles to the South Circular) and Hastings on the south coast (11 miles). It also
has a station on the national rail network, with approximately 30 services calling from
London/Hastings each weekday.
2.7 The East Sussex and West Kent area is a significant destination for overseas and domestic
visitors. The region is typified by picturesque coastline, historic towns and attractive
countryside, making it a destination for outdoor activities, and leisure and cultural purposes.
The Railway also sits within ‘1066 Country’, which is named after the Battle of Hastings and
promotes tourism sites across the eastern part of East Sussex.
2.8 The village of Robertsbridge is a popular jumping- off point for activities in the High Weald
AONB, whereas Tenterden, nicknamed ‘Jewel of the Weald’ is a visitor destination in its own
right. Between the two sits Bodiam Castle, a National Trust property that attracts more than
175,000 visitors a year15.
2.9 Other attractions in the area include Great Dixter and Sissinghurst Castle, the 1066 Battlefield
and Battle Abbey, and the towns of Rye, Battle and Hastings.
2.10 Despite this, pockets of East Sussex suffer from above average levels of deprivation, though as
a whole in 2015 the county ranked 99 out of 152 upper-tier authorities in deprivation indices
in 2015 (where 1 has the greatest level of deprivation). Table 2-1 shows the deprivation score
for each district within East Sussex. Three of the five districts are within the top 50% most
deprived in the country, particularly Hastings, which ranks 20 out of 326 districts (i.e.
according to this measure, it is the 20th most deprived district in the country).
Table 2-1: Levels of Deprivation by District in East Sussex (2015)16
District Average score Rank out of 326 districts
East Sussex 18.83 N/A
Hastings 33.11 20
Eastbourne 21.32 120
Rother 18.55 148
Lewes 15.07 201
Wealden 11.23 276
15 Association of Leading Visitor Attractions, 2017 (http://www.alva.org.uk/details.cfm?p=423)
16 English Indices of Deprivation (MHCLG), 2015 (https://www.gov.uk/government/statistics/english-indices-of-deprivation-2015)

Rother Valley Railway Economic Impacts Report | Report
September 2018 | 5
2.11 According to East Sussex County Council Statistics, East Sussex produced £18,866 in Gross
Value Added (GVA)17 per head (in 2016 prices), which represents 72% of the UK value and
66% of the South-East region value – see Table 2-2. 18 In addition, average earnings across the
county are below the regional and national average.
Table 2-2: Gross Value Added per Head at Current Basic Prices (2016)
Geography Gross Value Added per Head (£)
United Kingdom 26,339
South East 28,683
East Sussex 18,866
2.12 East Sussex therefore has economic need, but also significant potential in part founded on its
tourist offer. West Kent, ‘1066 Country’ and East Sussex as a whole are popular tourist
destinations, benefiting greatly from historic attractions and picturesque villages, combined
with areas of outstanding natural beauty. Capitalising on its assets, and facilitating the growth
of the local visitor economy, would provide a well-needed economic benefit to deprived areas
of the county.
17 Gross Value Added (GVA) is an economic measure of the value of goods and services produced.
18 East Sussex County Council Statistics, 2016 (http://www.eastsussexinfigures.org.uk/webview/welcome.html)
Rother Valley Railway Economic Impacts Report | Report
September 2018 | 6
Figure 2-2: Scheme Location

Rother Valley Railway Economic Impacts Report | Report
September 2018 | 7
Scheme Description – The ‘Missing Link’
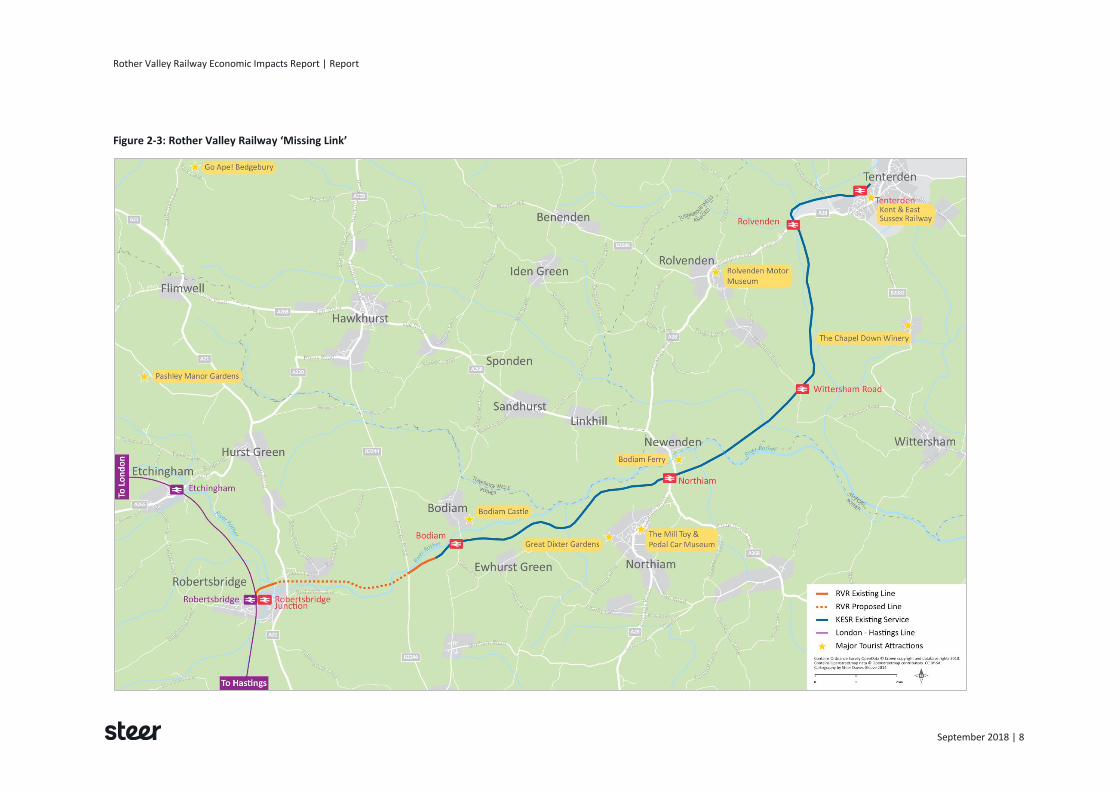
2.13 The Rother Valley Railway would restore 3.5 kilometres (2.2 miles) of the former rail line
between Robertsbridge and Bodiam, and connect to the existing Kent & East Sussex Railway
(KESR). The layout can be seen in Figure 2-3. The link would follow, so far as reasonably
practicable, the same alignment as was previously used and would re-instate crossings of the
A21, B2244 (Junction Road), and Northbridge Street in Robertsbridge via new level crossings.
2.14 There are a number of visitor attractions along the Rother Valley Railway and KESR route,
including Bodiam Castle and Tenterden town centre. Reinstating the missing link would mean
that with interchange from the national rail network, visitors would be able to access these
attractions entirely by train, and travel the full 14 miles on the heritage railway in each
direction.
Work to Date
2.15 Rother Valley Railway has made significant progress in restoring the missing link since the
charity’s conception.
2.16 In the past few years ¾ mile of track has been reconstructed in stages at the eastern end of
the Rother Valley Railway route, connecting KESR track to Junction Road. At the western end,
five bridges have been reconstructed with track laid from Robertsbridge Junction Station to
Northbridge Street. A connection to the main rail network has also been completed allowing
significant benefits to Network Rail, where they can now prepare for “main line possessions”
in advance, and also use RVR tracks, points etc. for staff training purposes.
2.17 In addition, a new station at Robertsbridge, called Robertsbridge Junction, is under
construction to serve as the Rother Valley Railway’s western terminus. The new station is
located adjacent to Robertsbridge Station on the London-Hastings rail line, which would allow
for seamless connection for visitors between the two and within easy walking distance of the
medieval village of Robertsbridge.
Work to Complete
2.18 Only the remaining 3.4 km of track needs to be constructed. There are several further bridges
to reconstruct and three road crossings to be reinstated, including the A21 Robertsbridge by-
pass, which is a strategic road link between Greater London and the south.
2.19 Donors have committed funding for the restoration of the missing link, which means it is fully
funded should permission be granted by the Secretary of State for its construction. No public-
sector funding would be required to re-instate the missing link.
Rother Valley Railway Economic Impacts Report | Report
September 2018 | 8
Figure 2-3: Rother Valley Railway ‘Missing Link’

Rother Valley Railway Economic Impacts Report | Report
September 2018 | 9
The Kent and East Sussex Railway (KESR)
Current Operation
Services
2.20 The KESR is the existing stretch of heritage railway between Bodiam and Tenterden, which
would be extended with the restoration of the missing link to Robertsbridge.
2.21 The existing number of services (i.e. train movements) varies on a seasonal basis. In general,
between April and October, on days when the railway is operational, there are five return
journeys each day. Exceptions to this are occasions when there are eight return services a day,
usually coinciding with, but not limited to, bank holiday weekends.
2.22 In addition to the regular timetabled services the railway is also used for private charters and
as a film location. Under normal circumstances, these additional train movements do not
coincide with the most intensive use of the railway. Journeys are provided by a combination of
steam and heritage diesel locomotives. The timetabled services19 can be summarised as
follows:
• 9 days a year – 8 return journeys a day;
• 9 days a year – 7 return journeys a day;
• 128 days a year – 5 return journeys a day;
• 14 days a year – 4 return journeys a day; and
• 192 days a year – no timetabled service20
2.23 In addition to special events, such as Christmas services, KESR provide a number of specials
and offers to supplement their regular service, for example:
• On-board catering;
• Picnic hampers / children’s birthday party packs;
• Combined ticketing with Bodiam Castle;
• 'Kids for a Quid' offer
• Day Rover tickets – all-day unlimited travel;
• First class travel;
• Wealden Pullman fine dining experience; and
• Gift shop and restaurant at Tenterden station.
Other Activities
2.24 The objectives of the RVR and KESR are to preserve, restore and operate parts of the railway
from Tenterden to Robertsbridge as a permanent public exhibition and museum21. This
includes the preservation, display and operation of steam and other locomotives, rolling stock,
equipment and relics, in order to contribute to technical, historical and general education of
19 Environmental Statement – Volume 2: Main Statement (https://drive.google.com/file/d/1JFGmDROZoGEqQkmqVgUshQqLIL8eZ3H2/view)
20 Although private chartered trains may still operate on these days
21 KESR 2014 Accounts.

Rother Valley Railway Economic Impacts Report | Report
September 2018 | 10
the operation of a rural light railway. The station at Tenterden includes a restoration shed and
railway museum.
Passenger Patronage
2.25 Total patronage was 88,400 in 2017, with the vast majority of passengers starting their
journey at Tenterden. Approximately 48,600 passengers in 2017 were carried on ‘regular’
services, with the remainder carried on ‘special’ services of which a limited number are
operated per year. ‘Santa’ specials carried 14,500 (16%) of passengers were carried on ‘Santa’
specials, 8,400 (10%) were on ‘Thomas the Tank Engine’ specials, and 3,100 (4%) on Pullman
dining and charter services. Other special events (such as for Father’s Day and Halloween)
accounted for the remainder of the patronage.
Revenue
2.26 In 2016, the total income of KESR was £1.32 million, of which £880,000 was directly from the
operation of the railway (fare income), and £257,000 was profit from Colonel Stephens
Railway Enterprises (a subsidiary of KESR responsible for additional commercial activities).
Other revenue comes from income streams such as membership subscriptions, donations and
gift aid. The ‘all-day’ travelcard fare – giving unlimited travel on the KESR for a day – is priced
at £18, with reduced fares for children, over 60s and those travelling a shorter distance on the
railway.
Operations
2.27 Currently, the KESR employs 28 paid staff to operate components of the railway and
associated activities. The majority of staff are unpaid volunteers; the KESR has almost 500
volunteers, many of whom actively contribute to the day-to-day running of the railway.
2.28 On a typical day, the railway requires approximately 30 volunteers and eight paid staff. Around
10-15 additional volunteers work on maintenance most days during winter.
Future Operation
National Rail Service
2.29 Robertsbridge Station is on the London-Hastings line of the national rail network. Trains
operate between London Charing Cross and Hastings via Tunbridge Wells, with approximately
one train per hour in each direction in the off-peak, and two trains per hour during the peak.
2.30 Journey times are approximately 1 hour 20 minutes to London Charing Cross, 25 minutes to
Hastings, and 20 minutes to Tunbridge Wells.
2.31 In 2022, the new South Eastern franchise will come into effect on the line serving
Robertsbridge. The indicative train service specification22 indicates that journey times from
London to Robertsbridge will reduce due to the removal of stops at Orpington and Sevenoaks
on services travelling through to Hastings and Ore.
22 https://assets.publishing.service.gov.uk/government/uploads/system/uploads/attachment_data/file/662871/sef-itt-attachment-a-train-service-specification.pdf

Rother Valley Railway Economic Impacts Report | Report
September 2018 | 11
KESR Services
2.32 Once the missing link has been constructed it is envisaged that the KESR would extend its
services to operate on the full length of the railway between Tenterden and Robertsbridge.
The existing Kent and East Sussex Railway timetable has been used as a basis for the assumed
operational timetable as it is not proposed to significantly alter the intensity of service from
that provided at present. As such, the operational timetable would vary significantly
throughout the year (the railway would operate on a single day in January; but in the peak
month of August the railway would operate every day). The number of services (i.e. train
movements) would also vary on a seasonal basis, as described in paragraph 2.21.
2.33 The timetabled service usually operates between 10:00hrs and 18:00hrs. However, the railway
proposes to extend the evening diner service that currently operates weekly on the Kent &
East Sussex Railway through to Robertsbridge. This service would finish at 23:00hrs.
Access and Parking
2.34 On regular services customers would be able to join the trains at any one of the stations.
2.35 There are currently two stations with free car parking facilities (Northiam and Tenterden), with
Robertsbridge Junction providing a third, paid, option. Bodiam Castle has a car park that is 400
metres from the KESR station, which also charges a daily rate. Future car parking
arrangements are summarised in Figure 2-4.
2.36 Some special day services currently run only as far as Northiam, and this would be expected to
continue. It is possible, however, that the KESR would run special day trains from
Robertsbridge instead of Tenterden on occasion.
Other Activities
2.37 Network Rail has designated the Rother Valley Railway as a site to train employees in mobile
flash-butt welding and full line maintenance23. As such, trainees could be visiting the area from
the Network Rail Innovation and Development Centre in Nottinghamshire. Anticipated trainee
numbers could be up to 20 per week. The connection at Robertsbridge could also provide
other advantages to Network Rail through rolling stock options and other operational benefits,
such as the loading of construction materials and equipment onto railway wagons on the RVR,
simplifying operations in advance of a main line closure.
23 https://www.networkrailmediacentre.co.uk/news/boost-for-heritage-railway-group-and-network-rail-as-new-sidings-open-at-robertsbridge

Rother Valley Railway Economic Impacts Report | Report
September 2018 | 12
Figure 2-4: Future Car Parking on the KESR

Rother Valley Railway Economic Impacts Report | Report
September 2018 | 13
3.1 This chapter describes the potential economic impacts of the proposed scheme.
The Role of Tourism
3.2 The primary beneficial impact of the scheme is based on the additional tourism demand that,
it is considered, would be attracted to the local area. The assessment of the scheme impacts
is, therefore, considered in the broader context of the role of tourism the local economy.
The Value of Tourism
3.3 A report, commissioned by VisitBritain in 2007/0824, identified areas where the visitor
economy also contributes to wider policy through:
• Economic and social inclusion: providing labour market entry opportunities to low/no
skilled labour pool, including those that can only work part-time. This can reduce the cost
on the Exchequer, and once they are in employment, employees can move up the value-
added chain.
• Enterprise and business formation in the visitor economy, which had one of the highest
business formation rates levels across all sectors pre-2007.
• Sustainable development impacts: contributing to rural and coastal locales for both direct
tourism- related activity and localised supply chains.
• Regeneration impacts, where tourism has worked as a catalyst for further economic
growth.
3.4 A later study, commissioned by VisitBritain in 2009/1025, went further to consider the impact
of the visitor economy and concluded the following:
• The visitor economy is highly important in rural areas as it plays a larger role in local
economies and communities than in urban areas;
• It provides opportunities for those traditionally less likely to engage with the labour market
in a full-time role – more than one-in-three employees in the visitor economy are part-time
female workers; higher than the national level across the entire economy; and
• Tourism encourages entrepreneurship.
24 The Economic Case for the Visitor Economy. September 2008. (https://www.visitbritain.org/sites/default/files/vb-corporate/Documents-Library/documents/EconomicCaseforTourism.pdf)
25 The Economic Contribution of the Visitor Economy: UK and the Nations. June 2010. (http://www.visitbritain.org/Images/Economic%20case%20for%20the%20Visitor%20Economy%20-%20Phase%202%20-%2026%20July%202010%20-%20FINAL_tcm29-14561.pdf)
3 Description of Scheme Impacts
Rother Valley Railway Economic Impacts Report | Report
September 2018 | 14
3.5 This 2009/10 study highlighted the importance of developing transport infrastructure to
improve local access and so support the growth of the visitor economy.
3.6 VisitBritain went on to commission a further report in 2013, their latest published report on
the topic, which sought to value the contribution of the visitor economy to the UK26. This
stated that, in 2013, the total spend of the visitor economy was £113 billion.
3.7 According to that report, direct contribution to the UK from businesses providing tourism
related goods and services amounted to £58 billion, supporting 1.75 million jobs. Indirect
benefits were a further £68.9 billion, resulting in a total contribution of £126.9 billion,
including indirect and multiplier effects, equivalent to 9.0% of UK GDP. The report states that
all sectors benefit from or participate in the visitor economy to some extent.
Importance of Tourism to East Sussex
3.8 Tourism is a key sector within the East Sussex economy. The KESR lies within the area branded
as ‘1066 Country’, which encompasses a range of sites across East Sussex and Kent.
1066 Country
3.9 1066 Country is an organisation27 that that promotes tourism in East Sussex. In 2014, Tourism
South East issued a report that assessed the economic impact of tourism on 1066 Country28.
3.10 The report states that total visitor expenditure was £457 million in 2014, of which 93% was
spent in 1066 Country. This results in £553 million worth of income for local businesses
through direct, indirect and induced effects.
3.11 The report also estimated that tourism-related expenditure supported 9,002 FTE jobs in 1066
Country in 2014 (the year of the most recent available research), and 12,578 jobs in total when
taking into account part-time and seasonal employment. Overall, it is estimated that tourism
supports 12.7% of all jobs in 1066 Country.
Rother District
3.12 The missing link of the Rother Valley Railway lies wholly within Rother District.
3.13 Similarly to 1066 Country, Tourism South East produced a tourism report for Rother District in
2015. This states that in 2015 (the year of the most recent research available) business
turnover supported by tourism was £292 million, supporting 4,871 FTE jobs or 9,836 in
total.29
26 The Economic Contribution of the Tourism Economy in the UK, November 2013 (https://www.visitbritain.org/sites/default/files/vb-corporate/Documents-Library/documents/Tourism_Jobs_and_Growth_2013.pdf)
27 http://www.visit1066country.com/
28 The Economic Impact of Tourism on 1066 Country in 2014. Tourism South East. (http://www.rother.gov.uk/CHttpHandler.ashx?id=25068&p=0)
29 The Economic Impact of Tourism on Rother 2015. Tourism South East. (http://www.rother.gov.uk/CHttpHandler.ashx?id=28273&p=0)

Rother Valley Railway Economic Impacts Report | Report
September 2018 | 15
3.14 The 2009/10 VisitBritain Report looked at the proportion of employees engaged in tourism
related activities. At that time, Rother District ranked 35th out of all English Authorities30,
with 13% of employees involved in tourism activities.
3.15 This dependence of the Rother District on tourism demonstrates the importance of continuing
to facilitate the development of tourism in the area. The importance of the tourism sector and
the aim of developing the visitor economy is recognized in policy at the regional (South East),
County (East Sussex) and Rother District levels, as described in Chapter 6 of this report.
3.16 Letters of support for the scheme can be found in the TWAO Consultation Report.
Impacts of the Rother Valley Railway
3.17 The impacts of Rother Valley Railway are outlined in Figure 3-1, and are described in the
remainder of this section. Further details are provided in Chapters 4 and 5.
30 There are currently approximately 350 local authorities in England (https://www.lgiu.org.uk/local-government-facts-and-figures/).

Rother Valley Railway Economic Impacts Report | Report
September 2018 | 16
Figure 3-1: Rother Valley Railway Impacts
Additional Visitor Demand
Additional Direct Visitor
Spend
Indirect / Induced Impacts
Additional Volunteers
Additional Employment
Construction
Local Economy Benefits Transport Related Impacts
Additional Direct Volunteer Spend
Indirect / Induced Impacts
Additional Direct Jobs
Indirect / Induced Impacts
Additional Direct Jobs
Indirect / Induced Impacts
Level Crossing
Road Delays
Transfer from Tenterden to Robertsbridge
New Car TripsModal Shift to
Rail
Change in Car Mileage
Decongestion / Time Savings
Additional Rail Revenue
Community Benefits
Increased Spend to EconomyReduced
Deprivation
Rother Valley Railway Economic Impacts Report | Report
September 2018 | 17
Local Economy Impacts
Additional Visitor Demand
3.18 Since tourism plays a crucial role in the national, regional and local economy, an increase to
the number of visitors to Rother district is expected to bring significant economic benefits.
3.19 The Rother Valley Railway will make the KESR directly accessible by rail for the first time, with
National Rail passengers able to interchange directly onto the KESR at Robertsbridge.
Experience from other heritage railways – notably the Bluebell Railway – indicates that this
can generate an significant uplift in patronage, and hence draw additional visitors to the local
area31. Robertsbridge is also located directly on the A21, the key trunk route between London,
Sevenoaks and Hastings, and extending the heritage railway to Robertsbridge will make it
significantly make it more accessible by car to the north, west and south. In addition, the
‘missing link’ is likely to increase the overall attractiveness of the KESR as a destination of
potential visitors, by virtue of being a larger attraction and being accessible from both ends of
the route.
3.20 Based on our judgement – and evidence elsewhere – we would expect the increased
accessibility of the railway would significantly increase the number of visitors to the railway.
Our analysis outlining the magnitude of this increase – and an estimate of the subsequent
economic impacts – is provided in Chapter 4.
3.21 Furthermore, the Rother Valley Railway will make attractions elsewhere – such as Bodiam
Castle and Tenterden – accessible from the national rail network via interchanging to the KESR
at Robertsbridge. The Rother Valley Railway would therefore expand the overall tourism offer
in Robertsbridge and East Sussex, and make it a more convenient and attractive destination
for visitors. There is, therefore, the potential for some visitors to visit more attractions in a
single day, or to encourage more overnight trips taking in more than one destination linked by
the KESR. The benefit of this is that some visitors would spend more per visit and therefore
contribute more to the local economy.
3.22 It can be assumed that the economic benefits arising from any increase in visitor numbers and
visitor expenditure would arise through:
• Direct expenditure - expenditure by additional visitors to the area, including, for example,
spend on accommodation, meals and spend on local tourist attractions (e.g. entrance fees).
• Indirect expenditure - local additional expenditure due to the purchase of goods and
services by businesses benefiting from visitor expenditure, i.e. jobs with local suppliers.
This effect can generate additional jobs and increase economic activity in the area on a
greater scale than tourism-based businesses alone.
• Induced expenditure - changes in local economic activity resulting from household
spending. For instance, if additional jobs are created with local suppliers these employees
spend their wages in the local area, resulting in more sales, income and jobs in the area.
31 This is outlined further in Chapter 4.
Rother Valley Railway Economic Impacts Report | Report
September 2018 | 18
3.23 The additional visitors to the KESR, following the introduction of the Rother Valley Railway,
would have varying expenditure patterns depending on their individual preferences, length of
stay, budget and so on. However, we would expect the additional visitors from the Rother
Valley Railway to support the following areas of the economy and economic activity:
• Ticket purchase and other (food and drink) expenditure on the KESR – this supports the
on-going maintenance and operation of the KESR. In addition to supporting a volunteer
workforce (who spend money locally), the maintenance work is likely to utilise local
contractors and suppliers. The revenues to KESR also support the employment of KESR paid
staff, and the indirect benefit to the local economy from employee expenditure in the local
economy.
• Food and beverage expenditure – the majority of additional expenditure on food and drink
is likely to either be on the KESR system or in the village of Robertsbridge (where additional
users would board and alight the KESR). There are a number of local pubs, cafes and shops
in Robertsbridge that would benefit from the increased visitor numbers to the village.
• Expenditure on other visitor attractions – the enhanced linking of a range of attractions by
rail/the KESR would promote increased visitor numbers at these sites, such as the Morgan
Museum in Rolvenden and Great Dixter Gardens. In particular, Bodiam Castle, as an
existing major attraction, would benefit from an expanded rail-based catchment.
• Accommodation – again, a number of additional visitors to the KESR and the Robertsbridge
Junction terminus would be expected to stay in or around Robertsbridge. The role of the
Rother Valley Railway in encouraging people to stay longer (by connecting a range of visitor
destinations) could also result in increased stays within the wider area, and specifically
those places that are connected to Robertsbridge by rail, such as Battle and Hastings.
• Other local expenditure – this would largely include retail expenditure in local shops on
convenience goods, clothes, gifts etc. Much of this direct expenditure has indirect and
induced effects that also benefit the economy, through spending on local supply chains and
the expenditure by shop workers in the local economy. More broadly, the tourism industry
supports the viability of many businesses and jobs in the area, and the additional visitors
attracted by the Rother Valley Railway would help support the local economy.
Additional Volunteer Spend
3.24 Operation of the KESR currently relies heavily on volunteers, many of whom are enthusiasts
that travel significant some distances to participate. With the missing link in place, additional
volunteers would be required on a daily basis, both at Robertsbridge Junction station,
operating the additional train (assuming a double-ended service), and for ongoing
maintenance activity.
3.25 The impact of this increase in volunteers is greater spend in the local economy, as more
volunteers would be staying, eating, socialising etc. in the area while supporting the KESR. As
with the increase in visitor demand, this would also create indirect and induced effects beyond
those businesses affected directly.
Additional Employment
3.26 In addition to more volunteers, the Rother Valley Railway would also require more paid staff
to operate services between Tenterden and Robertsbridge. This is a direct benefit to the local
economy through additional jobs, and this in turn creates indirect and induced impacts.
Rother Valley Railway Economic Impacts Report | Report
September 2018 | 19
Construction Benefits
3.27 Construction of the Rother Valley Railway would provide additional local employment during
the construction period. This would create additional direct and indirect ‘multiplier’ effects
through additional jobs generating additional spend in the local economy, subsequent
employment for supply industries (e.g. construction materials), and induced spend in
accommodation, dining etc. during the construction period.
Community Benefits
3.28 As stated previously, three of the five districts within East Sussex suffer from high levels of
deprivation, which in turn negatively affects quality of life in the county. The stated benefits of
the Rother Valley Railway to the local economy would provide a boost to the more deprived
areas of Rother District and East Sussex.
Transport Impacts
3.29 We have also summarized some of the potential transport impacts associated with the RVR,
including delays created by additional level crossings, and the benefits created by the transfer
of car trips from Tenterden to Robertsbridge and through modal shift.
3.30 These impacts are discussed in Chapter 5.

Rother Valley Railway Economic Impacts Report | Report
September 2018 | 20
Overview
4.1 This chapter summarises our assessment of the local economic impacts of the Rother Valley
Railway, informed by evidence from KESR and that published elsewhere, together with our
professional judgement. It is intended to highlight the likely range and magnitude of economic
impacts delivered by the scheme, although it should be noted that there inevitably remains a
degree of uncertainty in forecasting future tourist and KESR demand from such a project.
4.2 Our analysis considers the projected incremental impact of benefits of the Rother Valley
Railway extension. The main benefit to the local economy would arise from the increased
number of visitors that would be attracted to the KESR, the additional local direct expenditure
by these visitors, and then the associated impacts on the local economy (indirect and induced
effects). This is summarised in Figure 4-1.
Figure 4-1: Economic Impacts
4.3 In addition, we would expect additional economic benefits to be generated from:
• Additional volunteer expenditure;
• Additional paid jobs; and
• Construction impacts.
These impacts are considered later in the Chapter.
Current Demand Profile
4.4 Our assessment of additional demand is based on a forecast increase in ‘regular’ KESR visitors
rather than those for specific events, such as the Day Out with Thomas and Santa Specials. This
is because the ‘events’ are, in general, fully booked and there is therefore no scope (i.e. no
additional capacity) to accommodate additional demand. While we have assumed that there
Increased Visitor Demand
- Impact of RVR missing link
Increased Visitor Expenditure
- Direct impacts
Local Economic Benefits
- Induced and Indirect effects
4 Impacts on the Local Economy

Rother Valley Railway Economic Impacts Report | Report
September 2018 | 21
would not be additional event services, it is possible that the missing link would allow some
additional event services to be successfully marketed. Such events would lead to additional
impacts over and above those quantified here.
4.5 Regular visitors accounted for 48,600 trips out of the overall 88,400 annual trips in 2017. The
remaining 39,800 visitors attended special events.
Visitor Profile – Distribution
4.6 The origin profile of the KESR visitors in 2017 can be seen in Figure 4-2 overleaf, based on
approximately 17,000 internet bookings (from which postcodes of visitors can be sourced).
The figure shows that the majority of visitors come from within a 30-minute drive of
Tenterden. The top-10 ticket sales by origin local authority are shown in Table 4-1. A clear
pattern shows that currently the highest proportion of visitors travel from locations close and
to the east of Tenterden, primarily in West Kent.
Table 4-1: Top-10 Ticket Sales by Origin Local Authority Population
Region Local Authority Tickets % of Total Ticket Sample
South East Ashford 1,884 11%
South East Maidstone 1,643 10%
South East Medway 1,294 8%
South East Rother 899 5%
South East Tonbridge and Malling 762 4%
South East Swale 750 4%
South East Hastings 651 4%
South East Canterbury 651 5%
London Bexley 639 4%
London Bromley 638 4%
4.7 The majority of visitors to the KESR travel from the South East (77%) whilst a further 15% of
visitors travel from Greater London, specifically the south east Boroughs. About 7% of visitors
travel from further afield, predominantly the East of England – see Table 4-2.
Table 4-2: Proportion of KESR Tickets by Origin Region
Region Percentage of Tickets
South East 77%
London 15%
East of England 4%
Rest of United Kingdom 3%

Rother Valley Railway Economic Impacts Report | Report
September 2018 | 22
Figure 4-2: Origins of 2017 KESR Visitors by Population

Rother Valley Railway Economic Impacts Report | Report
September 2018 | 23
Visitor Profile – Mode Share
4.8 Mode share is the percentage of visitors that access the KESR by a particular type of transport,
e.g. car. There is no detailed information available on the mode share of visitors. The majority
are understood to visit by car, although a significant minority arrive on organised coach trips.
4.9 Although it is possible to get the train to Ashford and then a local bus to Tenterden, KESR (by
observation) report that very few use cycle or use public transport to access the railway, and it
accounts for an insignificant number of trips. Furthermore, KESR observe that very few of its
visitors use cycle. For the purposes of our analysis, we have assumed that 80% of trips are
currently made by car, and 20% by coach, based on evidence provided by KESR32.
Drivers of Additional Visitor Demand
4.10 We have considered drivers of additional visitor demand to the local area as a result of the
Rother Valley Railway. These are:
• Additional trips to KESR arising from:
• Expanded Road Catchment – additional car-based trips enhance accessibility to the
KESR by an additional access point at Robertsbridge.
• New Rail Market – the opening up of the KESR to a new market based on its
connection to the national rail network at Robertsbridge.
• Additional Bodiam Castle Demand – increased visitors to Bodiam Castle resulting from the
ability to access Bodiam by rail from Robertsbridge.
4.11 Our assessment of the potential impact of each of these drivers on visitor numbers in the local
area is described below.
Expanded Road Catchment
4.12 Currently 90% of passengers access the line at Tenterden. Tenterden is the starting point for
existing services and is a major tourism attraction in its own right. While the town has good
parking provision, local road access between East Sussex, West Kent and the wider strategic
highway network is poor.
4.13 The opening of a new station at Robertsbridge would provide an alternative access point for a
number of visitors, particularly those coming from the west of the KESR. Figure 4-2 and Table
4-3 show the existing and future population catchments by road, based on 2018 GIS analysis of
off-peak journey times.
Table 4-3: Population within Road Travel Catchment
Population within catchment
Car travel time (mins)
Existing (Tenterden) Future (Tenterden & Robertsbridge)
Additional % Increase in catchment
0 - 30 224,400 472,400 248,100 111%
30 - 60 1,697,100 2,631,500 934,400 55%
60 - 90 5,390,700 8,373,000 2,982,300 55%
32 RVR Economic Benefits Update v1, 25th July 2018

Rother Valley Railway Economic Impacts Report | Report
September 2018 | 24
4.14 The existing population within a 30-minute drive of the KESR is approximately 224,000. With
the addition of the missing link to Robertsbridge Junction this would more than double to
472,000. The 60-minute catchment would increase by 55% to 2.6 million, and those within a
90-minute drive would also increase by 55%, to 8.4 million. This expanded catchment indicates
that the extension of the heritage railway would have significant potential to attract more
visitors by road.
4.15 While the increase in the potential catchment of the KESR is substantial, the additional
demand generated by a new station at Robertsbridge would be affected by a number of
factors including:
• Tenterden is a larger town than Robertsbridge and a visitor attraction in its own right.
While visitors could travel to Robertsbridge, travel by KESR to Tenterden and explore the
town, returning to Robertsbridge later in the day, it is likely that the attractions in and
surrounding Tenterden will continue to attract more visitors.
• There is more parking available at Tenterden, and parking provision at the KESR would be
free. Parking at Robertsbridge, however, would incur a daily charge (currently £2.70
Saturdays / £1.00 Sundays) and could be subject to capacity constraints through shared
operation with the London- Hastings mainline station.

Rother Valley Railway Economic Impacts Report | Report
September 2018 | 25
Figure 4-3: Existing and Future KESR Catchments by Road Travel

Rother Valley Railway Economic Impacts Report | Report
September 2018 | 26
New Rail Market
Current and Future Access
4.16 Current access to the KESR is nearly all road-based, with the majority of visitors travelling by
private car and a smaller proportion travelling by organised coach. The siting of Robertsbridge,
directly on the National Rail network with frequent services to London, effectively opens up a
new potential market to people who could access the KESR by rail.
4.17 The population that would be able to access the KESR by train within two hours, based on the
2018 National Rail timetable, is shown in Table 4-4. The connection of Robertsbridge Junction
with the KESR, via the missing link, has the potential to reach a new market of up to five
million people within 2 hours rail travel time.
Table 4-4: New Rail Catchment to KESR33
Rail travel time (mins) Population
0-30 37,800
30-60 177,200
60-90 459,200
90-120 4,330,400
Within 120 5,004,600
London
4.18 The potential scale of the London ‘day trip’ market is significant. This reflects several factors:
• The overall size of the London market (currently 15% of visitors to the KESR are from
Greater London);
• Favourable demographics where significant numbers of people do not own a car, but have
comparably high disposable incomes and likely propensity to visit tourism attractions
elsewhere, but for whom visiting KESR is not currently a viable option;
• The relative attractiveness of rail compared to driving for a significant proportion of people
who do have a car, due to traffic congestion within London and an unwillingness to travel
long distances by car (such as those with young children).
4.19 Analysis suggests that the key London rail access market would come from South East London,
from the boroughs of Croydon, Bromley, Southwark, Lewisham, Greenwich, and Bexley, which
collectively have a population of 1.86 million people34. Census data indicates that 41% of
households within these boroughs do not own a car, which means that the new rail catchment
of potential KESR visitors is around 762,000 for non-car owners within these six London
boroughs alone. Visitors that have access to a car and choose to use rail would be in addition
to this catchment.
33 Based on catchment analysis using 2018 rail travel times to Robertsbridge station at off-peak periods from all potential origin locations, using TRACC software.
34 ONS Mid-Year Population Estimates, 2017
Rother Valley Railway Economic Impacts Report | Report
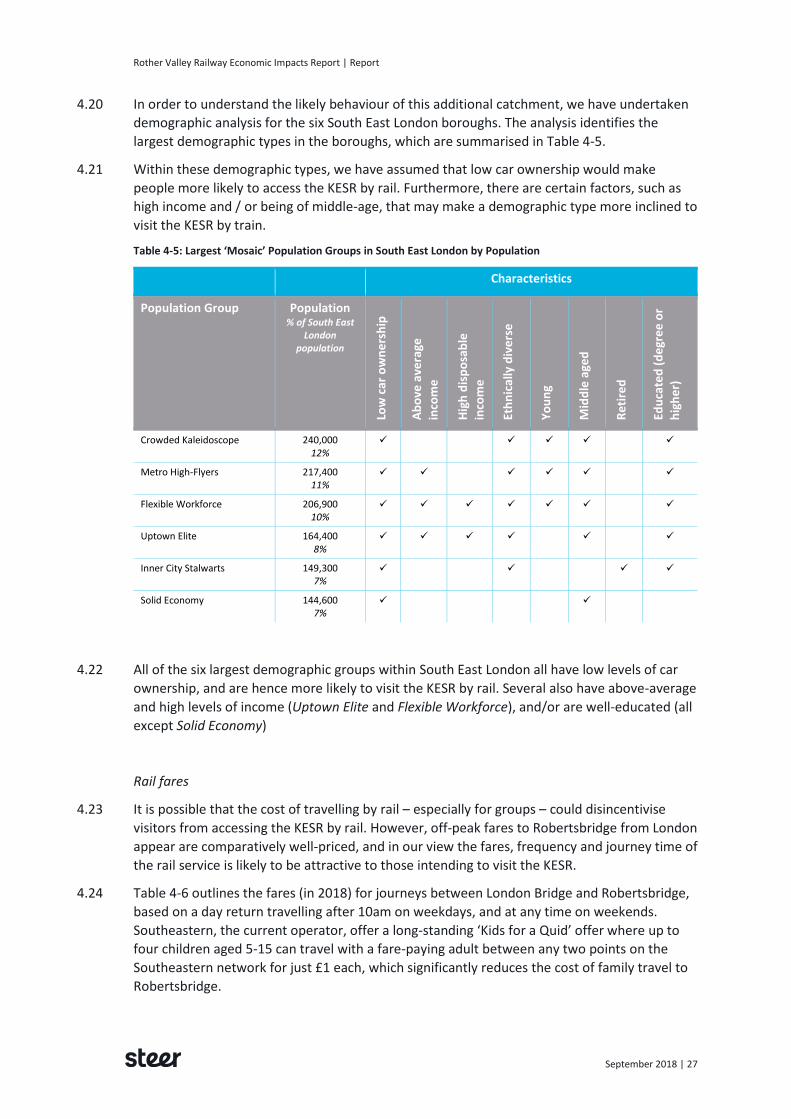
September 2018 | 27
4.20 In order to understand the likely behaviour of this additional catchment, we have undertaken
demographic analysis for the six South East London boroughs. The analysis identifies the
largest demographic types in the boroughs, which are summarised in Table 4-5.
4.21 Within these demographic types, we have assumed that low car ownership would make
people more likely to access the KESR by rail. Furthermore, there are certain factors, such as
high income and / or being of middle-age, that may make a demographic type more inclined to
visit the KESR by train.
Table 4-5: Largest ‘Mosaic’ Population Groups in South East London by Population
Characteristics
Population Group Population % of South East
London population
Low
car
ow
ne
rsh
ip
Ab
ove
ave
rage
inco
me
Hig
h d
isp
osa
ble
inco
me
Eth
nic
ally
div
ers
e
Yo
un
g
Mid
dle
age
d
Re
tire
d
Edu
cate
d (
de
gre
e o
r
hig
he
r)
Crowded Kaleidoscope 240,000 12%
✓ ✓ ✓ ✓ ✓
Metro High-Flyers 217,400 11%
✓ ✓ ✓ ✓ ✓ ✓
Flexible Workforce 206,900 10%
✓ ✓ ✓ ✓ ✓ ✓ ✓
Uptown Elite 164,400 8%
✓ ✓ ✓ ✓ ✓ ✓
Inner City Stalwarts 149,300 7%
✓ ✓ ✓ ✓
Solid Economy 144,600 7%
✓ ✓
4.22 All of the six largest demographic groups within South East London all have low levels of car
ownership, and are hence more likely to visit the KESR by rail. Several also have above-average
and high levels of income (Uptown Elite and Flexible Workforce), and/or are well-educated (all
except Solid Economy)
Rail fares
4.23 It is possible that the cost of travelling by rail – especially for groups – could disincentivise
visitors from accessing the KESR by rail. However, off-peak fares to Robertsbridge from London
appear are comparatively well-priced, and in our view the fares, frequency and journey time of
the rail service is likely to be attractive to those intending to visit the KESR.
4.24 Table 4-6 outlines the fares (in 2018) for journeys between London Bridge and Robertsbridge,
based on a day return travelling after 10am on weekdays, and at any time on weekends.
Southeastern, the current operator, offer a long-standing ‘Kids for a Quid’ offer where up to
four children aged 5-15 can travel with a fare-paying adult between any two points on the
Southeastern network for just £1 each, which significantly reduces the cost of family travel to
Robertsbridge.

Rother Valley Railway Economic Impacts Report | Report
September 2018 | 28
Table 4-6: Cost of Travel between London Terminals and Robertsbridge
Passengers Total Cost
Rail (Return Ticket)
One adult, no railcard £19.60
Two adults, no railcards £39.20
Two adults, two-together railcard or both holding Senior or 16-25 railcards
£25.90
Family, two adults, two children, no railcard £41.20
Family, two adults, two children, two-together railcard £27.90
Family, one adult, two children £21.60
Road
Approximate fuel cost, South East London to Robertsbridge (assuming 90 mile round-trip), 55 mpg
£9.70
Based on the Super Off-Peak Return between London Terminals and Robertsbridge, relevant railcard discounts, and ‘Kids for a Quid’ offers. Children less than 5 travel free. Note that rail travel for some groups will cheaper still, such as for those with ‘PRIV’ rail staff discounts (including retired staff) and those with existing season tickets (e.g. regular commuters from Hastings / Battle to London). Road costs based on a fuel cost of £1.30 per litre and average fuel consumption of 55mpg35.
4.25 Based on the above, we would expect the cost of travelling to the KESR by rail from London to
be competitive for a number of passengers, especially for those who do not have access to a
car and are, to an extent, reliant on the rail network for making longer-distance leisure trips.
Although the cost of travelling by rail is likely to be a larger deterrent for those who have
access to a car, rail is still likely to be attractive for some, and in particular where only one or
two people are travelling and the cost of rail is more competitive vis-à-vis car for the same
journey.
4.26 Therefore, the new London market opened up by the connection of the KESR to the national
rail network has the potential to be significant, and generate additional patronage for the
KESR.
Hastings / Battle
4.27 The other potential rail market is from the south, from the Hastings end of the route. The KESR
would be directly accessible by rail from Hastings and Battle and, via interchange, to locations
such as Brighton and Eastbourne.
4.28 This means that, for visitors to Hastings and Battle who travel by train, the KESR and Bodiam
Castle become viable and easily accessible (by rail) visitor attractions. This improved rail
connectivity could also encourage visitors by train to stay longer (and spend more) as the
range of visitor attractions that can be reached increases.
4.29 Since the population of Hastings and Battle is significantly substantially less than South East
London, and the area has higher car ownership, travel to KESR by rail is likely to be
35 Fuel costs: http://www.theaa.com/driving-advice/driving-costs/fuel-prices and average
consumption https://www.gov.uk/government/statistical-data-sets/env01-fuel-consumption accurate as of September 2018.

Rother Valley Railway Economic Impacts Report | Report
September 2018 | 29
proportionally lower. However, rail still may be an attractive option for those who do not have
access to a car or for whom the drive to Robertsbridge / Tenterden is unattractive.
Benchmarking of Comparable Schemes
4.30 There are a number of examples of Heritage Railways with links to the National Rail network in
England, as shown in Table 4-7.
Table 4-7: Comparable Heritage Railways
Name Route Location linked to National Rail
Bluebell Railway Sheffield Park to East Grinstead East Grinstead (2013) Southern
Bodmin & Wenford Railway Bodmin Parkway to Boscarne Junction Bodmin Parkway (1990) Great Western Railway
North Norfolk Railway Sheringham to Holt Sheringham (2010) Greater Anglia
North Yorkshire Moors Railway Pickering to Whitby At Whitby (2007) and Grosmont (1973) Northern
Spa Valley Railway Tunbridge Wells West to Eridge Eridge (2011) Southern
4.31 We have researched the history and context of these railways to determine if any can be
directly compared with the KESR. Of the five railways in Table 4-7, the Bluebell Railway is the
most similar to the KESR in terms of passenger numbers, proximity to London, a recent and
direct connection to the National Rail network, and the use of the track by a single operator.
4.32 In March 2013, the Bluebell Railway was extended by two miles from Kingscote to East
Grinstead where there is a connection with Southern Rail. Eighteen months later the Bluebell
Railway Preservation Society reported that the line had attracted 250,000 visitors in the year
to March 2014 – up from 190,000 in the same period the year before36. Of the additional
60,000 visitors, it is estimated that 84% (50,400) started their journey at East Grinstead37.
Therefore, in its first year, the new rail connection helped contribute to an overall 27% uplift in
demand.
4.33 Information obtained from the Bluebell Railway in 2018 suggests that overall visitor numbers
have reduced since 2013, suggesting the initial uplift following opening could be higher than
the longer-term demand effect.
4.34 However, in the years since the extension opened it has been estimated (based on information
supplied by the Bluebell Railway) that visitor demand accessing directly by rail at East
Grinstead has consistently been around 25,000 trips per annum, and that around a third of
overall visitors (by car and rail) also access from this station. The majority of the remainder
access by car or coach at Sheffield Park Bluebell Railway station.
36 Bluebell Railway extension attracts thousands more visitors, BBC News Sussex. Available online at http://www.bbc.co.uk/news/uk-england-sussex-28988650 and accessed 21st November 2014.
37 S. Satchell, ‘Bluebell Railway celebrates one year in East Grinstead - and 35,000 passengers’, East Grinstead Courier, 21st March 2014. Available online at http://www.eastgrinsteadcourier.co.uk/Building-fair-head-steam/story-20833056-detail/story.html and accessed 21st November 2014.

Rother Valley Railway Economic Impacts Report | Report
September 2018 | 30
4.35 One key factor contributing to the success of the new connection was the coordination of the
Bluebell Railway timetable with the arrivals and departures of national rail services
(particularly in relation to catered Pullman services). The knock-on effect is that visitors see
the potential value and ease of day trips or staying overnight, thereby boosting the local
economy. Since the timetable of the KESR is largely flexible (it is not constrained by other
services elsewhere), RVR services could be timed (and advertised) to connect to services to
London to maximise their attractiveness to visitors.
4.36 The journey time from London Victoria to East Grinstead is typically around 55 minutes, with a
half-hourly service. The journey time from London Bridge to Robertsbridge is 70 minutes with
an hourly direct service. While Robertsbridge services do operate less frequently and take
longer to reach London, they do serve Charing Cross, Waterloo East and London Bridge, and
are hence accessible to potential demand from these major London termini38.
Demand Uplift to KESR
4.37 We have made a ‘central’ assumption that the introduction of the RVR would result in an
overall increase of 15% in KESR demand, from a combination of opening up the new rail
market and providing an expanded catchment area for potential trips accessing by car.
4.38 It is difficult to accurately forecast the precise initial increase in patronage, in the absence of
specific information regarding individuals’ propensity to travel by rail to access heritage rail,
which would be extremely difficult to obtain. However, the access to an wholly untapped rail
market and increased road catchment with the RVR will undoubtedly open up KESR to
potential visitors who would not visit (or would visit less often) without the scheme. Hence,
the 15% figure is designed to be a prudent and reasonable estimate, based on our judgement,
and informed by the increase in the population catchment of the KESR, and the experience of
the Bluebell Railway.
4.39 This uplift equates to 13,300 trips per annum above the baseline KESR demand of 88,400. The
overall implied increase is lower than that observed on the Bluebell Railway, in recognition of
the fact that the longer-term visitor uplift is likely to be lower than that in the initial year or so
after opening.
4.40 We have made a secondary assumption that the proportion of the 15% uplift accessing via rail
would be 85%, with the remaining 15% by car. This assumption does not affect the assessment
of local visitor spend impacts, but does affect the assessment of transport impacts.
4.41 We assumed that, due to Tenterden being a larger town and the greater parking availability,
coaches would continue to access the KESR from Tenterden.
38 Limited peak-time services also operate direct to Cannon Street (via London Bridge)

Rother Valley Railway Economic Impacts Report | Report
September 2018 | 31
Additional Bodiam Castle Demand
4.42 Bodiam Castle is a major tourist attraction and attracts 176,000 visitors per year39. The Rother
Valley Railway offers two significant potential benefits: first, the missing link would connect
Bodiam to the national rail network. This would expand the effective catchment of the
attraction in the same manner as described above for the KESR. While there would be a time
and cost impact associated with using the Rother Valley Railway/KESR to access Bodiam that
may deter some (for example whose primary purpose is to visit Bodiam), for others the ability
to access a historic site via a heritage railway would increase the attractiveness of the
experience at Bodiam.
4.43 We have assumed a ‘central case’ uplift of 5% in Bodiam Castle annual demand, based on the
significantly improved accessibility of Bodiam for those without access to a car, representing
8,800 additional trips per annum.
4.44 In addition to attracting additional demand, the Rother Valley Railway could also encourage
some existing users to transfer from car (the predominant access mode at present) to rail.
This would not affect the overall visitor numbers and economic benefits, but would affect the
transport impacts. We identify these in Chapter 5.
Estimate of Additional Visitor Demand – Summary
4.45 A summary of our estimated increase in local visitor demand is presented in Table 4-8.
Table 4-8: Summary of Additional Visitor Demand arising from the Rother Valley Railway
Demand Estimate Assumption Value (Visitors per annum)
Base Demand
Base demand - KESR Total KESR demand 88,400
Additional Demand
Increased KESR demand + 15% of base KESR demand. From new rail market and expanded road catchment
13,300
Increase in Bodiam Castle trips +5% in overall trips to Bodiam Castle 8,800
Total initial additional demand (central) (prior to expansion of KESR facilities)
22,000
4.46 Our central case forecast is for an increase in visitor numbers to the local area of 22,000 as a
result of the Rother Valley Railway ‘missing link’. This represents an overall increase of 25%
above current KESR demand. The majority of which arises from the new rail-based market
that is created from the new connection at Robertsbridge. This forecast is used to assess the
local economic impacts in the remainder of this chapter.
4.47 For the economic analysis, we have prepared forecasts for the ‘central case’ assumptions,
together with a range estimate based on a +/-30% change in visitor demand around the
‘central case’. This reflects the inherent uncertainty in forecasting future KESR demand.
39 Association of Leading Visitor Attractions, Visits Made in 2017. Accessed online at http://www.alva.org.uk/details.cfm?p=423 on 06 June 2018.
Rother Valley Railway Economic Impacts Report | Report
September 2018 | 32
Realising Additional Visitor Demand Potential
4.48 The realisation of additional demand would be enabled by initiatives to publicise and market
the railway.
4.49 There are significant marketing, ticketing and branding opportunities that can support the
development of visitor demand for the KESR. Here the connection of the Rother Valley Railway
to the national rail network, and the enhanced connectivity it provides to a range of tourist
destinations, creates opportunities to promote the KESR and maximise the overall demand
potential of the Rother Valley Railway. These include:
• Area-wide branding (e.g. 1066 Country);
• Specific integrated/combined offer with other local attractions;
• Marketing and ticketing initiatives with Southeastern (the London-Hastings line rail
operator);
• Creating a visible presence on social media platforms; and
• Providing the opportunity to book tickets online.
4.50 The report on the value of heritage railways produced by the All Party Parliamentary Group on
Heritage Rail in 201340 highlighted the increasing role of the internet and social media as
marketing tools.
Combined Ticket Offers
4.51 There are a number of examples of joint ticketing by heritage railways where collaborations
have been sought with local attractions, businesses and train operating companies. These
include:
• The Bodmin and Wenford Railway operate a combined ticket deal with Great Western
Railway, where passengers can travel from any station in Cornwall or Plymouth through to
Bodmin General and Boscarne Junction for a fixed price41;
• The Spa Valley Railway offer a joint discounted ticket combining travel on the railway with
entry to Groombridge Place, a historic garden and country estate42;
• The Bluebell Railway offer three hotel packages in conjunction with businesses along the
route, typically include a night’s Bed and Breakfast, two days unlimited travel on the
railway, and admission to one or more local attractions43.
40 All Party Parliamentary Group on Heritage Rail: Report on the Value of Heritage Railways. July 2013.
(https://static1.squarespace.com/static/59f1c5ec51a58457c01eaed0/t/5a981e4df9619ac0c9af0d07/1519918675675/Value-of-heritage-rail.pdf)
41 Details of Bodmin and Wenford ticket offer: http://bodminrailway.co.uk/inclusive-ticketing
42 Details of Spa Valley Railway offer: https://www.spavalleyrailway.co.uk/product.php/57/Groombridge-Place-&-Train-Combined-Tickets
43 Details of Bluebell Railway offer: https://www.bluebell-railway.com/whats_on/sheffield-park-hotel-package/
Rother Valley Railway Economic Impacts Report | Report
September 2018 | 33
Economic Benefits of Additional Visitor Demand
4.52 We have estimated the local economic benefits from increased tourism expenditure due to
greater visitor demand. For the purposes of this analysis we have defined the study area as
Rother District.
Approach to Measuring the Economic Impact
4.53 The benefits are based on measuring the following effects as described in Section 3:
• Direct expenditure;
• Indirect expenditure; and
• Induced expenditure.
4.54 The direct expenditure has been estimated based on the assumed additional number of
visitors to the area and the typical ‘spend per day’ for visitors.
4.55 The indirect and induced spend is estimated using an economic multiplier, which provides a
measure of the uplift to direct impacts and thereby an estimate of the total local economic
impact.
Estimate of Economic Impact
Visitor Expenditure Per Trip
4.56 We have estimated additional visitor expenditure based on the average spend per trip for UK-
based day trip and overnight trips, as the vast majority of additional visitors to the KESR would
be domestic. Overseas visitors have a greater level of spend per day, so we have adopted a
conservative approach by estimating impacts based on UK visitors only.
4.57 We have estimated the overall spend per trip to be £42.55 (2018 prices)44, assuming:
• An average spend per person of £30.00 (2016 prices) for day trip visitors, based on the
2016 Visit Britain GB Day Visitor Survey. This is considered prudent since:
• it is less than the spend per trip for a tourism day visit to England and South East
England (£34.38 and £35.55 respectively); and
• while it is greater than the figure for Rother (£19.23), this is reflective of how the
£19.23 figure represents an average of all tourism day visits to Rother, including trips
visiting friends or family or outdoor pursuits such as walking or cycling, for which both
the main activity is effectively ‘free’. In the case of visiting the KESR, visitors will (by
definition) be spending £10 – £20 on visiting the railway itself, in addition to that spent
on local facilities and attractions (such as Bodiam Castle and/or local pubs and
restaurants) and on travel to/from Rother, and hence the average spend per visit will
inevitably be greater.
• An average spend per person of £174.89 (2016 prices) for overnight visits, based on the
average spend per ‘holiday’ visit to Rother from the Visit Britain GB Tourism Survey 2016.
Based on an average number of nights per visit of 4.1, sourced from the survey, this implies
an average spend per day of £42.48;
44 Data sources for the visitor spent assumption are in 2016 prices. This figure has been uplifted to 2018 prices using CPI.

Rother Valley Railway Economic Impacts Report | Report
September 2018 | 34
• 93% of domestic visitors being ‘day trip’ visits and 7% being overnight, based on the ratio
between the number of tourism day visits and the number of overnight holiday tourism
visits to Rother from the Visit Britain surveys.
Indirect and Induced Impacts Multiplier Rate
4.58 Previous research has been undertaken exploring the impacts of tourism expenditure on the
local economies. Tourism South East previously employed an economic model to forecast the
economic impacts of tourism45. The model estimated direct, indirect and induced impacts, and
has previously been applied to estimate the economic impacts of tourism in the Rother District
in 2012 and 201546.
4.59 The 2015 report estimated that direct expenditure on tourism in 2015 was £238 million, with
total expenditure (allowing for indirect and induced effects) of £292 million, suggesting an
economic multiplier rate of 1.22.
4.60 Although this figure is based on previous, 2015, analysis, since it is based on a bespoke tourism
model applied specifically to Rother district, it forms the most robust tourism multiplier with
which to estimate the economic benefits of the RVR, and hence we have adopted this rate for
our analysis.
4.61 Notably, this rate benchmarks closely against other comparable multipliers, developed from
more recent data but within different contexts:
• Research by Oxford Econometrics, on behalf of the Heritage Lottery Fund47, estimated the
total spend and subsequent value-added contribution (including indirect and induced
effects) of heritage tourism, such as castles, galleries and museums, in 2015. It estimated
that, for every £100 of gross value-added generated by the heritage tourism industry, a
£130 gross value-added contribution is supported elsewhere in the economy through
purchases of goods and services and staff wages – equivalent to a multiplier of 1.30;
• The Homes and Communities Agency / Ministry of Housing, Communities and Local
Government 2014 Additionality Guide (4th edition)48, currently used for estimating the
economic benefits of central government investment, provides a local multiplier of 1.38 for
private-sector ‘recreation’ investments, which increases to 1.56 at the regional level.
45 Cambridge Tourism Economic Impact Model or ‘Cambridge Model’; a computer-based model developed by Geoff Broom Associates and the Regional Tourist Boards of England.
46 The Economic Impact of Tourism on Rother 2012, Tourism South East Research Unit; The Economic Impact of Tourism on Rother 2015, Tourism South East Research Unit.
47 The Impact of Heritage Tourism for the UK Economy, Heritage Lottery Fund, August 2016. Available at: https://www.hlf.org.uk/economic-impact-uk-heritage-tourism-economy
48 Available at: https://assets.publishing.service.gov.uk/government/uploads/system/uploads/attachment_data/file/378177/additionality_guide_2014_full.pdf
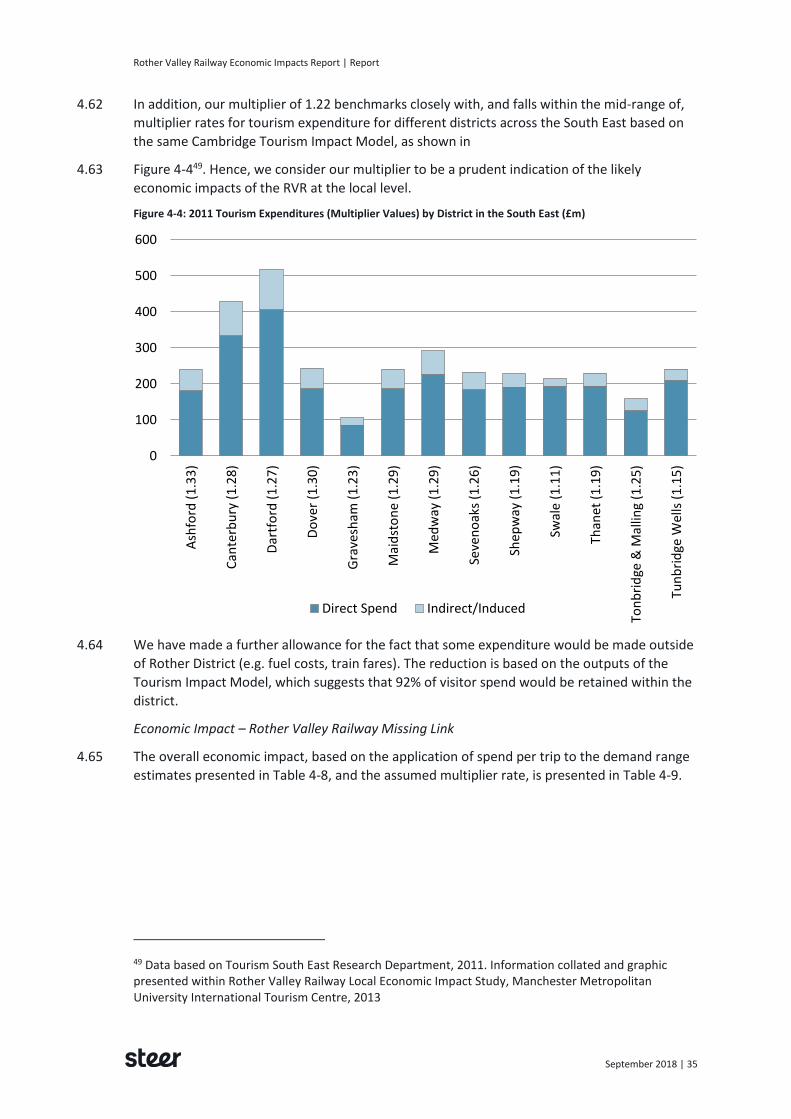
Rother Valley Railway Economic Impacts Report | Report
September 2018 | 35
4.62 In addition, our multiplier of 1.22 benchmarks closely with, and falls within the mid-range of,
multiplier rates for tourism expenditure for different districts across the South East based on
the same Cambridge Tourism Impact Model, as shown in
4.63 Figure 4-449. Hence, we consider our multiplier to be a prudent indication of the likely
economic impacts of the RVR at the local level.
Figure 4-4: 2011 Tourism Expenditures (Multiplier Values) by District in the South East (£m)
4.64 We have made a further allowance for the fact that some expenditure would be made outside
of Rother District (e.g. fuel costs, train fares). The reduction is based on the outputs of the
Tourism Impact Model, which suggests that 92% of visitor spend would be retained within the
district.
Economic Impact – Rother Valley Railway Missing Link
4.65 The overall economic impact, based on the application of spend per trip to the demand range
estimates presented in Table 4-8, and the assumed multiplier rate, is presented in Table 4-9.
49 Data based on Tourism South East Research Department, 2011. Information collated and graphic presented within Rother Valley Railway Local Economic Impact Study, Manchester Metropolitan University International Tourism Centre, 2013
0
100
200
300
400
500
600
Ash
ford
(1
.33
)
Can
terb
ury
(1
.28
)
Dar
tfo
rd (
1.2
7)
Do
ver
(1.3
0)
Gra
vesh
am (
1.2
3)
Mai
dst
on
e (1
.29
)
Med
way
(1
.29
)
Seve
no
aks
(1.2
6)
She
pw
ay (
1.1
9)
Swal
e (1
.11
)
Than
et (
1.1
9)
Ton
bri
dge
& M
allin
g (1
.25
)
Tun
bri
dge
Wel
ls (
1.1
5)
Direct Spend Indirect/Induced

Rother Valley Railway Economic Impacts Report | Report
September 2018 | 36
Table 4-9: Initial Economic Impact of the Rother Valley Railway (2018 prices)
Low Central High Notes
Additional KESR Trips 15,400 22,000 28,600
Additional direct effect £ p.a.
£656,400 £937,700 £1,220,000 Based on £42.55 per visitor
Total economic effect £ p.a.
£803,900 £1,148,400 £1,493,000 Based on multiplier of 1.22
Total economic effect - Rother District £ p.a.
£742,700 £1,061,000 £1,379,300 92% of total
4.66 The total annual economic effect of additional visitor trips to Rother is therefore forecast to be
within the range of £740,000 to £1.38 million per annum, with a central estimate of £1.06
million (all 2018 prices) for the initial years after the link is completed. The two main drivers of
the overall scale of benefits are:
• the assumed uplift in rail-based demand from the Rother Valley Railway; and
• the value of the multiplier used to estimate the overall economic impact from the direct
expenditure effect.
4.67 In respect to each of these drivers, we have adopted a prudent estimate within our ‘central
case’ forecast, with a ‘bottom-up’ uplift in rail demand benchmarked against the experience of
the Bluebell Railway, and a conservative multiplier rate based on local evidence and
benchmarked against other, recent, academic work.
Additional Benefits – Potential Upsides
4.68 The estimate above is based on prudent assumptions on the level of economic impact. There
are several ways in which the potential impact could be greater than the figures above. These
include:
• Encouraging longer stays – the Rother Valley Railway would link up a number of tourism
attractions – from Hastings and Battle through to Robertsbridge, and then via the KESR to
Tenterden – which would be readily accessible by rail. The ability to visit multiple
attractions by rail may encourage more staying trips (with higher per trip expenditures) and
fewer shorter stay trips;
• Higher spend per trip for rail users – evidence suggests that spend by tourists who travel
by rail is around 10% higher than that of car users50. A 10% increase in spend per person
(also a proxy for longer-stays) would increase the economic benefits from the central case
estimate of £1.06m per annum to £1.17m;
• Higher multiplier – the multiplier we have employed for this study is considered prudent. If
a multiplier rate of 1.38 were used (based on the local multiplier rate in the Homes and
Communities Agency / Ministry of Housing, Communities and Local Government 2014
Additionality Guide) then the central case benefits would increase from £1.06m to £1.20m
per annum.
Sensitivity Tests
4.69 We have undertaken a number of sensitivity tests to show the sensitivity of the forecast visitor
impact assessment to key assumptions. These are presented in Table 4-10.
50 The GB Tourist Statistics 2012, Table 2.1, p41 (spend/trip). VisitScotland, Visit Wales, VisitEngland.

Rother Valley Railway Economic Impacts Report | Report
September 2018 | 37
Table 4-10: Visitor Impact Sensitivity Tests (2018 prices)
Economic
Impact % change from
central case Note - central case assumption
Central case £1,061,000
Uplift for new KESR visitor trips - 10% £848,300 -20% 15% visitor uplift
Uplift for new KESR visitor trips - 20% £1,273,800 +20% 15% visitor uplift
Bodiam Castle uplift - 0% £638,300 -40% 5% visitor uplift
Bodiam Castle uplift - 10% £1,483,700 +40% 5% visitor uplift
4.70 The tests show that the overall scale of benefit is sensitive to assumptions around the impact
of the new rail connection at Robertsbridge on developing a new rail-based market for both
the KESR and Bodiam Castle. However, even using conservative forecasts for the new rail
market (a 10% uplift in KESR visitor trips versus a central case of 15%, or an assumption of no
additional demand at Bodiam), the overall economic impact from visitor trips would be
between £640,000 and £850,000 per annum.
The KESR Investment Plan
4.71 The visitor demand forecasts presented above are based on the likely impact of the new
Rother Valley Railway link only. The expectation of the KESR is to increase visitor numbers
significantly, from the current 88,000 to between 150,000 and 200,000 visitor trips per annum.
4.72 This would be supported by additional investment in the railway, predicated on the
implementation of the RVR. As such, the view of KESR is that the RVR would be the vital
catalyst that would support the development of a future investment plan and, in turn, help
deliver increased visitor numbers in line with the KESR’s ambition. As the investment would be
largely dependent on the RVR, the expenditure plan is not fully committed.
4.73 The plan would support initiatives such as:
• More ‘special’ events (e.g. Day out with Thomas), in particular utilizing the potential for
events at Robertsbridge;
• New events, such as training, history and farming events;
• A “working vintage” railway museum, with training facilities and provision for
apprenticeships for local young people; and
• Extensive marketing
4.74 This report considers both the impact of the Rother Valley Railway as a ‘stand-alone’ scheme,
and the overall economic impact of the KESR’s ‘end state’ expectation to grow overall
passenger numbers to a level between 150,000 and 200,000 visitors per annum, in line with
the Investment Plan.
4.75 It should be noted whilst these impacts cannot be fully attributable to Rother Valley Railway,
the step-change in demand for the KESR can only be delivered if the RVR is in place.
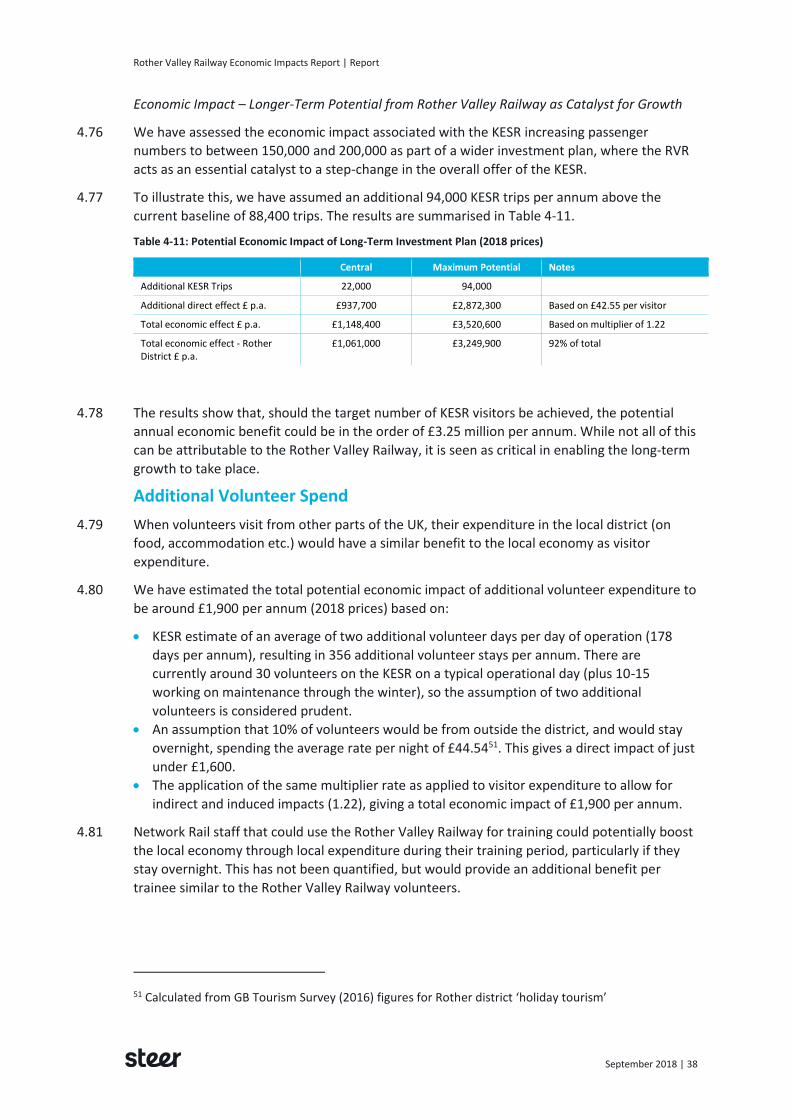
Rother Valley Railway Economic Impacts Report | Report
September 2018 | 38
Economic Impact – Longer-Term Potential from Rother Valley Railway as Catalyst for Growth
4.76 We have assessed the economic impact associated with the KESR increasing passenger
numbers to between 150,000 and 200,000 as part of a wider investment plan, where the RVR
acts as an essential catalyst to a step-change in the overall offer of the KESR.
4.77 To illustrate this, we have assumed an additional 94,000 KESR trips per annum above the
current baseline of 88,400 trips. The results are summarised in Table 4-11.
Table 4-11: Potential Economic Impact of Long-Term Investment Plan (2018 prices)
Central Maximum Potential Notes
Additional KESR Trips 22,000 94,000
Additional direct effect £ p.a. £937,700 £2,872,300 Based on £42.55 per visitor
Total economic effect £ p.a. £1,148,400 £3,520,600 Based on multiplier of 1.22
Total economic effect - Rother District £ p.a.
£1,061,000 £3,249,900 92% of total
4.78 The results show that, should the target number of KESR visitors be achieved, the potential
annual economic benefit could be in the order of £3.25 million per annum. While not all of this
can be attributable to the Rother Valley Railway, it is seen as critical in enabling the long-term
growth to take place.
Additional Volunteer Spend
4.79 When volunteers visit from other parts of the UK, their expenditure in the local district (on
food, accommodation etc.) would have a similar benefit to the local economy as visitor
expenditure.
4.80 We have estimated the total potential economic impact of additional volunteer expenditure to
be around £1,900 per annum (2018 prices) based on:
• KESR estimate of an average of two additional volunteer days per day of operation (178
days per annum), resulting in 356 additional volunteer stays per annum. There are
currently around 30 volunteers on the KESR on a typical operational day (plus 10-15
working on maintenance through the winter), so the assumption of two additional
volunteers is considered prudent.
• An assumption that 10% of volunteers would be from outside the district, and would stay
overnight, spending the average rate per night of £44.5451. This gives a direct impact of just
under £1,600.
• The application of the same multiplier rate as applied to visitor expenditure to allow for
indirect and induced impacts (1.22), giving a total economic impact of £1,900 per annum.
4.81 Network Rail staff that could use the Rother Valley Railway for training could potentially boost
the local economy through local expenditure during their training period, particularly if they
stay overnight. This has not been quantified, but would provide an additional benefit per
trainee similar to the Rother Valley Railway volunteers.
51 Calculated from GB Tourism Survey (2016) figures for Rother district ‘holiday tourism’
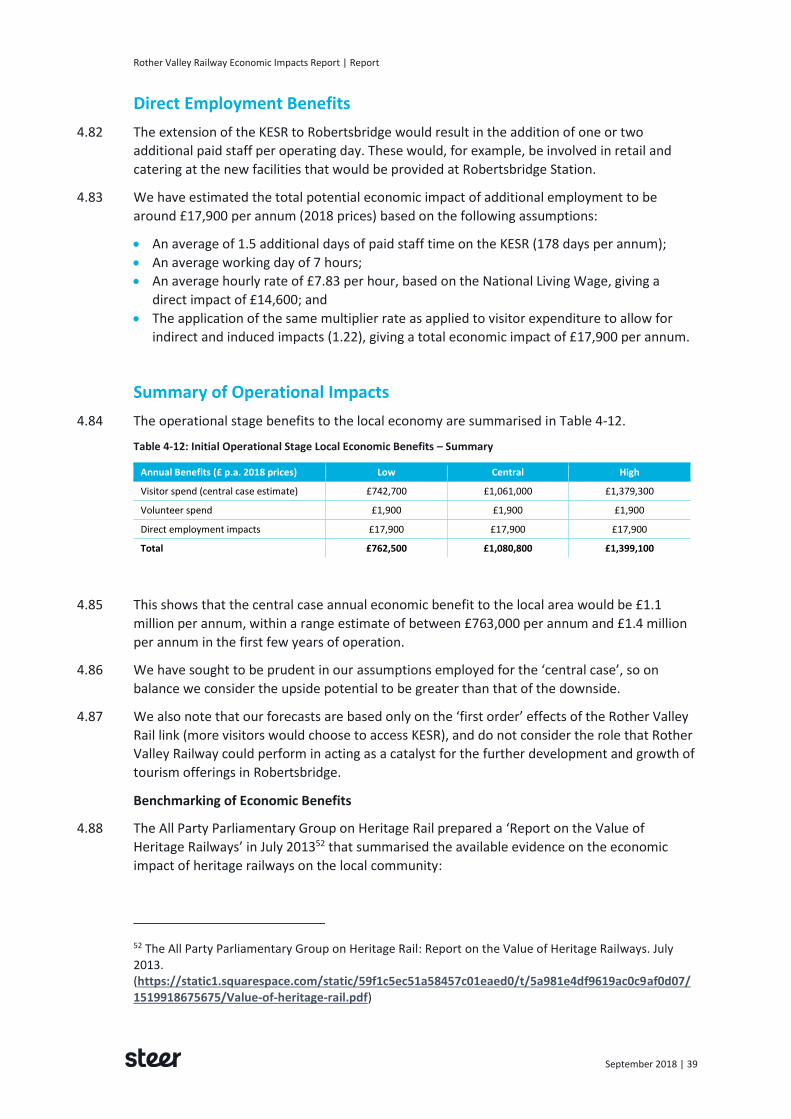
Rother Valley Railway Economic Impacts Report | Report
September 2018 | 39
Direct Employment Benefits
4.82 The extension of the KESR to Robertsbridge would result in the addition of one or two
additional paid staff per operating day. These would, for example, be involved in retail and
catering at the new facilities that would be provided at Robertsbridge Station.
4.83 We have estimated the total potential economic impact of additional employment to be
around £17,900 per annum (2018 prices) based on the following assumptions:
• An average of 1.5 additional days of paid staff time on the KESR (178 days per annum);
• An average working day of 7 hours;
• An average hourly rate of £7.83 per hour, based on the National Living Wage, giving a
direct impact of £14,600; and
• The application of the same multiplier rate as applied to visitor expenditure to allow for
indirect and induced impacts (1.22), giving a total economic impact of £17,900 per annum.
Summary of Operational Impacts
4.84 The operational stage benefits to the local economy are summarised in Table 4-12.
Table 4-12: Initial Operational Stage Local Economic Benefits – Summary
Annual Benefits (£ p.a. 2018 prices) Low Central High
Visitor spend (central case estimate) £742,700 £1,061,000 £1,379,300
Volunteer spend £1,900 £1,900 £1,900
Direct employment impacts £17,900 £17,900 £17,900
Total £762,500 £1,080,800 £1,399,100
4.85 This shows that the central case annual economic benefit to the local area would be £1.1
million per annum, within a range estimate of between £763,000 per annum and £1.4 million
per annum in the first few years of operation.
4.86 We have sought to be prudent in our assumptions employed for the ‘central case’, so on
balance we consider the upside potential to be greater than that of the downside.
4.87 We also note that our forecasts are based only on the ‘first order’ effects of the Rother Valley
Rail link (more visitors would choose to access KESR), and do not consider the role that Rother
Valley Railway could perform in acting as a catalyst for the further development and growth of
tourism offerings in Robertsbridge.
Benchmarking of Economic Benefits
4.88 The All Party Parliamentary Group on Heritage Rail prepared a ‘Report on the Value of
Heritage Railways’ in July 201352 that summarised the available evidence on the economic
impact of heritage railways on the local community:
52 The All Party Parliamentary Group on Heritage Rail: Report on the Value of Heritage Railways. July 2013. (https://static1.squarespace.com/static/59f1c5ec51a58457c01eaed0/t/5a981e4df9619ac0c9af0d07/1519918675675/Value-of-heritage-rail.pdf)

Rother Valley Railway Economic Impacts Report | Report
September 2018 | 40
“In order to assess the local economic impact of heritage railways more specifically, the ratio of the estimated economic value to the organisation’s turnover was calculated. These indicate that for every £1 that is spent on the railway, a mean average figure of £2.71 is added to the local economy.” All Party Parliamentary Group on Heritage Rail: Report on the Value of Heritage Railways, page 17
4.89 The evidence for individual heritage railways is presented in Table 4-13.
Table 4-13: Local Economic Impact of Heritage Railways - Benchmarks
Heritage Railway Annual turnover (£) Economic value Economic value to turnover ratio
Ffestiniog and Welsh Highland Railway
£4,994,000 £4,200,000 0.8
West Somerset Railway £2,670,000 £5,000,000 1.9
Severn Valley Railway £5,372,000 £10,350,000 2.1
North York Moors Railway £5,000,000 £30,000,000 6.0
Average 2.7
Note – Table replicated from Parliamentary Group Report into Heritage Railways
Comparison with Rother Valley Railway
4.90 The figures presented by the Parliamentary Group are derived from the ratio between the
local economic impacts of the heritage railway in question and their annual turnover. This
compares to the approach we have adopted, which develops a ‘bottom-up’ estimate of the
economic impact of the RVR based on the average spend per additional visitor in the local
economy and the application of a suitable multiplier.
4.91 Comparison with the approach adopted by the Parliamentary Group therefore forms a useful
benchmark against our estimate of the benefits of the RVR. To provide a suitable benchmark,
we have forecast the incremental KESR revenues based on the additional forecast usage with
the Rother Valley Railway scheme. This has been estimated based on estimating the average
future yield per regular (i.e. non-special event) passenger as set out in Table 4-14, sourced
from 201 KESR data and uplifted to reflect future ticket prices and for inflation. The average
fare yield is less than the full ticket price, as concession and ‘short hop’ tickets are also sold.
Table 4-14: Yield per Passenger
2014 data (2014 prices)
Future (with RVR - forecast)
(2018 prices)
Approach
Full ticket price £16.00 20.00 Assumption for ticket price increase provided by KESR
Passenger fare yield (a) £10.20 £12.75 New fare yield is same % of full ticket price as previous
Catering (b) £3.73 £3.96 Uplifted by CPI
Retail / shops (c) £1.35 £1.43 Uplifted by CPI
Total revenue per passenger (a + b + c)
15.28 18.14

Rother Valley Railway Economic Impacts Report | Report
September 2018 | 41
4.92 With the Rother Valley Railway in place, the ticket price is estimated to increase to £20, with
the total revenue per passenger (including catering and retail) increasing to £18.14 (2018
prices).
4.93 Based on this we have estimated the additional forecast KESR turnover, alongside the
incremental economic value, to estimate the ‘Economic Value to Turnover Ratio’, as set out in
Table 4-15, to benchmark against the figures of other heritage railways set out in Table 4-12.
The implicit assumption is that the impact of the higher single fare on demand for the KESR (a
higher fare, in isolation, would be expected to result in fewer visitors) would be offset by an
increase resulting from the greater attractiveness of the KESR with the restored link.
Table 4-15: Rother Valley Railway Initial Economic Value to Turnover Ratio
Input / assumption Value
Additional trips 22,000
Yield per trip £18.14
Additional turnover (a) £399,800
Additional economic value (b) £1,080,00
Economic Value to Turnover Ratio (b/a) 2.70
4.94 The ‘Economic Value to Turnover Ratio’ for the Rother Valley Railway, based on the ratio
between the forecast local economic impact of the RVR and the increase in KESR turnover, is
2.70. This figure falls within the range values reported by the Parliamentary Group (as set out
in Table 4-13), and is equivalent to the average.
4.95 This provides an additional sense-check and level of confidence in the ‘central case’ numbers
in this report, confirming that the local economic impact forecast for each additional
passenger is robust and proportionate.

Rother Valley Railway Economic Impacts Report | Report
September 2018 | 42
Benefits to the Local Economy – Construction Stage
4.96 The construction of the Rother Valley Railway missing link is expected to cost around £5.3
million53, or £4.8 million excluding land acquisition, and to support 34 FTEs per year over the
18 - 24 month construction period. Construction would involve direct expenditure on local
contractors and labour, resulting in indirect effects through the supply chain and induced
effects through an increase in household expenditure.
4.97 Estimating the precise economic impact of construction expenditure on the local economy is
difficult, as it is dependent on the exact nature of these indirect and induced effects, together
with the extent to which construction expenditure is retained within the local economy. The
Homes and Communities Agency Additionality Guide (4th edition, 2014) outlines a set of
multipliers, intended to illustrate the potential economic impact of local investments,
including through construction. These are greatest the larger the area over which the benefits
of an intervention are being assessed:
• Across the national economy, research by Oxford Econometrics based on ONS input-output
data provides a composite multiplier of 2.7 for construction (Additionality Guide p35 Table
4.11);
• Within the ‘regional’ and ‘sub-regional” economy, the Additionality Guide provides a
multiplier of 1.40 and 1.33 respectively for “regeneration through physical infrastructure”,
which is likely to be comparable to the construction impacts associated with the RVR.
4.98 Applying these multipliers to the total construction spend for the Rother Valley Railway
provides the following wider benefits at the national, regional and local level, as set out in
Table 4-16 below.
Table 4-16: Construction Impacts (2018 prices)
Criteria Value / Assumption
Direct construction spend (excluding land acquisition) £4.88 million
UK multiplier rate 2.70
Total UK construction impact £13.16 million
Regional multiplier rate 1.40
Regional construction impact £6.83 million
Local multiplier rate 1.33
Local construction impact (Rother district) £6.48 million
4.99 The overall economic impact of construction to the UK economy is estimated at £13.16 million
over the construction period, of which an estimated £6.48 million will accrue within the local
area and Rother district.
Summary of Local Economic Impacts
The local economic impacts of the RVR are summarised in Table 4-17. All impacts have been
converted to 2018 prices, using ONS CPI indices.
53 Sourced from the 2017 Statement of Costs within the TWA application

Rother Valley Railway Economic Impacts Report | Report
September 2018 | 43
Table 4-17: Summary of Initial Local Economic Impacts (2018 Prices)
Impact Value (£) Units
Construction phase £6,484,400 £, 2018 prices. Total benefit over course of construction phase
Operational phase:
Visitor spend £1,061,000 £ per annum, 2018
Volunteer spend £1,900 £ per annum, 2018
Direct employment impacts £17,900 £ per annum, 2018
Total operational impacts £1,080,800 £ per annum, 2018
Profile of Benefits over Construction Phase and 10 Years of Operation
4.100 The table above shows the total construction phase impacts and the annual operational
impacts. The profile of benefits over the two-year construction phase and a ten-year
operational phase has been forecast based on these figures.
4.101 In addition, we have provided a forecast of additional local economic benefits that would
accrue on the basis that the RVR is being implemented alongside a wider investment
programme that has a medium-term objective of increasing total annual KESR visitor numbers
to 150,000 – 200,000 by 2030.
4.102 We have separately identified the demand uplift and associated economic benefits that are
attributable to the RVR, from the additional potential benefits that would be delivered by a
medium-term KESR investment. It has been assumed for this assessment that the investment
programme – enabled by the RVR but not directly attributable to it – generates an additional
8,000 visitors per year from 2022, with total visitors increasing to around 180,000 by 2030.
4.103 The assumed KESR demand profile is shown in Figure 4-5 overleaf.
Figure 4-5: KESR Demand Profile
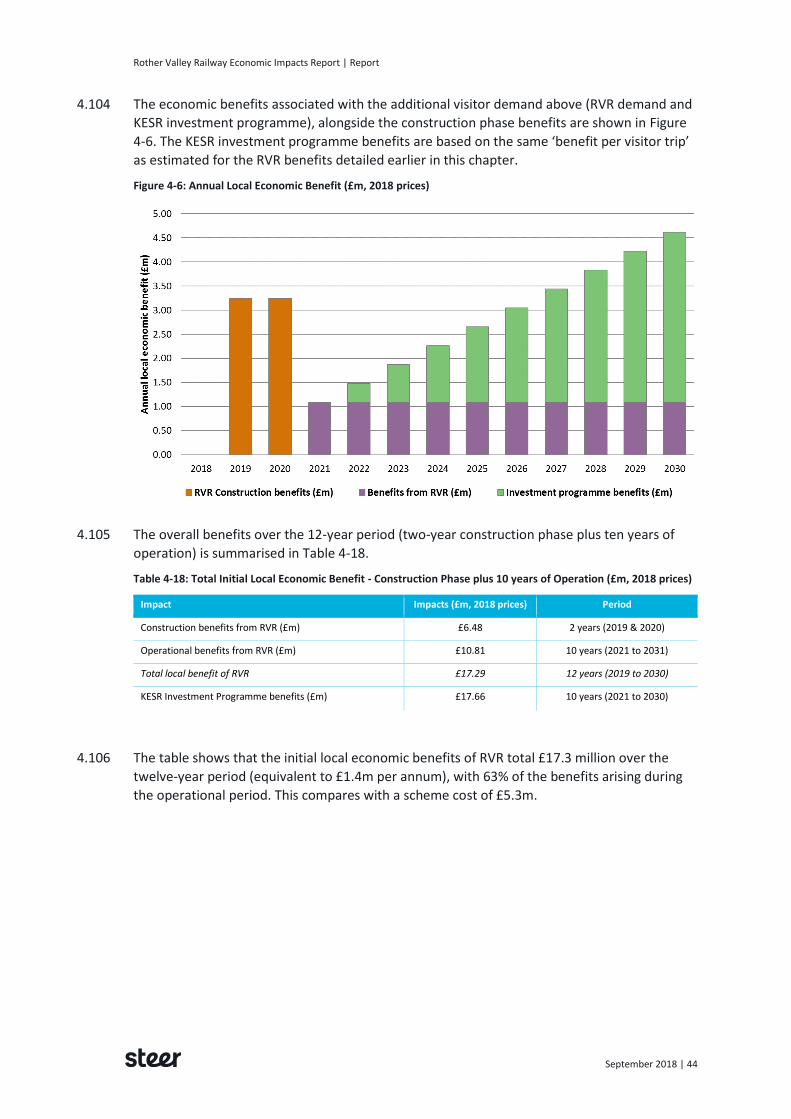
Rother Valley Railway Economic Impacts Report | Report
September 2018 | 44
4.104 The economic benefits associated with the additional visitor demand above (RVR demand and
KESR investment programme), alongside the construction phase benefits are shown in Figure
4-6. The KESR investment programme benefits are based on the same ‘benefit per visitor trip’
as estimated for the RVR benefits detailed earlier in this chapter.
Figure 4-6: Annual Local Economic Benefit (£m, 2018 prices)
4.105 The overall benefits over the 12-year period (two-year construction phase plus ten years of
operation) is summarised in Table 4-18.
Table 4-18: Total Initial Local Economic Benefit - Construction Phase plus 10 years of Operation (£m, 2018 prices)
Impact Impacts (£m, 2018 prices) Period
Construction benefits from RVR (£m) £6.48 2 years (2019 & 2020)
Operational benefits from RVR (£m) £10.81 10 years (2021 to 2031)
Total local benefit of RVR £17.29 12 years (2019 to 2030)
KESR Investment Programme benefits (£m) £17.66 10 years (2021 to 2030)
4.106 The table shows that the initial local economic benefits of RVR total £17.3 million over the
twelve-year period (equivalent to £1.4m per annum), with 63% of the benefits arising during
the operational period. This compares with a scheme cost of £5.3m.

Rother Valley Railway Economic Impacts Report | Report
September 2018 | 45
Overview
5.1 There are two potential impacts of the scheme on car travel described below.
1. Level Crossing Impacts (disbenefits)
• Disbenefits to highway traffic resulting from the implementation of the level crossings on
the A21 and B2244. A separate analysis has been undertaken by Mott MacDonald to assess
and quantify these disbenefits.
2. Impacts on the highway network resulting from a change in car mileage
• Potential benefits from reduced congestion and accidents as ‘existing’ car-based visitors
transfer to access the KESR at Robertsbridge rather than Tenterden. The benefits derive
from reduced vehicle miles being travelled on the network as visitors access the new
station that is located closer/on a more direct route.
• Potential congestion from any additional (new) car-based visitor trips that are attracted to
KESR by the ability to access at Robertsbridge rather than Tenterden.
• Potential benefits from any modal shift of current car-based visitors to rail.
Level Crossing Impacts
5.2 Mott MacDonald has undertaken an analysis of highway disbenefits during a six-month
operational season (March, April, May, June, September and October). The analysis includes
weekdays and weekends, but excludes bank holidays, effectively adopting 179 days of
operations per annum.
5.3 The analysis uses the traffic flow data and calculates the time disbenefit that results from the
proposed level crossings on the A21 and B2244 operating once per hour per direction per day
(16 closures), between the hours of 10:00 and 18:00.
5.4 The results were prepared for two scenarios - a 51 second closure time and a 112 second
closure time.
Table 5-1: Level Crossings – Highway Disbenefits
51 second closure 112 second closure
Delay - Vehicle Hours
A21 143.9 315.8
B2244 35.4 77.9
Total 179.3 393.7
5 Transport Related Economic Impacts
Rother Valley Railway Economic Impacts Report | Report
September 2018 | 46
Monetary Disbenefit (£, 2018 prices)
Uplifted using CPI from values provided by Mott MacDonald
A21 £2,287 £5,023
B2244 £566 £1,244
Total £2,854 £6,267
5.5 The analysis undertaken suggests that the overall disbenefit per year is between £2,900 and
£6,300, depending on the length of level crossing closure.
5.6 Despite this, timing of the level crossing closures due to operations on the Rother Valley
Railway are likely to be primarily in August, and during inter- peak periods on the highways,
such that major delays during commuting periods would be avoided.
Highway Impacts from Change in Car Kilometres Travelled
Transfer from Tenterden to Robertsbridge
5.7 Based on GIS analysis, we estimate that between 40% to 50% of current users are located
within a shorter drive of Robertsbridge than Tenterden. We would not expect all these users
to transfer location, given the established role of Tenterden as the main access to the KESR,
and Tenterden’s larger size and role as a tourist attraction.
5.8 In addition, parking at Robertsbridge is more limited, with fewer spaces and capacity shared
with the Hastings-London line station. The parking at Robertsbridge would also requires
payment (see Figure 2-4), while in Tenterden parking is free. Nonetheless, with the extension
we do expect some people to use Robertsbridge who would otherwise have used Tenterden.
5.9 The effect of the shift in access station would have a positive effect on the balance of demand
on KESR services. At present, the majority of demand boards at Tenterden on specific ‘peak’
services. A redistribution of some of these journeys would result in a less peaked pattern of
demand at associated station facilities.
5.10 For those who choose to access KESR at Robertsbridge rather than Tenterden, due to its
proximity, there would be a benefit through reduced congestion. For the purposes of this
analysis we have assumed that, of the 40% - 50% of visitors for whom Robertsbridge would be
notionally quicker to drive to, up to half (we have taken 20% of the current market as the basis
for our assessment) would drive to Robertsbridge instead of Tenterden. In particular, those
from the south (e.g. Hastings) and the west would be likely to change their point of access.
5.11 The overall distance between Robertsbridge and Tenterden is around 23 kilometres. We have
looked at a sample of locations to the north, south and east of the KESR to assess the time and
distance saving to Robertsbridge compared to that of Tenterden. This is presented in Figure 5-
1 and Table 5-2.

Rother Valley Railway Economic Impacts Report | Report
September 2018 | 47
Figure 5-1: Driving Journey Time and Distance to Robertsbridge and Tenterden
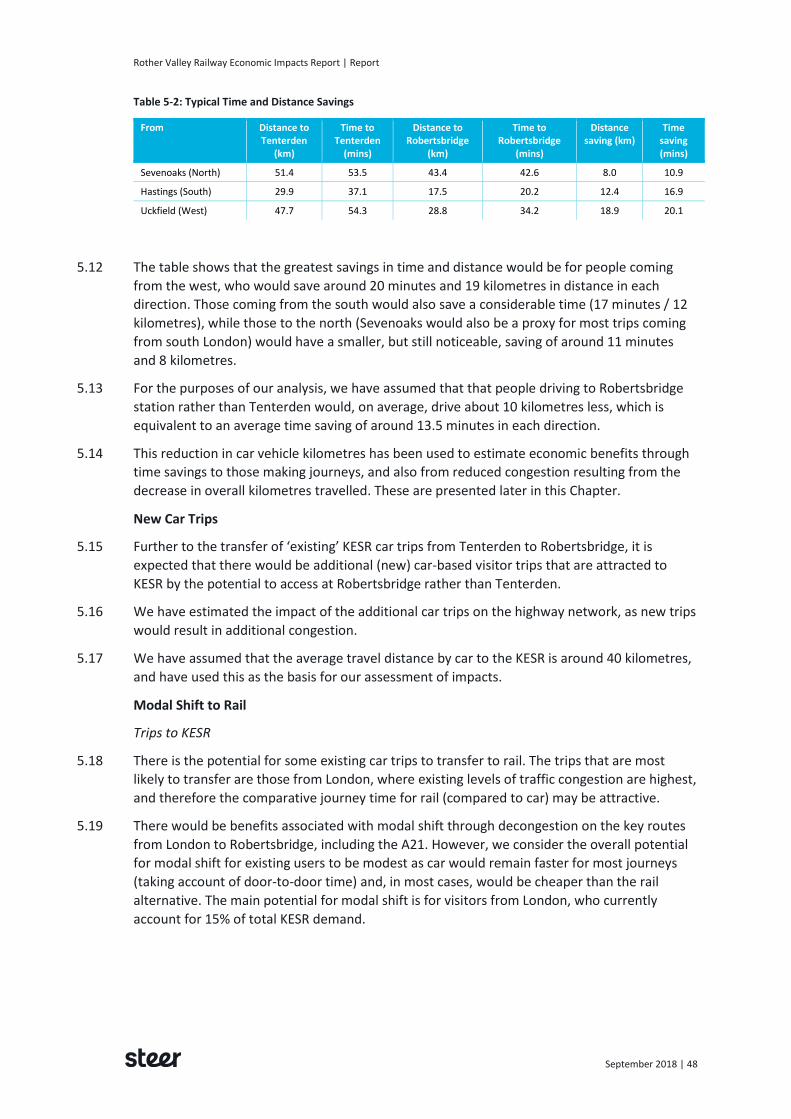
Rother Valley Railway Economic Impacts Report | Report
September 2018 | 48
Table 5-2: Typical Time and Distance Savings
From Distance to Tenterden
(km)
Time to Tenterden
(mins)
Distance to Robertsbridge
(km)
Time to Robertsbridge
(mins)
Distance saving (km)
Time saving (mins)
Sevenoaks (North) 51.4 53.5 43.4 42.6 8.0 10.9
Hastings (South) 29.9 37.1 17.5 20.2 12.4 16.9
Uckfield (West) 47.7 54.3 28.8 34.2 18.9 20.1
5.12 The table shows that the greatest savings in time and distance would be for people coming
from the west, who would save around 20 minutes and 19 kilometres in distance in each
direction. Those coming from the south would also save a considerable time (17 minutes / 12
kilometres), while those to the north (Sevenoaks would also be a proxy for most trips coming
from south London) would have a smaller, but still noticeable, saving of around 11 minutes
and 8 kilometres.
5.13 For the purposes of our analysis, we have assumed that that people driving to Robertsbridge
station rather than Tenterden would, on average, drive about 10 kilometres less, which is
equivalent to an average time saving of around 13.5 minutes in each direction.
5.14 This reduction in car vehicle kilometres has been used to estimate economic benefits through
time savings to those making journeys, and also from reduced congestion resulting from the
decrease in overall kilometres travelled. These are presented later in this Chapter.
New Car Trips
5.15 Further to the transfer of ‘existing’ KESR car trips from Tenterden to Robertsbridge, it is
expected that there would be additional (new) car-based visitor trips that are attracted to
KESR by the potential to access at Robertsbridge rather than Tenterden.
5.16 We have estimated the impact of the additional car trips on the highway network, as new trips
would result in additional congestion.
5.17 We have assumed that the average travel distance by car to the KESR is around 40 kilometres,
and have used this as the basis for our assessment of impacts.
Modal Shift to Rail
Trips to KESR
5.18 There is the potential for some existing car trips to transfer to rail. The trips that are most
likely to transfer are those from London, where existing levels of traffic congestion are highest,
and therefore the comparative journey time for rail (compared to car) may be attractive.
5.19 There would be benefits associated with modal shift through decongestion on the key routes
from London to Robertsbridge, including the A21. However, we consider the overall potential
for modal shift for existing users to be modest as car would remain faster for most journeys
(taking account of door-to-door time) and, in most cases, would be cheaper than the rail
alternative. The main potential for modal shift is for visitors from London, who currently
account for 15% of total KESR demand.

Rother Valley Railway Economic Impacts Report | Report
September 2018 | 49
Trips to Bodiam Castle
5.20 Currently nearly all visitors to Bodiam Castle access the site by road. The Castle is accessed by
minor roads (see Figure 2-3), and on busy days there can be significant localised congestion on
the approaches to the Bodiam Castle car parks.
5.21 The new station at Robertsbridge would enable visitors to access Bodiam by rail. This could
either be in part (i.e. driving to Robertsbridge then getting the KESR) or in full (getting the train
to Robertsbridge to connect with the KESR). Where existing car trips transfer to rail, this would
result in benefits from reduced highway congestion in the local and wider area.
5.22 Increasing the public transport mode share of visitors is an objective of the National Trust, and
there is the potential for joint train; KESR-Bodiam ticketing arrangements that would
encourage this. As there is currently no parking at Bodiam station, and no potential for future
parking provision, there is greater impetus to explore the possibilities of joint ticketing in order
to increase visitors to the Castle (and on KESR) without adding to congestion on the local
roads.
Modal Shift Assumptions
5.23 We have presented the benefits based on the illustrative assumptions about the proportion of
current car-based trips to KESR and Bodiam Castle that would, with the Rother Valley Railway,
transfer to rail. These are:
• 1% of existing car-based trips to KESR shift to rail; and
• 1% of existing trips to Bodiam Castle transfer from car to rail access.
5.24 The potential for rail transfer is greatest for trips from London, and we have therefore
assumed a longer average trip length of 50km to estimate the congestion benefits associated
with this modal shift.
Summary of Highway Impacts
5.25 We have valued the transport impacts described in this section, based on the forecast impacts
set out above and monetised in line with Department for Transport WebTAG guidance54.
Assumptions from the guidance are set out below.
Key Assumptions
5.26 Time savings benefits to users:
• Average value of time is £5.33 per person per hour (2018 prices), based on the Department
for Transport’s WebTAG guidance for the value applied to ‘other’ trip purposes (i.e. non-
work and non-commuting) trips.
• Congestion impacts from an increase in new car users and reduction in car kilometres from
re-routing ‘existing’ car trips:
• Average car occupancy factor of 2.5 applied to convert from visitor trips to vehicle
trips.
54 https://www.gov.uk/guidance/transport-analysis-guidance-webtag

Rother Valley Railway Economic Impacts Report | Report
September 2018 | 50
• Benefit per car kilometre removed of 6.8 pence per kilometre (2018 prices). This is
based on Department for Transport WebTAG guidance on the ‘Marginal External Costs
of Congestion’55. WebTAG Table A5.4.4 gives the ‘all week average value’ of 5.8 pence
(2010 prices) for the South East (note that this excludes London), which has been
uplifted using CPI to 2018 prices.
5.27 The valuation of transport impacts is set out in Table 5-3.
Table 5-3: Summary of Highway Impacts
Transport Impact Benefits (£ per annum, 2018 prices)
Assumptions
Disbenefits from level crossing -£2,900 to -£6,300 Based on Mott MacDonald Analysis. Worst case taken for overall value.
Transfer from Tenterden to Robertsbridge - benefits to users
£18,600 20% of existing users re-route to Robertsbridge. Time saving 13.5 mins in each direction.
Transfer from Tenterden to Robertsbridge - decongestion
£4,200 As above - each transfer results in 10km fewer on network.
New car trips - additional congestion -£4,200 5% increase in car trips, 40km average distance.
Benefits from mode shift - decongestion £5,800 1% of KESR car trips and 1% of existing Bodiam Castle demand. Assumed average trip distance of 50km.
Overall Transport Impacts £18,100 (Based on ‘worst case’ level-crossing impacts)
5.28 The analysis shows that:
• The net impact upon users of the highway network is positive (a benefit of £18,100), even
allowing for the ‘worst case’ delays at the level crossing;
• The main benefit accrues from time savings to visitors who access Robertsbridge rather
than Tenterden (£18,600), and from modal shift from car to rail (£5,800);
• The net congestion impact from additional visitor car trips attracted to Robertsbridge (a
disbenefit of £4,200) and the reduction in car kilometres from re-routing of ‘existing’ car
trips (a £4,200 benefit) is broadly neutral; and
• Even if there were to be no modal shift (of existing trips) from car to rail, the net overall
transport impact would remain positive.
5.29 This suggests that, from a highway congestion impact, the benefits from the improved
accessibility of RVR would out-weigh the costs of delay associated with the level-crossing.
Assessment of Impact of Additional Car Trips to Robertsbridge
5.30 We have looked at the forecast additional number of car trips that would access Robertsbridge
as a result of the Rother Valley Railway.
5.31 There are two sources of additional trips:
• Existing trips to the KESR who currently access at Tenterden, but who would, in the future,
choose to access at Robertsbridge instead; and
55 https://www.gov.uk/government/uploads/system/uploads/attachment_data/file/370552/webtag-tag-unit-a5-4-marginal-external-congestion-costs.pdf
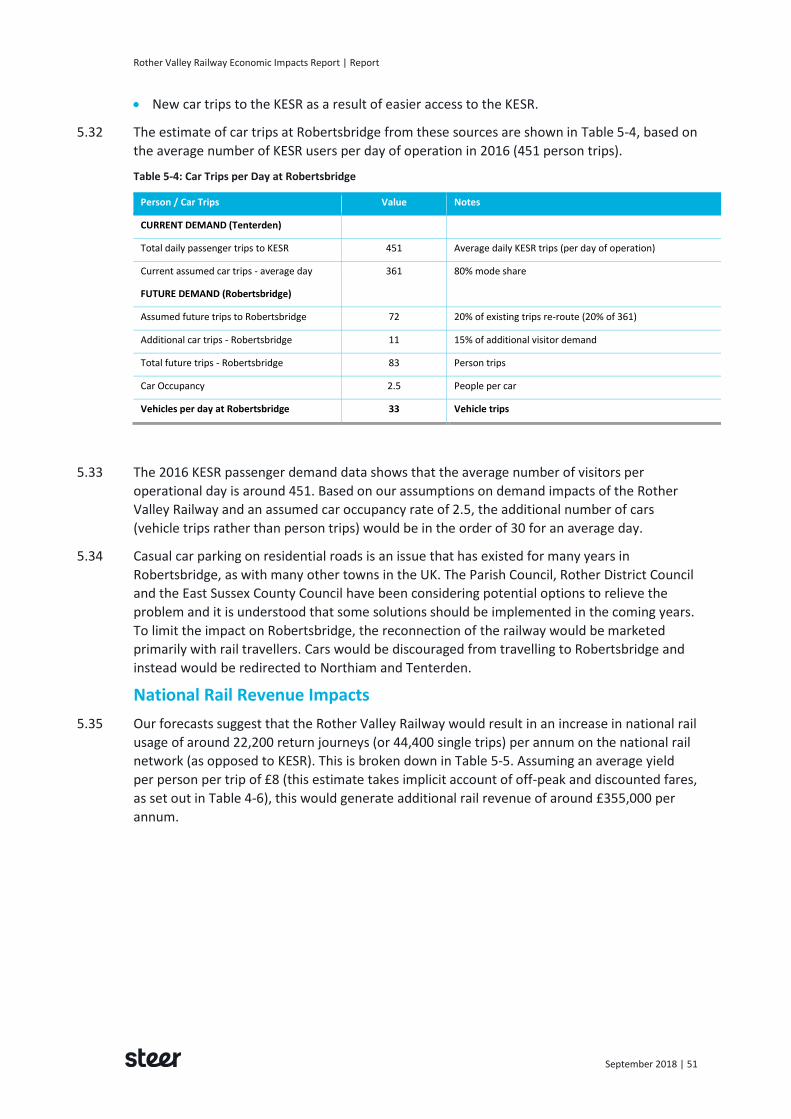
Rother Valley Railway Economic Impacts Report | Report
September 2018 | 51
• New car trips to the KESR as a result of easier access to the KESR.
5.32 The estimate of car trips at Robertsbridge from these sources are shown in Table 5-4, based on
the average number of KESR users per day of operation in 2016 (451 person trips).
Table 5-4: Car Trips per Day at Robertsbridge
Person / Car Trips Value Notes
CURRENT DEMAND (Tenterden)
Total daily passenger trips to KESR 451 Average daily KESR trips (per day of operation)
Current assumed car trips - average day 361 80% mode share
FUTURE DEMAND (Robertsbridge)
Assumed future trips to Robertsbridge 72 20% of existing trips re-route (20% of 361)
Additional car trips - Robertsbridge 11 15% of additional visitor demand
Total future trips - Robertsbridge 83 Person trips
Car Occupancy 2.5 People per car
Vehicles per day at Robertsbridge 33 Vehicle trips
5.33 The 2016 KESR passenger demand data shows that the average number of visitors per
operational day is around 451. Based on our assumptions on demand impacts of the Rother
Valley Railway and an assumed car occupancy rate of 2.5, the additional number of cars
(vehicle trips rather than person trips) would be in the order of 30 for an average day.
5.34 Casual car parking on residential roads is an issue that has existed for many years in
Robertsbridge, as with many other towns in the UK. The Parish Council, Rother District Council
and the East Sussex County Council have been considering potential options to relieve the
problem and it is understood that some solutions should be implemented in the coming years.
To limit the impact on Robertsbridge, the reconnection of the railway would be marketed
primarily with rail travellers. Cars would be discouraged from travelling to Robertsbridge and
instead would be redirected to Northiam and Tenterden.
National Rail Revenue Impacts
5.35 Our forecasts suggest that the Rother Valley Railway would result in an increase in national rail
usage of around 22,200 return journeys (or 44,400 single trips) per annum on the national rail
network (as opposed to KESR). This is broken down in Table 5-5. Assuming an average yield
per person per trip of £8 (this estimate takes implicit account of off-peak and discounted fares,
as set out in Table 4-6), this would generate additional rail revenue of around £355,000 per
annum.

Rother Valley Railway Economic Impacts Report | Report
September 2018 | 52
Table 5-5: Additional Rail Demand and Revenue on the National Rail Network
Source of Demand Trips (p.a.)
New rail demand for KESR 11,270
New rail demand at Bodiam 8,780
Modal transfer to rail (existing trips KESR & Bodiam) 2,140
Total additional rail journeys p.a. (two-way) 22,190
Total additional rail trips (one-way) 44,390
Assumed yield per trip (£) £8.00
Annual revenue £355,100
5.36 This estimate only takes account of the ‘first order’ impact on rail revenues. In practice, some
‘new’ users may otherwise travel by rail to an alternative destination, and therefore the
revenue gain presented here would be offset by a broadly equivalent loss elsewhere in the
industry.
5.37 Rail trips would take place largely outside the peak hours, and in a counter-peak direction (i.e.
from London to Robertsbridge in the morning), which means that the additional demand and
revenue generated by the Rother Valley Railway can be accommodated without any material
adverse impact on rail crowding.
Summary of Transport Impacts
5.38 Our analysis shows that:
• The benefits to highway users across the network as a result of the Rother Valley Railway
outweighs the disbenefit of additional delay at the level-crossing - the net benefit is valued
at £18,000 per annum; and
• The Rother Valley Railway would generate significant additional rail revenue on the
national rail network, with an estimated £355,000 per annum from trips to/from
Robertsbridge.

Rother Valley Railway Economic Impacts Report | Report
September 2018 | 53
6.1 The previous sections of this report have demonstrated the significant beneficial impact that
the Rother Valley Railway missing link would have on the economy, particularly through
increased visitors and related tourism spend. This is supported by current policy, as described
in this section.
VisitEngland Strategic Framework
6.2 VisitEngland is working with the tourism industry to deliver a 10-year strategic framework56 for
tourism, which sets out the ways the industry can work together to deliver a 5% growth in
value, year-on-year, over the next decade. This would result in an additional £50 billion in
expenditure and the creation of 225,000 jobs.
6.3 The vision of the strategic framework is “to maximise tourism's contribution to the economy,
employment and quality of life in England”.
6.4 The Strategic Framework provides Action Plans for rural tourism, and tourism and transport;
both of which relate directly to the Rother Valley Railway.
Rural Tourism
6.5 The Rural Tourism Action Plan has a vision to maximise the potential of the rural tourism offer,
which would bring substantial benefits to local economies and communities and contribute to
5% growth, year on year, by 2020.
6.6 The objectives are:
• To diversify and modernise rural tourism products to generate business opportunities
suited to local environments and communities and to develop a year-round visitor offer;
• To increase consumer awareness, understanding and enjoyment of the products and
experiences available in rural areas; and
• To encourage rural communities and economies to benefit from the value of rural tourism
by taking ownership for the development, management, protection and conservation of
rural assets and locations.
6.7 Transport in rural areas is a challenge for tourism and local communities, particularly public
transport. Trips to the English countryside, such as High Weald, are more likely to be taken by
car as rural areas have fewer alternatives. The Action Plan states that “rising fuel prices place
rural destinations at a disproportionate vulnerability due to more limited alternatives…. With
government policy aiming to reduce use of the car and the majority of new transport
56 A Strategic Framework for Tourism 2010-2020, Visit England, Revised Edition 2011. This is the most recent iteration of Visit England’s strategic framework.
6 Assessment of Fit with Policy
Rother Valley Railway Economic Impacts Report | Report
September 2018 | 54
investment taking place in urban areas, local solutions to transport issues in rural destinations
must be found to avoid longer term difficulties for the rural tourism economy.”
6.8 VisitEngland therefore encourage more initiatives that increase dwell times at destinations,
reduce mileage and length of car journeys, such as itineraries that are integrated with public
transport and visitor experiences.
Tourism and Transport
6.9 The VisitEngland Tourism and Transport Action Plan57 aims to contribute to a 5% growth, year
on year, in the England tourism market by 2020, through better planning, design and
integration of tourism and transport products and services.
6.10 The objectives are:
• To improve the ability of domestic and inbound visitors to reach their destinations, using
the mode of travel that is convenient and sustainable for them, with reliable levels of
service (by road or public transport), clear pre-journey and in-journey information, and at
an acceptable cost;
• To ensure that visitors once at their destinations face good and convenient choices for
getting about locally, meeting their aspirations as well as those of the local community for
sustainable solutions;
• To help deliver the above, to influence transport planning at a strategic national as well as
local level to give greater consideration to the needs of the leisure and business traveller
and to overcome transport issues that act as a barrier to tourism growth; and
• In all these, to seek to work in partnership with public authorities and commercial
transport providers, to ensure that the needs of visitors are well understood and acted
upon, and that their value to local economies is fully taken on board in policy decisions
about transport infrastructure and service provision.
6.11 By providing the option for visitors to access Bodiam Castle, the KESR and other attractions by
train, the Rother Valley Railway is consistent with VisitEngland’s transport policies in providing
a more sustainable and convenient mode of travel to support the visitor economy.
National Trust Policy from Practice
6.12 The National Trust is a significant player in the tourism industry, opening 300 houses and
gardens to the public, including Bodiam Castle. The Trust undertakes activities to support and
promote visits to their properties, as well as campaigning and supporting advocacy of the
importance of sustainable tourism across Government.
6.13 The National Trust has a policy to improve public transport and reduce tourists’ dependence
on cars58. This is evidenced by the promotion of the ‘car free days out’ initiative, which offers
an entry fee discount or a voucher for the tea-room to visitors arriving without a car to many
57 Visit England Tourism and Transport Action Plan. 2012. (https://www.visitengland.com/sites/default/files/downloads/final_transport_action_plan_8_june_2012.pdf)
58 The National Trust, Visitor Travel – Policy from Practice. 2005. (http://www.tourisminsights.info/ONLINEPUB/NATIONAL%20TRUST/BRIEF/NATIONAL%20TRUST%20(2005),%20Visitor%20Travel%20-%20Policy%20from%20Practice,%20NT,%20London..pdf)

Rother Valley Railway Economic Impacts Report | Report
September 2018 | 55
National Trust attractions. In addition, the National Trust has been working with Sustrans to
promote cycling to National Trust venues via the national cycling network.
The South East LEP Growth Deal and Strategic Economic Plan
6.14 The South East Local Enterprise Partnership (LEP) published their Growth Deal and Strategic
Economic Plan in March 2014.59 The Strategic Economic Plan aims to generate 200,000 private
sector jobs, complete 100,000 homes and lever investment totalling £10 billion for the
national economy.
6.15 The Strategic Economic Plan states the importance of the tourism sector in the South East,
currently accounting for 6.6% of total employment and 2.7% of total economic output, as well
as employing 95,900 people across the region. The visitor economy is especially important in
rural areas.
6.16 The LEP is focussing its efforts on sectors of the economy where it has, or could have, a strong
competitive advantage, and this includes the visitor economy. In East Sussex specifically,
tourism (hotels and catering) is an important contributor towards the employment growth of
the county. There is significant potential for development surrounding the Rother Valley in the
A21/A259 Hastings-Bexhill Growth Corridor, in particular by building on the recent
improvement to commercial, cultural and leisure industries in the proximity.
6.17 The SEP also recognises that rural areas within the South East are among the most varied,
valuable and productive in the country; new businesses and enterprises based in rural areas
have a role in creating further employment opportunities and helping local communities to
thrive. A substantial proportion of the South East LEP business base is located in rural areas, in
a range of industries including tourism. As such, one of the key rural priorities for the South
East is “continued diversification, including the growth of agri-tech, energy production and
tourism”.
6.18 The priorities for rural areas in East Sussex include grants through the European Agricultural
Fund for Rural Development (EAFRD) to support tourism enterprises to develop new products
and services enhancing the destination offer.
6.19 Restoration of the Rother Valley Railway would contribute towards the LEP’s Strategic
Economic Plan in both the South-East region, and East Sussex more locally. The railway would
help to grow the tourism industry and provide a benefit to both rural, and urban locations,
contributing to the regions priorities.
East Sussex County Council Plan
6.20 The East Sussex County Council Plan60 identifies four priority outcomes for the county. One of
the four priorities for East Sussex is to drive sustainable economic growth, and the plan states
the council’s aim to build on the county’s existing strength in culture and tourism. The plan
suggests an intended outcome of “growing the visitor economy by raising the visibility of East
Sussex, enhancing perceptions, increasing the number of visitors to the coast, and increasing
length of stay and spend” by 2021.
59 An updated Strategic Economic Plan is expected to be published before the end of 2018.
60 East Sussex County Council Plan 2018/19 (issued April 2018)

Rother Valley Railway Economic Impacts Report | Report
September 2018 | 56
Rother District Core Strategy
6.21 Rother District issued their Core Strategy in September 2014, which consists of spatial and
topical Strategic Objectives. The Strategic Objective for economy is “to secure sustainable
economic growth for existing and future residents and provide greater prosperity and job
opportunities for all.” From this, a number of objectives have been derived, including “to
develop key existing sectors, including tourism.”
6.22 The total number of additional jobs estimated as being required over the period 2008-2028 is
some 6,300 jobs within the district. Tourism, leisure and culture is a key policy area to achieve
these job needs.
6.23 The Strategy states that proposals relating to tourism activities and facilities would be
encouraged where they accord with the following considerations, as appropriate:
• It provides for the enhancement of existing attractions or accommodation to meet
customer expectations;
• It supports active use along the coast, consistent with environmental and amenity factors;
• It develops markets for local produce, particularly that which supports land-based
industries and cultural assets;
• It does not involve the loss of tourism accommodation, unless there is no prospect of its
continued use;
• It increases the supply of quality serviced and self-catering accommodation;
• Appropriate controls are in place that restrict occupancy to that for holiday purposes,
whilst not unduly restricting operators from extending their season (subject to visual
impact and flood risk considerations, where applicable); and
• Compatibility with other Core Strategy policies.
6.24 The Strategic Objective for transport in Rother is “to provide a higher level of access to jobs
and services for all ages in both urban and rural areas, and improve connectivity with the rest
of the region.”
6.25 The underlying objectives are:
• Improve connectivity between Rother and the wider South-East region, both along the
coast and towards London;
• Achieve a re-balancing of the transport system in favour of sustainable modes as a means
of access to employment, health services, recreation and community facilities; and
• Maximise transport choice and otherwise provide for efficient and safe movement, in both
urban and rural areas.
6.26 The Rother Valley Railway fits with Rother District Core Strategy for both its
economic/tourism-related policies and its transport objectives. The railway would contribute
towards the District’s job targets both directly and indirectly, and improve sustainable travel,
choice and connectivity in the area.
Salehurst and Robertsbridge Neighbourhood Development Plan
6.27 The April 2018 Robertsbridge Neighbourhood Plan notes the potential for the Rother Valley
Railway to link with the Kent and East Sussex Railway at Bodiam.

Rother Valley Railway Economic Impacts Report | Report
September 2018 | 57
6.28 Regarding the economy, the plan sets out an objective to “foster a sustainable community that
promotes employment creation, across commercial, retail and industrial sites”, which fits with
the proposals for the Rother Valley Railway, and the predicted job creation impacts.
6.29 The plan also includes an objective to “reduce the impact of road traffic and parking on the
local community”. The Rother Valley Railway would contribute to this objective by providing a
public transport alternative to car access to Bodiam Castle, and the Kent and East Sussex
Railway.
Summary
6.30 A summary of the how the benefits of the Rother Valley Railway fit with policy is provided in
Table 6-1. The scheme is clearly supportive of all policies on a national, regional and local scale
and would provide benefits that would add to wider objectives (such as job creation and GDP)
beyond those that are tourism and/or transport related.
Table 6-1: Rother Valley Railway Fit with Policy
Rother Valley Railway Benefit
Policy Increase in Visitor
Expenditure
Job Creation Reduction in Car Miles /
Sustainable Travel
VisitEngland Strategic Framework ✓ ✓ ✓
National Trust Tourism Policy from Practice ✓ ✓
South East LEP Growth Deal and Strategic Economic Plan ✓ ✓ ✓
East Sussex County Council Plan ✓
Rother Valley Core Strategy ✓ ✓ ✓
Robertsbridge Neighbourhood Plan ✓ ✓
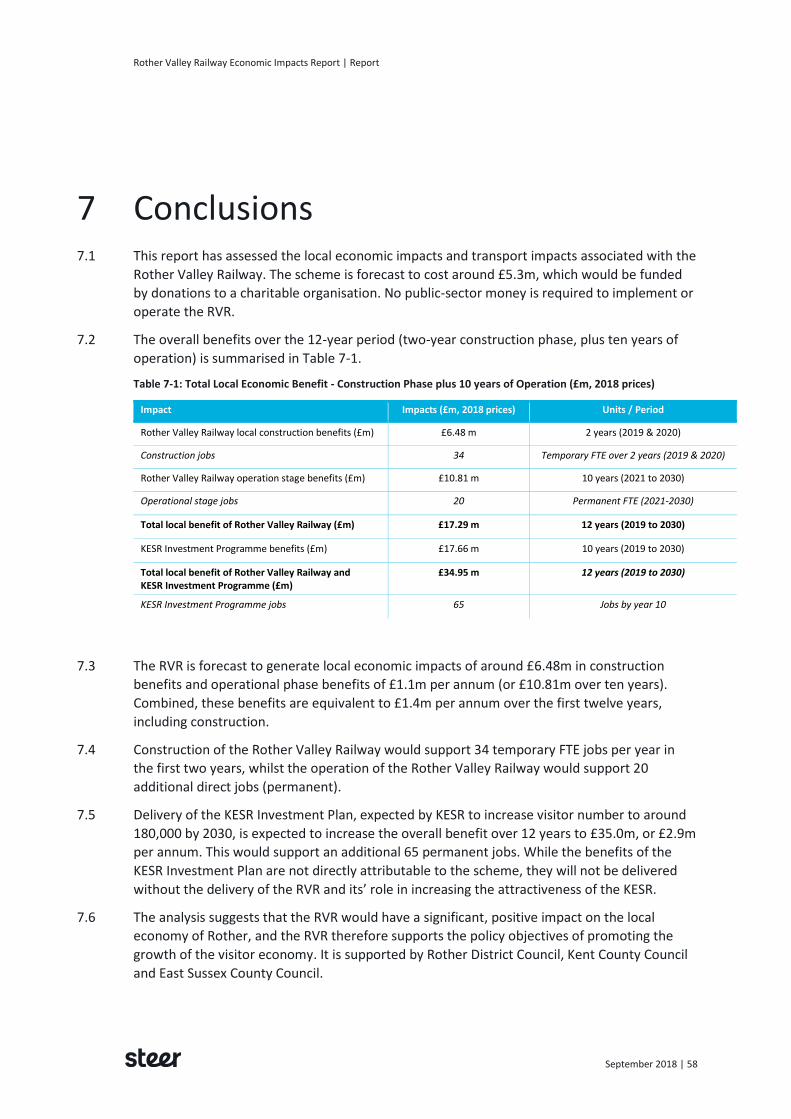
Rother Valley Railway Economic Impacts Report | Report
September 2018 | 58
7.1 This report has assessed the local economic impacts and transport impacts associated with the
Rother Valley Railway. The scheme is forecast to cost around £5.3m, which would be funded
by donations to a charitable organisation. No public-sector money is required to implement or
operate the RVR.
7.2 The overall benefits over the 12-year period (two-year construction phase, plus ten years of
operation) is summarised in Table 7-1.
Table 7-1: Total Local Economic Benefit - Construction Phase plus 10 years of Operation (£m, 2018 prices)
Impact Impacts (£m, 2018 prices) Units / Period
Rother Valley Railway local construction benefits (£m) £6.48 m 2 years (2019 & 2020)
Construction jobs 34 Temporary FTE over 2 years (2019 & 2020)
Rother Valley Railway operation stage benefits (£m) £10.81 m 10 years (2021 to 2030)
Operational stage jobs 20 Permanent FTE (2021-2030)
Total local benefit of Rother Valley Railway (£m) £17.29 m 12 years (2019 to 2030)
KESR Investment Programme benefits (£m) £17.66 m 10 years (2019 to 2030)
Total local benefit of Rother Valley Railway and KESR Investment Programme (£m)
£34.95 m 12 years (2019 to 2030)
KESR Investment Programme jobs 65 Jobs by year 10
7.3 The RVR is forecast to generate local economic impacts of around £6.48m in construction
benefits and operational phase benefits of £1.1m per annum (or £10.81m over ten years).
Combined, these benefits are equivalent to £1.4m per annum over the first twelve years,
including construction.
7.4 Construction of the Rother Valley Railway would support 34 temporary FTE jobs per year in
the first two years, whilst the operation of the Rother Valley Railway would support 20
additional direct jobs (permanent).
7.5 Delivery of the KESR Investment Plan, expected by KESR to increase visitor number to around
180,000 by 2030, is expected to increase the overall benefit over 12 years to £35.0m, or £2.9m
per annum. This would support an additional 65 permanent jobs. While the benefits of the
KESR Investment Plan are not directly attributable to the scheme, they will not be delivered
without the delivery of the RVR and its’ role in increasing the attractiveness of the KESR.
7.6 The analysis suggests that the RVR would have a significant, positive impact on the local
economy of Rother, and the RVR therefore supports the policy objectives of promoting the
growth of the visitor economy. It is supported by Rother District Council, Kent County Council
and East Sussex County Council.
7 Conclusions
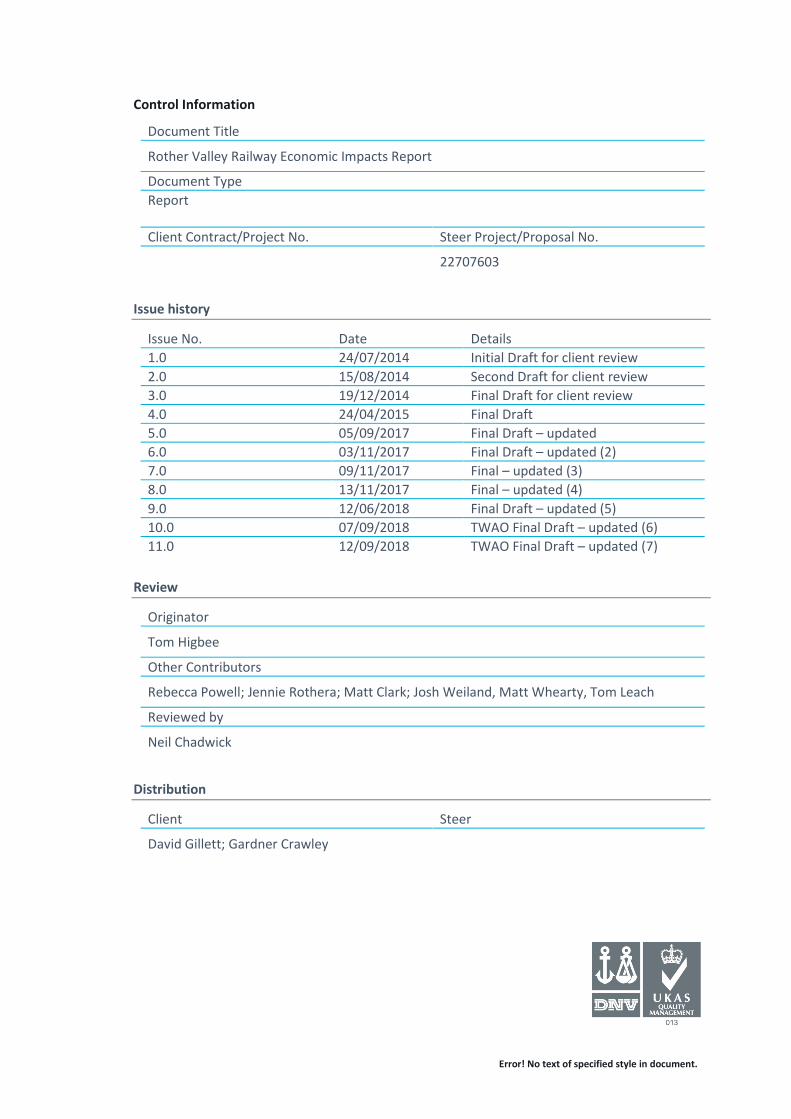
Error! No text of specified style in document.
Control Information
Document Title
Rother Valley Railway Economic Impacts Report
Document Type
Report
Client Contract/Project No. Steer Project/Proposal No.
22707603
Issue history
Issue No. Date Details
1.0 24/07/2014 Initial Draft for client review
2.0 15/08/2014 Second Draft for client review
3.0 19/12/2014 Final Draft for client review
4.0 24/04/2015 Final Draft
5.0 05/09/2017 Final Draft – updated
6.0 03/11/2017 Final Draft – updated (2)
7.0 09/11/2017 Final – updated (3)
8.0 13/11/2017 Final – updated (4)
9.0 12/06/2018 Final Draft – updated (5)
10.0 07/09/2018 TWAO Final Draft – updated (6)
11.0 12/09/2018 TWAO Final Draft – updated (7)
Review
Originator
Tom Higbee
Other Contributors
Rebecca Powell; Jennie Rothera; Matt Clark; Josh Weiland, Matt Whearty, Tom Leach
Reviewed by
Neil Chadwick
Distribution
Client Steer
David Gillett; Gardner Crawley


steergroup.com


