
ROYAL INSTITUTE OF TECHNOLOGY
Live Single Cell Imaging and Analysis
Using Microfluidic Devices
ALI KHORSHIDI
Royal Institute of Technology
School of Biotechnology
Stockholm 2013

© Ali Khorshidi
Stockholm 2013
Royal Institute of Technology
School of Biotechnology
Science for Life Laboratory
SE-171 21 Solna
Sweden
Printed by: Universitetsservice US AB
Drottning Kristinas väg 53
114 28 Stockholm
Sweden
ISBN: 978-91-7501-846-1
TRITA-BIO Report: 2013:14
ISSN: 1654-2312
Akademisk avhanding som med tillstånd av Kungl Tekniska Högskolan i Stockholm framlägges
till offentlig granskning för avläggande av teknologie doktorsexamen i bioteknologi, 18 Oktober
2013.

With them the seed of wisdom did I sow, And with my own hand labour’d it to grow, And this was all the Harvest that I reap’d- “I come like water, and like wind I go.”
Omar Khayyam Translation by Edward Fitzgerald
To my little family, Zuzana and Sam

i
ABSTRACT
Today many cell biological techniques study large cell populations where an average estimate
of individual cells’ behavior is observed. On the other hand, single cell analysis is required for
studying functional heterogeneities between cells within populations. This thesis presents work
that combines the use of microfluidic devices, optical microscopy and automated image
analysis to design various cell biological assays with single cell resolution including cell
proliferation, clonal expansion, cell migration, cell-cell interaction and cell viability tracking. In
fact, automated high throughput single cell techniques enable new studies in cell biology which
are not possible with conventional techniques.
In order to automatically track dynamic behavior of single cells, we developed a microwell
based device as well as a droplet microfluidic platform. These high throughput microfluidic
assays allow automated time-lapse imaging of encapsulated single cells in micro droplets or
confined cells inside microwells. Algorithms for automatic quantification of cells in individual
microwells and micro droplets are developed and used for the analysis of cell viability and
clonal expansion. The automatic counting protocols include several image analysis steps, e.g.
segmentation, feature extraction and classification. The automatic quantification results were
evaluated by comparing with manual counting and revealed a high success rate. In combination
these automatic cell counting protocols and our microfluidic platforms can provide statistical
information to better understand behavior of cells at the individual level under various
conditions or treatments in vitro exemplified by the analysis of function and regulation of
immune cells. Thus, together these tools can be used for developing new cellular imaging
assays with resolution at the single cell level.
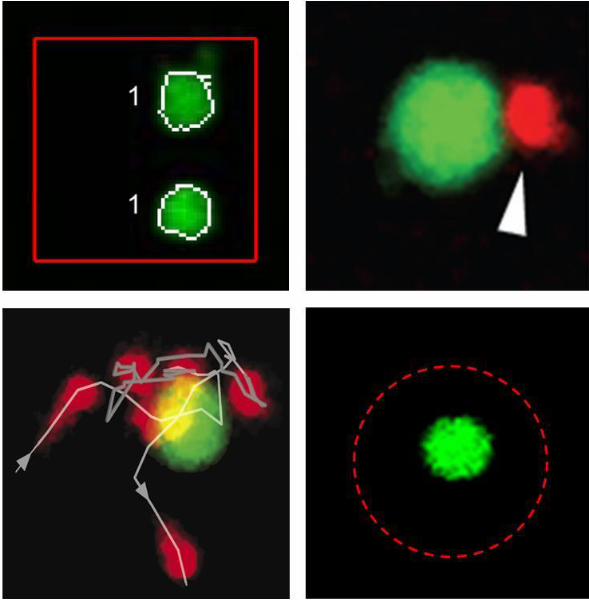
To automatically characterize transient migration behavior of natural killer (NK) cells
compartmentalized in microwells, we developed a method for single cell tracking. Time-lapse
imaging showed that the NK cells often exhibited periods of high motility, interrupted with
periods of slow migration or complete arrest. These transient migration arrest periods (TMAPs)
often overlapped with periods of conjugations between NK cells and target cells. Such
conjugation periods sometimes led to cell-mediated killing of target cells. Analysis of cytotoxic
response of NK cells revealed that a small sub-class of NK cells called serial killers was able to
kill several target cells. In order to determine a starting time point for cell-cell interaction, a
novel technique based on ultrasound was developed to aggregate NK and target cells into the
center of the microwells. Therefore, these assays can be used to automatically and rapidly
assess functional and migration behavior of cells to detect differences between health and
disease or the influence of drugs.

ii
The work presented in this thesis gives good examples of how microfluidic devices combined
with automated imaging and image analysis can be helpful to address cell biological questions
where single cell resolution is necessary.
Keywords: Single cell analysis, time-lapse fluorescence imaging, automated image analysis,
microwell, droplet microfluidics, NK cells, single cell tracking, migration behavior analysis, cell-
cell interaction.

iii
LIST OF PUBLICATIONS Paper I. T. Frisk, M.A. Khorshidi, K. Guldevall, B. Vanherberghen, B. Önfelt. A Silicon-Glass
Microwell Platform for High-Resolution Imaging and High-Content Screening with Single Cell Resolution. Biomedical Microdevices. 13 (4), 683-93, 2011.
Paper II. M.A. Khorshidi*, B. Vanherberghen*, J. M. Kowalewski, K. R. Garrod, S. Lindström, H. Andersson-Svahn, H. Brismar, M. D. Cahalan and B. Önfelt. Analysis of Transient Migration Behavior of Natural Killer Cells Imaged in situ and in vitro. Integrative Biology 3 (7), 770 – 778, 2011.
Paper III. B. Vanherberghen, P. Olofsson, E. Forslund, M. Simon, M. A. Khorshidi, S.
Pacouret, K. Guldevall, R. Mehr and B. Önfelt. NK cell surveillance studied over time at the single cell level reveals heterogeneity in the cytotoxic response. Blood. 121:1326-1334, 2012.
Paper IV. A. E. Christakou, M. Ohlin, B. Vanherberghen, M. A. Khorshidi, N. Kadri, T. Frisk,
M. Wiklund and B. Önfelt. Live cell imaging in a micro-array of acoustic traps facilitates quantification of natural killer cell heterogeneity. Integrative biology. 5 (4), 712-9, 2013.
Paper V. M. A. Khorshidi, P.K. Periyannan Rajeswari , C. Wahlby, H. Jonsson and Helene
Andersson Svahn. Dynamic behavior of single cells using droplet microfluidic. Manuscript submitted. 2013.
* denotes equal contribution
Additional papers not included in this thesis
I. M.A. Khorshidi, T. McKelvey, M Persson, H.D. Trefna. Classification of microwave scattering data based on a subspace distance with application to detection of bleeding stroke. IEEE 3rd international workshop on Computational Advances in Multi-Sensor Adaptive Processing. Aruba, Dutch Antilles. 301-304, 2009.
II. S. Afsardoost, S. Yousefi, M.A. Khorshidi. Offline signature verification using
geometric center features. IEEE 9th international conference in Signal processing. Beijing, China. 1491 – 1494, 2008.
All papers are reproduced with permission of the respective publishers.

iv
CONTRIBUTION TO THE PAPERS My main contribution to this thesis has been to develop algorithms and methods for automated image analysis as well as developing the droplet microfluidic assay including designing and performing the experiments, cell culture, and fluorescence imaging. Here my contributions to different papers are described in more details: Paper I. I designed and developed an image analysis tool for morphology analysis and
automatic quantification of cells in individual microwells. I developed all image analysis steps including preprocessing, segmentation, feature extraction and classification. I also contributed to figure preparation and paper writing.
Paper II. I developed a method to analyze transient migration behavior of NK cells. I also determined different migration modes by analysis of NK cell trajectories. In addition, I contributed to figure and movie preparation and paper writing.
Paper III. I developed an automated image analysis method for morphology analysis of NK cells along their trajectories and in different migration modes. I also contributed to figure preparation and paper writing.
Paper IV. I developed a software tool to automatically track migration of cell clusters confined in microwells throughout the experiment. In addition, I developed a method to automatically analyze the acquired data. I also made some figures and movies, and I contributed to paper writing.
Paper V. I designed and performed all experiments including cell culture, cell labeling, making the microfluidic chips, setting up the experiments, and imaging. I also contributed to design of the microfluidic chips. I developed an automated image analysis method to track dynamic behavior of individual cells encapsulated in micro scale droplets throughout the experiment. I wrote the majority of the paper and prepared figures.

v
CONTENTS
ABSTRACT .......................................................................................... i
LIST OF PUBLICATIONS ...................................................................... iii
CONTRIBUTION TO THE PAPERS ........................................................ iv
1 INTRODUCTION ...............................................................................1
1.1 SINGLE CELL ANALYSIS ....................................................................................... 1
1.1.1 Conventional single cell methods ........................................................................... 2
1.1.2 Microwell arrays .................................................................................................... 3
1.1.3 Droplet microfluidics .............................................................................................. 3
Droplet generation and cell encapsulation ............................................................. 4
Droplet manipulation .............................................................................................. 5
Droplet trapping and incubation ............................................................................. 8
1.1.4 Other micro structure device for single cell study ................................................... 8
Patterns ................................................................................................................... 8
Traps ............................................................................................................ 9
1.2 THE IMMUNE SYSTEM ....................................................................................... 9
1.2.1 Innate and adaptive immunity.............................................................................. 10
1.2.2 Natural killer cells ................................................................................................ 10
1.3 OPTICAL MICROSCOPY .................................................................................... 12
1.3.1 Fluorescence microscopy ...................................................................................... 12
1.3.2 Bright field microscopy ......................................................................................... 14
1.3.3 Two photon microscopy ....................................................................................... 14
1.4 DIGITAL IMAGE PROCESSING ............................................................................. 15
2 PRESENT INVESTIGATION .............................................................. 17
2.1 METHODS ................................................................................................... 17
2.1.1. Microwell-based biological assays ....................................................................... 17
Clonal expression and proliferation of cells .......................................................... 18
Cell migration and cell-cell interactions ................................................................ 19
Aggregation of cells with ultrasound .................................................................... 19
2.1.2 Droplet-based cell analysis ................................................................................... 19
2.1.3 Image acquisition ................................................................................................. 19
2.1.4 Image analysis ...................................................................................................... 20

vi
Preprocessing ........................................................................................................ 21
Segmentation ........................................................................................................ 21
Thresholding ................................................................................................................ 21
Edge detection ............................................................................................................. 21
Watershed segmentation ............................................................................................ 22
Hough transform ......................................................................................................... 23
Feature extraction ................................................................................................. 23
Classification .......................................................................................................... 24
2.1.5 Analysis of migration behavior ............................................................................. 26
Single cell tracking ................................................................................................. 26
Transient migration behavior analysis .................................................................. 27
Transient migration arrest periods .............................................................................. 29
Directed migration ....................................................................................................... 29
Random movement ..................................................................................................... 30
Detection of conjugation periods and NK mediated killing .................................. 30
2.1.6 Scoring viability of single cells .............................................................................. 31
2.2 RESULTS ...................................................................................................... 32
2.2.1 Automatic quantification of cells (Paper I and V) .................................................. 32
2.2.2 Analysis of cell morphology (Paper III) .................................................................. 32
2.2.3 Aggregation of cells using ultrasound (Paper IV) ................................................... 34
2.2.4 Migration analysis of NK cells in vitro and in situ (Paper II) ................................... 34
2.2.5 Analysis of functional behavior of NK cells (Paper III) ............................................ 36
2.2.6 Tracking viability of cells in droplets (Paper V) ...................................................... 37
2.3 DISCUSSION ................................................................................................. 38
3 CONCLUSION AND FUTURE WORK ................................................. 43
4 ACKNOWLEDGEMENTS .................................................................. 45
5 REFERENCES .................................................................................. 47

Ali Khorshidi
1
1 INTRODUCTION
The cell is the smallest unit of life which is alive. Since, cells are fundamental and basic
biological unit of all living organisms, we need to understand them at fundamental level. Today
many biological techniques analyze large populations of cells where the average response of
individual cells is observed. However, to study heterogeneity within a cell population, single cell
analysis is required. To this end compartmentalization is needed to isolate the cells from one
another. Here, some micro compartments for single cell analysis including microwells and
droplets are presented. These microfluidic devices combined with optical microscopy and
digital image processing were used for various cell biological assays e.g. behavior analysis of
immune cells.
1.1 SINGLE CELL ANALYSIS
Cellular analysis is used in different fields of life science, pharmaceutical and biotechnology
industries [1]. Substantial evidences suggest that considerable heterogeneity can exist even
within isogenic cell populations [2]. Genetic drift or cell cycle status can increase the
heterogeneity in a cell population. This heterogeneity can also occur due to cellular processes
e.g. cell development or cell proliferation. The cellular heterogeneity can have an effect on the
genetic patterns and protein expression of the cells. Hence, the functionality and behavior of
one cell can differ from other cells within the same population [3]. However, the cellular
heterogeneity can be masked by average response of the cells. The bulk response of the cells is
often interpreted as response of all cells within the same cell type. Single cell analysis is an
appropriate approach to analyze cells behavior at individual level. Approaches in this area
include the analysis of RNA and protein from single cells, studying rare cell populations as well
as analyzing heterogeneity in drug response. Numerous single cell analysis methods have been
developed for cellular analysis e.g. cell culture, clonal expression, proliferation, differentiation,
gene expression, cytotoxicity and antibody secretion.
A number of techniques for studying individual cells including conventional methods and
microfluidic devices have been presented during the last decades [4-9]. These analytical single
cell technologies are aimed to be biocompatible, transparent for imaging, robust and stable for
cell tracking as well as to allow cell manipulation. It is of importance that these techniques be
high throughput and mimicking in vivo conditions. Microfluidic devices have also emerged as a
promising tool to study cellular systems at the single cell level [10]. In this thesis, more
conventional methods as well as a number of microfluidic devices including microwells, droplet
based structures, patterns and traps are described for specific single cell assays.

Live Single Cell Imaging and Analysis Using Microfluidic Devices
2
1.1.1 Conventional single cell methods
Conventional cell based assays are used to simultaneously analyze a large number of single
cells. The average response of a cell population is measured and assumed to be representative
for all cells within the sample. However, this assumption can result in misleading and erroneous
conclusions as subpopulations deviating substantially from the average response may exist.
Therefore, the importance of determining the whole range of responses of individual cells and
the cell heterogeneity has been highlighted [11, 12] and a number of conventional single cell
techniques e.g. microscopy, flow cytometry have been used to study heterogeneity in cell
populations.
Microscopy is the most obvious method for a wide range of cellular applications as well as time
lapse imaging. This method is suitable for the study of intracellular communication and cell
morphology as well as measuring gene and protein expression. Live cell imaging allows the
monitoring of individual cell behavior over time. Normally, cells are seeded in microtiter plates
or fixed on the microscope cover glass. Then, several hundreds of images of cells are
automatically acquired and saved for further image analysis to extract cellular and intracellular
data [13, 14]. The size of the wells in 96 well microtiter plates (6.86 mm in diameter and 360 µL)
is enormous larger compared to the size of a single cell (~10 µm in diameter and ~1 pL in
volume). Thus, 96 well plates together with automatic microscopy are often applied to study
average response of the cells due to uncontrolled seeding pattern and undetermined cell
boundaries.
Standard microscopy for single cell analysis is a low throughput tool. Flow cytometry (FC) is the
most commonly used high throughput method for studying behavior of individual cells. Several
thousands of single cells per second can be analyzed based on their size and fluorescence
property by FC [15]. FC can be applied for different single cell analyses applications e.g. protein
and gene expression, cell surveillance and protein localization [16, 17]. Related to FC,
fluorescence activated cell sorting (FACS) is a well know and high throughput conventional tool
which can sort and collect cells with desired properties from a mixed sample based on a
fluorescent signal. FACS allows the sampling of cells from a population at different time points
of an experiment for time scale analysis [18], but it is not possible to track individual cells over
time [19]. In addition, FC and FACS require cells to be labeled and in suspension and it cannot
be used for fluorescence localization and dynamic monitoring of single cells behavior.
Another conventional tool for single cell analysis is the patch-clamp technique which is very
sensitive in measuring the changes electric potential across cell membranes e.g. allowing the
study of ion channels [20]. Patch-camp is low throughput tool for single cell analysis and has
limited applications. Other examples of low throughput single cell analysis technologies are
laser scanning cytometry (LSC) [21], capillary electrophoresis (CE) [22] and laser capture

Ali Khorshidi
3
microdissection (LCM) [23]. The main limitation of these methods is their specific and limited
applications. There are many single cell analysis applications including cell-cell interaction, cell
manipulation and single cell tracking which require microstructures and isolating devices.
Microfluidic devices have channels and structures with dimension of microns which can enable
single cell isolation and manipulation. Therefore, microfluidics and lab on a chip technologies
are promising high throughput tools for analyzing the large number of single cells required to
capture rare subpopulations.
1.1.2 Microwell arrays
In order to study single cell behavior, individual cells can be separated by the physical
boundaries of microwells. Compared to 96 well microtiter plates, analysis time for single cells in
microwells is significantly decreased due to smaller sizes and volumes. In addition, a large
number of parallel biological experiments can be performed in the multitude wells on a
microwell array chip. It is possible to study multiple biological samples in parallel and also
analyze thousands of single cells individually on a microchip. Microwell chips are designed with
different well shapes, sizes, materials and numbers depending on the biological applications for
which they are intended e.g. stem cells [24], protein study [25] and genetic analysis [26]. Large
wells are often used for long term experiments or the study of small isolated populations of
cells; while small wells designed mostly for fast experiments because of small volume for cell
culture or behavioral analysis of isolated single cells. Depending on the application, different
material can be used in fabricating the microwell chips. For instance, transparent materials with
good optical properties e.g. polydimethylsiloxane (PDMS) or glass are used for imaging
applications. Biocompatibility of the well material is another important factor to be considered
for live cell and biological experiments. The different microwell chips which are used in this
thesis for different biological assays are explained in detail in the present investigation section.
1.1.3 Droplet microfluidics
Droplet based microfluidics provides a high throughput and low volume platform for single cell
analysis. Droplet microfluidics uses a two phase system to enclose single cells in aqueous
microdroplets with volumes of pico to nano liters in a surrounding continuous oil phase. The
compartmentalization of chemical reactions in microdroplets can be applied for a wide range of
experiments at molecular and cellular levels. Since droplets are, to a large extent, physically and
chemically isolated from each other, the risk of cross-contamination is decreased. The small
volume of the droplets reduce the time required for screening of single cells and enable the
detection of molecules released from single cells [27, 28]. The large surface to volume ratio of
the droplets can increase speed and efficiency of regents mixing inside droplets due to induced
inertial flows by shear interactions in dedicated mixing structures [29]. Droplet formation and

Live Single Cell Imaging and Analysis Using Microfluidic Devices
4
manipulation in the kilohertz range enables the screening of a large number of samples up to
108 in one day. In this thesis a selection of, different steps for droplet manipulation
functionalities include cell encapsulation, droplet fusion, droplet mixing, droplet sorting,
droplet trapping and on chip incubation are briefly described.
Droplet microfluidic devices are typically glass- PDMS channels which are fabricated by soft
lithography [30]. The surfaces of PDMS-glass chips are most often modified by fluorophilic
coating agents e.g. Aquapel (PPG Industries) [31]. The PDMS polymer is permeable to oxygen
and CO2 and optically transparent for imaging. One major drawback of the porous structure of
the PDMS is the adsorption of in particular small molecules [32].
Droplet generation and cell encapsulation
Picoliter monodisperse droplets can be generated at kilo hertz frequencies by pressure driven
flow in a continuous oil phase. The flow of the liquids (water and oil) is often controlled by
volume using syringe pumps. T-junctions [33, 34] or flow-focusing devices [35] are two common
structures used for the production of monodisperse droplets at high frequency (up to 10 kHz). A
flow-focusing nozzle for forming monodisperse droplets is shown in Figure 1.1A. Uniform
droplets are generated by controlling the injected flow rates of the continuous phase (oil) and
the disperse phase (water). The disperse phase is periodically broken into droplets at the
generator nozzle. Changes in the flow rate and channel dimension affect the droplet size,
generation frequency and composition (in the case of two aqueous phase injection channels).
Depending on the application, the channels of the droplet generator device are designed and
fabricated in different dimensions.
In order to prevent unwanted coalescence of the generated droplets in microfluidic device
during droplet manipulation a surfactant is added to the continuous phase. Droplets coalesce
more rapidly when stabilizing agents are not added. Surfactants added to the oil phase act to
decrease the interfacial energy at the oil water interface to stabilize the emulsion droplets. In
addition, surfactants must be compatible with cells and biological molecules. Surfactants with
long fluorocarbon tails of e.g. perfluorinated polyethers (PFPE) are suitable for stabilization of
the droplets for a long term [36, 37], whereas surfactants with short fluorocarbon tails such as
polyethylene glycol (PEG) are biocompatible [38]. Hence, using PFPE-PEG block-copolymer
surfactant maintains droplets both stable and biocompatible [39] (Figure 1.1B).
Different types of mammalian cells and bacteria have been encapsulated in microdroplets by
mainly using flow-focusing device (Figure 1.1A). The number of loaded cells in individual
droplets is often not uniform due to the stochastic limitations of single cell loading. The
distribution of cells per droplets follows Poisson distribution [40]. One solution to overcome
this limitation to deliver the cells to the nozzle evenly space in the microchannel [41].
Ali Khorshidi
5
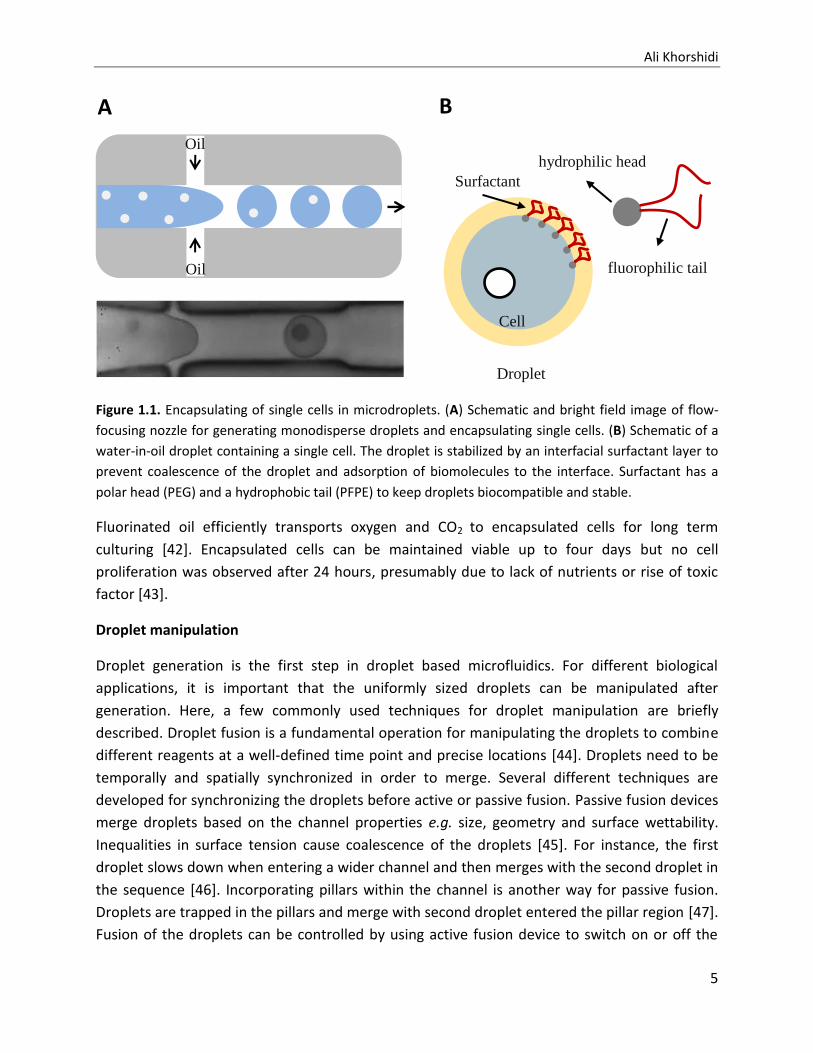
Figure 1.1. Encapsulating of single cells in microdroplets. (A) Schematic and bright field image of flow-
focusing nozzle for generating monodisperse droplets and encapsulating single cells. (B) Schematic of a
water-in-oil droplet containing a single cell. The droplet is stabilized by an interfacial surfactant layer to
prevent coalescence of the droplet and adsorption of biomolecules to the interface. Surfactant has a
polar head (PEG) and a hydrophobic tail (PFPE) to keep droplets biocompatible and stable.
Fluorinated oil efficiently transports oxygen and CO2 to encapsulated cells for long term
culturing [42]. Encapsulated cells can be maintained viable up to four days but no cell
proliferation was observed after 24 hours, presumably due to lack of nutrients or rise of toxic
factor [43].
Droplet manipulation
Droplet generation is the first step in droplet based microfluidics. For different biological
applications, it is important that the uniformly sized droplets can be manipulated after
generation. Here, a few commonly used techniques for droplet manipulation are briefly
described. Droplet fusion is a fundamental operation for manipulating the droplets to combine
different reagents at a well-defined time point and precise locations [44]. Droplets need to be
temporally and spatially synchronized in order to merge. Several different techniques are
developed for synchronizing the droplets before active or passive fusion. Passive fusion devices
merge droplets based on the channel properties e.g. size, geometry and surface wettability.
Inequalities in surface tension cause coalescence of the droplets [45]. For instance, the first
droplet slows down when entering a wider channel and then merges with the second droplet in
the sequence [46]. Incorporating pillars within the channel is another way for passive fusion.
Droplets are trapped in the pillars and merge with second droplet entered the pillar region [47].
Fusion of the droplets can be controlled by using active fusion device to switch on or off the
oioi
Oil
Oil
Cell
Surfactant
hydrophilic head
fluorophilic tail
Droplet
A B
Live Single Cell Imaging and Analysis Using Microfluidic Devices
6
merging process [48]. Active fusion methods need an external trigger to induce coalescence e.g.
electric field [49] (Figure 1.2A) or localized heating by laser [50]. In addition, external forces
such as electricity and heat in active fusion modules may effect on viability of biological
molecules and cells inside the droplets. However, passive fusion methods have low throughput
compare to active fusion techniques. Depending on the application, a suitable method must be
chosen for droplet fusion.
For some droplet processing steps it is important to divide droplets into smaller volume
droplets for incubation or screening purposes. Smaller compartments provide faster mixing of
reagents inside the droplets and can reduce the reaction time in the droplets [51, 52]. Droplet
splitting is also used to increase throughput of droplet production. Similarly to droplet fusion,
both passive [33] and active [53] droplet splitting systems are designed for fragmenting the
droplets to smaller volumes. The splitting of droplets can be mediated by geometries like T-
junctions (Figure 1.2B) [33, 54]. In order to evenly split the droplets two downstream channels
at T-junction must have the same dimensions and geometries to provide the same fluidic
resistance. Changing length of only one daughter channel effects on the fluidic resistance and
split the droplets unevenly.
In many droplet microfluidic applications, droplets contain different biological or chemical
reagents. Mixing the contents of a droplet is very fast due to the short diffusion distance. To
achieve even more rapid mixing of liquids inside confined droplets microfluidic tools may be
used to mix droplet contents in order to observe reactions with millisecond resolution [55].
When the droplet diameter is larger than the microfluidic channel width, mixing inside the
elongated droplet (formed plug) is increased due to the friction between the flowing plug and
the solid wall of the channel. The contact induces a double recirculating flow pattern inside the
plug. This flow pattern enhances the mixing rate because of advection [56]. Since recirculating
flow does not rapidly mix the contents across the center plane of the droplet, winding channels
have been implemented to overcome this limitation (Figure 1.2 C) [57]. When a droplet passes
in a winding channel e.g. zigzag structure, the shear forces on either side of the droplets
become uneven and the droplet contents will experience stretching and folding to rapidly mix
the liquid across droplet center plane [58]. Another method to mix contents of the droplets is
to employ active mixing e.g. by using a local temperature variation induced by laser [59].
The isolation of small subpopulations of cells for further analysis is essential for certain
applications e.g. circulating tumor cells and drug screening. Droplet sorting is a critical module
for separating a specific subset of droplets from the remainder of the droplets. The simplest
droplet sorting relies on creative geometry of channels to passively separate the droplets by
size. Deterministic lateral displacement (DLD) employs channel structures and hydrodynamics

Ali Khorshidi
7
Figure 1.2. Schematics of selected functional modules for droplet manipulation. (A) An active fusion
module where droplet fusion is induced by an electric field merging red dye droplets with cell containing
droplets. (B) Droplet splitting at T-junction with symmetric daughter channels. Droplets divide to equally
sized droplets of lower volume. (C) Droplet mixing using a zigzag channel. Mixing of chemical or
biological contents inside the droplet is increased in a winding channel due to decreasing diffusion
distances within the droplet by folding the layers of fluid inside the droplet. (D) Active droplet sorting
based on the fluorescent contents of the droplet. A detected fluorescent signal induces electric field to
selectively sort the droplets. Arrows indicate flow direction in the channels.
to isolate droplets based on their size [60]. Generated droplets can be actively sorted in an
electric field [61] or by dielectrophoresis [62]. Alternatively, surface acoustic wave devices can
deflect droplets by locally compressing fluids [63]. In addition, manipulation of droplets loaded
with magnetic particles by magnetic fields introduces another way to sort droplets [64]. For
precise manipulation of droplet, a laser light can be applied to a Y-junction channel (Figure
1.2D) [65, 66]. Then, droplets can be selectively sorted based on their fluorescent content
detected by photon multiplier tube. The fluorescence signal triggers an electric field in which
the fluorescent droplet moves towards the output channel with high fluidic resistance, while
other non-fluorescent droplets passively follow low fluidic resistance branch of the Y-junction.
C D
A B
Live Single Cell Imaging and Analysis Using Microfluidic Devices
8
Droplet trapping and incubation
Incubation of cells with chemical or biological agents plays an important role in many biological
applications. The typical time for incubation of droplets on the chip ranges from seconds to
minutes which are suitable for some chemical reactions or biological experiments e.g. enzyme
reactions. For incubation of the droplets for few seconds, droplets can be stored in a single line
to control exact timing of the droplets with milliseconds resolution [67]. A simple method to
increase the incubation time is prolonging length of the channel. However, long channels
increase the back-pressure in the incubation channel. This problem can be solved by increasing
depth and width of the storage channel [43] or trapping the droplets is a multilayer device [68].
The wide channels can store up to 106 droplets on the chip. In order to avoid droplet collision, a
V-shaped entrance was designed to gradually slow down the droplets in the storage chamber
[69]. The main drawback of the deep and wide storage channel is difficulty to control location
of droplets over incubation time, whereas multilayer device enables localization of droplets and
controlling the droplet volume over time. Alternatively a droplet array can be used to trap and
incubate thousands of microdroplets for hours [70]. Droplets are squeezed in a shallow channel
and are trapped in cylindrical chambers where they can relax to their lowest energy shape
(spherical shape). These PDMS-based microfluidics devices are permeable to water and
experience slow evaporation of aqueous droplets during incubation time [71]. For longer
incubation time up to few days, droplets are collected in glass syringes. The droplets must be
very stable in order to be stored in syringes for such long periods of time.
1.1.4 Other micro structure device for single cell study
For the analysis of individual cells other micro compartments than wells and droplets can be
used. Micro patterning and trapping are two frequently used techniques for spatially separating
and analyzing single cells.
Patterns
Micro patterns most often refer to spots or well-shaped structures on a surface. Micro spots
are typically used for cell adhesion and cell growth on the surface [72, 73], while arrays of micro
well-shaped structures spatially isolate single cells for analysis regardless of whether they
attach [74]. Patterns are frequently made by soft lithography and surfaces are coated with
various chemistries depending on the application. Micro patterns often contain regions
modified to provide biocompatible and cell friendly regions, whereas other regions are coated
with e.g. PEG with less cell friendly properties. In order to preserve cell viability during the
experiments, potential biological effects of the coated surface should be considered and even
more importantly, the difference between this in vitro system and in vivo system should be
understood. In order to individually position and track single cells during an experiment,

Ali Khorshidi
9
adherent cells can be attached to specific micro spots and nutrition supplied to the cells by the
passing fluid. The main drawbacks of this technique include the positioning of the cells in the
flow for a long time which exposes the cell to sheer stress.
Micro patterns have been used to study size, morphology and growth of cells. Recently,
asymmetric micro patterning techniques have been used to study cell migration and division
[75, 76]. The cell-substrate interface can dynamically change by external stimuli e.g. heat, light
and electricity. These dynamic surface effects can directly affect cell adhesion and response
[77]. For instance, decreasing the cell-surface area can affect the cell behavior and result in
apoptosis [73].
Traps
Trapping of single cells at fixed locations for long term experiments and analyses is comparable
to the microwell approach. It is possible to trap cells in contact with a surface as well as those
which are not [78]. Trapping techniques are often combined with microfluidic devices to supply
nutrition and regents to the cells. Cells can be mechanically trapped using U-shaped structures
to trap the cells [79]. These U-shaped traps are compatible with standard microscopy but they
are not suitable for long term imaging because of cell losses to the passing flow. Capturing
immunomagnetically labeled cells with magnetic fluxes at particular positions is another
trapping technique [80]. Magnetic traps allow the selection of specific sub-group of cells based
on e.g. cell surface markers. However, biological effects of coupling cells with magnetic beads
and particles must be considered when using this technique.
Optical traps [81, 82] and dielectrophoretic traps [83] are other approaches to manipulate and
spatially isolate single cells. Optical tweezers move cells towards the focal point of a focused
laser by optical forces and reposition the trapped cells by changing the focus. The drawback of
this technique is the heating of the cells which occur in the laser beam. Dielectrophoretic (DEP)
traps move the cells in an electric field based on the difference in conductivity between the
cells and the surrounding medium. Another method used to trap cells employ an acoustic trap.
A benefit of acoustic trapping is that it is a non-contact technique. Ultrasonic standing waves
generate pressure gradients in the liquid and forces on cells to move them towards a particular
location (i.e. node of the standing wave) [84]. It is also possible to trap individual cells using
ultrasonic waves for a specific period of time [85]. One disadvantage of this technique is lack of
demonstration of cell viability for extended periods of time.
1.2 THE IMMUNE SYSTEM
The immune system is a collection of cells, tissues, and molecules that mediate resistance to
disease, particularly to infectious disease. The largest organ of the immune system is the skin
Live Single Cell Imaging and Analysis Using Microfluidic Devices
10
which protects the body against all kinds of infections on a regular basis. Other organs including
thymus, bone marrow and lymphoid tissues protect the body from foreign substances and
pathogenic organisms by generating immune responses (the coordinated reaction of immune
cells and molecules against infectious substances and pathogens is called immune response). In
addition, the immune system can also be stimulated to respond to cellular transformation to
avoid generation of cancer. However, abnormal immune responses can cause several
inflammatory diseases, some with a high mortality rate. In summary, the immune response is
vital for fighting disease but could also lead to complications.
1.2.1 Innate and adaptive immunity
The immune system consists of innate immunity, which provides the initial protection against
infections, and adaptive immunity which develops more slowly and mediates the later and
more effective response against infections. The epithelial barriers are the first line of defense
against infectious foreign agents. If pathogens pass the epithelia and enter the tissue or
circulatory systems, they will be attacked by phagocytes or specialized lymphocytes such as
natural killer (NK) cells. In addition to providing an early defense against infections, the innate
immune response triggers and enhances the adaptive immune response against infectious
agents e.g. by producing cytokines. However, some pathogens have evolved to resist and evade
the innate immunity; defense against these infectious agents is the task of the adaptive
immune system.
The adaptive immune response is specialized to combat different types of infections. For
example, antibodies which are the products of B lymphocytes block infections and eliminate
infectious agents in extracellular fluids, while T lymphocytes eradicate intracellular pathogens.
In addition, the adaptive immune system functions to increase the anti-pathogenic mechanisms
of the innate immunity. For instance, antibodies bind to pathogens and these coated pathogens
activate phagocytes to ingest and destroy the pathogens. The main feature of the adaptive
immune system and one that only rarely has been observed in the innate immune system is to
generate and maintain an immunological memory. After activation of adaptive immune cells
and clearing the infection, some adaptive immune cells turn into specific memory cells. In
interaction with a previously encountered antigen, the appropriate memory cells activate and
react more rapidly on a subsequent exposure to that particular antigen. Thus, the adaptive
immune system slowly develops during life as new pathogens are encountered.
1.2.2 Natural killer cells
NK cells have been classified as being part of the innate immune system; however, recent
studies show that NK cells may also display immunological memory [86-88]. NK cells are
immune cells that can provide their effector functions without prior exposure to an antigen.

Ali Khorshidi
11
Activated NK cells release the proteins contained in cytoplasmic granules toward infected cells.
These proteins include molecules that enter the infected cells and activate enzymes that induce
apoptosis. Therefore, NK cells have a significant role to provide early protection of the body
against viral infection [89]. NK cells that encounter infected and stressed cells can also respond
by secreting cytokines like IFN-γ that for example activates macrophages to ingest apoptotic or
infected cells.
The activation of NK cells is determined by a balance between engagement of activating and
inhibitory receptors (Figure 1.3A-B) [90, 91]. The activating receptors recognize molecules
Figure 1.3. Natural killer responses are defined by signals from inhibitory and activation receptors. (A)
An inhibitory receptor on NK cell recognizes self MHC-I on target cell and restrains NK cell activation. (B)
Missing self MHC class I on target cell deactivate inhibitory receptor on NK cell. Thus, activation receptor
stimulate NK cell to produce cytokine and release granule towards target cell.
NK cell
NK cell
Target cell
cell
Target cell
cell
Granule release (Cytotoxicity)
Activation receptor
Activation receptor ligand
Inhibitory receptor
MHC-I
Cell death
A
B

Live Single Cell Imaging and Analysis Using Microfluidic Devices
12
which are often expressed on the surfaces of stressed cells. One of the activating receptors of
NK cells is NKG2D which recognizes molecules that structurally resemble class I major
histocompatibility complex (MHC) proteins. The inhibitory receptors of NK cells are specific for
self-class I MHC molecules, which are expressed on all healthy cells and function to block
signaling of activating receptors (Figure 1.3A). However, when cells lose expression of MHC
class I during viral infection or neoplastic transformations, they can become NK cell targets
(Figure 1.3B). This is known as missing self-recognition and has also been observed after
allogeneic stem cell transplantations [92-94].
The killer cell immunoglobulin-like receptors (KIRs) and NKG2A receptors are two main NK cell
inhibitory receptors. Associations between the genes and alleles of KIRs and the development
of autoimmune diseases suggest a role for NK cells in many different diseases and fundamental
biological processes [95, 96].
Upon contact between NK cells and target cells, receptors and transmembrane proteins can
translocate to form supramolecular activation clusters (SMACs) at the intercellular contact [91,
97, 98]. This is known as the immune synapse and is believed to function as an area for
signaling and secretion of proteins [99]. Therefore, studying the formation of conjugates and
immune synapses between NK cells and target cells is of interest to understand NK cell
behavior. Another factor that is important for how NK cells find and survey target cells is their
migration behavior. It is possible that the migration behavior displayed by individual NK cells
reflect their ability to form conjugates and kill target cells.
1.3 OPTICAL MICROSCOPY
Optical microscopy, also referred to as light microscopy, allows visible light to pass through (or
scatter and reflect) from a sample by using an optical system containing multiple lenses to
magnify images of small samples [100]. Two main basic functions of an optical microscope are
illuminating the specimen and creating a magnified image of it. An illumination optical system
efficiently collects the light emitted from a light source and transmits the light to the specimen.
An observation optical system projects a magnified image of the sample through optical lenses
to either an eyepiece or a light-sensitive camera such as a charge coupled device (CCD)
[101]. Optical microscopes are designed in different ways according to their intended
applications. An upright microscope is used to observe a sample from above whereas an
inverted microscope is used to observe a specimen from beneath.
1.3.1 Fluorescence microscopy
Fluorescence microscopy is a type of light microscope where the light source is used to excite a
fluorescent sample. After excitation, the fluorescent sample emits light with longer wavelength
Ali Khorshidi
13
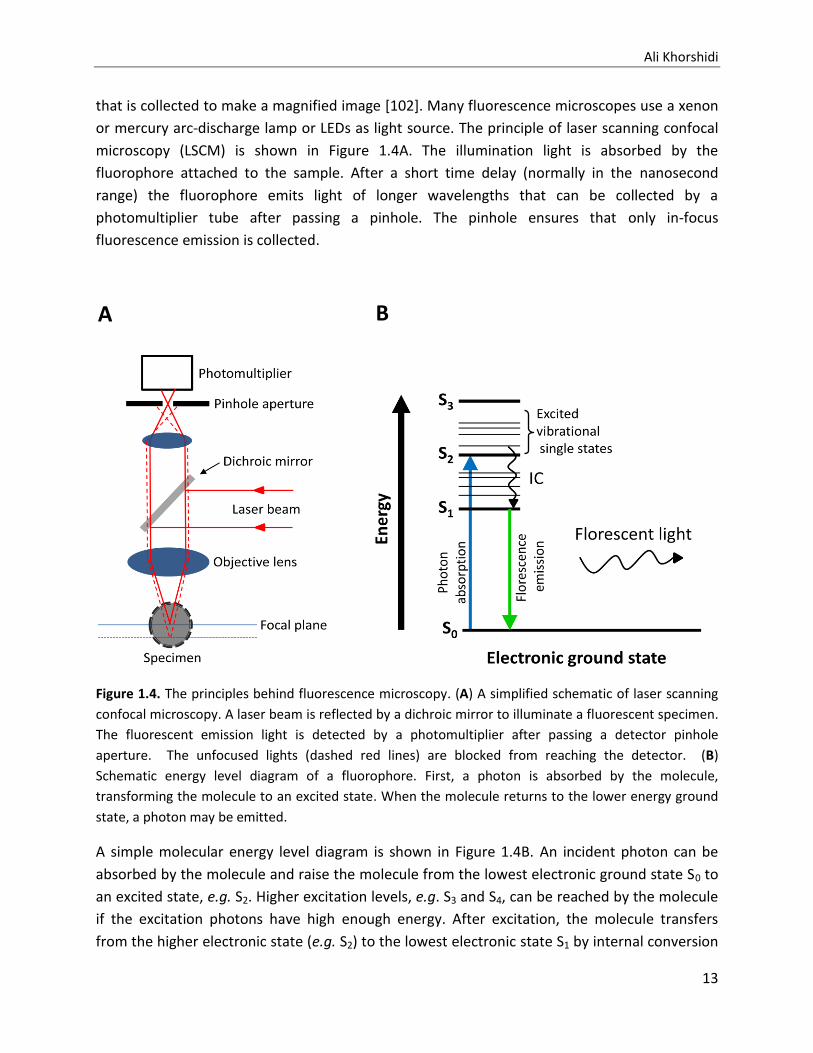
that is collected to make a magnified image [102]. Many fluorescence microscopes use a xenon
or mercury arc-discharge lamp or LEDs as light source. The principle of laser scanning confocal
microscopy (LSCM) is shown in Figure 1.4A. The illumination light is absorbed by the
fluorophore attached to the sample. After a short time delay (normally in the nanosecond
range) the fluorophore emits light of longer wavelengths that can be collected by a
photomultiplier tube after passing a pinhole. The pinhole ensures that only in-focus
fluorescence emission is collected.
Figure 1.4. The principles behind fluorescence microscopy. (A) A simplified schematic of laser scanning
confocal microscopy. A laser beam is reflected by a dichroic mirror to illuminate a fluorescent specimen.
The fluorescent emission light is detected by a photomultiplier after passing a detector pinhole
aperture. The unfocused lights (dashed red lines) are blocked from reaching the detector. (B)
Schematic energy level diagram of a fluorophore. First, a photon is absorbed by the molecule,
transforming the molecule to an excited state. When the molecule returns to the lower energy ground
state, a photon may be emitted.
A simple molecular energy level diagram is shown in Figure 1.4B. An incident photon can be
absorbed by the molecule and raise the molecule from the lowest electronic ground state S0 to
an excited state, e.g. S2. Higher excitation levels, e.g. S3 and S4, can be reached by the molecule
if the excitation photons have high enough energy. After excitation, the molecule transfers
from the higher electronic state (e.g. S2) to the lowest electronic state S1 by internal conversion
A B

Live Single Cell Imaging and Analysis Using Microfluidic Devices
14
(IC). The molecule may return to ground state S0 from the level S1 by emitting a photon or by
converting the energy into heat. The emitted photon (fluorescent light) has a longer
wavelength compared to the excitation photon. Hence, the fluorescent light emitted from the
sample can be separated from the excitation light by the use of optical filters. By filtering out
the excitation and unfocused lights, only the fluorescent objects are observed [103].
1.3.2 Bright field microscopy
The simplest technique in optical microscopy is bright field microscopy where light either
passes through or is reflected scattered or absorbed from a specimen. The contrast in the
sample is provided by absorption of light in some regions of the sample. However, bright field
microscopy has a low contrast in most transparent biological samples. Therefore, it is of
interest to improve the image contrast of highly transparent biological samples without staining
the samples with chemical substances. Labeling biological samples can be expensive, time
consuming and is sometimes toxic for living samples. Therefore, phase imaging techniques can
be used to visualize certain biological structures using interference to convert optical path
length differences to intensity differences. The two most common techniques used in optical
microscopy are phase contrast and differential interference contrast (DIC). A phase contrast
microscope has a special objective and condenser lenses with a phase shifting ring to make
visible the small differences in refractive index as intensity differences in the image. The small
changes in optical path length occur as light passes through different mediums, such as water
and cellular components, with variable refractive index. These optical path length variations are
translated to corresponding changes in light intensity and cause an observable image contrast
[104, 105]. DIC microscopy is based on the gradient of optical path length where the steep
gradients make a high contrast in the image. In other words, the light intensity differences in
the image results from measuring the derivative as a rate of changes in optical path length
across the sample [106, 107].
1.3.3 Two photon microscopy
Two photon microscopy is a fluorescence imaging technique that can provide high definition
images of living cells deep in tissue such as brain, lymph nodes and skin [108]. Two-photon
microscopy is based on the effect of simultaneous absorption of two photons by a
fluorophore. Since the energy of a photon is inversely proportional to its wavelength, the two
photons have a wavelength twice that required for a single excitation photon. Thus, the
fluorophore can be excited with a longer wavelength which increases the penetration depth in
the tissue. Therefore, two-photon microscopy can be a superior alternative to confocal
microscopy for three dimensional imaging of thick tissues. Another advantage of two photon
microscopy is the localization of excitation. Excitation only occurs in the tiny focal point where

Ali Khorshidi
15
there is high enough photon density [109, 110]. Since two-photon excitation only produces
fluorescence at the focal point and no background fluorescence is created, a pinhole is not
needed. Then, the emitted photons are collected by highly sensitive detectors such as
photomultiplier tubes.
1.4 DIGITAL IMAGE PROCESSING
The use of computer algorithms to process digital images is called digital image processing. To
reduce imperfections in the images generated during acquisition, e.g. noise caused by the
imaging hardware, a pre-processing step is often necessary. Pre-processing includes methods
such as sharpening to increase edge information, smoothing to reduce noise, filtering to
decrease intensity non-uniformities, background subtraction and image registration to align the
images [111]. After pre-processing, images are prepared for the following image processing
steps. Segmentation is an imaging processing method to divide an image into objects and
background. A simple but widely used method for image segmentation is thresholding which is
based on the relative intensities in the image. This technique is simple and typically separates
objects from background. Another method for segmentation is edge detection. Different
techniques can be applied for detecting the edges in images such as Sobel edge detection and
Laplacian methods, while Canny edge detection is used as a powerful method to most
applications [112].
If all objects are brighter than the background of the image, thresholding can separate all
objects from background. However, clustered objects cannot be segmented from each other by
applying a threshold to the intensity profile of the image. If cells have high intensity in the
middle and less intensity at the borders towards other cells in the cluster, then all individual
cells can be thought as mountains separated by valleys in the intensity landscape. Then a
segmentation algorithm called Watershed can be used to find mountains in the landscape. The
Watershed algorithm was first suggested by Lantuejoul and Digabel, and then it was extended
by Lantuejoul and Beucher [113]. If the clustered objects are not separated by lower intensity at
their borders, then other methods can be applied to separate objects, for example a Watershed
algorithm based on the shape of the objects. Shaped-based Watershed algorithms use some
features of the objects like roundness and are suitable for some applications e.g. to separate
cell nuclei. This Watershed segmentation transforms the threshold (binary) image of objects
into a distance transformed image [114]. In a distance transformed image, the pixel intensity of
each object corresponds to the distance to the nearest background pixel, so pixels in the center
of objects have higher intensity values than pixels in the object’s borders [115, 116].
Detecting the simple shapes like straight lines or circles is an arising problem in automated
image analysis. An edge detector is often used as a pre-processing method to detect the edge

Live Single Cell Imaging and Analysis Using Microfluidic Devices
16
points or pixels on a desire curve in the image. However, there may be some missing or disjoint
points on the curve due to imperfections in the edge detector or image data. Hence, a method
called Hough transform was developed to group the extracted points to an appropriate set of a
lines, circles or other parametric curves [117, 118]. Hough transform can detect and segment
lines, circles and any structure that has known parametric equation from background. After
separating the objects from each other and from the image background, algorithms such as
feature extraction, classification and automatic tracking can be applied to the segmented
objects.
Ali Khorshidi
17
2 PRESENT INVESTIGATION
Here, first some methods developed for automatic counting and morphology analysis of single
cells in individual microwells (Papers I and III) or droplets (Paper V) are presented. Then, image
analysis techniques are described for tracking and migration analysis of single cells confined in
microwells (Papers II and IV). Finally, the experimental results of the developed methods
including the study of clonal expansion and viability of single cells (Papers I and V), analysis of
transient migration and functional behavior of NK cells (Papers II, III and IV), aggregation of cells
by ultrasound (Paper IV) and monitoring dynamic behavior of single cells (Paper V) are
presented.
2.1 METHODS
First, the design and application of microwell chips and droplet microfluidic devices for specific
biological applications are described. Subsequently, the techniques developed for automatic
image analysis and tracking are presented.
2.1.1. Microwell-based biological assays
In this thesis, different microwell chips were used for high content screening of single cells or
time lapse imaging of small populations of cells. All microwell assays were based on the same
general microchip platform. This platform was designed to meet the requirements of long-term
imaging of live cells with standard optical microscopy. All microchips were made from silicon
wafers with a thickness of 300 μm which was bonded to glass with thickness of 170 µm to allow
high resolution imaging with inverted microscopes. The fabrication process of the chips is
sketched and explained in Figure 2 of Paper 1. The depth of all wells was designed to be deep
enough (300 μm) to prevent cells moving between individual wells. The outer dimensions of all
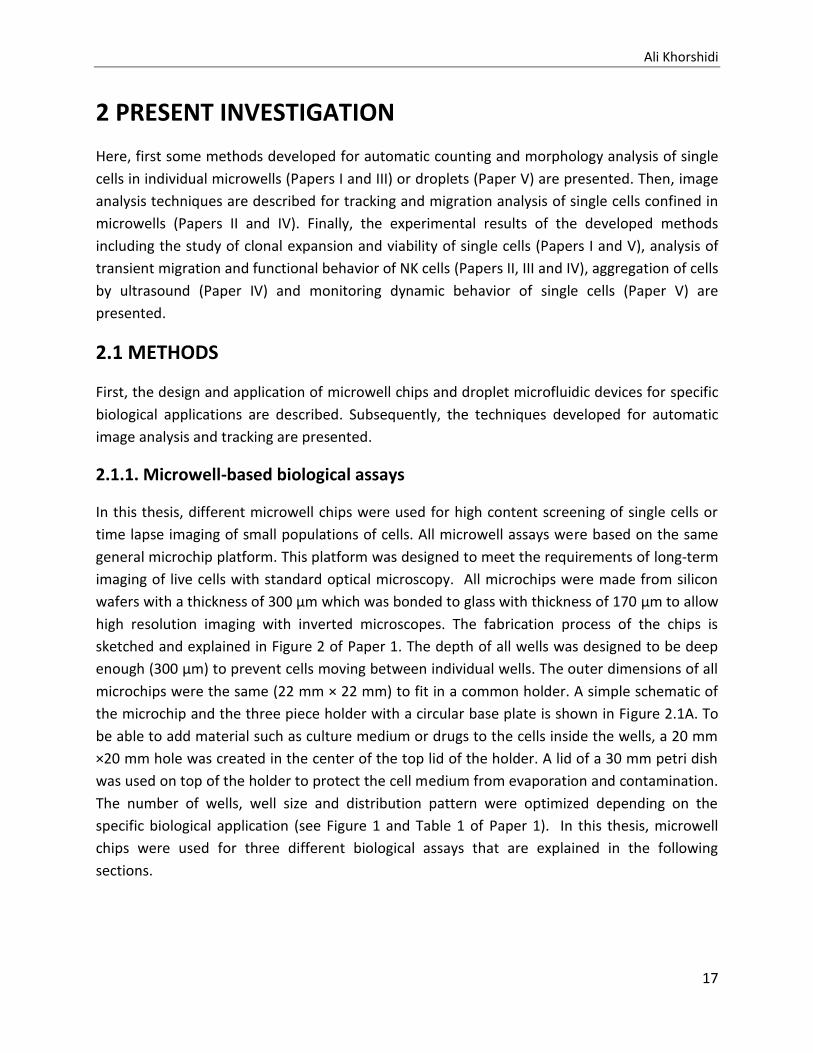
microchips were the same (22 mm × 22 mm) to fit in a common holder. A simple schematic of
the microchip and the three piece holder with a circular base plate is shown in Figure 2.1A. To
be able to add material such as culture medium or drugs to the cells inside the wells, a 20 mm
×20 mm hole was created in the center of the top lid of the holder. A lid of a 30 mm petri dish
was used on top of the holder to protect the cell medium from evaporation and contamination.
The number of wells, well size and distribution pattern were optimized depending on the
specific biological application (see Figure 1 and Table 1 of Paper 1). In this thesis, microwell
chips were used for three different biological assays that are explained in the following
sections.

Live Single Cell Imaging and Analysis Using Microfluidic Devices
18
Figure 2.1. Schematic of the microwell chips used in the different biological assays. (A) Assembly of the
microchip and holder. The three piece holder consists of a bottom made of titanium or polyether ether
ketone (PEEK), a transparent material poly-methyl methacrylate (PMMA) top a polydimethyl siloxane
(PDMS) gasket and magnets to hold all components together. (B) Fluorescent (green circles) and non-
fluorescent (white circles) 221 B cells were seeded in the silicon (Si) wells with width of 50 µm for
studying surveillance and proliferation of cells. (C) Small numbers of NK cells (orange circles) and 293T
target cells (green circles) were confined inside 650x650 µm2 wells for analyzing migration behavior and
interaction between cells. (D) NK cells (orange circles) and 293T target cells (green circles) were
aggregated in the center of a 300 µm well by ultrasound. Ultrasonic forces are schematically shown by
black arrows towards the cells.
Clonal expression and proliferation of cells
To study the proliferation and functional behavior of single or low numbers of cells, a microwell
chip with a large number of small wells (50×50 µm2) was designed and fabricated. These
microwell chips were designed for imaging with a 10x objective and contained 32400 individual
wells which were divided into 20 rows of columns of 20 arrays, each contacting 9x9 wells. It was
shown in previous studies that screening a large number of 50×50 µm2 wells containing a
mixture of natural killer (NK) cells and target cells allowed the detection of different killing
behaviors of NK cells (slow and fast killing) and also to study accumulation of class I MHC
protein at inhibiting NK cell immune synapses [119]. In this thesis, these screening chips were
used to study the proliferation and clonal expansion of 221 human B cells (Figure 2.1B).
A B
C D

Ali Khorshidi
19
Cell migration and cell-cell interactions
For applications where the migration behavior and interaction between different cell
populations were of interest, larger wells were used to provide sufficient space for cell
migration. In Paper 2 , small populations of human peripheral blood NK cells (50-100 cells) and
293T tumor target cells (100-200 cells) were seeded in 650x650 µm2 microwells [120], where
these wells were used for studying NK cell migration and interaction with tumor target cells
(Figure 2.1C). In another study, 450x450 µm2 microwells were used for analyzing morphmetric
parameters of human embryonic kidney (HEK) 293A cells over the time (3 hours).
Aggregation of cells with ultrasound
It was previously shown that ultrasound can be used to control and aggregate cells in the center
of individual wells in a multi-well chip [121]. In this thesis, similar chips containing 100
individual wells, with width of 300 µm separated by 100 µm walls, were applied for aggregating
primary human NK cells and HEK 293T cells in the center of each individual well by ultrasound
to study how effectively the ultrasound could keep cells focused at the center of each well
(Figure 2.1D).
2.1.2 Droplet-based cell analysis
In this thesis, a flow-focusing droplet generator was used to encapsulate single cells in
monodisperse droplets (see Figure 1.1A) for subsequent trapping. To improve cell
encapsulation a magnetic stirrer was used to prevent sedimentation of adherent mammalian
cells in the aqueous solution before injection of the cells into the microchip. The generated
droplets were trapped and stored in a trapping chamber for a specific period of time, 11 hours
(Figure 2.2A-B). The master mold from which the chamber was fabricated had two depth layers
and contained 6000 wells for trapping droplets.
Droplets were squeezed and entered the chamber with depth of 25 µm. Then, droplets were
trapped in arrays of cylindrical wells in the roof of the chamber to minimize surface tension
forces around the droplets. Droplets are allowed to assume a more spherical (minimum energy
shape) inside the wells (Figure2.2A) forming an effective energy barrier to escape. Finally,
continuous phase (oil) washed away un-trapped droplets from the chamber. In order to avoid
evaporation of droplets during incubation time, chip was saturated with and covered in water.
2.1.3 Image acquisition
Image acquisition by bright field and fluorescence microscopy was performed to image cells
confined in microwells or encapsulated in droplets. Inverted microscopes were used to observe
the biological samples in microwell chips; whereas upright microscope was applied to image the
Live Single Cell Imaging and Analysis Using Microfluidic Devices
20
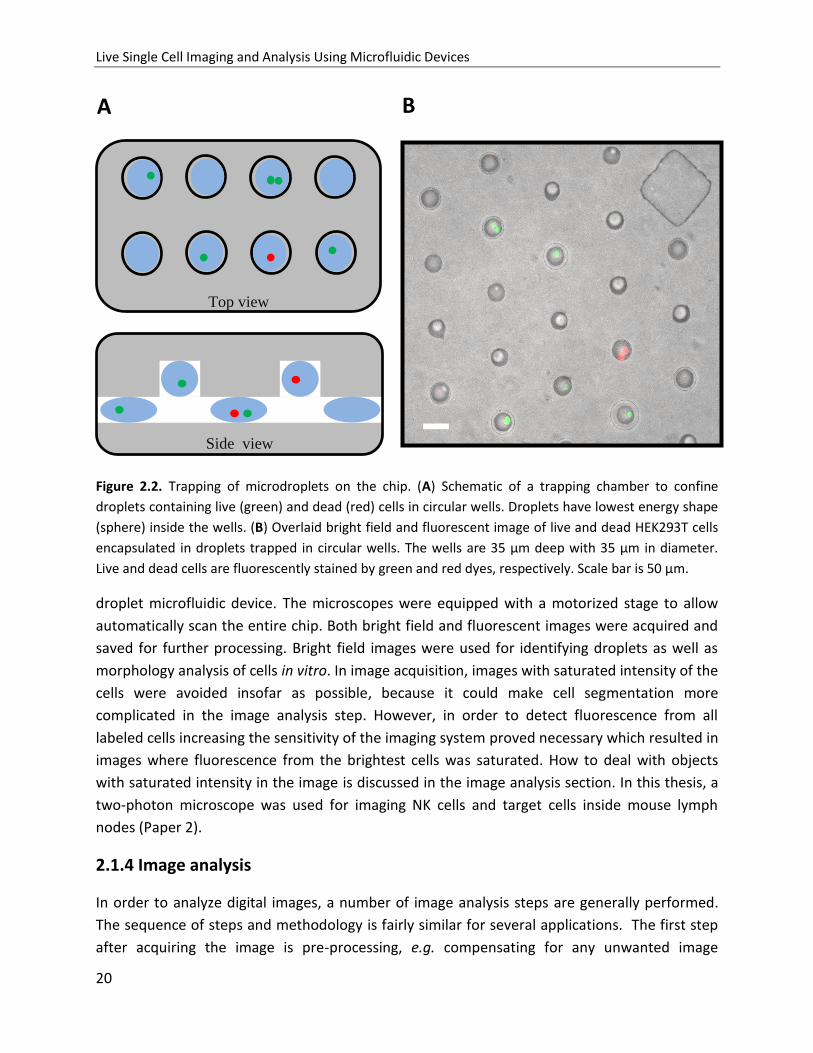
Figure 2.2. Trapping of microdroplets on the chip. (A) Schematic of a trapping chamber to confine
droplets containing live (green) and dead (red) cells in circular wells. Droplets have lowest energy shape
(sphere) inside the wells. (B) Overlaid bright field and fluorescent image of live and dead HEK293T cells
encapsulated in droplets trapped in circular wells. The wells are 35 µm deep with 35 µm in diameter.
Live and dead cells are fluorescently stained by green and red dyes, respectively. Scale bar is 50 µm.
droplet microfluidic device. The microscopes were equipped with a motorized stage to allow
automatically scan the entire chip. Both bright field and fluorescent images were acquired and
saved for further processing. Bright field images were used for identifying droplets as well as
morphology analysis of cells in vitro. In image acquisition, images with saturated intensity of the
cells were avoided insofar as possible, because it could make cell segmentation more
complicated in the image analysis step. However, in order to detect fluorescence from all
labeled cells increasing the sensitivity of the imaging system proved necessary which resulted in
images where fluorescence from the brightest cells was saturated. How to deal with objects
with saturated intensity in the image is discussed in the image analysis section. In this thesis, a
two-photon microscope was used for imaging NK cells and target cells inside mouse lymph
nodes (Paper 2).
2.1.4 Image analysis
In order to analyze digital images, a number of image analysis steps are generally performed.
The sequence of steps and methodology is fairly similar for several applications. The first step
after acquiring the image is pre-processing, e.g. compensating for any unwanted image
Top view
Side view
A B

Ali Khorshidi
21
rotation, subtracting background intensity and eliminating the non-uniformities of image
intensity which could not be avoided during the image acquisition. The next step is image
segmentation to find the objects which are important for further analysis followed by
extraction of features of the segmented objects and classification into different groups. Below,
the methods used in this thesis are described in more detail.
Preprocessing
It is not easy to achieve a uniform illumination of the specimen in the microscope, so the non-
uniformities of intensity need to be reduced in the acquired image. An averaging or smoothing
filter can be used to reduce noise and prepare the images for further processing such as
segmentation. Here, a Gaussian kernel filter was applied for smoothing the fluorescence
images. Subtracting the undesirable background of the image is another important pre-
processing step before the segmentation step. For example in this thesis, undesirable auto-
fluorescence area from the silicon microchip was simply removed by multiplying the image with
a binary mask corresponding to the walls of the wells. In similar way, unwanted regions of the
droplet images were removed by using a binary mask of droplet trapping wells. Furthermore,
identification of the individual wells of the microchip or trapped droplets in droplet device was
also performed before segmentation of the cells inside the wells or the droplets.
Segmentation
In recent years, many techniques have been developed to segment objects from the image
background. Below, some segmentation algorithms which have been tried or used in the
projects are explained.
Thresholding
There are different methods for thresholding digital images [122]. In this thesis, Otsu’s method
was used to separate objects (cells) from background in fluorescent images (Figure 2.3A-C). This
method is fast because it operates directly on the gray level histogram of the image. It is
searching for an optimum threshold to separate two classes of pixels (foreground and
background) which minimizes the weighted within-class variance and maximizes the between-
class variance [123]. The main drawback of thresholding is that it cannot separate clustered
objects from each other.
Edge detection
An edge in an image is a curve that follows a path of rapid change in image intensity. Edges are
often associated with the boundaries of objects. Edge detection is used to identify the edges in

Live Single Cell Imaging and Analysis Using Microfluidic Devices
22
Figure 2.3. Segmenting cells from background by applying different segmentation methods:
thresholding, edge detection and watershed segmentation. (A) A gray scale image of fluorescent stained
cells in 300 µm wells. (B) Intensity profile along the red horizontal line in image A. (C) Binary image of
cells after thresholding using I=50 as threshold (red line in B), where the clustered cells were not
separated. (D) Image after segmentation using Canny edge detection followed by a dilation operation
applied to find objects and close the object boundaries. (E) By applying the watershed segmentation
based on extended h maxima transform, all cells were separated from each other and background. Small
objects were removed as noise while applying the h maxima transform.
the image by looking for the regions where first derivative of the intensity is larger in
magnitude than some threshold, or the second derivative of the intensity has a zero crossing.
In this thesis, the Canny edge detection technique has been used to find the cell boundaries in
bright field images. The edges found by the Canny method were often not connected, so
further operations like dilation followed by erosion were needed for closing boundaries of the
objects (Figure 2.3D).
Watershed segmentation
Here, a watershed segmentation algorithm based on the extended h maxima transform was
used to segment objects from each other and background [124]. All intensity-based maxima are
0 100 200 3000
50
100
150
200
250
XP
ixel in
tensity a
t y =
45
Threshold
D
E
A
B
C

Ali Khorshidi
23
compared to their local neighborhood and only those maxima greater than a given threshold h
are kept. First the image was complemented so that the peaks became valleys, because the
watershed transform identifies low points and not high points. Then, the image was modified
so that the background pixels and the extended maxima pixels were forced to be the only local
minima in the image. Extended h maxima transform was applied as the watershed algorithm to
separate cells in clusters (Figure 2.3E). The drawbacks of the algorithm are over seeding (low h)
and under seeding (high h). An under seeding example is shown in Figure 1.9B where the cells
in a cluster could not be separated from each other because no local maxima was found due to
intensity saturation in the cluster.
Hough transform
In this thesis, in order to detect droplets in bright field image the circular Hough transform was
used [125, 126]. Circular Hough transform relies on the circle equations. A circle equation
with radius r and center coordinates (a, b) can be written with
parametric equations as
where R can be chosen from a range of circle radii, rmin ≤ R ≤ rmax, by user and angel sweeps
through whole 360 degree. Output of the Hough transform is a gray scale image with higher
intensity level for detected circles. Thus, true circles can be detected from background noise by
defining an intensity threshold to the image. Finally, trapped droplets were determined by
positioning the detected droplets to hexagonal grid of the wells array (Figure 2.4A-B).
Feature extraction
Some expressive features based on the actual pixel values and their spatial arrangements
within the object can be extracted after segmenting the objects from background. Some
morphometric features and densitometric features can be calculated from single objects [127].
Morphometric features are based on shape of the objects such as area, perimeter,
compactness and convex area. The area can be obtained from the number of pixels
corresponding to the object, and the perimeter can be calculated by summing the edge pixels
of the object. The compactness can be defined as
and convex area is defined as the number of the pixels in convex hull of the object (convex hull

Live Single Cell Imaging and Analysis Using Microfluidic Devices
24
Figure 2.4. Identified droplet trapping wells using circular Hough transform and hexagonal grid. (A)
droplets are detected by circular Hough transform in bright field image. Droplet trapping wells (green
circles) were identified at positions of hexagional grid of wells from untrapped droplets. (B) Binary image
of droplet trapping wells. Scale bar is 50 µm.
is the set of pixels within the object that can make a convex shape) [128]. Some intensity-based
features such as mean, minimum and maximum intensity of objects can be defined as
densitometric features. In this study, three morphometric features have been calculated to
discriminate single cells from clusters: area, perimeter and compactness (Figure 2.5A-B). Here,
no densitometric features were selected in the feature space because of high intensity variation
in fluorescence image of the stained cells.
Classification
Once features have been extracted from the different objects, each object can be represented
by its n expressive features as a vector in the n-dimensional feature space, . Then, a
discriminate rule can be used to divide the feature space into C separate regions ,…,
(where ⋃ and i=1,…,C). It is assumed that data come from C classes, where each class
has a probability density function in the n dimensional feature space. The discriminate rule
devotes each test point to if є . By knowing the distribution of each class , a
maximum likelihood distribution rule allocates each sample point to class (j=1, … ,C) when
=max . is the likelihood function for Gaussian distribution associated with
class and it can be shown as
A B
Ali Khorshidi
25
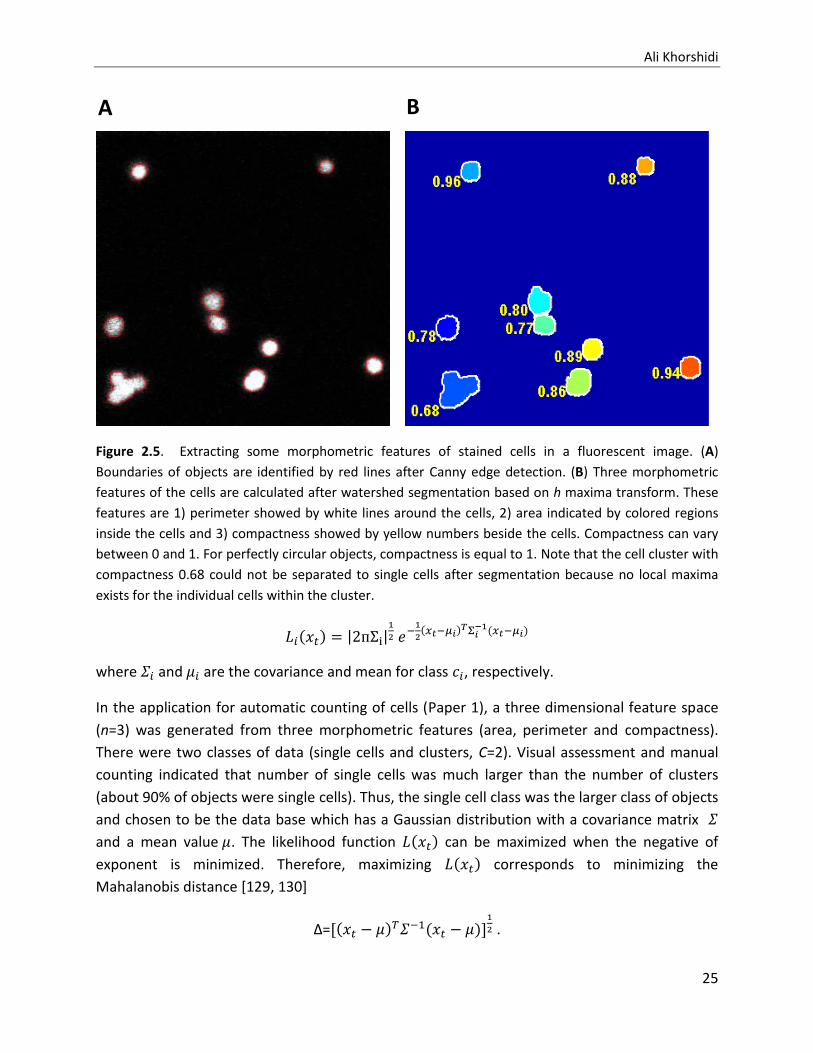
Figure 2.5. Extracting some morphometric features of stained cells in a fluorescent image. (A)
Boundaries of objects are identified by red lines after Canny edge detection. (B) Three morphometric
features of the cells are calculated after watershed segmentation based on h maxima transform. These
features are 1) perimeter showed by white lines around the cells, 2) area indicated by colored regions
inside the cells and 3) compactness showed by yellow numbers beside the cells. Compactness can vary
between 0 and 1. For perfectly circular objects, compactness is equal to 1. Note that the cell cluster with
compactness 0.68 could not be separated to single cells after segmentation because no local maxima
exists for the individual cells within the cluster.
| |
where and are the covariance and mean for class , respectively.
In the application for automatic counting of cells (Paper 1), a three dimensional feature space
(n=3) was generated from three morphometric features (area, perimeter and compactness).
There were two classes of data (single cells and clusters, C=2). Visual assessment and manual
counting indicated that number of single cells was much larger than the number of clusters
(about 90% of objects were single cells). Thus, the single cell class was the larger class of objects
and chosen to be the data base which has a Gaussian distribution with a covariance matrix
and a mean value . The likelihood function can be maximized when the negative of
exponent is minimized. Therefore, maximizing corresponds to minimizing the
Mahalanobis distance [129, 130]
∆=
.
A B

Live Single Cell Imaging and Analysis Using Microfluidic Devices
26
Then, unbiased estimates of and can be computed from the training data set of the data
base as sample covariance matrix S and sample mean ̅, respectively. Therefore, the estimated
Mahalanobis distance of each test point from sample mean of training data set ̅ obtained
as
= ̅ ̅
.
Measuring the for all test points, together with a predefined threshold, can be used to
classify the objects as either inside or outside the base class (single cells). If the presented
distance of is greater than the threshold, the test point would be considered outside the
base class and it would classify as a cluster, otherwise it is assigned to the single cell class.
Leave-one-out method was used for validation of the classifier performance. Therefore, for
testing each sample, one data point (the one left out) in the base space was used to calculate
the distance in the base space group. In Figure 6 of Paper 1, validation of the Mahalanobis
distance is compared to the Euclidean distance which has a covariance matrix equal to the
identity matrix ( =I). Evaluation of the supervised classifier based on Mahalanobis distance
showed about 99% accuracy (explained in detail in the supporting information of Paper 1).
2.1.5 Analysis of migration behavior
To compare migration behavior of NK cells under different conditions, e.g. inflammatory and
non-inflammatory situations, some key properties were defined to characterize NK cell
migration from time-lapse imaging data. In accordance with previous studies the migration data
showed that individual NK cells display a characteristic stop-and-go behavior [131, 132]. In this
thesis, a method was developed to allow analysis of transient migration behavior of individual
cells. Apart from migration also some other properties of NK cells, e.g. cell proliferation, killing,
conjugation with tumor target cells were also assessed.
Single cell tracking
As described previously human primary NK cells and 293T tumor target cells were seeded in a
650×650 µm2 microwell chip (Figure 2.6A). All NK cells were manually tracked through the
whole experiment using the Volocity software (Figure 2.6B). An automatic tracking routine was
tested but not used for this data set because it was found to return false and erroneous
tracking of some NK cells. This was probably caused by the relatively high number of motile NK
cells that sometimes crossed paths or even interacted with each other. However, a simple
automatic tracking algorithm was developed for the ultrasound assay. Ultrasound-induced cell
clusters were automatically tracked inside 300×300 µm2 wells throughout long time-lapse
experiments. This algorithm was based on the nearest neighbor object, where center of gravity

Ali Khorshidi
27
Figure 2.6. Single cell tracking of NK cells in vitro. (A) A fluorescence image of NK cells (orange) and
tumor target cells (green) inside a 650×650 µm2 well (edges of the microwell are shown in orange). (B)
NK cell trajectories throughout the experiment (>12 h). Reproduced from Ref. 133 with permission from
The Royal Society of Chemistry.
of each object was detected and positioned based on binary images formed at each time point
of an image sequence.
Transient migration behavior analysis
After tracking the individual NK cells, the mean squared displacement (MSD) was calculated for
all individual trajectories by:
∑
where xi and yi are 2-dimensional positions of the NK cells, and the total number of NK cell
positions is written as N. The time for the MSD evaluation t is equal to n∆t, where n is an
integer number and ∆t is the time between two consecutive image frames. Analysis of the MSD
for a randomly migrating cell shows that the MSD increases linearly over the time and the slope
of the MSD curve is directly proportional to the migration coefficient M (SlopeMSD = 4M, for 2-
dimensional data).
A B

Live Single Cell Imaging and Analysis Using Microfluidic Devices
28
To detect transient behavior, the MSD of the trajectories was calculated using a sliding window
analysis, where only a small part of the trajectory was evaluated at a time and the sliding
window was moved step-by-step along the trajectory [132]. The size of the window W was
constant during the analysis and it divides each trajectory into small sections of W consecutive
points (Figure 2.7A). Here, the value of W was set to 25 since that gave an acceptable level of
Figure 2.7. TMAP detection using the sliding window approach. (A) Schematic view of the sliding
window approach. The NK cell trajectories were divided into small segments (here W=4) which were
analyzed separately by measuring the slope of the MSD. (B) Migration coefficient M was calculated
along a NK cell trajectory and plotted as a function of time. TMAPs are defined by periods where M
values are below the threshold (M=4.2 µm2/min). Reproduced from Ref. 133 with permission from The
Royal Society of Chemistry.
noise for reliable evaluation of the MSD parameters (migration coefficient and MSD curvature,
see below). All trajectories with shorter lengths than the sliding window were excluded from
the analysis. After extracting the MSD parameters, a rolling average filter with the same size as
the sliding window was applied to the MSD parameter profiles. Thus, each point of the MSD
parameter profiles was smoothed by
∑
where 1 ≤ i ≤ N and N is the size of the smoothed parameter profile. To apply the rolling
average filter to the MSD parameters at the start and end points of each trajectory, W-1 points
Treshold = Brownian
motion of cell-sized
particle
A
B
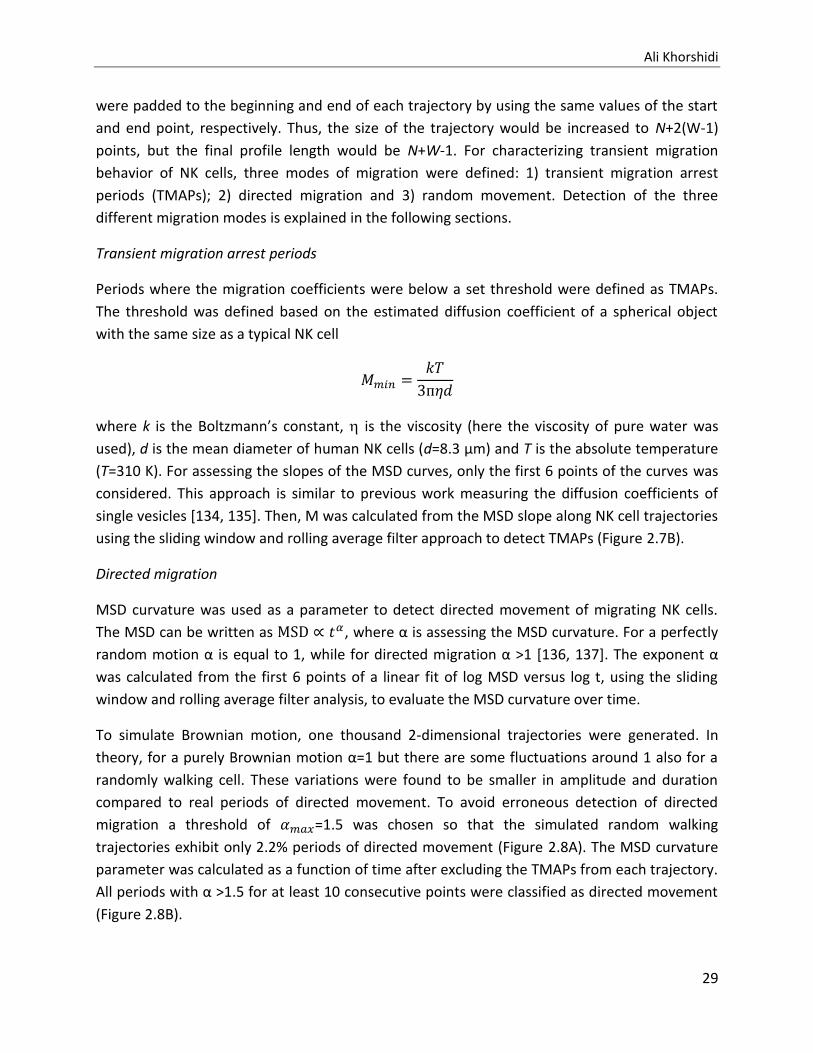
Ali Khorshidi
29
were padded to the beginning and end of each trajectory by using the same values of the start
and end point, respectively. Thus, the size of the trajectory would be increased to N+2(W-1)
points, but the final profile length would be N+W-1. For characterizing transient migration
behavior of NK cells, three modes of migration were defined: 1) transient migration arrest
periods (TMAPs); 2) directed migration and 3) random movement. Detection of the three
different migration modes is explained in the following sections.
Transient migration arrest periods
Periods where the migration coefficients were below a set threshold were defined as TMAPs.
The threshold was defined based on the estimated diffusion coefficient of a spherical object
with the same size as a typical NK cell
where k is the Boltzmann’s constant, is the viscosity (here the viscosity of pure water was
used), d is the mean diameter of human NK cells (d=8.3 μm) and T is the absolute temperature
(T=310 K). For assessing the slopes of the MSD curves, only the first 6 points of the curves was
considered. This approach is similar to previous work measuring the diffusion coefficients of
single vesicles [134, 135]. Then, M was calculated from the MSD slope along NK cell trajectories
using the sliding window and rolling average filter approach to detect TMAPs (Figure 2.7B).
Directed migration
MSD curvature was used as a parameter to detect directed movement of migrating NK cells.
The MSD can be written as , where α is assessing the MSD curvature. For a perfectly
random motion α is equal to 1, while for directed migration α >1 [136, 137]. The exponent α
was calculated from the first 6 points of a linear fit of log MSD versus log t, using the sliding
window and rolling average filter analysis, to evaluate the MSD curvature over time.
To simulate Brownian motion, one thousand 2-dimensional trajectories were generated. In
theory, for a purely Brownian motion α=1 but there are some fluctuations around 1 also for a
randomly walking cell. These variations were found to be smaller in amplitude and duration
compared to real periods of directed movement. To avoid erroneous detection of directed
migration a threshold of =1.5 was chosen so that the simulated random walking
trajectories exhibit only 2.2% periods of directed movement (Figure 2.8A). The MSD curvature
parameter was calculated as a function of time after excluding the TMAPs from each trajectory.
All periods with α >1.5 for at least 10 consecutive points were classified as directed movement
(Figure 2.8B).

Live Single Cell Imaging and Analysis Using Microfluidic Devices
30
Figure 2.8. Detection of directed movement by calculating the MSD curvature parameter (α). (A)
Fraction of false directed movement detected in simulated trajectories of purely Brownian motion.
These trajectories spent less than 2.2% of their time in directed movement for α > 1.5. (B) The MSD
curvature parameter (α) of a trajectory was calculated using a sliding window and plotted over time. The
gaps correspond to TMAPs that had been removed from the trajectory before the analysis. Values of α
>1.5 showed a considerable upward curvature of the MSD which indicated directed migration.
Reproduced from Ref. 133 with permission from The Royal Society of Chemistry.
Random movement
The parameters M and α were used to measure deviations from Brownian motion. The
remaining parts of the trajectories which did not display TMAPs or directed movement were
classified as random movement. Thus, each trajectory could be segmented into TMAPs,
directed migration or random motion periods (Figure 2.9A-C).
Detection of conjugation periods and NK mediated killing
In the in vitro movies, conjugate formation between NK cells and target cells was determined
by assessing the proximity between NK and target cells using both the bright field and
fluorescence images. Target cells that were dying could be detected by release of the cytoplasm
dye. Most tumor target cells released fluorescent dye gradually over the time, while some
tumor target cells immediately released dye when they were killed by NK cells [119].
1 1.5 20
2
4
6
8
X
Fra
ction in D
irecte
d (
%)
=1.5
α
A B

Ali Khorshidi
31
Figure 2.9. Analysis of transient migration behavior of NK cells (A) The trajectories of NK cells were
classified into three modes of migration: 1) TMAPs (red lines); 2) directed migration (green lines) and 3)
random movement (blue lines). (B, C) Two TMAPs of the NK cell trajectory in A (indicated with black
arrows) are demonstrated in higher magnification for clarification. Reproduced from Ref. 133 with
permission from The Royal Society of Chemistry.
2.1.6 Scoring viability of single cells
In this thesis, a time series analysis method was developed to verify viability and dynamic
behavior of single cells in micro droplet. First, encapsulated single cells in the droplets were
imaged by fluorescent and bright field microscopy throughout the experiment. Then, viability of
individual cells was assessed by detecting live (green) or dead (red) signals from fluorescently
labeled cells. Live cells retained live staining dye (green) during the experiment while dead cells
released the green dye and turned red in color. Thus, the red stained cells were detected as
dead cells over experiment time. Differently stained cells were automatically scored and
viability of cells was determined over experiment time.
A B
C

Live Single Cell Imaging and Analysis Using Microfluidic Devices
32
2.2 RESULTS
In the following sections a summary of the results of the Papers, including automatic
quantification of cells, cell morphology analysis, cell aggregation by ultrasound, migration and
functional analysis of NK cells and tracking viability of cells, are presented.
2.2.1 Automatic quantification of cells (Paper I and V)
In Paper 1, human B cells were labeled with Calcein-AM or Far Red DDAO-SM and seeded into
two different microwell chips (well size 50×50 µm2). After screening the chips, the number of
cells within individual wells was scored both automatically and manually (Figure 7 of Paper 1
shows a representative image of automatic counting of labeled cells inside the microwells). For
evaluating the accuracy of the developed method, the results from automatic counting were
compared with manual counting (the latter was assumed to represent 100% accuracy). The
success rate for automatic counting of the total number of cells was 99.7% for Calcein green
labeled cells and 97.4% for Far Red labeled cells. Automatic counting of the number of cells in
individual wells showed an accuracy around 99% for low numbers of cells (1 or 2 cells per well)
and almost 95% for higher numbers of cells (3 or 4 cells per well). The more homogeneous
staining achieved with Calcein led to a slightly higher accuracy in the automatic counting
compared to the cells stained with Far Red dye (see Table 2 of Paper 1).
In Paper 5, a population of HEK293T cells were stained with Calcein-AM and encapsulated in 22
pL droplets with dead staining dye (Ethidium homodimer). Then, generated droplets were
incubated in trapping chamber of the microfluidic device for 11 hours. Trapped droplets were
continuously imaged by fluorescence microscopy during the entire incubation time. Acquired
bright field images were used to automatically detect the trapped droplets using the circular
Hough transform method. Individual cells inside the droplets were segmented from background
in fluorescent images. Number of cells in each droplet was estimated based on the average
area of a single cell (Figure 4 in Paper 5). Automatic quantification was performed by applying
the developed algorithm which is described in Figure S1 of supporting information of Paper 5.
Comparing automatic counting of cells in individual droplets with manual quantification
showed a success rate of 98.4% for automatic counting. Thus, this automatic quantification is a
time effective tool for counting a large number of cells encapsulated in droplets.
2.2.2 Analysis of cell morphology (Paper III)
Small populations of HEK 293A cells were embedded into collagen gel (simulating extracellular
matrix) inside 450×450 µm2 microwells. Then, cells were imaged by bright field microscopy
every minute for 3 hours. After segmenting the cells, some morphometric parameters of the
cells such as perimeter, area and compactness were calculated over time (Figure 2.10A-E).
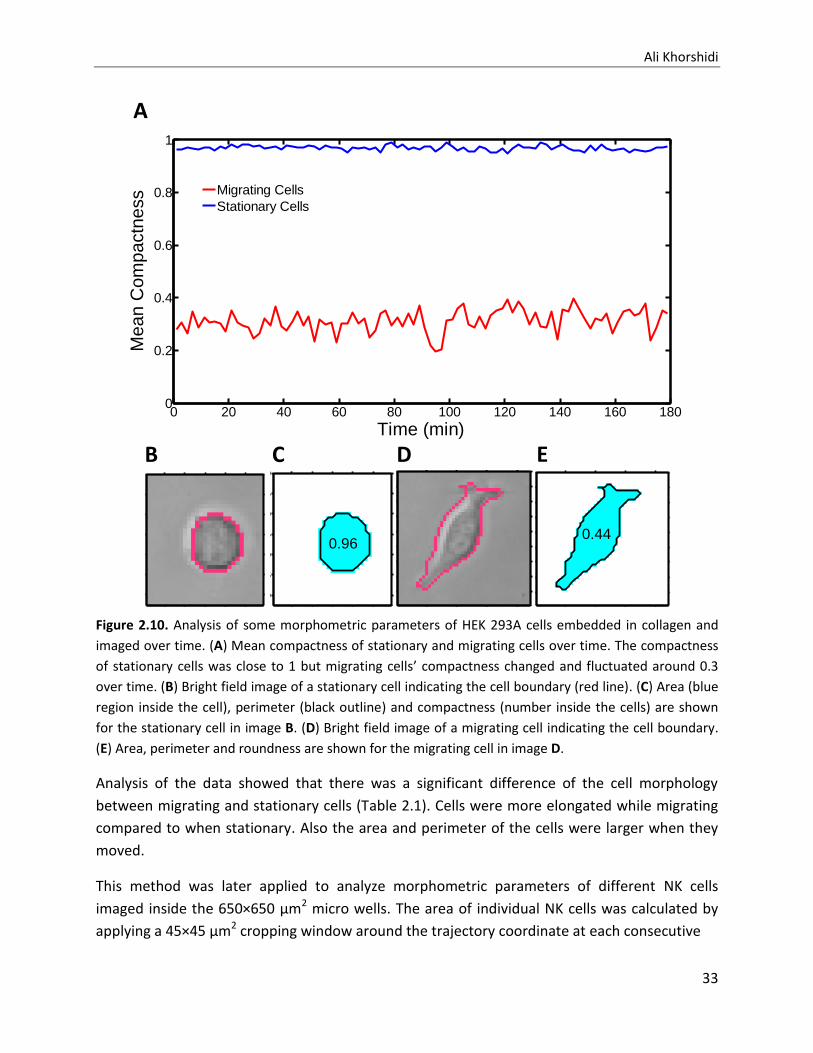
Ali Khorshidi
33
Figure 2.10. Analysis of some morphometric parameters of HEK 293A cells embedded in collagen and
imaged over time. (A) Mean compactness of stationary and migrating cells over time. The compactness
of stationary cells was close to 1 but migrating cells’ compactness changed and fluctuated around 0.3
over time. (B) Bright field image of a stationary cell indicating the cell boundary (red line). (C) Area (blue
region inside the cell), perimeter (black outline) and compactness (number inside the cells) are shown
for the stationary cell in image B. (D) Bright field image of a migrating cell indicating the cell boundary.
(E) Area, perimeter and roundness are shown for the migrating cell in image D.
Analysis of the data showed that there was a significant difference of the cell morphology
between migrating and stationary cells (Table 2.1). Cells were more elongated while migrating
compared to when stationary. Also the area and perimeter of the cells were larger when they
moved.
This method was later applied to analyze morphometric parameters of different NK cells
imaged inside the 650×650 µm2 micro wells. The area of individual NK cells was calculated by
applying a 45×45 µm2 cropping window around the trajectory coordinate at each consecutive
0 20 40 60 80 100 120 140 160 1800
0.2
0.4
0.6
0.8
1M
ea
n C
om
pactn
ess
Time (min)
Migrating Cells
Stationary Cells
5 10 15 20 25
10
15
20
25
30
35
40
0.96
5 10 15 20 25
10
15
20
25
30
35
40
10 20 30 40
15
20
25
30
35
40
45
50
55
0.44
10 20 30 40
15
20
25
30
35
40
45
50
55
A
B C D E

Live Single Cell Imaging and Analysis Using Microfluidic Devices
34
Table 2.1. Morphometric parameters of HEK 293A cells in stationary and migrating modes (N=10).
Results are shown as mean value ± standard deviation.
Area (µm2) Perimeter (µm) Compactness
Stationary 180.2±22.0 47.1±3.3 0.97±0.02
Migrating 321.3±150.8 127.6±48.6 0.31±.017
time point during the experiment. The results showed that NK cells are rounder and have
smaller areas when they are inside TMAPs (data not shown). Assessing functional behavior and
morphology of NK cells revealed that NK cells which were able to kill several target cells (serial
killers) were larger in area or more elongated than other NK cells (non-serial killers), see Figure
7F in Paper 3.
2.2.3 Aggregation of cells using ultrasound (Paper IV)
To study the interactions between primary human NK cells and tumor cells (HEK 293T), a
mixture of cells were aggregated in microwell chips using ultrasound. After staining and seeding
the cells into the microchips, ultrasound was applied to induce aggregation. Subsequently the
cell clusters were imaged every 373 seconds for >16 hours and the cell clusters tracked. In one
set of experiments the ultrasound was applied throughout acquisition of the image series and
in another set of experiments the ultrasound was turned off after the initial aggregation. The
Euclidean distance of the cluster from the center of the well was calculated for all consecutive
time points throughout the experiment. Analysis of the data showed that as long as the
ultrasound was being applied, all clusters aggregated close to the center of each well. However,
when the ultrasound was turned off clusters started to migrate and diverge from the center of
the well. Figure 2.11A shows the average Euclidean distance of clusters from the well center
calculated for 100 individual wells over time. Trajectories of the cell clusters when the
ultrasound was turned on and when it was turned off are shown in Figure 2.11B-C.
In order to investigate effect of actuation voltage on aggregating the cells into center of the
well, adherent HEK 293T cells and non-adherent human 221 B cells were seeded into the wells.
Then, ultrasonic actuation voltage was gradually increased. It was shown that non-adherent
cells are more efficiently trapped in center of the well compared to adherent cells when
ultrasound was applied; see Figure S1 in supporting information of Paper 4.
2.2.4 Migration analysis of NK cells in vitro and in situ (Paper II)
In Paper 2, in order to analyze transient migration behavior of NK cells, small populations of

Ali Khorshidi
35
Figure 2.11. Aggregating HEK 293T cells and NK cells close to the center of individual wells using
ultrasound. (A) Mean Euclidean distance of clustered cells from the center of each well over time for
two conditions: ultrasound turned on (red line) and ultrasound turned off (blue line). When the
ultrasound was turned off the cell clusters started to diverge from the center of the wells. By contrast,
cell clusters stayed close to the center of wells when the ultrasound was on. Reproduced from Ref. 138
with permission from The Royal Society of Chemistry. (B) Trajectory of a cluster over time when the
ultrasound was turned on. (C) Trajectory of a cluster over time when the ultrasound was off. Both
trajectories correspond to 16 hours movies.
0 2 4 6 8 10 12 14 16 1830
40
50
60
70
80
90
100
Time (h)
Euclid
ean d
ista
nce (
um
)
ON
OFF
A
B C
µ

Live Single Cell Imaging and Analysis Using Microfluidic Devices
36
fluorescently labeled NK cells and 293T tumor target cells were confined in 650×650 µm2 wells
and imaged every 2 minutes for >12 hours by fluorescence microscopy. Then, all individual NK
cells were manually tracked. Analysis of the acquired images showed that NK cells migrated and
formed conjugates with 293T tumor target cells which sometimes led to killing of the target
cells. Analysis of the trajectories in detail revealed that there were transient variations in the
migration of individual NK cells. Three modes of migration were defined (TMAPs, directed
migration and random movement) for NK cells which were assessed by calculating the MSD
over time.
Transient migration analysis showed that NK cells continuously shifted between different
modes of migration which could cause the heterogeneity in mean speed observed between
individual NK cells. The mean speed decreased with increased fraction of time that the NK cells
spent in TMAPs (see Figure 3 of Paper 2). In Paper 2, some properties of TMAPs such as size
and duration were calculated (see Figure 4 of Paper 2). TMAPs mostly had similar radii as target
cells (10-20 m) which could be correlated with forming conjugations with target cells [119].
Interestingly, the mean fraction of time that NK cells spent in TMAPs increased from 34% in
absence of target cells to 70% in presence of target cells, showing that interaction with target
cells could increase number and duration of TMAPs.
In presence of target cells, NK cells spent 55% of their time in conjugation with target cells. To
find the degree of correlation between conjugation periods and TMAPs, the overlap between
periods of the target cell conjugation and TMAPs was studied. It was revealed that a large
number of TMAPs formed independently of conjugation, while there was a considerable
population of TMAPs which coincided 100% with conjugation periods (see Figure 5 of Paper 2).
On average, NK cells spent 61% of the time in TMAPs overlapping with conjugation periods. On
the other hand, 74% of the conjugation periods completely overlapped with TMAP; whereas,
there were a few conjugates that did not lead to any TMAPs. Amongst the TMAPs that
overlapped with conjugation periods, some contacts that led to target cell lysis were detected.
The first time point of cell death was marked by an initial drop of Calcein fluorescence signal.
TMAP analysis showed that 35% of the TMAPs did not overlap with conjugate formation.
TMAPs could also be formed for other reasons such as spontaneous stops, cell division or cell
death (see Figure 6 in Paper 2).
2.2.5 Analysis of functional behavior of NK cells (Paper III)
To study functional behavior and killing efficiency of single NK cells, small populations of NK
cells (40-100) and 293T tumor cells (200-300) were seeded inside 650×650 µm2 wells.
Fluorescence imaging and tracking of individual NK cells revealed migration and interaction of
NK cells with tumor target cells throughout the experiment which spanned more than 12 hours.

Ali Khorshidi
37
All conjugations of individual NK cells with target cells and killing events were recorded
throughout the image sequence acquisition. Generally, migration and interaction of NK cells
with target cells were determined in three phases: migration, conjugation and attachment (see
Figure 2 in Paper 3). In migration mode, NK cells moved freely without any contact with target
cells. In conjugation phase, NK cells formed an intercellular contact with target cells and
sometimes delivered a lytic hit to the target cells. These lytic hits were detected by observing
sudden Calcein florescence decrease in target cells and morphological changes in target cells
e.g. cell explosion or blebbing (membrane swelling). After conjugation period, NK cells often
remained attached to the target cells (attachment phase) or detached from the target cells to
continue free migration or forming new conjugations with other target cells.
The Investigation of NK-target conjugation times showed that lytic interactions on average
were shorter than non-lytic contacts. Thus, NK cells active in killing target cells had shorter
interaction periods. An analysis of the time between lytic hit and first morphological signs of
cell death indicated that lytic hits were often (76%) delivered quickly after forming the
conjugations (< 20 minutes) and signs of target cell death were observed for 79% of killing
events within 20 minutes after the lytic hit. Hence, cell death was detected within 60 minutes
after lytic hits for majority of killing events (93%). Analysis of multiple distinct Calcein
fluorescence drops revealed the delivery of several lytic hits against a single target cell. In most
of the killing events, a single lytic hit was observed whereas between 2 and 4 hits were
recorded for 22% of the events. This observation showed that NK cells can deliver cytotoxic
granules to the target cell at different times during the conjugation period.
Tracking functional behavior of individual NK cells over the time of the experiment showed that
around half of the NK cell population (49%) did not kill any target cells, while a small number of
NK cells were responsible for the majority of killings. NK cells were categorized into five groups
based on their conjugation and killing behavior: 1) NK cell that did not have any physical contact
with any target cell 2) NK cells that interact with target cells but did not kill any target cell 3) NK
cells that killed all encountered target cells 4) NK cells that killed until being exhausted 5) NK
cells that behaved randomly in killing and not killing target cells (see Figure 6 in Paper 3). These
differently behaved NK cells in killing target cells showed heterogeneity within the NK cell
population. A small percentage of NK cells (6%) were able to kill more than four target cells.
Around 26% of the target cells were killed by these serial killers. Comparing killing behavior of
serial killers with other cytolytic NK cells showed that serial killers induced faster and stronger
lytic response than other killers (see Figure 7 in Paper 3).
2.2.6 Tracking viability of cells in droplets (Paper V)
In Paper 5, the viability of HEK 293T cells in micro droplets was studied over time. Fluorescently
labeled cells with Calcein AM (live staining dye) were encapsulated in 22 picoliter droplets in

Live Single Cell Imaging and Analysis Using Microfluidic Devices
38
presence of Ethidium homodimer (dead staining dye). Then, the droplets were incubated inside
cylindrical wells in the trapping chamber of the microfluidic device and imaged by florescence
microscopy every 17 minutes for 11 hours. The distribution of cells in each droplet followed the
Poisson distribution . Here is probability obtaining a particular number
of cells in a droplet and is mean value of number of cells per droplet [40, 139, 140]. The
percentage of empty droplets was about 77%, and only 16% of the droplets contained single
cells (see supporting Figure S2 in Paper 5). All droplets containing cells were monitored
throughout the incubation time. The viability of single cells was scored by detecting green (live)
and red (dead) signals from fluorescent images throughout the experiment (see Figure 5 in
Paper 5). Live cells remained green while dead cells turned red in color over time during the
incubation.
Analysis of the data showed that more than 97% of the cells survived during 11 hours
incubation on the chip. This high cell survival rate indicates biocompatibility of the microfluidic
device; whereas no cell proliferation was observed during the experiment perhaps due to the
small volume of the droplets. Tracking cells survival over time revealed that only a small
number of encapsulated cells died at different times during the experiment (see Figure 6 in
Paper 5). The developed droplet microfluidic assay along with the automated image analysis
method allowed tracking of viability of encapsulated single cells in micro droplets during the
experiment.
2.3 DISCUSSION
In this thesis, algorithms for automatic counting of cells in individual microwells and droplets
have been presented. Methods for morphology analysis of individual cells as well as tracking of
single cells aggregated in center of microwells by ultrasound have also been described. In
addition, migration and functional behavior of NK cells confined in microwells have been
analyzed over time. Furthermore, a droplet microfluidic platform has been developed to
monitor viability of encapsulated single cells in micro droplets over experiment time.
Microwell chips have been used for different biological assays, e.g. cell proliferation, cell
aggregation and cell migration. In Paper 1, a microchip with well width of 50 µm was used for
high content imaging of single or a few cells per well. Since manual counting of cells has the
inherent bias of subjective observer as well as being time consuming, an algorithm was
developed to automatically count the number of cells within individual wells. It was shown that
automatic counting could considerably reduce the analysis time and eliminate the subjectivity
in counting. The algorithm for automatic counting of cells was implemented in several steps.
After image acquisition, pre-processing steps including the identification of individual wells,
background subtraction and decreasing the non-uniformities in intensity were applied to the

Ali Khorshidi
39
images. To separate individual cells from one another and the background, segmentation
methods such as thresholding, edge detection and watershed segmentation were tested.
Thresholding as well as edge detection methods were deemed suitable for segmenting the
objects from background, but they failed to separate the individual cells in cell clusters. Thus,
watershed segmentation methods based on the intensity and shape of the objects were
implemented to separate individual cells in clusters from one another. However, over seeding
and under seeding in cell segmentation caused a non-satisfactory success rate in automatic
counting. Hence, thresholding and edge detection methods were used as segmentation
methods to detect the objects in the florescence images and the bright field images,
respectively. Then, a 3-dimensional feature space was created based on three morphometric
parameters of the objects (area, perimeter and compactness). After classifying single cells and
clusters in two distinct groups using Mahalanobis distance, the number of cells in each cluster
was estimated based on the average area of single cells. Although the developed algorithm
could efficiently discriminate single cells from clusters, estimating number of cells in each
cluster remains challenging. Although automatic counting of cells showed an acceptable
success rate, extracting additional morphometric features such as convex hull, length and width
of objects for the classifier or using an unsupervised classifier can efficiently increase speed and
accuracy of the automatic counting. It was evident in Paper 1 that the accuracy of counting was
also related to fluorescent labeling of the cells, where more homogeneously stained cells
yielded more accurate results. Thus, all steps (cell labeling, imaging and counting) are important
to develop functional assays. Although some challenges remain, these studies clearly show that
the combination of the microchip and the automatic counting tools can help us study different
cellular processes at the single cell level.
In Paper 2, it was observed that NK cells confined in 650×650 µm2 wells exhibited a stop-and-go
migration behavior. To better describe this transient behavior, a method was developed to
detect different modes of migration. Several methods have previously been developed to
characterize transient behavior in vesicular movement [141] or for detection of molecules
arrested in transient confinement zones [142, 143]. Here, a simple approach was presented to
analyze and classify the transient migration behavior of NK cells into three different modes:
TMAPs, directed migration and random movement. Some properties such as the mean speed
and the fraction of time that the cells spent in different modes of migration as well as the size,
duration and location of TMAPs were extracted from the image sequences to characterize the
cell migration. Analysis of the NK cell trajectories showed that TMAPs frequently coincided with
conjugation periods and that only small numbers of TMAPs were caused by cell division, cell
death or spontaneous stops. Indeed, forming conjugates with target cells seemed to be the
main reason for NK cells to enter a TMAP. Around 40% of the TMAPs that overlapped with
conjugation led to cell-mediated killing of the target cells. Further manual analysis of the
microchip data has shown that there is an important heterogeneity within the NK cell

Live Single Cell Imaging and Analysis Using Microfluidic Devices
40
populations. A small fraction of NK cells that could kill several targets cells were detected.
These cells were termed serial killers [144], while there existed another population of NK cells
which did not kill any target cells at all (Paper 3). These results show that the microchip-based
migration assay can provide information about immune cells to a level of detail beyond what
had previously been reported. The automatic analysis of migration makes it possible to
efficiently study variations between cells as well as variation in transient behavior for individual
cells. However, some short transient behaviors of NK cells such as rapidly delivering lethal hits
to target cells can be missed due to the use of sliding window and rolling average approaches in
migration analysis. Perhaps it is also possible to correlate migration behavior with functional
behavior such as killing potential of individual NK cells. This assay can also be used to evaluate
how drugs or genotypes can affect migration behavior and functionality of the cells. The
migration analysis method could also be used to further characterize the motility of
lymphocytes or other cells in vivo, e.g. in lymph nodes.
Analysis of data from NK cell mediated killing of tumor cells in Paper3 showed that small
numbers of NK cells were responsible for the majority of the target cell killings. The detailed
information about NK cell mediated cytotoxicity was observed by imaging the cells
compartmentalized in 650×650 µm2 wells over time (Paper 2). The NK-target contacts were
recorded throughout the experiment and NK cells were classified in five different groups based
on their conjugation and cytotoxic response: no interaction with target cells, interaction with
target cells without killing, interaction with target cells with killing, exhausted after killing a
number of target cells and stochastic behavior in killing target cells. In addition, the target cells
were killed with different speeds. Most of the target cell deaths (65%) were slow and coupled
with apoptotic blebbing, while 35% of killing events were fast (necrosis). This variation in killing
speed can be correlated with amount of released pore-forming molecules by NK cells. Analysis
of killing efficiency of NK cells showed that serial killers (6% of the NK cell population) were
responsible for 26% of killings. In addition, serial killers had faster and stronger cytotoxic
responses compared to other killers. This strength of killing response can be correlated with
high quantity of mobilized granules. In another experiment, morphology analysis of HEK 293A
cells embedded in collagen gel inside 450×450 µm2 wells revealed that migrating cells have
different morphometric parameters compared to stationary cells. It was shown in Paper 3 that
NK cells were more elongated (bigger in area) inside TMAPs compared to when they freely
migrated. NK cells were smaller when they formed symmetrical round conjugations with target
cells. Analysis of morphometric parameters indicated that serial killers are bigger than other NK
cells. Possibly this cell morphology analysis can be applied on different cell types such as T cells
and tumor cells to automatically find specific sub-groups of the cells. Therefore, serial killers
showed differences in size, response and efficiency compared to another cytotoxic NK cells.
Analysis of NK-target contacts showed that the average time for lytic conjugations was smaller
than non-lytic interactions. However, the mechanisms of NK-target cell contact and killing are
Ali Khorshidi
41
not well characterized [145]. Previous studies showed that majority of NK cells formed dynamic
and short contacts with target cells [146], whereas a large number of non-lytic contacts had
long conjugation times. This long term interactions can be due to different regulation
thresholds for killing. NK cells received sufficient activation signals to form and retain the
conjugations but not enough to trigger degranulation. It was also observed that NK cells with
faster and stronger cytotoxic response had shorter conjugation times than other killers. In this
study, heterogeneity in cytotoxic response within NK cell populations was observed. However,
the correlation between different NK cell classes and phenotype remained questionable. In
addition, the mechanisms of multiple lytic hits and how speed of killing is linked to strength of
the cytotoxic response is not yet well understood.
It is difficult to acquire high resolution images from NK-target interactions due to cell migration
and fluid drift in microwells. Paper 4 describes how ultrasound can be used to induce cell
aggregation in several wells in parallel, and that the cell aggregates remain stationary over
time. This is an improvement over the techniques used in Papers 1-3 since it allows time-lapse
imaging with high resolution at multiple locations in well, if a microscope equipped with a
moving stage is used. This ultrasonic platform was used for induction of NK-target contacts.
Aggregation of NK cells and target cells at the center of the wells by ultrasonic standing waves
determine a starting time for conjugation. A significant heterogeneity was observed within NK
cells killing response when forming conjugations between IL-2 activated NK cells and tumor
target cells by ultrasonic forces. It was shown that a fraction of NK cells were able to kill the
target cells during the course of the experiment, 4 hours, and a small number of NK cells (serial
killers) killed several target cells. Interestingly, individual NK cells which encountered several
target cells were more efficient in killing the target cells. This could be because of heterogeneity
within the target cells where presence of several target cells provide higher probability that one
of the target cells is sensitive to NK cell response, or receiving simultaneously several responses
from target cells can increase cytotoxic response of the NK cell. Although, understanding the
causes of the difference between the average response and individual response of NK cells is
still unknown. The presented assay can be of use in the study of large numbers of NK-target
interactions at the single cell level. This method should also be applicable to other biological
questions where the study of cell-cell interactions is important.
Time series analysis of functional behavior of single cells e.g. cell-cell interaction can be
performed inside microwells along with automated imaging and image analysis methods. The
assays developed in this thesis can significantly decrease the analysis time for studying dynamic
behavior of a large number of cells at the individual cell level. However, microwell based single
cell analysis methods are restricted in scale and only allow limited preprocessing, manipulation
and post processing of single cells. It is also difficult to separate specific cells in microwells and
recover isolated cells for further analysis. In Paper 5, a droplet microfluidic device was

Live Single Cell Imaging and Analysis Using Microfluidic Devices
42
developed to encapsulate single cells in micrometer scale droplets and incubate them in a
trapping chamber to image for a specific period of time. Automated fluorescence imaging of
the encapsulated cells was performed throughout the incubation time. Then, the acquired
images were subjected to an automated image analysis. In order to discriminate circular objects
(droplets) from other structures in the bright field images and segment the detected droplets
from background of the image a circular Hough transform method was used. Then, the
background outside the cylindrical wells was subtracted using a binary mask overlapping with
the hexagonal grid. In order to detect fluorescent signals from all single cells at different levels
in depth of the image, we increased the sensitivity of the imaging system which resulted in
intensity saturation in some parts of the acquired images. Then, the cells were segmented from
background of fluorescent images by applying a thresholding method based on fluorescence
intensity saturation. Since the encapsulated cells are three dimensional objects and the
acquired images only represent two dimensions, a sliding window approach was applied to the
area profile of the cells to estimate number of cells in each droplet at each time point. The
developed method can be a useful platform for automatically and rapidly counting large
numbers of differently stained cells in individual droplets. It is possible to scale up the method
for analysis of thousands of cells. In addition, the viability of the encapsulated single cells was
scored by detecting dead (red) signals and live (green) signals during the experiment. In earlier
publications, the viability of cells encapsulated in micro droplets was determined to be highly
dependent on cells contact with surrounding surfaces and surfactant-oil system [139, 140]. A
high survival rate of encapsulated cells (>97%) thus indicate the biocompatibility of our
materials and micro device. No cell division was observed throughout the incubation time,
presumably due to the high density of cells or nutrient limitations. However, it could be
possible to enhance cell proliferation rate inside the droplets by increasing the droplet size
[139]. Since positions of thousands of trapped droplets can be precisely identified during the
incubation time, the droplet microfluidic platform can be used to track viability and dynamic
behavior of single cells in individual droplets. Adding some pre-processing or post-processing
modules e.g. droplet sorting to the presented microfluidic platform can extend its biological
applications. The developed droplet microfluidic assay can be used as a tool for several in vitro
single cell analysis applications to study drug sensitivity, cell-cell interaction, cell viability, cell
treatment, protein analysis and cell heterogeneity.

Ali Khorshidi
43
3 CONCLUSION AND FUTURE WORK
In conclusion, this thesis shows that the combination of image analysis and microfluidic devices
enables the design of new biological assays where functional properties of individual cells can
be investigated for large numbers of cells. Automated high throughput single analysis
techniques allow us to study previously inaccessible numbers of cells simultaneously. Accurate
counting or determination of morphological parameters of cells can be essential for assays
where small fractions of specific cells are of interest. Characterization of cell migration behavior
could be a way to investigate functions of, e.g. the immune system in health and disease or the
influence of modern selective drugs like antibodies or siRNA. Furthermore, automated single
cell tracking, migration analysis and morphological classification are likely to become
increasingly important as imaging methods develop rapidly to allow time-lapse studies with
resolution at the single cell level in situ, e.g. in lymph nodes, the thymus or in solid tumors.
In this thesis, algorithms for automatic counting of cells in individual microwells and micro
droplets were presented. Since some biological assays may require a very high accuracy in the
automatic counting, it is necessary to further optimize all steps in the procedure including cell
labeling, imaging and the algorithms for cell segmentation and classification. Furthermore,
using unsupervised classifiers could significantly decrease complexity and computation time in
the classification step.
A method to analyze migration behavior of NK cells in two-dimensional imaging data was also
presented in this thesis. In the future, it should be possible to easily extend the migration
analysis to cells tracked in three-dimensions. This is important if this tool is going to be used for
characterization of cells imaged in gel matrices or in situ. Although, this may involve
overcoming some experimental challenges. I believe that it will also be possible to develop
more accurate algorithms for automatic cell tracking, which would significantly reduce the
analysis time compared to manual tracking. Additionally, automated detection of conjugation
periods between NK cells and target cells and finding cell-mediated killing events could
decrease the analysis time.
A droplet based microfluidic device along with automated imaging and image analysis was
presented as a useful tool to track viability and dynamic behavior of single cells during the
experiment. The use of this microfluidic platform could be extended to include a large range of
in vitro single cell analysis applications by the addition of some pre-processing or post-
processing modules such as droplet fusion and sorting.
In summary, it was shown that the microfluidic devices together with automated imaging and
analysis can be applied as a useful tool to address a wide range of pressing biological questions

Live Single Cell Imaging and Analysis Using Microfluidic Devices
44
in order to understand and study cells behavior at individual level. The presented assays can
also be used to automatically and rapidly analyze a large number of single cells under different
conditions or treatments. These high throughput single cell analysis techniques can be used to
study the cell heterogeneity as well as isolate specific sub-groups of the cells within a cell
population.

Ali Khorshidi
45
4 ACKNOWLEDGEMENTS
Since almost all of you will read this part of the thesis first, I tried to thank you all.
I would like to especially thank to the following people for supporting me and contributing to
this work:
This research was financially supported by the Swedish Research Council (Vetenskapsrådet).
First I want to express my deepest gratitude to my supervisor Prof. Helene Andersson Svahn. I
am indebted to you for giving me the opportunity to complete my PhD studies in your group.
I’m grateful for all your help, support, and advices, and for creating such an excellent research
environment. Thanks for trusting me and giving me freedom to follow my research interests.
I would also like to thank to my co-supervisor Dr Håkan Jönsson for his great and valuable
supervision. Thank you for helping me to develop my knowledge in droplet microfluidics field. I
am particularly thankful for your help in preparation and proof reading of this thesis. You are
not only a great supervisor, but also a nice friend and neighbor outside the work.
I would like to thank my co-supervisor Prof. Carolina Wählby at Uppsala University for her
wonderful feedbacks, scientific meetings and discussions in image analysis.
My biggest thanks go to Prof. Aman Russom for teaching me inertial microfluidics and sharing
his research and academic experience. I would not able to finish my PhD study without your
help and support. Thanks for all scientific discussions and helpful conversations, and for sharing
happy time inside and outside the work. Thanks Sir.
I would like to thank and acknowledge my current colleagues and friends at Science for Life
laboratory: Martin Hjelmare for providing florescence microscope and helping with imaging.
Harisha for borrowing red syringe pumps for the experiments and being a reliable and valuable
friend. Yunpeng for his valuable tips and advice in droplet microfluidics. Emilie for helping with
borrowing fluorescent dyes and batteries. Staffan for showing how to make good PDMS chips.
Dr. Jesper for sharing his knowledge and experience in Comsol. Other colleagues for sharing
happy time at Nano-biotechnology group: Sahar, Prem, Lovisa, Thiruppathiraja, Sang
Kwonhan, Mary, Zenib, Asim, Sergey, Nilay, Philippa and Gustav. Thanks Martina for helping
me with administrative work.
I want to thank my previous colleagues and friends at Nano-biotechnology group: Jordi for
having crazy time in Stockholm and Barcelona. Jonas for having fun and crazy time before
marriage. Other colleagues for bringing fun in the lab: Pavan, Luis, Loes and Christian. I would

Live Single Cell Imaging and Analysis Using Microfluidic Devices
46
like to acknowledge my previous roommates at AlbaNova for keeping our office probably the
quietest room in the building: Johan, Filippa, Amrita and Andreas.
I want to acknowledge my licentiate supervisor at cell physics Prof. Hjalmar Brismar for
accepting me in his group as a licentiate student and his supervision. I am especially grateful for
his great advice and help to follow my interest after my licentiate degree. I also want to thank
my co-supervisor at cell physics Dr. Björn Önfelt. I would like to especially thank Peter Unsbo
for helping me to organize my teaching time at the applied physics department and supporting
students. I like to acknowledge Prof. Klas Kärre for having great scientific meetings at
department of MTC at Karolinska Institute. Thanks all my friends and colleague at cell physics:
Bruno for teaching me how to do the biological experiments. Karin for sharing her experience
in cell biology when I worked at Karolinska Institute in Huddinge. Thomas Frisk for making
microwell chips. Karolin for bringing fun into the lab. Marina for helping me in the lab. Other
colleagues at cell physics: Jacob, Athanasia, Per, Johanna, Elin, Antonia, Simon, Ylva, Jeny,
Helena, Hattie, Reza, Sussana, Padideh and Robert.
I would like to thank my previous supervisors at Chalmers: Tomas McKelvey and Mikael
Persson for making me interested in science. Patrik from Medfield Company for being the best
boss ever.
Thanks my friends at Astrid Lindgren´s hospital (now mostly at Science forLlife laboratory):
Zachi, Thomas, Jay, Linda and Mathias for having fun outside the lab. Thanks Thomas for
helping with the language check of some part of the thesis. Special thanks to my best friends
Hooman and Nima Seifi for having wonderful time together. Thanks Nima for being a real
friend. I would have a boring student life without you.
Many thanks to my family for their love and support in my life. My kind sisters Roya, Donya
and Mona. Special thanks to Donya for her care and support in my life. Thanks to my brothers
in law Ali Dolatabadi and Majid for our valuable friendship. My lovely nephews Adrin and
Edwin to bring a lot of joy in my life. My parents for always teaching me important values in my
life. I appreciate how much both of you have helped me with my life, love and study and given
me all of the things that have gotten me here. Thank you Mom and Dad.
Thanks my angel Zuzana for your endless love and support. Thanks for always being beside
me in happy and sad moments in my life. You are my reason for yesterdays and my promise for
tomorrow. Thanks for brightening my life with the warmth of your love.
Thanks to my new source of energy, my little cute son Sam. You have brought light, hope and new meaning to my life. In fact my wish was duplicate myself in order that such a remarkable pattern would not be lost in the world.

Ali Khorshidi
47
5 REFERENCES
1. El-Ali, J., P.K. Sorger, and K.F. Jensen, Cells on chips. Nature, 2006. 442(7101): p. 403-11. 2. Walling, M.A. and J.R. Shepard, Cellular heterogeneity and live cell arrays. Chem Soc Rev,
2011. 40(7): p. 4049-76. 3. Spudich, J.L. and D.E. Koshland, Jr., Non-genetic individuality: chance in the single cell.
Nature, 1976. 262(5568): p. 467-71. 4. Di Carlo, D. and L.P. Lee, Dynamic single-cell analysis for quantitative biology. Anal
Chem, 2006. 78(23): p. 7918-25. 5. Le Gac, S. and A. van den Berg, Single cells as experimentation units in lab-on-a-chip
devices. Trends Biotechnol, 2010. 28(2): p. 55-62. 6. Longo, D. and J. Hasty, Dynamics of single-cell gene expression. Mol Syst Biol, 2006. 2: p.
64. 7. Sims, C.E. and N.L. Allbritton, Analysis of single mammalian cells on-chip. Lab Chip, 2007.
7(4): p. 423-40. 8. Andersson-Svahn, H. and A. van den Berg, Single cells or large populations? Lab Chip,
2007. 7(5): p. 544-6. 9. Voldman, J., Engineered systems for the physical manipulation of single cells. Curr Opin
Biotechnol, 2006. 17(5): p. 532-7. 10. Whitesides, G.M., The origins and the future of microfluidics. Nature, 2006. 442(7101):
p. 368-73. 11. Mettetal, J.T., et al., Predicting stochastic gene expression dynamics in single cells. Proc
Natl Acad Sci U S A, 2006. 103(19): p. 7304-9. 12. Yu, J., et al., Probing gene expression in live cells, one protein molecule at a time.
Science, 2006. 311(5767): p. 1600-3. 13. Oheim, M., High-throughput microscopy must re-invent the microscope rather than
speed up its functions. Br J Pharmacol, 2007. 152(1): p. 1-4. 14. Pepperkok, R. and J. Ellenberg, High-throughput fluorescence microscopy for systems
biology. Nat Rev Mol Cell Biol, 2006. 7(9): p. 690-6. 15. Villas, B.H., Flow cytometry: an overview. Cell Vis, 1998. 5(1): p. 56-61. 16. Krutzik, P.O. and G.P. Nolan, Fluorescent cell barcoding in flow cytometry allows high-
throughput drug screening and signaling profiling. Nat Methods, 2006. 3(5): p. 361-8. 17. Nolan, J.P. and L.A. Sklar, The emergence of flow cytometry for sensitive, real-time
measurements of molecular interactions. Nat Biotechnol, 1998. 16(7): p. 633-8. 18. Martin, J.C. and D.E. Swartzendruber, Time: a new parameter for kinetic measurements
in flow cytometry. Science, 1980. 207(4427): p. 199-201. 19. Roostalu, J., et al., Cell division in Escherichia coli cultures monitored at single cell
resolution. BMC Microbiol, 2008. 8: p. 68. 20. Kandel, E.R., J.H. Schwartz, and T.M. Jessell, Principles of neural science. 4th ed. 2000,
New York: McGraw-Hill, Health Professions Division. xli, 1414 p. 21. Harnett, M.M., Laser scanning cytometry: understanding the immune system in situ. Nat
Rev Immunol, 2007. 7(11): p. 897-904.

Live Single Cell Imaging and Analysis Using Microfluidic Devices
48
22. Arcibal, I.G., M.F. Santillo, and A.G. Ewing, Recent advances in capillary electrophoretic analysis of individual cells. Anal Bioanal Chem, 2007. 387(1): p. 51-7.
23. Kehr, J., Single cell technology. Curr Opin Plant Biol, 2003. 6(6): p. 617-21. 24. Lindstrom, S., et al., High-density microwell chip for culture and analysis of stem cells.
PLoS One, 2009. 4(9): p. e6997. 25. Friedman, M., et al., Engineering and characterization of a bispecific HER2 x EGFR-
binding affibody molecule. Biotechnol Appl Biochem, 2009. 54(2): p. 121-31. 26. Lindstrom, S., et al., PCR amplification and genetic analysis in a microwell cell culturing
chip. Lab Chip, 2009. 9(24): p. 3465-71. 27. Leng, J. and J.B. Salmon, Microfluidic crystallization. Lab Chip, 2009. 9(1): p. 24-34. 28. Zheng, B., L.S. Roach, and R.F. Ismagilov, Screening of protein crystallization conditions
on a microfluidic chip using nanoliter-size droplets. J Am Chem Soc, 2003. 125(37): p. 11170-1.
29. Burns, J.R. and C. Ramshaw, The intensification of rapid reactions in multiphase systems using slug flow in capillaries. Lab Chip, 2001. 1(1): p. 10-5.
30. Duffy, D.C., et al., Rapid Prototyping of Microfluidic Systems in Poly(dimethylsiloxane). Anal Chem, 1998. 70(23): p. 4974-84.
31. Kim, H., et al., Controlled production of emulsion drops using an electric field in a flow-focusing microfluidic device. Applied Physics Letters, 2007. 91(13).
32. Toepke, M.W. and D.J. Beebe, PDMS absorption of small molecules and consequences in microfluidic applications. Lab Chip, 2006. 6(12): p. 1484-6.
33. Link, D.R., et al., Geometrically mediated breakup of drops in microfluidic devices. Phys Rev Lett, 2004. 92(5): p. 054503.
34. Nisisako, T., T. Torii, and T. Higuchi, Droplet formation in a microchannel network. Lab Chip, 2002. 2(1): p. 24-6.
35. Anna, S.L., N. Bontoux, and H.A. Stone, Formation of dispersions using "flow focusing" in microchannels. Applied Physics Letters, 2003. 82(3): p. 364-366.
36. Mugele, F. and J.C. Baret, Electrowetting: From basics to applications. Journal of Physics-Condensed Matter, 2005. 17(28): p. R705-R774.
37. Tawfik, D.S. and A.D. Griffiths, Man-made cell-like compartments for molecular evolution. Nat Biotechnol, 1998. 16(7): p. 652-6.
38. Li, H.W., et al., Fabrication of polystyrene microfluidic devices using a pulsed CO2 laser system. Microsystem Technologies-Micro-and Nanosystems-Information Storage and Processing Systems, 2012. 18(3): p. 373-379.
39. Holtze, C., et al., Biocompatible surfactants for water-in-fluorocarbon emulsions. Lab Chip, 2008. 8(10): p. 1632-9.
40. Huebner, A., et al., Quantitative detection of protein expression in single cells using droplet microfluidics. Chem Commun (Camb), 2007(12): p. 1218-20.
41. Edd, J.F., et al., Controlled encapsulation of single-cells into monodisperse picolitre drops. Lab Chip, 2008. 8(8): p. 1262-4.
42. Song, H., D.L. Chen, and R.F. Ismagilov, Reactions in droplets in microfluidic channels. Angew Chem Int Ed Engl, 2006. 45(44): p. 7336-56.
43. Brouzes, E., et al., Droplet microfluidic technology for single-cell high-throughput screening. Proc Natl Acad Sci U S A, 2009. 106(34): p. 14195-200.
Ali Khorshidi
49
44. Chabert, M., K.D. Dorfman, and J.L. Viovy, Droplet fusion by alternating current (AC) field electrocoalescence in microchannels. Electrophoresis, 2005. 26(19): p. 3706-15.
45. Tan, Y.C., et al., Design of microfluidic channel geometries for the control of droplet volume, chemical concentration, and sorting. Lab Chip, 2004. 4(4): p. 292-8.
46. Bremond, N., A.R. Thiam, and J. Bibette, Decompressing emulsion droplets favors coalescence. Phys Rev Lett, 2008. 100(2): p. 024501.
47. Niu, X., et al., Pillar-induced droplet merging in microfluidic circuits. Lab Chip, 2008. 8(11): p. 1837-41.
48. Thiam, A.R., N. Bremond, and J. Bibette, Breaking of an emulsion under an ac electric field. Phys Rev Lett, 2009. 102(18): p. 188304.
49. Mazutis, L., et al., Multi-step microfluidic droplet processing: kinetic analysis of an in vitro translated enzyme. Lab Chip, 2009. 9(20): p. 2902-8.
50. Baroud, C.N., M.R. de Saint Vincent, and J.P. Delville, An optical toolbox for total control of droplet microfluidics. Lab Chip, 2007. 7(8): p. 1029-33.
51. Clausell-Tormos, J., A.D. Griffiths, and C.A. Merten, An automated two-phase microfluidic system for kinetic analyses and the screening of compound libraries. Lab Chip, 2010. 10(10): p. 1302-7.
52. Hsieh, A.T., et al., Nonviral gene vector formation in monodispersed picolitre incubator for consistent gene delivery. Lab Chip, 2009. 9(18): p. 2638-43.
53. Cho, S.K., H.J. Moon, and C.J. Kim, Creating, transporting, cutting, and merging liquid droplets by electrowetting-based actuation for digital microfluidic circuits. Journal of Microelectromechanical Systems, 2003. 12(1): p. 70-80.
54. Jullien, M.C., et al., Droplet breakup in microfluidic T-junctions at small capillary numbers. Physics of Fluids, 2009. 21(7).
55. Song, H. and R.F. Ismagilov, Millisecond kinetics on a microfluidic chip using nanoliters of reagents. J Am Chem Soc, 2003. 125(47): p. 14613-9.
56. Song, H., J.D. Tice, and R.F. Ismagilov, A microfluidic system for controlling reaction networks in time. Angew Chem Int Ed Engl, 2003. 42(7): p. 768-72.
57. Sarrazin, F., et al., Mixing characterization inside microdroplets engineered on a microcoalescer. Chemical Engineering Science, 2007. 62(4): p. 1042-1048.
58. Song, H., et al., Experimental test of scaling of mixing by chaotic advection in droplets moving through microfluidic channels. Appl Phys Lett, 2003. 83(12): p. 4664-4666.
59. Cordero, M.L., et al., Mixing via thermocapillary generation of flow patterns inside a microfluidic drop. New Journal of Physics, 2009. 11.
60. Joensson, H.N., M. Uhlen, and H.A. Svahn, Droplet size based separation by deterministic lateral displacement-separating droplets by cell--induced shrinking. Lab Chip, 2011. 11(7): p. 1305-10.
61. Link, D.R., et al., Electric control of droplets in microfluidic devices. Angew Chem Int Ed Engl, 2006. 45(16): p. 2556-60.
62. Ahn, K., et al., Dielectrophoretic manipulation of drops for high-speed microfluidic sorting devices. Applied Physics Letters, 2006. 88(2).
63. Franke, T., et al., Surface acoustic wave (SAW) directed droplet flow in microfluidics for PDMS devices. Lab Chip, 2009. 9(18): p. 2625-7.
Live Single Cell Imaging and Analysis Using Microfluidic Devices
50
64. Zhang, K., et al., On-chip manipulation of continuous picoliter-volume superparamagnetic droplets using a magnetic force. Lab Chip, 2009. 9(20): p. 2992-9.
65. Baret, J.C., et al., Fluorescence-activated droplet sorting (FADS): efficient microfluidic cell sorting based on enzymatic activity. Lab Chip, 2009. 9(13): p. 1850-8.
66. Fidalgo, L.M., et al., From microdroplets to microfluidics: selective emulsion separation in microfluidic devices. Angew Chem Int Ed Engl, 2008. 47(11): p. 2042-5.
67. Frenz, L., et al., Reliable microfluidic on-chip incubation of droplets in delay-lines. Lab Chip, 2009. 9(10): p. 1344-8.
68. Shim, J.U., et al., Control and measurement of the phase behavior of aqueous solutions using microfluidics. J Am Chem Soc, 2007. 129(28): p. 8825-35.
69. Ghadessy, F.J., et al., Generic expansion of the substrate spectrum of a DNA polymerase by directed evolution. Nat Biotechnol, 2004. 22(6): p. 755-9.
70. Schmitz, C.H., et al., Dropspots: a picoliter array in a microfluidic device. Lab Chip, 2009. 9(1): p. 44-9.
71. Lee, J.N., C. Park, and G.M. Whitesides, Solvent compatibility of poly(dimethylsiloxane)-based microfluidic devices. Anal Chem, 2003. 75(23): p. 6544-54.
72. Ashton, R.S., et al., High-throughput screening of gene function in stem cells using clonal microarrays. Stem Cells, 2007. 25(11): p. 2928-35.
73. Chen, C.S., et al., Geometric control of cell life and death. Science, 1997. 276(5317): p. 1425-8.
74. Lindstrom, S. and H. Andersson-Svahn, Overview of single-cell analyses: microdevices and applications. Lab on a Chip, 2010. 10(24): p. 3363-3372.
75. Jiang, X., et al., Directing cell migration with asymmetric micropatterns. Proc Natl Acad Sci U S A, 2005. 102(4): p. 975-8.
76. Thery, M., et al., The extracellular matrix guides the orientation of the cell division axis. Nat Cell Biol, 2005. 7(10): p. 947-53.
77. Nakanishi, J., et al., Recent advances in cell micropatterning techniques for bioanalytical and biomedical sciences. Anal Sci, 2008. 24(1): p. 67-72.
78. Nilsson, J., et al., Review of cell and particle trapping in microfluidic systems. Anal Chim Acta, 2009. 649(2): p. 141-57.
79. Di Carlo, D., L.Y. Wu, and L.P. Lee, Dynamic single cell culture array. Lab Chip, 2006. 6(11): p. 1445-9.
80. Liu, W., et al., A novel permalloy based magnetic single cell micro array. Lab Chip, 2009. 9(16): p. 2381-90.
81. Grier, D.G., A revolution in optical manipulation. Nature, 2003. 424(6950): p. 810-6. 82. Ramser, K. and D. Hanstorp, Optical manipulation for single-cell studies. J Biophotonics,
2010. 3(4): p. 187-206. 83. Taff, B.M. and J. Voldman, A scalable addressable positive-dielectrophoretic cell-sorting
array. Anal Chem, 2005. 77(24): p. 7976-83. 84. Gor’kov, S.L.P., On the Forces Acting on a Small Particle in an Acoustical Field in an Ideal
Fluid. Phys. Dokl. (Engl. Transl.), , 1962. 6: p. 773–775. 85. Manneberg. O., V.B., Svennebring. J. , Hertz. H. M., Önfelt. B., and Wiklund. M. , A
three-dimensional ultrasonic cage for characterization of individual cells. Appl. Phys. Lett., 2008. 93(063901).

Ali Khorshidi
51
86. Cooper, M.A., et al., Cytokine-induced memory-like natural killer cells. Proc Natl Acad Sci U S A, 2009. 106(6): p. 1915-9.
87. O'Leary, J.G., et al., T cell- and B cell-independent adaptive immunity mediated by natural killer cells. Nat Immunol, 2006. 7(5): p. 507-16.
88. Sun, J.C., J.N. Beilke, and L.L. Lanier, Adaptive immune features of natural killer cells. Nature, 2009. 457(7229): p. 557-61.
89. Orange, J.S., Human natural killer cell deficiencies. Curr Opin Allergy Clin Immunol, 2006. 6(6): p. 399-409.
90. Caligiuri, M.A., Human natural killer cells. Blood, 2008. 112(3): p. 461-9. 91. Davis, D.M., et al., The human natural killer cell immune synapse. Proc Natl Acad Sci U S
A, 1999. 96(26): p. 15062-7. 92. Karre, K., et al., Selective Rejection of H-2-Deficient Lymphoma Variants Suggests
Alternative Immune Defense Strategy. Nature, 1986. 319(6055): p. 675-678. 93. Ljunggren, H.G., et al., Empty MHC class I molecules come out in the cold. Nature, 1990.
346(6283): p. 476-80. 94. Ruggeri, L., et al., NK cell alloreactivity and allogeneic hematopoietic stem cell
transplantation. Blood Cells Mol Dis, 2008. 40(1): p. 84-90. 95. Johansson, S., et al., NK cells: elusive players in autoimmunity. Trends Immunol, 2005.
26(11): p. 613-8. 96. Khakoo, S.I. and M. Carrington, KIR and disease: a model system or system of models?
Immunol Rev, 2006. 214: p. 186-201. 97. Monks, C.R., et al., Three-dimensional segregation of supramolecular activation clusters
in T cells. Nature, 1998. 395(6697): p. 82-6. 98. Grakoui. A. , B.S.K., Sumen. C., Davis. M. M. , Shaw. A. S. , Allen. P. M. and Dustin. M. L. ,
Synaptic pattern formation during cellular recognition. Science, 1999. 285: p. 221-227. 99. Orange, J.S., Formation and function of the lytic NK-cell immunological synapse. Nat Rev
Immunol, 2008. 8(9): p. 713-25. 100. Abramowitz. M. , D.M.W., Introduction to Microscopy. Molecular Expressions, 2007. 101. Boyle, W.S. and G.E. Smith, Charge Coupled Semiconductor Devices. Bell System
Technical Journal, 1970. 49(4): p. 587-+. 102. Lichtman, J.W. and J.A. Conchello, Fluorescence microscopy. Nat Methods, 2005. 2(12):
p. 910-9. 103. Lakowicz. J.R., Principles of Fluorescence Spectroscopy. Edn 3rd Springer, 2006. 104. Bennett. A., O.H., Jupnik. H. and Richards. O., Phase Microscopy: Principles and
Applications. John Wiley and Sons, Inc., New York, 1951: p. 320 pages 105. Davidson. L. , a.K.R., Basics of a light microscopy imaging system and its application in
biology.Methods in Cellular Imaging. Periasamy, A. (ed), Oxford University Press, New York, , 2001: p. 53-65.
106. Murphy. D., Differential interference contrast (DIC) microscopy and modulation contrast microscopy in Fundamentals of Light Microscopy and Digital Imaging. Wiley-Liss, New York, , 2001: p. 153-168.
107. Ruzin. S., Differential interference contrast in Plant Microtechnique and Microscopy. Oxford University Press, New York, , 1999: p. 20-23.
Live Single Cell Imaging and Analysis Using Microfluidic Devices
52
108. Denk. W., J.H. Strickler, and W. Webb, Two-photon laser scanning fluorescence microscopy. Science, 1990. 248(4951): p. 73-6.
109. Denk. W., et al., Anatomical and functional imaging of neurons using 2-photon laser scanning microscopy. J Neurosci Methods, 1994. 54(2): p. 151-62.
110. Denk. W. and K. Svoboda, Photon upmanship: why multiphoton imaging is more than a gimmick. Neuron, 1997. 18(3): p. 351-7.
111. Sonka. M., H.V., and Boyle. R., Image processing, Analysis and Machine Vision. Brooks/Cole Publishing Company, Pacific Grove, CA,2nd edition 1999.
112. Canny, J., A Computational Approach to Edge-Detection. Ieee Transactions on Pattern Analysis and Machine Intelligence, 1986. 8(6): p. 679-698.
113. Beucher, S., The watershed transformation applied to image segmentation. Scanning Microscopy, 1992. 6: p. 299-314.
114. Boddeke, G., Distance transformations in digital images. Computer Vision, Graphics and Image Processing, 1986. 34: p. 344-371.
115. Krtolica, A., et al., Quantification of epithelial cells in coculture with fibroblasts by fluorescence image analysis. Cytometry, 2002. 49(2): p. 73-82.
116. Malpica, N., et al., Applying watershed algorithms to the segmentation of clustered nuclei. Cytometry, 1997. 28(4): p. 289-97.
117. Hough, P.V.C., Method and means for recognizing complex patterns. U.S. Patent Dec. 18, 1962(3,069,654).
118. Rosenfeld, A., Picture Processing by Computer. Academic Press, New York, 1969. 119. Guldevall, K., et al., Imaging immune surveillance of individual natural killer cells
confined in microwell arrays. PLoS One, 2010. 5(11): p. e15453. 120. Lindstrom, S., R. Larsson, and H.A. Svahn, Towards high-throughput single cell/clone
cultivation and analysis. Electrophoresis, 2008. 29(6): p. 1219-27. 121. Vanherberghen, B., et al., Ultrasound-controlled cell aggregation in a multi-well chip.
Lab Chip, 2010. 10(20): p. 2727-32. 122. Sahoo, P.K., et al., A Survey of Thresholding Techniques. Computer Vision Graphics and
Image Processing, 1988. 41(2): p. 233-260. 123. Otsu, N., A threshold selection method from gray-level histograms. IEEE Trans. Sys.,
Man., Cyber., 1979. 9: p. 62–66. 124. Soille, P., Morphological Image Analysis: Principles and Applications. . Springer-Verlag,
1999. 125. Du, W. and J. Yang, A robust Hough transform algorithm for determining the radiation
centers of circular and rectangular fields with subpixel accuracy. Phys Med Biol, 2009. 54(3): p. 555-67.
126. Duda, R.O.a.H.P.E., Use of the Hough Transformation to Detect Lines and Curves in Pictures. Comm. ACM, 1972. 15: p. 11-15.
127. Rodenacker, K. and E. Bengtsson, A feature set for cytometry on digitized microscopic images. Anal Cell Pathol, 2003. 25(1): p. 1-36.
128. Borgefors, G., G. sanniti di Baja., Analyzing non-convex 2D and 3D patterns. Computer Vision and Image Understanding, 1996. 63: p. 145-157.

Ali Khorshidi
53
129. Fraser, A.M., Incorporating invariants in Mahalanobis distance based classifiers: Application to face recognition. Proceedings of the International Joint Conference on Neural Networks 2003, Vols 1-4, 2003: p. 3118-3123.
130. Khorshidi, M.A., et al., Classification of Microwave Scattering Data based on a Subspace Distance with Application to Detection of Bleeding Stroke. 2009 3rd Ieee International Workshop on Computational Advances in Multi-Sensor Adaptive Processing (Camsap 2009), 2009: p. 301-304.
131. Garrod, K.R., et al., Natural killer cells actively patrol peripheral lymph nodes forming stable conjugates to eliminate MHC-mismatched targets. Proceedings of the National Academy of Sciences of the United States of America, 2007. 104(29): p. 12081-12086.
132. Miller, M.J., et al., Two-photon imaging of lymphocyte motility and antigen response in intact lymph node. Science, 2002. 296(5574): p. 1869-73.
133. Khorshidi, M.A., et al., Analysis of transient migration behavior of natural killer cells imaged in situ and in vitro. Integr Biol (Camb), 2011. 3(7): p. 770-8.
134. Johns, L.M., et al., Restriction of secretory granule motion near the plasma membrane of chromaffin cells. J Cell Biol, 2001. 153(1): p. 177-90.
135. Ng, Y.K., et al., Unexpected mobility variation among individual secretory vesicles produces an apparent refractory neuropeptide pool. Biophysical Journal, 2003. 84(6): p. 4127-4134.
136. Qian, H., M.P. Sheetz, and E.L. Elson, Single particle tracking. Analysis of diffusion and flow in two-dimensional systems. Biophys J, 1991. 60(4): p. 910-21.
137. Saxton, M.J. and K. Jacobson, Single-particle tracking: applications to membrane dynamics. Annu Rev Biophys Biomol Struct, 1997. 26: p. 373-99.
138. Christakou, A.E., et al., Live cell imaging in a micro-array of acoustic traps facilitates quantification of natural killer cell heterogeneity. Integr Biol (Camb), 2013. 5(4): p. 712-9.
139. Clausell-Tormos, J., et al., Droplet-based microfluidic platforms for the encapsulation and screening of Mammalian cells and multicellular organisms. Chem Biol, 2008. 15(5): p. 427-37.
140. Koster, S., et al., Drop-based microfluidic devices for encapsulation of single cells. Lab Chip, 2008. 8(7): p. 1110-5.
141. Huet, S., et al., Analysis of transient behavior in complex trajectories: application to secretory vesicle dynamics. Biophys J, 2006. 91(9): p. 3542-59.
142. Chen, Y., B. Yang, and K. Jacobson, Transient confinement zones: a type of lipid raft? Lipids, 2004. 39(11): p. 1115-9.
143. Suzuki, K., et al., Rapid hop diffusion of a G-protein-coupled receptor in the plasma membrane as revealed by single-molecule techniques. Biophys J, 2005. 88(5): p. 3659-80.
144. Bhat, R. and C. Watzl, Serial killing of tumor cells by human natural killer cells--enhancement by therapeutic antibodies. PLoS One, 2007. 2(3): p. e326.
145. Davis, D.M., Mechanisms and functions for the duration of intercellular contacts made by lymphocytes. Nat Rev Immunol, 2009. 9(8): p. 543-55.
146. Deguine, J., et al., Intravital imaging reveals distinct dynamics for natural killer and CD8(+) T cells during tumor regression. Immunity, 2010. 33(4): p. 632-44.


