
Running head: IMPACT OF LEGISLATION ON ARIZONA’S ENGLISH LEARNERS 1
Education Politics in Arizona:
The Impact of Legislation on Arizona’s English Learners
Clifton Smith
American Public University
Master’s Thesis
Dr. Roger Cusick
April 26th, 2019

IMPACT OF LEGISLATION ON ARIZONA’S ENGLISH LEARNERS 2
Table of Contents
Abstract ........................................................................................................................... 3
Acknowledgments........................................................................................................... 4
Political and Societal Impacts of Education Policy in the United States and Arizona ... 5
Methods......................................................................................................................... 10
Overview of English Education, Legislation, and Legal Challenges in the United
States ............................................................................................................................. 11
Overview of Spanish-Speaking Immigrants in the United States and Arizona ............ 17
Arizona, English, and Immigration ........................................................................... 23
Hispanic Education in the Southwest and Arizona ....................................................... 27
Overview of Structured English Immersion ................................................................. 31
How Initiatives Work in Arizona .................................................................................. 33
Who English Learners Are............................................................................................ 34
How English Learners Are Educated in Arizona .......................................................... 35
How EL Education is Funded in Arizona ..................................................................... 38
Recent History of Legislation Impacting English Learners in Arizona ........................ 38
Recent Data Regarding Arizona’s Relationship with English Learners ....................... 43
Arizona High school Graduation Rates, 2010–2016 ................................................. 45
High School Graduation Rates in Arizona, Colorado, and Nevada, 2010–2017 ...... 55
Two Mysteries in the Data ........................................................................................ 57
Explanations for the Sharp Decline of Arizona’s EL Population/Proportion ....... 58
Explanation for Arizona’s Low English Learner Graduation Rates ...................... 63
Possible Solutions to the Problem of Low EL Academic Success ............................... 66
Discussion ..................................................................................................................... 67
References ........................................................................................................................I
A–E...............................................................................................................................I
F–J .............................................................................................................................. V
K–O ........................................................................................................................... IX
P–T .......................................................................................................................... XII
U–Z....................................................................................................................... XVII

IMPACT OF LEGISLATION ON ARIZONA’S ENGLISH LEARNERS 3
Abstract
The most recent available data nationwide show that Arizona has the lowest
high school graduation rate for English Learners (ELs) in the United States. There are
many possible explanations for this, but explanations such as parental involvement in
early education do not adequately explain why states, especially ones with very similar
demographic profiles, perform better on this metric than Arizona. To better understand
this phenomenon, EL policy in Arizona and other Southwest states is compared.
Special attention is given to the Arizona policy of Structured English Immersion (SEI)
introduced after the passage of the English-only voter initiative Proposition 203.
The chief findings are that SEI has not had an obvious impact on EL student
success but that a state-mandated 4-hour block of instruction likely is to blame for
Arizona’s comparatively poor EL student graduation rates. Perhaps more concerning,
analysis of data surrounding Arizona’s EL population suggests that Arizona may be
misclassifying roughly 70,000 EL students per year. Recent legislative changes may
ameliorate the effects of the 4-hour block, but many students may still not have access
to an education plan best suited to them due to the apparent miscategorization.

IMPACT OF LEGISLATION ON ARIZONA’S ENGLISH LEARNERS 4
Acknowledgments
This paper owes an enormous debt to the many researchers who compiled the
many reports and analyses cited below. It also owes a great debt to my long-time
friend and roommate Trevor Helminski for being a sounding board for my various
ideas throughout the writing process and for invaluable feedback at every stage. I
would also like to thank the Internet for teaching me that, in a Word-created
document, after clicking and following a link, you can hold the Alt key and tap the
back arrow to return to your previous location in a given document.

IMPACT OF LEGISLATION ON ARIZONA’S ENGLISH LEARNERS 5
Political and Societal Impacts of Education Policy in the United States and
Arizona
Education policy is one of the most consequential policies that affect societies
generally, but it may not be self-evident that education policy is a valid topic for
scrutiny in political science. While education policy may not appear as directly
political as, for example, voting policy, education policy, nevertheless, is intimately
related to political policy, both directly and indirectly. The fact that ELs, the
educational subgroup that is primarily analyzed here, are more likely to be immigrants
or children of immigrants has further political implications and invites analysis of state
and federal immigration policy.
One way in which education policy and political policy are directly related is in
the impact of educational attainment on individuals’ likelihood of political
participation. Berinsky and Lenz (2011) wrote that the positive correlation between
educational attainment and political participation is “[o]ne of the most consistently
documented relationships in the field of political behavior.” Ojeda (2018), in turn,
recently confirmed the body of evidence demonstrating the positive correlation in the
United States between wealth and likelihood of participating in politics. As wealth is
also positively correlated with educational attainment (Figure 1), it is perhaps not
surprising that educational policy impacts political participation.

IMPACT OF LEGISLATION ON ARIZONA’S ENGLISH LEARNERS 6
In some cases, education policy can be even more profoundly shaped by the
legislative policies of a given U.S. state. In Arizona’s case, the state is, per the
Initiative and Referendum Institute1 (2019), one of a minority of states that allows
legislation to be passed or vetoed via direct vote (i.e., ballot initiative). A key piece of
legislation that will be explored in this analysis (primarily in its effects), Proposition
203, was a result of such a ballot initiative passed in 2000 (IRI, 2019). This English-
only legislation dramatically altered the education of English learners in the state.
Education policy can affect the economic health of societies which in turn
affects the physical health of individuals. Per the U.S. Bureau of Labor Statistics
(BLS) (2018), educational attainment is highly-correlated with unemployment rate and
income (Figure 2). At the same time, the Associated Press Health & Science
1 The Initiative and Referendum Institute of the University of Southern California is a non-partisan
educational organization that studies initiatives and referenda, the key expressions of direct democracy
(IRI, 2019).
Figure 1. Percentage of children under age 18 in families living in poverty, by child’s
race/ethnicity and parents’ highest level of educational attainment, 2016 (NCES, 2018)

IMPACT OF LEGISLATION ON ARIZONA’S ENGLISH LEARNERS 7
Department (2018) recently reported that 1.5 years of life expectancy were lost for
each 10 percentage point increase in unemployment rate. This supports similar
research by Singh and Siahpush (2016) showing that unemployment is highly
correlated with adverse health outcomes.
Figure 2. Unemployment rates of people 25 years and over, by educational attainment, seasonally
adjusted, 1992-2017 (BLS, 2018)
In U.S. classrooms, there are currently around 5 million English learner (EL)
students (NCES, 2018). Officially, Arizona’s ELs comprise about 7.3% of the total
population (80,000 out of the roughly 1.1 million total K–12 students), though the
following analysis (see Two Mysteries in the Data) suggests that this official figure is
probably wrong and that the actual number may be closer to 150,000 (Smith, 2019).
While Arizona does not have the largest EL population in the country, it does see the
lowest portion of those students, 30%, graduate high school (NCES, 2018).

IMPACT OF LEGISLATION ON ARIZONA’S ENGLISH LEARNERS 8
Figure 3. Total ELs by State, 2016–2017 (Smith, 2019)
Given the known negative outcomes to individuals who do not graduate high
school, this low educational attainment rate among any large group should be seriously
addressed. This large population of non-high-school-graduates is also likely to
adversely impact Arizonans generally. It will, for example, negatively impact
employers because they will not be able to as readily find educated workers.
According to data from Georgetown University (2019), there were only about 44,000
good jobs2 in Arizona in 2015 available to job-seekers with less than high school
education (Georgetown University, 2019).
Low educational attainment among a large group of people in the state is also
likely to have a negative impact on individual poverty and the state’s overall poverty
rate. As Figure 1 illustrates, higher educational attainment has a strong positive
association with reduced rates of poverty. The largest group of ELs in Arizona is
Spanish speakers who, in 2014, comprised 87% of the state’s EL population (Milem,
2 Per the report, “good jobs” provide earnings of $35,000+ annually for those under age 45 and earnings
of $45,000+ annually for workers age 45 and older (Georgetown University, 2019).

IMPACT OF LEGISLATION ON ARIZONA’S ENGLISH LEARNERS 9
Salazar, and Brown, 2016). The relatively poor educational outcomes for ELs in
Arizona, most of whom are Spanish speakers, may explain, in part, why the poverty
rate among Hispanics in Arizona was 25.1% in 2017 and 14.8% among the group
classified as “whites”3 for the same year (University of Arizona, 2017).
As low educational attainment is a strong correlate of unemployment, there are
also many adverse health outcomes associated with low educational attainment.
Antonisse and Garfield (2018) reported that unemployment is strongly associated with
such negative mental health outcomes as depression, anxiety, and low self-esteem.
They further reported that negative physical impacts such as hypertension and
increased mortality are also moderately associated with unemployment (Antonisse and
Garfield, 2018). Proctor, Wilson-Frederick, and Haffer (2018) also reported directly
on the strong association of suboptimal health outcomes among the U.S. population of
individuals with limited English proficiency. Among those suboptimal health
outcomes were higher rates of disability, poor self-rated health, and higher rates of
psychological distress and mental illness (Proctor, Wilson-Frederick, and Haffer,
2018).
As with education and immigration policy both in the United States and in
individual states, EL policy in Arizona in 2019 does not exist in a vacuum; it is the
culmination of roughly the entire history of the United States and of Arizona. There
are many moving parts comprised of federal, regional, and state policies regarding
education and immigration, and these policies may not always agree.
3 “White” is a nebulous term and more so when comparing this group to Hispanics. Ennis, Rio-Vargas,
and Albert (2011) noted that, per the U.S. Census Bureau, people of Hispanic origin may be of any race.
As of the 2010 Census, 53% of the Hispanic population identified as White and no other race. However,
when “white” is referred to in this analysis, it is used to mean “non-Hispanic white.”

IMPACT OF LEGISLATION ON ARIZONA’S ENGLISH LEARNERS 10
Methods
This analysis uses existing education and demographic data to compare
educational outcomes and draw population inferences in Arizona after various policies
were enacted. This entails analyzing roughly two decades of educational outcomes in
Arizona to attempt to discern policy impacts. This analysis also uses existing data to
compare educational outcomes in Arizona to higher-performing states in the region,
especially California, Colorado, and Nevada.

IMPACT OF LEGISLATION ON ARIZONA’S ENGLISH LEARNERS 11
Overview of English Education, Legislation, and Legal Challenges in the
United States
English instruction in the United States has a long history, in day-to-day
education and in legislation. As previously noted, Spanish is the language most widely
spoken by ELs in Arizona and more broadly in the United States. However, this was
not always the case for either. Ovando (2003) wrote that, in the 18th Century, several
states passed legislation that authorized bilingual education. A plethora of languages
coexisted with English during this period:
German in Pennsylvania, Maryland, Ohio, Indiana, Illinois, Missouri,
Nebraska, Colorado, and Oregon; Swedish, Norwegian, and Danish in
Wisconsin, Illinois, Minnesota, Iowa, North and South Dakota, Nebraska, and
Washington; Dutch in Michigan; Polish and Italian in Wisconsin; Czech in
Texas; French in Louisiana; and Spanish in the Southwest. (Ovando, 2003)
The push for English only legislation began in the late 19th Century and was
targeted at “civilizing” Native Americans. Up to that point, educators of Native
Americans, usually Christian missionaries, received a federal appropriation (beginning
as early as 1819) from what was known as the “civilization fund” (Ovando, 2003;
Bartelt, 1992, p. 137). However, Bartelt (1992) noted, this effort at “civilizing” Native
Americans was generally accomplished via communication in the students' native
language in earlier stages while English was gradually introduced over time. This
began to change with a Congressional English-only recommendation for Native
American education in 1868 (Bartelt, 1992). Then, in 1887, the Commissioner of
Indian Affairs issued a proclamation:

IMPACT OF LEGISLATION ON ARIZONA’S ENGLISH LEARNERS 12
Instruction of Indians in [their] vernacular is not only of no use to them but is
detrimental to the cause of education and civilization and will not be permitted
in any Indian school over which the government has any control.... This
language which is good enough for a white man or a black man ought to be
good enough for the red man. It is also believed that teaching an Indian taught
in his own barbarous dialect is a positive detriment to him. The
impracticability, if not impossibility of civilizing Indians of this country in any
other tongue than our own would seem obvious. (Bartelt, 1992)
As waves of European immigrants came to the United States in the late 19th
Century (Figure 4), existing settlers, concerned about competition of other languages
and cultural influences the new immigrants might bring, helped pass the Naturalization
Act of 1906 (Ovando, 2003). This act stipulated that one’s ability to speak English was
necessary to become a naturalized U.S. citizen (Ovando, 2003). After the United
States declared war on Germany during World War I, education in German was
abolished in most states. Within 6 years, 34 states had passed laws dictating English-
only instruction (Ovando, 2003).

IMPACT OF LEGISLATION ON ARIZONA’S ENGLISH LEARNERS 13
Figure 4. U.S. Immigration Flows by Country (% of U.S. Population), 1820s–2010s
(Galka, 2016)
After the period of English-only sentiment, and until the 1960s, English
immersion was the dominant method of education instruction of minority students
(Language Proficiency Assessment Committee4, 2011). For the most part, students
who did not master their coursework were simply held back until they had achieved
mastery of both the new language and of the subject (LPAC, 2011). A change would
come in 1963, however, after Florida experienced a large influx of Cuban refugees.
To help absorb and integrate the new population, Floridians in Dade County
successfully implemented a bilingual education program whose success would be
emulated in other schools across the country (LPAC, 2011).
In 1964, Lyndon Johnson signed the Civil Rights Act into law which “prohibits
discrimination on the basis of race, color, and national origin in programs and
activities receiving federal financial assistance” (LPAC, 2011). (This will factor
prominently in court cases discussed later involving English-only education.) Four
4 The Language Proficiency Assessment Committee is a statutorily-formed committee of the Texas
Education Agency charged with overseeing instructional programs for limited English proficient
students (LPAC, 2011). The Texas Education Agency (TEA) is the state agency that oversees primary
and secondary public education in Texas (Texas Christian University, 2019). Texas has the second-
largest EL population in the country (Figure 3).

IMPACT OF LEGISLATION ON ARIZONA’S ENGLISH LEARNERS 14
years later, he would also sign into law The Bilingual Education Act, Title VII of the
Elementary and Secondary Education Act (LPAC, 2011). This would establish federal
guidelines regarding bilingual education and allocate funding for economically
disadvantaged language minority students (LPAC, 2011).
Between 1968 and 1994, minor changes were made to Title VII of the
Bilingual Education Act (LPAC, 2011). Over this period, eligibility of students who
have limited English proficiency (LEP) for access to bilingual programs was expanded
(LPAC, 2011). Funding was also provided for LEP students with special needs as well
as for family English literacy programs (LPAC, 2011). Revisions in this period also
placed a three-year limit on access to programs for English learners (LPAC, 2011).
Increased funding to state education agencies was implemented, expanding
funding for “alternative instructional programs” (primarily those where only English
was used) from 4%–10% in 1984 to up to 25% in 1988 (Stewner-Manzanares, 1988).
This was largely a result of a general advocacy of English-only education by Ronald
Reagan’s Secretary of Education William Bennett who argued that bilingual education
was a failure (de Jong, 2011).
In 1994, provisions were added to Title VII that reinforced professional
development programs and increased attention to language maintenance and foreign
language instruction (LPAC, 2011). In 7 more years, George W. Bush would sign the
No Child Left Behind Act of 2001 (NCLB) into law (LPAC, 2011). This law
reauthorized the Elementary and Secondary Education Act of 1965 and allocated funds
to states to improve educational outcomes for English learners (LPAC, 2011).

IMPACT OF LEGISLATION ON ARIZONA’S ENGLISH LEARNERS 15
Over this period, as Wright (2010) reported, there were various state and
district legal cases where parents sued school districts. One major case was
Independent School District v. Salvatierra (1930). This suit was brought by parents in
Del Rio, Texas at a time when Texas routinely segregated students into white, black,
and Hispanic groups (Orozco, 2016). Parents learned that the Del Rio School Board
was planning to segregate Mexican students from their non-Mexican classmates in a
planned expansion of school facilities (Orozco, 2016). Jesús Salvatierra and several
other parents filed suit charging that students of Mexican descent were being denied
benefits afforded “other white races” (Orozco, 2016). A District Court ruled in favor
of Salvatierra, but the decision was overturned by the Court of Appeals of San Antonio
(Orozco, 2016).
Other important legal cases of the period included Roberto Alvarez vs. the
Board of Trustees of the Lemon Grove School District (1931) and Méndez v.
Westminster School District (1947). Alvarez began after the Lemon Grove school
board attempted to prohibit the Mexican-American student population from attending
class in the regular quarters and instead forced them to attend school in a hastily-
constructed barn-like structure that the Mexican-American families would come to call
la caballeriza (the stable) (Stratton, 2016). In the case, heard in San Diego Superior
Court, Judge Claude Chambers ruled in favor of the parents, arguing that “separate
facilities for Mexican American students were not conducive toward their
Americanization and retarded the English-language development of the Spanish-
speaking children” (Stratton, 2016).
IMPACT OF LEGISLATION ON ARIZONA’S ENGLISH LEARNERS 16
Méndez, a case heard by the U.S. District Court for the Central District of
California, was another California case challenging the segregation of schools for
Mexican-American students (Macías, 2014). The Central District court ruled on behalf
of the parents, the school districts appealed, and the Central District’s opinion was
upheld in the U.S. Court of Appeals for the Ninth Circuit (Macías, 2014). Within two
months of the ruling, California’s governor Earl Warren signed the country’s first bill
officially ending segregation in public schools (Macías, 2014). Warren would use
arguments presented by the Ninth Circuit seven years later when ruling in the Supreme
Court case Brown v. Board of Education (Macías, 2014).
Another important case regarding and affecting the education of minority
students was Lau v. Nichols. In Lau v. Nichols, heard by the U.S. Supreme Court in
1974, the Court unanimously ruled,
The failure of the San Francisco school system to provide English language
instruction to approximately 1,800 students of Chinese ancestry who do not
speak English, or to provide them with other adequate instructional procedures,
denies them a meaningful opportunity to participate in the public educational
program and thus. (LPAC, 2011)
Further clarification of Lau v. Nichols occurred with the Southern District
hearing of Castañeda v. Pickard in 1981. In response to this case, the Fifth Circuit
Court of Appeals outlined a three-step test (now commonly referred to as the
“Castañeda Test”) for determining whether school districts were behaving
appropriately in assessing programs serving ELs:
(a) The school program must be anchored in sound educational theory,

IMPACT OF LEGISLATION ON ARIZONA’S ENGLISH LEARNERS 17
(b) adequate resources and personnel must be evident in the school program,
and
(c) the school program must reflect sound practices and results, not only in
language but also in such content areas as math, science, social studies, and
language arts. (Ovando, 2003)
In 1982, the Fifth Circuit ruled that Texas could not deny children of
undocumented citizens education conforming to the Castañeda Test because this
would severely disadvantage the children. The court ruled that this was not permissible
under a provision of the Fourteenth Amendment which states “nor shall any State …
deny to any person within its jurisdiction the equal protection of the laws.” The
majority in the 5-4 decision ruled that children are people and that Texas could not
prove a “compelling state interest” for treating these children differently from other
children (Oyez, 2019).
Overview of Spanish-Speaking Immigrants in the United States and Arizona
To understand the history of English learners in Arizona, it is useful to first
understand the demographics of Arizona. To understand the demographics of Arizona,
it is, in turn, necessary to understand immigration in Arizona. In case it is not obvious,
EL education is intimately tied to immigration from predominantly non-English-
speaking countries. ELs in Pre-K–12 are overwhelmingly native born, with 85% of
Pre-K–5th-graders being native born and 62% of 6th to 12th-graders being native born
(Zong & Batalova, 2015). However, while EL students are overwhelmingly native
born, 81.3% of adults in the United States with limited English proficiency are foreign

IMPACT OF LEGISLATION ON ARIZONA’S ENGLISH LEARNERS 18
born (Zong & Batalova, 2015). Among all people with limited English proficiency
nationwide, Spanish is the most common language spoken (Zong & Batalova, 2015).
As with other states sharing a border with Mexico, Arizona has among the
largest proportions of Hispanics and Spanish-speakers in the United States (Figure 5).
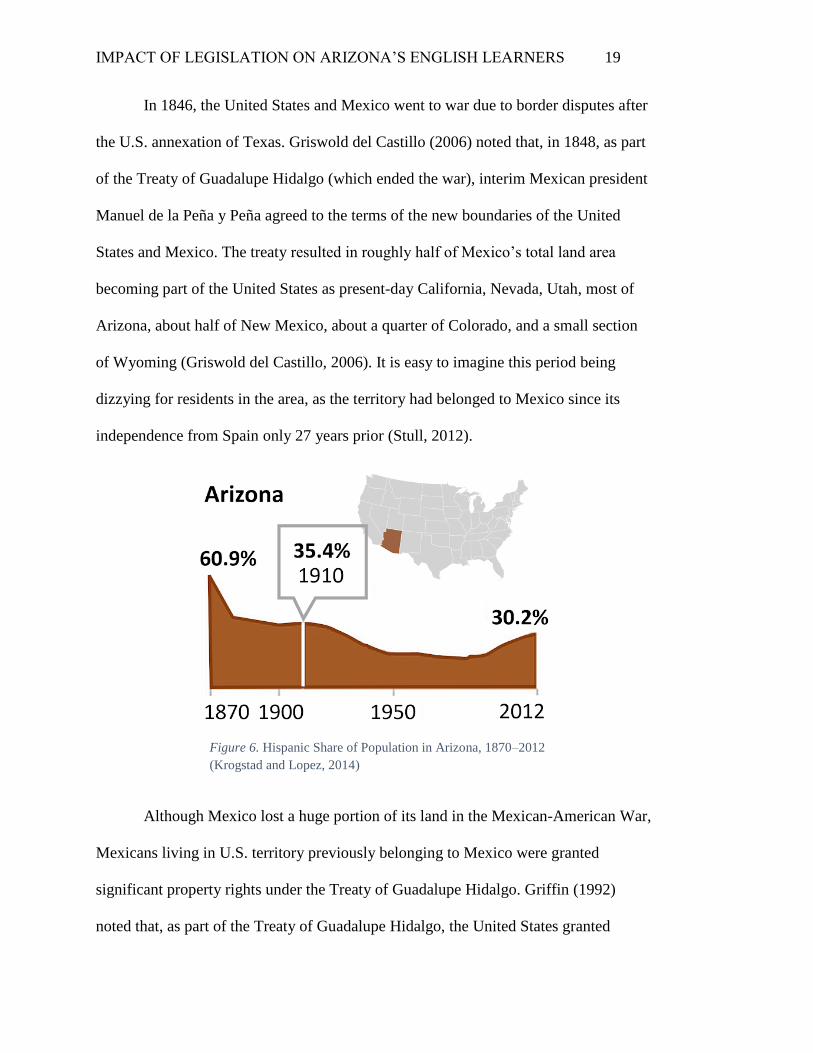
This comparatively high proportion is not historically high, however. As Krogstad and
Lopez (2014) noted, in 1870, the proportion of people in the Arizona territory of
Hispanic or Latino heritage was 60.9% (Figure 6). This high proportion stemmed, in
part, from the fact that, until 1848, most of the Southwest was controlled by the
Spanish or by Mexico. By the time Arizona became a state in 1912, its proportion of
Hispanics had fallen to about 35%. The slow and then more rapid decline thereafter
corresponds roughly to a period of mass deportations discussed below.
Figure 5. Top Latino States in 2014, by population and Share
(Stepler and Lopez, 2016)
IMPACT OF LEGISLATION ON ARIZONA’S ENGLISH LEARNERS 19
In 1846, the United States and Mexico went to war due to border disputes after
the U.S. annexation of Texas. Griswold del Castillo (2006) noted that, in 1848, as part
of the Treaty of Guadalupe Hidalgo (which ended the war), interim Mexican president
Manuel de la Peña y Peña agreed to the terms of the new boundaries of the United
States and Mexico. The treaty resulted in roughly half of Mexico’s total land area
becoming part of the United States as present-day California, Nevada, Utah, most of
Arizona, about half of New Mexico, about a quarter of Colorado, and a small section
of Wyoming (Griswold del Castillo, 2006). It is easy to imagine this period being
dizzying for residents in the area, as the territory had belonged to Mexico since its
independence from Spain only 27 years prior (Stull, 2012).
Figure 6. Hispanic Share of Population in Arizona, 1870–2012
(Krogstad and Lopez, 2014)
Although Mexico lost a huge portion of its land in the Mexican-American War,
Mexicans living in U.S. territory previously belonging to Mexico were granted
significant property rights under the Treaty of Guadalupe Hidalgo. Griffin (1992)
noted that, as part of the Treaty of Guadalupe Hidalgo, the United States granted

IMPACT OF LEGISLATION ON ARIZONA’S ENGLISH LEARNERS 20
citizenship to all Mexicans living in territories acquired from Mexico. Article VIII of
the treaty states the following:
Mexicans now established in territories previously belonging to Mexico …
shall be free to continue where they now reside, or to remove at any time to the
Mexican Republic, retaining the property which they possess in the said
territories, or disposing thereof, and removing the proceeds wherever they
please, without their being subjected, on this account, to any contribution, tax,
or charge whatever. (Mintz and McNeil, 2018)
Mexicans could elect to cross the newly-created U.S.-Mexico border into
Mexico to claim Mexican citizenship, or they could elect to stay and claim U.S.
citizenship. Those who elected to stay but did not claim U.S. citizenship would
automatically become U.S. citizens by default after one year. The treaty further
stipulated that Mexicans electing to stay on what, after February 1848, would be the
U.S. side of the border, would have inviolable rights to their existing property, as
would their heirs or any other Mexican-Americans acquiring the property by contract
(Mintz and McNeil, 2018).
However, as Lunda (1998) noted, promises in the Treaty were, by no means,
reliable guarantees that Mexican property rights were secure. Two major pieces of
1860s legislation that, intentionally or unintentionally, challenged Mexican property
rights were the Homestead Act, which granted 160 acres of public land to settlers, and
the Morrill Act, which defined that eligible states receive 30,000 acres of federal land
for each member of congress the state had. Where disputes arose between Mexican-
American land owners and those wishing to take advantage of land grants under the
IMPACT OF LEGISLATION ON ARIZONA’S ENGLISH LEARNERS 21
Homestead and Morrill Acts, judicial rulings generally favored the non-Mexican
settler or U.S. government officials (Lunda, 1998).
By 1900, Griffin (1992) noted, there were about 500,000 Mexicans living in
the United States due, in part, to labor needs in building the railroad system. However,
within three decades, public opinion would turn against Hispanics living in the United
States. During the Great Depression, mostly by buses or even on railroad systems they
may have helped build, between 1 million and 2 million Hispanics were deported to
Mexico with around 60% of them being U.S. citizens (Balderrama & Rodríguez,
2006). Public support for these deportations stemmed from the exploding
unemployment rate that accompanied the Depression and desires of the majority non-
Hispanic population to occupy those jobs (Balderrama, 2015).
As Martin (2003) would note, the Bracero Programs of the 1910s and of the
1940s would bring roughly 2 million guest workers from Mexico, mainly for
agricultural work. However, because there were no penalties for hiring workers
outside of the program, and workers found to not have documentation were swiftly
given documentation, the population of undocumented Braceros quickly outgrew that
of the documented Braceros (Martin, 2003).
As with the formation of the Know-Nothing Party to oppose the influx of
German and Irish immigrants in the 1840s, the Chinese Exclusion Act of 1882, and the
Gentleman’s Agreement of 1907 to limit Japanese immigration, this influx of Mexican
immigrants also resulted in backlash (Bryant, 1999). This backlash culminated in
Operation Wetback in 1954 in which U.S. Immigration and Naturalization Services
removed 1.1 million Mexicans in fiscal year 1954 (Martin, 2003).

IMPACT OF LEGISLATION ON ARIZONA’S ENGLISH LEARNERS 22
While people south of the border continued to be invited and then deported,
immigration across the United States continued from around the world. The National
Academy of Sciences (2015) noted that the most recent period of mass immigration
was a result of the Immigration Act of 1965. This legislation replaced the quota system
of the 1920s with an immigration system open to every country in the world (NAS,
2015). This led to a large increase in immigration from Asia, Africa, Latin America,
and the Caribbean, but also limited the number of legal immigrants from the Western
Hemisphere (NAS, 2015). As most such immigrants come to the United States across
the southern border, the Immigration Act of 1965 also set the stage for the increase in
undocumented border crossers (NAS, 2015).
Figure 7. Share of Total Immigrant Population in the Southwest, 1975–2014
(Smith, 2019)

IMPACT OF LEGISLATION ON ARIZONA’S ENGLISH LEARNERS 23
Arizona, English, and Immigration
The 2000 initiative Proposition 203 (“English for the Children”) mentioned
above, would not mark the first time that Arizonans voted on an English-only
mandate. In 1988, Arizona voters narrowly passed Proposition 106 which would make
English the official state language (Del Valle, 2003). The law read as follows:
(1) The English language is the official language of the State of Arizona.
(2) As the official language of this State, the English language is the language
of the ballot, the public schools, and all government functions and actions.
(3) (a) This Article applies to:
(i) the Legislative, Executive and Judicial branches of government;
(ii) all political subdivisions, departments, agencies, organizations and
instrumentalities of this State, including local governments and
municipalities;
(iii) all statutes, ordinances, rules, orders, programs and policies;
(iv) all government officials and employees during the performance of
government business. (Del Valle, 2003)
Schmid (2001) noted that the law was argued to be the most restrictive Official
English law in the country up to publication of his report. Schmid (2001) further noted
that the Arizona Supreme Court overturned the law unanimously, making Arizona the
first state since 1920 to have an Official English law overturned. The Court held that
the law violated the First Amendment and the Constitution’s Equal Protection Clause
in the Fourteenth Amendment (Schmid, 2001).

IMPACT OF LEGISLATION ON ARIZONA’S ENGLISH LEARNERS 24
Téllez, Sanidad, and de la Fuente (2011) noted, however, that this also would
not be the last attempt to make English the official state language. In 2006, voters
approved Proposition 103, (“English as the Official Language Act”) (Téllez et al,
2011). The law requires that all “official state business” such as in courts and in
agencies such as the Arizona Division of Occupational Safety and Health, state Equal
Employment Opportunity Commission and the State Department of Labor (DOL) be
conducted in English (Téllez et al, 2011). Following passage of the proposition,
Spanish language complaint forms, instructions, and information were removed from
the DOL website (Téllez et al, 2011).
A year after the successful passage of the “English as the Official Language
Act,” Arizona passed the Employer Sanctions law (or “Legal Arizona Worker’s Act”)
(Téllez et al, 2011). The law was ostensibly made to penalize employers for hiring
undocumented workers, allowing the state to legally suspend or revoke the licenses of
businesses for employing undocumented immigrants (Téllez et al, 2011). However, in
one study of the law’s effects, only one employer was found to have been prosecuted
under the law’s authority while hundreds of undocumented workers were arrested
(Téllez et al, 2011). This law is discussed further below in the section “The
Introduction of E-Verify.”
In 2004, Arizonans passed Proposition 200 (“Protect Arizona Now”), a bill
modeled on a similar one in California meant to deny public services to undocumented
residents (Hendricks, 2005). One organization that supported the bill was the
Federation for American Immigration Reform which claimed an economic burden of
undocumented immigrants to the Arizona education system of $820 million annually
IMPACT OF LEGISLATION ON ARIZONA’S ENGLISH LEARNERS 25
(Hedding, 2004; Hendricks, 2005). Hendricks (2005) reported that, at the time of
passage, 44% of Arizona’s 750,000 foreign-born residents were estimated to be
undocumented compared to 26% in California. Hendricks (2005) further reported that,
in 2004, U.S. Border Patrol arrested more undocumented immigrants crossing the
Sonora-Arizona border illegally than in Texas, New Mexico, and California combined.
Two decades before members of the Arizona legislature tried to determine
which languages could be used for public discourse and attempted to discourage
undocumented immigration to the state, the U.S. Supreme Court heard the case of
Plyer v. Doe. In that 1982 case, the Court ruled that all children, regardless of
immigration and legal status, are guaranteed access to public K–12 education (Biswas,
2005). While Proposition 200 could not affect K–12 education due to Plyer v. Doe, the
Arizona Senate would nevertheless entertain a bill that would appear to be in direct
conflict with that decision. Williams (2011) noted that, in 2011, the Arizona Senate
Appropriations Committee passed SB 1611, which included a provision requiring that
parents of K–12 students provide schools proof of legal status. Williams (2011) further
noted that the bill was voted down within three weeks after, first, hundreds of students
marched at the state capitol in protest and, second, 60 Arizona chief executives sent a
letter to the legislature to suggest that the legislation would be bad for business.
In April of 2010, the Arizona legislature passed SB 1070 and HB 2162 (Morse, 2011).
The former, titled “Support Our Law Enforcement and Safe Neighborhoods Act,”
instituted penalties to immigrants 18 years of age or older who fail to produce proof
that they are in the country legally if asked for such proof by law enforcement (Morse,
2011). It also mandated that law enforcement officers attempt to establish legal status

IMPACT OF LEGISLATION ON ARIZONA’S ENGLISH LEARNERS 26
during a lawful stop, detention, and arrest (Morse, 2011). The Arizona state legislature
ostensibly attempted to address concerns that the law might result in racial profiling by
passing HB 2162 which stipulated that law enforcement “may not consider race, color,
or national origin” when implementing the law “except to the extent permitted by the
United States or Arizona Constitution.” Of this stipulation of HB 2162, Miller & Chin
(2012) wrote,
This sounds like a ban on racial profiling, but in fact it authorizes it. The U.S.
Supreme Court in Brignoni-Ponce (1975) and the Arizona Supreme Court (in
State v. Graciano (Ariz. 1982) and State v. Becerra (Ariz. 1975)) permit race to
be used as a factor in immigration enforcement.
President Trump’s October 2018 announcement of his intent to end birthright
citizenship by executive order echoes legislation introduced again by the Arizona
Senate in 2011 (Arthur, 2018). The Arizona bill, SB 1308, would have resulted in the
state issuing a different birth certificate to children born to undocumented parents
compared to children born to at least one permanent resident or naturalized citizen
(Beard Rau, 2011). This was in addition to the failed SB 1405 which would have
required hospital staff to request documents proving a patient’s legal status before
administering non-emergency medical services (Beard Rau, 2011). These bills, along
with three others, were ultimately rejected by the Arizona Senate (Hing, 2011).

IMPACT OF LEGISLATION ON ARIZONA’S ENGLISH LEARNERS 27
Hispanic Education in the Southwest and Arizona
The story of Anglo-Hispanic relations and education in Arizona begins before
Arizona was a state. Ring (2013) noted that Arizona and New Mexico acquired their
distinct shapes after Abraham Lincoln signed legislation dividing the New Mexico
Territory into their modern forms in
1863. Prior to that, the southern part of
the territory was dominated by a largely
Anglo population (perhaps unexpected as
one might assume the larger Hispanic
population would be closer to the
border). When the Civil War began, the
Arizona Territory seceded as the
southern portion of what is now Arizona
and New Mexico. After the Confederate
defeat, Union officials decided to
separate the territories along a north/west
plan to create a political border between
a large group of Confederate
sympathizers (Ring, 2013).
Stull (2012) noted that, in 1906, a plan of joint statehood between the Arizona
and New Mexico Territories was proposed by the U.S. government. Delegates of the
Arizona Territory, led by the Arizona Territorial Teachers Association, vehemently
opposed joint statehood, arguing that the education system in the territory would be
Figure 8. Geography of Arizona and New Mexico
1845–1912 (Ring, 2013).

IMPACT OF LEGISLATION ON ARIZONA’S ENGLISH LEARNERS 28
disrupted by the union (Stull, 2012). Arizona Territory school instruction at the time
was conducted exclusively in English by statute, and ability to speak English was
required to serve in local government; the New Mexican Territory, by contrast, had a
roughly 50% Spanish-speaking population and conducted bilingual courts and
legislation (Stull, 2012).
Arizona delegates noted opposition of what they estimated to be 98% of the
state’s population to the merger in a document titled “Protest Against Union of
Arizona with New Mexico” (Patterson, 1906; Stull, 2012). In the document, which
they submitted to Congress on February 12, 1906, they wrote that their own population
was “distinctly American, composed of people from all parts of the United States and
the best type of immigrants from other countries” (Patterson, 1906). They continued
that their own “ideals of social conditions, Christian civilization, modern progress, and
future development are of the highest” (Patterson, 1906). Among their reasons for
eschewing the merge were,
The decided racial difference between the people of New Mexico, who are not
only different in race and largely in language, but have entirely different
customs, laws and ideals and would have but little prospect of successful
amalgamation….
The objection of the people of Arizona, 95 per cent of whom are Americans, to
the probability of the control of public affairs by people of a different race,
many of whom do not speak the English language, and who outnumber the
people of Arizona two to one…. (Patterson, 1906)
IMPACT OF LEGISLATION ON ARIZONA’S ENGLISH LEARNERS 29
This foundational streak of uneasiness with Mexicans and Spanish speakers
would appear to still be active in the state nearly 65 years later as Arizona, along with
other Southwest states, would struggle to assimilate and educate their sizeable
population of people not proficient in English. In 1972, the U.S. Commission on Civil
Rights (USCCR)5 released a report on the state of Mexican-Americans in the U.S.
education system titled “The Excluded Student.” Among the Commission’s findings
were that a majority of schools and districts in the Southwest exclude Spanish speakers
from the education process by failing to provide adequate Spanish language materials
and parental access to teachers (USCCR, 1972). Arizona and Colorado reported the
worst rates with Arizona reporting that it failed to send notices home in both English
and Spanish 82.4% of the time and failed to conduct PTA meetings in both languages
98% of the time (USCCR, 1972).
The USCCR (1972) further reported that, as part of the Bilingual Education
Act of 1968, the Department of Health, Education, and Welfare allocated $7.5 million
to 76 bilingual education programs. Highlighting the Southwest’s unique history with
large populations of Spanish-speaking English learners, the Commission noted that 65
of those 76 programs (86%) were for Spanish-speaking programs while 51 of the 76
(67%) were in the Southwest. What became of the $7.6 million allocation is not
entirely clear given the Commission’s reported data showing the low percentage of
schools offering bilingual or ESL services (Figure 9 and Figure 10). It is difficult to
imagine that the figures could have been worse, but it is possible that the numbers
5 The U.S. Commission on Civil Rights was created by the Civil Rights Act of 1957. The Commission
is still operational, having been reauthorized most recently by the Civil Rights Commission
Amendments Act of 1994 (USCCR.gov, 2018).

IMPACT OF LEGISLATION ON ARIZONA’S ENGLISH LEARNERS 30
would have been even lower without the federal allocation. Arizona fared the worst
with less than half a percent of schools reporting that they offered bilingual education
(USCCR, 1972). Arizona was second-worst of the group in terms of percent of its
schools offering ESL services, with only 9.3% of its schools offering such services
(USCCR, 1972).
Figure 9. Percent of Schools Offering Bilingual
Education and the Percent of Mexican American
Pupils Enrolled in Bilingual Education Classes by
State (USCCR, 1972)
Figure 10. Percent of Schools Offering ESL and
the Percent of Mexican American Students
Enrolled in ESL classes by State (USCCR, 1972)
The federal allocation mentioned above is of some importance as it invites the
consideration of how schools and districts fund education of ELs. Federal allocations
only account for about 11% of funding for primary and secondary education which
means that states must decide how much to invest in the education of English learners
(Sugarman, 2016). However, this endeavor can be far from straightforward. Although
most English learners, especially in Arizona, are Spanish speakers, even ELs in this
group do not all require the same type of education plan. For example, some may have
little formal education in any language while others may be entering the U.S.
educational system with varying amounts of formal education in their native language
and at varying grade levels (Sugarman, 2016). Teachers of ELs may also require
special certifications, and some educational models may require multiple teachers
within the same classroom (Sugarman, 2016).

IMPACT OF LEGISLATION ON ARIZONA’S ENGLISH LEARNERS 31
In some cases, funding may be further complicated by an especially wide
variety of languages spoken in a given district. While Spanish is the dominant
language among ELs, it is not the only language spoken by them. In a 1988 report on
20 years of the impacts of the first Bilingual Education Act, Stewner-Manzanares
noted the difficulties of schools with a highly multilingual student population. One
school reported that it would simply not be feasible to implement bilingual education
programs because there were 21 different language groups represented in its student
population (Stewner-Manzanares, 1988).
A bilingual solution in this case would seem to require the employment of 21
different teachers all proficient in both English and the student’s native language.
Aside from the funding involved and depending on the languages involved, it may be
difficult for districts with such challenges to find teachers proficient in both English
and the student’s native language. It may also be difficult to find appropriate learning
materials in all of the students’ native languages.
Overview of Structured English Immersion
One answer to the various issues involved with bilingual education is English-
only education, and the form that English-only education has taken in Arizona is
known as Structured English Immersion (SEI). Moore (2014) noted that, broadly, SEI
may refer to either Structured English Immersion or Sheltered English Immersion,
though Arizona refers to it as the former. It first appeared in academic literature as
simply Structured Immersion or SI. Its first advocates, in a 1981 and follow-up 1983
report for the Office of Planning, Budget and Evaluation (OPBE), were sociologist
Keith Baker and management intern Adriana de Kanter. Baker and de Kanter, Moore

IMPACT OF LEGISLATION ON ARIZONA’S ENGLISH LEARNERS 32
further noted, were tasked with examining the efficacy of transitional bilingual
education programs and their alternatives. Baker and de Kanter reviewed a total of 39
programs over both reports and determined, based on the success of SI in four of the
studies, that it was the most effective program for helping learners acquire a new
language (Moore, 2014).
Moore (2014) noted that three of the four studies Baker and de Kanter based
their support of SI on were French-Canadian models. This was a serious leap, Moore
(2014) contends, because those models were meant to teach English speakers French
while Baker and de Kanter used them to conclude that the same models would be
better-suited than existing ones for getting Spanish speakers proficient in English.
A further distinction between the Structured Immersion model outlined by its
originators and its implementation in Arizona is that Baker and de Kanter expected
that the teacher would be proficient in the EL's first language. They wrote, “The
immersion teacher understands L1 [the student's first language], and students can
address the teacher in L1; the immersion teacher, however, generally replies only in
L2” (Moore, 2014). However, as outlined below, this is not, overwhelmingly, how the
process has been interpreted and administered in Arizona.
Figure 11. Overview of Arizona’s 4-Hour Block of EL Instruction (ADE, 2019)

IMPACT OF LEGISLATION ON ARIZONA’S ENGLISH LEARNERS 33
How Initiatives Work in Arizona
As previously noted, Arizona’s English acquisition program for ELs was
instituted after passage of Proposition 203 in 2000 by ballot initiative. Because of
Arizona’s peculiar history of ballot initiatives, any changes that might need to be made
to the law can be very difficult. This makes an overview of Arizona’s history of
initiatives of potential use. According to the Initiative and Referendum Institute at the
University of Southern California (2019), 24 U.S. states allow voters to enact new
laws or constitutional amendments or repeal existing laws or constitutional
amendments via ballot initiative.
In a 2013 analysis, Berman found that, of the 425 initiatives proposed in
Arizona between 1970 and 2013, only 16% made it to the ballot with only half of
those becoming law. This means an overall approval rate of 8% of all proposed
initiatives. Initiatives have been with Arizona since the state’s first and only
constitution was adopted in 1910 (Berman, 2013). The initiative process in Arizona
and throughout the United States is a form of direct democracy that allows voters to
circumvent legislators they believe are defying popular opinion (Berman, 2013).
Per Berman (2013), for most of the state’s history, there is little record of the
state legislature trying to alter legislation passed by voters in initiatives. This changed,
however, in the mid- and late-1990s, as the state legislature was charged by the public
and media with tampering with ballot initiatives (Berman, 2013). This came to a head
in 1997 when the state legislature gutted a medical marijuana measure (Berman,
2013). This led to the successful passage, in 1998, of the “Voter Protection Act” (HB
2244) which established the requirement that three-fourths of both chambers of the
IMPACT OF LEGISLATION ON ARIZONA’S ENGLISH LEARNERS 34
Arizona state legislature are required to change or overturn laws passed via initiative
and then only to “further the purpose” of the law (Berman, 2013).
Who English Learners Are
According to Debrandt and Gaquin (2007), prior to 2001, English learners
were popularly referred to as Limited English Proficient (LEP) students. Both terms,
along with the currently-favored English learner (EL) were and are, the writers note,
used to describe students who are served in specific programs of language assistance
such as English as a Second Language, High Intensity Language Training, and
bilingual education (Debrandt & Gaquin, 2007). This group of students is not
homogenous, as ELs come from a variety of backgrounds. Among ELs are students
newly-arrived in the United States who fluently speak a language other than English,
students who have had formal education in any language that has been interrupted,
students who are refugees, and students who are international adoptions (Colorín
Colorado6, 2019).
This group of mostly children has been described using a dizzying array of
terminology over the years. Besides the aforementioned EL, ELL, and LEP, Webster
and Lu (2012) reported on many of the other competing terms: Language Minority
Student (LMS), English as Second Language Learner (ESL), English as Additional
Language Learner (EAL), Culturally Linguistically Diverse Student (CLDS), (person
with) Limited English Speaking Ability (LESA), and Second Language Learner
(SLL). Webster and Lu (2012) settled on Learner of English as an Additional
6 Colorín Colorado is an educational service of the Greater Washington Educational
Telecommunications Association that provides free English learning information, activities, and advice
to parents, schools, and communities around the United States (Colorín Colorado, 2019).

IMPACT OF LEGISLATION ON ARIZONA’S ENGLISH LEARNERS 35
Language (LEAL) as an ideal term as it is “a politically and culturally appropriate and
respectful term that utilizes person first language while also acknowledging existing
language competencies.”
These are also students having a PHLOTE (Primary Home Language Other
than English) (Center for Student Achievement, 2016). Arizona Revised Statute 15-
756 stipulates that the primary or home language for all new students be identified as
outlined by the superintendent of public instruction. This is accomplished by
furnishing parents with the PHLOTE home language survey which, according to a
note on the current form, has been in effect since April 4, 2011 (ADE, 2019).
How English Learners Are Educated in Arizona
Lillie et al (2010) noted that the 2006 Arizona House Bill 2064 created an
English Language Task Force (Arizona Revised Statute 15-756.01), removing EL
oversight from the Arizona Department of Education (ADE) and placing it in the
hands of the state legislature. This legislation was instituted to dismantle and replace
bilingual education in the state for grades K–12 and replace it with a version of
Structured English Immersion (SEI), a method of English-only instruction discussed
above (Lillie et al, 2010).
Lillie et al (2010) visited 18 different schools chosen to be representative of
Arizona’s schools generally. The researchers sought schools with both high and low
proportions of ELs as well as schools in rural and metro areas to capture as many
school types as possible. The researchers focused their assessment on four main areas:
classroom environment, materials/resources, SEI practices, and promotion/graduation
(Lillie et al, 2010).

IMPACT OF LEGISLATION ON ARIZONA’S ENGLISH LEARNERS 36
In terms of classroom environment, Lillie et al (2010) found that it was, for the
most part, no different from that in non-SEI classrooms. Students sat at tables,
primarily in groups or in pairs at the elementary level and primarily in rows of desks at
the upper grade levels. The primary difference the researchers noted were that the EL
students were separated from their English-speaking peers for 4 hours of English-only
instruction mandated by the English Language Learner Task Force as part of their
English Language Development (ELD) program. These students, Lillie et al (2010)
further noted, became socially isolated from the broader school community.
Moore (2014) noted that students are grouped together by grade level,
proficiency level, or both, according to performance on the state’s language
assessment, the AZELLA (previously SLEP). This means, Moore continues, that
students are first grouped according by grade level and proficiency level. If there are
not enough students to make a class, students within the same grade but at different
levels of proficiency may be mixed within the same class to increase the class size
(Moore, 2014).
Lillie et al (2010) found that, in classrooms with a mix of EL and non-EL
students, the “otherness” of ELs would still be emphasized as EL policies and different
EL curricula were posted prominently on boards for all students to see. The
researchers further reported that many teachers “looked down” on the EL population,
assuming they were not, in fact, ELs but simply had behavior issues (Lillie et al,
2010). Meanwhile, some students referred to ELs as “wetbacks” and refused to
associate with them (Lillie et al, 2010).

IMPACT OF LEGISLATION ON ARIZONA’S ENGLISH LEARNERS 37
In terms of materials/resources, Lillie et al (2010) found that materials were
often not appropriate for the students’ age, grade, or interest levels, a violation of
Arizona School Board Rule (SBR) R7-2-306, F.3 which states, “The curriculum of all
English language learner programs shall incorporate the Academic Standards adopted
by the Board and shall be comparable in amount, scope and quality to that provided to
English language proficient students.” Lillie et al (2010) found that students often felt
that the materials were unengaging and tailored for a younger audience. Teachers often
tried to compensate for the inappropriate, outdated, or nonexistent materials by
creating their own materials or purchasing them with their own money (Lillie et al,
2010).
In terms of SEI instruction practices, Lillie et al (2010) found a variety of
teaching methods used, with some better-attested than others. One questionable
practice was that of interrupting the EL student in the middle of a sentence in order to
have the student correct a grammatical or pronunciation mistake (Lillie et al, 2010).
This generally had the effect of emphasizing the correctness of the language being
used and often embarrassing the student while discouraging natural communication
(Lillie et al, 2010).
In terms of promotion/graduation, Lillie et al (2010) noted that, per ARS §15-
752, students will ideally become proficient within one year of beginning SEI, while
five to seven years is a very common timeframe given in academic literature regarding
child and young adult language acquisition. Lillie et al (2010) noted a widespread
sentiment expressed by teachers that former education in the students’ home country
typically meant that they would be out of the program in three to four years.

IMPACT OF LEGISLATION ON ARIZONA’S ENGLISH LEARNERS 38
Meanwhile, students with no education in their home country would often have
difficulty ever moving out of the program (Lillie et al, 2010).
How EL Education is Funded in Arizona
An important aspect of any program is whether it is adequately funded. While
no resource appears to exist comparing per-pupil EL expenditures, it may be useful to
consider how Arizona determines funding and how the state has funded the program in
the past. As stipulated in Arizona Revised Statute §15-756.03(A), educational
institutions may apply for EL funding using the state’s SEI Fund Application. The
funding application process is accomplished in three phases:
Phase I: Average Class Size Survey
Phase II: The Incremental Teacher Spreadsheet, used to calculate the
incremental cost of implementing the models.
Phase III: The Budget Application. Approved salaries/benefits are documented
in the application for review by ADE. (von Prisk, 2018)
According to the Arizona Average Class Size Survey User Guide linked to by
von Prisk (2018), a local education agency (LEA) will use a portal on the Arizona
Department of Education website to report their expected EL class sizes for the current
school year. This information is used to determine funding and to determine how
many teachers will be allocated to a given school (ADE, n.d.; ADE, 2016).
Recent History of Legislation Impacting English Learners in Arizona
The recent history of legislation impacting ELs in Arizona begins with a legal
case involving an 8-year-old girl named Miriam Flores. Carroll (2006) wrote that

IMPACT OF LEGISLATION ON ARIZONA’S ENGLISH LEARNERS 39
Flores, a resident of Nogales, Arizona, had received bilingual instruction in most
classes up to the third grade. When Flores entered third grade, however, all instruction
was in English, and Flores’s grades sank rapidly (Carroll, 2006). Southern Arizona
Legal Aid filed a class-action lawsuit in the Federal District Court on behalf of
Miriam’s mother (also Miriam) based on the Equal Educational Opportunities Act
(EEOA) of 1974 (Mahoney, MacSwan, & Thompson, 2005; Thomas, Aletheiani,
Carlson, & Ewbank, 2014). In the suit, Flores v. Arizona, the plaintiffs argued that
ELs in the district were taught by underqualified teachers, that the state lacked
adequate processes for identifying and monitoring ELs, and that the state lacked
adequate funding for EL instruction (Mahoney et al, 2005).
In 2000, Thomas et al (2014) noted, District Court judge Alfredo Marquez
agreed with the plaintiffs and ruled in their favor. Marquez ruled that Arizona’s EL
program was based on sound legal theory but that the state had not allocated adequate
funding for appropriate implementation. Marquez noted several deficiencies stemming
from this inadequate funding: an unfavorable EL-to-teacher ratio, too few classrooms
for the ELs, a lack of qualified teachers, too few teachers’ aides, insufficient access to
tutoring services, and inadequate teaching materials for both the ELs’ content areas
and their English classwork (Lillie et al, 2010).
The case, Flores v. Arizona, resulted in an August 2000 consent decree7
between the Arizona Superintendent Lisa Graham Keegan and the plaintiffs containing
five requirements: standardized methods of identifying LEP students; uniform
7 Per Pahre (2017), a consent decree is a legally-binding judgment that resolves a case without any party
admitting guilt or liability. The decree usually requires a party to complete a certain objective over a
given timeframe under supervision of the issuing court (Pahre, 2017).

IMPACT OF LEGISLATION ON ARIZONA’S ENGLISH LEARNERS 40
performance standards for determining and reassessing English proficiency; alignment
of curriculum with academic standards and instructional strategies appropriate for
English learners; criteria on individual education plans (IEPs) for English learners; and
monitoring and compliance responsibilities by the Arizona Department of Education.
However, according to a 2013 report by the Arizona Senate Research Staff (ASRS8),
the decree did not specify or allocate funding.
The Arizona Senate Research Staff (2013) further reported that, in 2000,
Arizona voters approved Proposition 203 which replaced existing bilingual education
with a requirement that all classes be taught in English unless classified as English
Language Learners, in which case they would be educated separately via Structured
English Immersion (SEI) for a period of no more than a year (ASRS, 2013). SEI
programs require that all classroom instruction and materials be in English but that the
pupil’s native language may be used when necessary (ASRS, 2013). The thrust here,
in case it is not clear, was to get as many non-English-proficient students into SEI
programs as possible.
The possibility of bilingual instruction was not entirely precluded, as a waiver
could be requested by the student’s parent, exempting the student from the SEI
requirement (ASRS, 2013). In order to qualify for a waiver, the child must
demonstrate an appropriate mastery of English as measured by acceptable tests, must
be over 10 years of age and have the consent of the school principal and educational
staff, or must have special needs (A.R.S. § 15–573). Wright and Daniel (2006) noted
8 The Arizona Senate Research Staff is a division of the Arizona state government that “provides
nonpartisan, objective legislative research, policy analysis and related assistance to the members of the
Arizona State Senate” (ASRS, 2019).

IMPACT OF LEGISLATION ON ARIZONA’S ENGLISH LEARNERS 41
that such waivers “were designed to be intentionally hard to get and easy for schools
and districts to deny.” Wright and Daniel (2006) additionally asserted that state
education leaders enacted further efforts that make it nearly impossible for any EL
under the age of 10 to participate in a bilingual education program.
The Arizona Senate Research Staff (2013) reported that, as no funding had
been set aside after the 2000 consent decree, the District Court hearing the Flores case
ordered Arizona to conduct a cost study. The Arizona Department of Education
released results of the study in May 2001 where an estimated price range of $0 to
$4,600 per EL student was given (ASRS, 2013). In December of 2001, the Arizona
legislature approved HB 2010 which increased per pupil spending from roughly $179
to $340 (ASRS, 2013). In April of the following year, plaintiffs in Flores challenged
the $340 amount as arbitrary (ASRS, 2013). The District Court ordered another cost
study to be completed by January of 2002 (ASRS, 2013).
If this cost study was conducted, no evidence of its existence could be found as
of publication of this report. However, as the Arizona Senate Research Staff (2013)
noted, the National Conference of State Legislatures (NCSL)9 began its own cost study
in August 2004 that was completed in February 2005. As a result, the NCSL
recommended funding ranging from $670 to $2,571 per pupil, based on grade level
and various at-risk factors (ASRS, 2013). In December 2004, the plaintiffs asked the
District Court to again intervene, and the District Court ordered the state to increase
EL funding by the end of the 2005 legislative session (ASRS, 2013). As a result, the
9 The NCSL is a bipartisan non-governmental organization that provides research and technical
assistance to its members which include legislators and staff across the U.S. states, territories, and
District of Columbia (Moody’s, 2019).

IMPACT OF LEGISLATION ON ARIZONA’S ENGLISH LEARNERS 42
Arizona legislature passed HB 2718 which was vetoed by Governor Napolitano based,
among other reasons, on the claim that the bill illegally required supplanting, the
replacing of the funding of state obligations with federal money (Haver, 2018).
Arizona Senate Research Staff (2013) noted that two more bills followed, HB
2718 and HB 2002 that were also vetoed by Governor Napolitano citing issues with
tax credits for private investment and the likelihood that the provision still did not
satisfy the District Court’s requirements (ASRS, 2013). Napolitano allowed HB 2064
to become law in March 2006 without her signature10, predicting that the court would
find it inadequate (Jiménez-Castellanos, Combs, Martínez, and Gómez, 2013).
By this point, the Arizona Senate Research Staff (2013) noted, the District
Court had instituted a fine of $1 million for each day that the state failed to comply
with its funding requirement. By the time HB 2064 went into effect, the penalty had
reached $21 million (ASRS, 2013). In March and April 2006, the District court ruled
that the $21 million should be distributed to school districts and found that HB 2064
still did not satisfy 2000 District Court order (ASRS, 2013).
Jiménez-Castellanos et al (2013) noted that, among other stipulations of HB
2064, it created an English Language Learner task force. This group assumed a role
previously held by the State Board of Education and was to develop research-based
models of SEI (Jiménez-Castellanos et al, 2013). One outgrowth of this development
was the requirement that English learners receive 4 hours of English language
development daily for the first year of being in the SEI program (Jiménez-Castellanos
10 “The governor must sign or veto legislation within five days of the day after transmittal (excluding
Sunday), or it becomes law without his/her signature. If legislation is transmitted after the session
adjourns, the governor must act within 10 days of adjournment (excluding Sunday), or the legislation
becomes law without being signed” (StateScape, n.d.).

IMPACT OF LEGISLATION ON ARIZONA’S ENGLISH LEARNERS 43
et al, 2013). In this SEI model, students were isolated from non-EL peers for 4 hours
out of a typical 6 to 6 ½-hour school day (Jiménez-Castellanos et al, 2013).
Jiménez-Castellanos et al (2013) further noted that, in August 2009, the
Arizona legislature passed SB 1096, which appropriated $40.7 million to fund
Structured English Immersion (SEI) programs in the state. Again, Napolitano allowed
the bill to become law without her signature, and again the plaintiffs complained to the
District Court that the state was still failing to comply with the 2000 judgement
(Jiménez-Castellanos et al, 2013).
Jiménez-Castellanos et al (2013) further noted that the case would eventually
go to the Supreme Court in 2009 as Horne v. Flores. Superintendent Horne argued that
Arizona’s changes to its EL program did satisfy the requirements of the consent decree
in Flores v. Arizona (Jiménez-Castellanos et al, 2013). In a 5-4 decision, the Supreme
Court ruled in favor of Horne, the majority arguing that the EEOA did not mandate a
funding requirement nor a funding source (Jiménez-Castellanos, 2013).
Recent Data Regarding Arizona’s Relationship with English Learners
To get an idea of possible issues with EL education in Arizona, it may be
useful to examine trends in this population of students nationally, regionally, and
compared to states with demographics similar to those of Arizona. To begin with,
below is an overview of high school graduation rates in the United States along with
some major demographic groups: Asian/Pacific Islander, white, black, Hispanic,
American Indian, and Limited English/English Learner:

IMPACT OF LEGISLATION ON ARIZONA’S ENGLISH LEARNERS 44
Figure 12. U.S. High School Graduation Rates by Selected Groups, 2010-2016
(Smith, 2019 – “Graph – EL U.S. 2010-2016”)
Data for ELs were not available for all states prior to 2010, so that information
is not included here. The chart shows a general trend upward in graduation rates. The
group with the lowest high school graduation rate is ELs. Although their graduation
rate climbed over the period from 57% to 66%, even 66% is still 19 percentage points
lower than the overall average. This suggests that ELs generally struggle academically
compared to peers who are not categorized as ELs.

IMPACT OF LEGISLATION ON ARIZONA’S ENGLISH LEARNERS 45
Now, the high school graduation rates for just Arizona high schoolers:
Arizona High school Graduation Rates, 2010–2016
Figure 13. Arizona High School Graduation Rates, 2010–2016
(Smith, 2019 – “Graph: EL AZ 2010–2016”)
Overall, Arizona falls short of the national average for every demographic
except for Asians/Pacific Islanders. Arizona falls especially short with respect to ELs.
Like the United States in general, and especially southwestern states, most of
Arizona’s ELs are Spanish speakers (Bialik, Scheller, and Walker, 2018). So, a
possible explanation for Arizona’s low EL graduation rates might be that Spanish
speakers with limited English proficiency struggle more than other groups with
language acquisition. To entertain this possibility, one might compare Arizona to other
southwestern states that have an equally high proportion of Spanish-speakers with
limited English proficiency.
To do this, it would be useful to find one or more southwestern states where
demographics are as similar to Arizona as possible while also having better EL

IMPACT OF LEGISLATION ON ARIZONA’S ENGLISH LEARNERS 46
graduation rates than Arizona’s. For this analysis, the U.S. Southwest is defined as
California, Nevada, Utah, Arizona, Colorado, New Mexico, and Texas. The following
graph shows the total numbers of EL students enrolled in public elementary and
secondary schools for those states from 2000 to 2015:
Figure 14. EL Student Population in the U.S. Southwest, 2000-2015
(Smith, 2019 – “All Southwest”)
It should, perhaps, not be surprising that California and Texas have the largest
population of EL students as they are the two most populous U.S. states (Sawe, 2018).
Where these states are compared to Arizona in this analysis, it is with the caveat that
their large populations might be responsible for any differences between them,
Arizona, and other less populous states. If those states are removed, the following
chart results:

IMPACT OF LEGISLATION ON ARIZONA’S ENGLISH LEARNERS 47
Figure 15. EL Population in Smaller/Less Populous U.S. Southwest States, 2000–2015
(Smith, 2019 – “Smaller States”)
What should be clear from this chart is that four of the five states are fairly
close in their overall population of EL students over the entire 15-year period captured
in this dataset. Arizona’s results show a precipitous decline between 2005 and 2010,
though, that invites further exploration. One might think that this decline is simply a
matter of the EL student population having been miscounted in 2000 and 2005.
However, the larger number is more in line, proportionally, with the other
southwestern states as shown in the following graph:

IMPACT OF LEGISLATION ON ARIZONA’S ENGLISH LEARNERS 48
Figure 16. EL Student Proportion in the U.S. Southwest, 2000-2015
(Smith, 2019)
As this chart shows, Arizona’s EL student population was the same as the
mean between 2000 and 2005. After that, it plummeted until it was on par with Utah’s.
This invites the question of why Utah’s EL student proportion appears so far below the
mean, and that deserves further exploration. This probably stems partially from the
fact that Utah has a smaller Hispanic population and proportion of Hispanics than
other Southwest states along with having a larger white population (Figure 17). As
noted elsewhere, in the United States overall, a state’s EL population is strongly
correlated with that state’s Hispanic proportion. This may further invite the question of
why Utah’s racial demographics differ so much from surrounding states, but that is
outside the scope of this study.

IMPACT OF LEGISLATION ON ARIZONA’S ENGLISH LEARNERS 49
Figure 17. Racial Demographics in the U.S. Southwest, 2017 (Smith, 2019)
Focusing exclusively on the Southwest may invite the criticism that an
intentionally-biased, small sample has been used in order to illustrate a non-existent
phenomenon. However, looking at the full dataset for all 50 states and DC points to
Arizona as the loan outlier. If one analyzes the full dataset of ELs as a percentage of
total enrollment for all 50 states, one finds an average decline of .05 percentage points
(Smith, 2019). Most states, 30 in total, saw an increase in the proportion of ELs, 18
states saw no change, and 18 states saw a decrease (Smith, 2019). Among the states
that saw a decrease, the average decrease was 1.78 percentage points, with the highest
decrease being Arizona at 10.9 percentage points, Montana at 4.1 percentage points,
and New Mexico at 3.5 percentage points (Smith, 2019).
While the average proportion of ELs in all states may help to illustrate to what
degree Arizona is an outlier, it may be helpful to also look at the total increases or
decreases in all states. This can be problematic, as the above cases of Montana and
New Mexico illustrate. While Arizona has a 2018 population estimated at roughly 7.2

IMPACT OF LEGISLATION ON ARIZONA’S ENGLISH LEARNERS 50
million, New Mexico has only roughly 2.1 million and Montana just over 1.5 million
(U.S. Census Bureau, 2018). With the basic mathematical caveat that, the larger a
state’s population, the larger the change will need to be in order to be statistically
significant, the mean change in EL population for all 50 states between 2005 and 2010
was a decline of 303 EL students (Smith, 2019).
Obviously, this is a much smaller change than Arizona’s decline of 98,536
over the same period (Smith, 2019). However, the decline was very similar in
California at 97,213 (Smith, 2019). Here, though, one encounters the problem of
comparing states with significantly different population sizes. In absolute numbers,
Arizona and California saw the largest drop by far. The next closest decline was New
Mexico’s at 10,125, while the next largest overall changes were in North Carolina
(increase of 29,615), Texas (increase of 26,926), and South Carolina (increase of
21,991) (Smith, 2019).
While Arizona’s decline was close to that of California’s, the decline in
California represented only a 6.2% decrease compared to the 56.4% decrease in
Arizona, again the largest decrease of any state in the country (Smith, 2019). The next
largest percentage decrease was that in Montana, which saw a 50.8% decrease when
its EL population fell from 6,711 in 2005 to 3,300 in 2010 (Smith, 2019). While this is
clearly a large proportional change, it is a relatively small change in absolute numbers.
If one takes the overall mean percentage decline in all 50 states between 2005 and
2010, one finds a mean increase of 11.8%, an enormous 68 percentage point
difference from Arizona’s change (Smith, 2019). If one calculates the mean of only the
18 states that saw a decline in EL population over the same period, one would find a

IMPACT OF LEGISLATION ON ARIZONA’S ENGLISH LEARNERS 51
mean decline of 17.3%, a difference of 39 percentage points compared to Arizona’s
change (Smith, 2019). There does not appear to be any way to look at Arizona’s EL
population decline between 2005 and 2010 as anything but anomalous.
Based on the demographics (i.e., size, population, Spanish-speaking
population) of New Mexico, Nevada, and Colorado, these states stand out as being the
best basis for comparison for Arizona’s expected EL proportion. Of those states, the
state closest in overall population is Colorado:
Figure 18. Population History of Selected U.S. Southwest states, 1875-2025
(Wolfram Alpha/U.S. Census Bureau, 2019)
If the goal is ultimately to have EL education outcomes that are as a
comparable as possible to the best-performing states, it might be useful to know how
well the best-performing states are doing. The following chart shows how the top 10
states performed between 2013 and 2016:

IMPACT OF LEGISLATION ON ARIZONA’S ENGLISH LEARNERS 52
2013-2014 2014-2015 2015-2016
State
EL Grad
Rate % State
EL Grad
Rate % State
EL Grad
Rate %
West Virginia 89 Arkansas 86 West Virginia 93
Arkansas 84 West Virginia 86 Arkansas 86
Iowa 83 Iowa 83 Iowa 81
Indiana 80 Kansas 77 Maine 78
Delaware 77 Maine 77 Kansas 77
Idaho 75 New Hampshire 77 South Carolina 76
Kansas 75 Rhode Island 77 Tennessee 76
New Hampshire 75 South Carolina 76 New Jersey 75
South Carolina 73 Alabama 75 Rhode Island 74
Figure 19. Top 10 U.S. States for EL High School Graduation Rates, 2013-2016 (Smith, 2019)
Given that some of the top states for EL graduation rates over several recent
school years were West Virginia, Arkansas, Iowa, Kansas, and South Carolina, one
might wonder why one of those states should not be a guide state that other states
should try to emulate with respect to EL policy. The chief problem there is that West
Virginia also has among the lowest enrollment of EL students in the country. In the
2015 school year, the state enrolled a total of 2,812 EL students compared to
Arizona’s reported 67,195 and Colorado’s 104,289 for the same year (NCES, 2017).
As Figure 20 shows, West Virginia has a very low number of EL students (in
fact, second only to Vermont in the entire country). Four of the seven states with high
EL graduation rates that appear in Figure 19 two or more times have far fewer
numbers of EL students compared to the U.S. Southwest and to the smaller U.S.
Southwest states defined above:

IMPACT OF LEGISLATION ON ARIZONA’S ENGLISH LEARNERS 53
Number of EL students
State 2000 2005 2010 2012 2013 2014 2015
Arkansas 11,850 20,709 31,537 33,889 35,961 37,799 38,376
Iowa 11,253 15,156 21,733 21,839 23,137 25,875 27,300
Kansas 14,878 24,671 39,323 42,590 45,530 47,209 52,789
Maine 2,410 3,353 4,792 4,980 5,201 5,177 5,091
New Hampshire 2,728 2,876 3,965 3,714 3,513 3,605 4,116
South Carolina 5,121 14,388 36,379 41,072 40,340 42,480 42,574
West Virginia 920 1,944 1,788 2,084 1,879 2,707 2,812
Figure 20. Number of EL Students in Top-Performing States in EL
High School Graduation Rates, 2000–2015 (Smith, 2019)
While Arkansas, Kansas, South Carolina, and Iowa have larger EL
populations, these states have significantly different demographic makeups compared
to those of Arizona and most other southwestern states:
Figure 21. Racial Distribution of U.S. Southwest States and Some EL Graduation Top-
Performing States (Smith, 2019)

IMPACT OF LEGISLATION ON ARIZONA’S ENGLISH LEARNERS 54
Of these states, the two most similar to Arizona demographically are Colorado
and Nevada. South Carolina is somewhat close but has a much larger African-
American population. New Mexico does not have a large African-American
population, but it does easily have the largest proportion of its population that is
Hispanic. This leaves Colorado, Nevada, and Arizona as the three most similar states
overall by overall population, EL population, and racial demographics. This is not to
assert that different population makeups have a definite impact on a state’s education
or, more specifically, on a state’s EL population; it is simply an effort to reduce the
number of confounds in the comparison to the greatest degree possible.
To further demonstrate the strong relationship between a state’s proportion of
Hispanics and its EL population, one can perform a Pearson correlation. If one
performs this calculation using U.S. Census data for 2000 and NCES data for 2000,
one finds a strong, statistically significant, positive correlation between a state’s
proportion of Hispanics and its EL population: r = .87, p = < .01 (Smith, 2019). If one
performs the calculation again using 2010 data, one again finds a strong positive
correlation between a state’s proportion of Hispanics and its proportion of EL
students: r = 0.82, p < .01 (Smith, 2019).
Given this strong positive correlation, one might further attempt to discern
what a state’s total number of EL students should be in 2010 and other years by
looking at the state’s proportion of Hispanics in 2000. One can demonstrate the strong
correlation between the states’ EL proportion in 2000 and their EL student proportion
in 2010 with another Pearson correlation. When one performs this calculation, one
finds a strong correlation: r = 0.84, p = < .01 (Smith, 2019). Overall, states’ EL

IMPACT OF LEGISLATION ON ARIZONA’S ENGLISH LEARNERS 55
proportion stayed very consistent between 2000 and 2010, making a state’s 2000 EL
student proportion highly predictive of what that state’s EL proportion would be in
2010. In fact, and this should be obvious looking at the raw data, changes in the EL
population greater than 2 percentage points over any given period are rare, making it
possible to predict, within a narrow margin, a state’s EL proportion for a given year
based on its EL proportion for any other given year.
The point of these comparisons is to try to better understand where Arizona’s
population of ELs could be, in terms of educational outcomes and population size, if
conditions for the students in the state were different somehow. Shifting back to
educational outcomes, considering that Colorado and Nevada are the most similar U.S.
states to Arizona, it might be useful to see a comparison of just those three states:
High School Graduation Rates in Arizona, Colorado, and Nevada, 2010–2017
Figure 22. High School Graduation Rates in Arizona, Colorado, and Nevada,
2010-2017 (Smith, 2019)

IMPACT OF LEGISLATION ON ARIZONA’S ENGLISH LEARNERS 56
This chart includes only the overall graduation rate, Hispanic graduation rate,
and EL graduation rate for the specific years. The Hispanic graduation rate is included
because Hispanics and Spanish-speakers make up the majority of the EL population in
the United States and these states more specifically. Here, Arizona emerges as at or
near the top state for overall and Hispanic high school graduation rates. This may be
noteworthy as one might expect that, because most ELs in the United States and
Arizona are Hispanic, the low graduation rates of ELs in Arizona should lower the
graduation rate of the Hispanic population more broadly. This makes sense if ELs are
only counted for one group (the EL group) and not also for their various racial
subgroups.
Like the other two states, Nevada shows a generally upward trend. It generally
shows only somewhat better EL results than Arizona. Over the last year of reported
below, however, Nevada very suddenly exceeds many states in every category. Figure
23 more completely illustrates the unusually large jump in high school graduation
rates for most groups and the leap in EL graduation rates. While this appears suspect,
Figure 23. Nevada High School Graduation Rates, Select Groups, 2010–2016 (Smith, 2019)

IMPACT OF LEGISLATION ON ARIZONA’S ENGLISH LEARNERS 57
it may represent the new normal for Nevada. However, even if the data are reliable, it
is probably still wise to wait for further data and explanations as to how Nevada has
made such significant improvements so quickly.
One possible explanation for the large difference in EL graduation rates
between Arizona and especially Colorado is that the latter state allows instruction in
the student's native language whereas Arizona requires that students be removed from
their regular classes for English-only language instruction (Milem et al, 2016).
However, Faltis (2011) noted that the leading paradigms, English-only immersion and
bilingual education, both have mixed outcomes in a variety of different studies.
Because the results have been so varied, the comparison to Colorado should be useful.
If Colorado, for example, uses a mixed model of immersion and bilingual education,
that could be useful for policy recommendation.
Two Mysteries in the Data
From the various charts and datasets presented above, two mysteries emerge:
First, the steep drop-off in Arizona’s EL population and EL student proportion (Figure
15 and Figure 16, respectively) between 2005 and 2010 and, two, Arizona’s
consistently low EL high school graduation rate. Because this analysis focuses on
outcomes of legislation on EL students, there are two primary types of legislation that
might impact EL students: legislation impacting education in the states and, because
most EL speakers in the United States and in Arizona are of Latin American origin,
legislation impacting Arizona immigrants. The following paragraphs address how
legislation has impacted this population in an effort to explore these mysteries.

IMPACT OF LEGISLATION ON ARIZONA’S ENGLISH LEARNERS 58
Explanations for the Sharp Decline of Arizona’s EL Population/Proportion
Miscategorization
In 2011, the Arizona Auditor General’s Office reported on a decline of 38% of
the EL student population in Arizona between fiscal years 2008 and 2010. This meant
a decline in the EL student population of roughly 64,000 from 170,000 to 106,000. In
the report, it is asserted that the number declined because EL students became
proficient at higher rates, 15% withdrew from the program, and because there were
35% fewer new EL students (Arizona Auditor General, 2011).
These figures from the Auditor General appear problematic on close scrutiny.
What is interesting about the assertion that there were 35% fewer students is that, one,
that would represent most of the 38% decline. If 15% withdrew on top of the 35% who
did not enter, that would mean a decline of roughly 90,000 EL students or 47% rather
than the 38% decline initially cited. Although the report credits students becoming
proficient at higher rates for this decline, the same report also notes that nearly two-
thirds of districts had not implemented SEI programs (Arizona Auditor General’s
Office, 2011).11
Further deepening the mystery of the precipitous decline of the EL population
are conflicting numbers. While the Arizona Auditor General’s Office (2007) reported
138,449 EL students in fiscal year 2007, the National Clearinghouse for English
11 It may be worth noting that, if it is the case that ELs became proficient at higher rates during this
period while only a third of schools implemented SEI programs, this may be a discredit to the efficacy
of the state’s SEI program.

IMPACT OF LEGISLATION ON ARIZONA’S ENGLISH LEARNERS 59
Language Acquisition and Language12 (NCELA) reported that figure as 166,571 for
the 2007-2008 school year, a difference of 28,122 (Smith, 2019). A similar
discrepancy of 29,680 students in an Auditor General report from 2010 seems to
suggest that the difference could be due to the Auditor’s office using fiscal year data
versus the school year. However, the 2007 federal figure is higher while the 2010
federal figure is lower than the Auditor’s (Smith, 2019).13
The only competing explanation is offered by the Arizona education analysis
organization Center for Student Achievement14 (2016) which wrote that the
precipitous drop in Arizona’s proportion of Arizona students being classified as ELs is
probably a deficiency due to too-lenient proficiency tests more than to an actual very
large change in that population in Arizona. The comparisons in Figure 16 suggest that
Arizona’s EL student proportion prior to roughly 2009 was more in line with the mean
proportion of the other, demographically similar southwestern states at roughly 15%.
Goldenberg and Rutherford-Quach (2010) further support this idea. In their
report “The Arizona Home Language Survey: The Identification of Students for ELL
Services,” they found that Arizona's method of determining EL status miscategorized
11–18% of students who should have been classified as ELs. Garcia, Lawton, and
Figueiredo (2010) reported that Arizona changed from a model employing multiple
12 Per Title III of the No Child Left Behind Act of 2001 (NCLB), NCELA supports the U.S. Department
of Education's Office of English Language Acquisition, responding to Title III educational needs
(NCELA, 2019). 13 The Auditor’s Office was contacted for clarification, but no response has been received as of April
25th, 2019. 14 As of 2017, the Center for Student Achievement was categorized by the Arizona Department of
Education as a School Improvement Supporting Partner and Professional Development Contractor
through the Arizona State Procurement Office. The Center for Student Achievement “provides
customized support for both districts and charter schools through its school improvement research, data
analysis, and professional development” (ADE, 2017).

IMPACT OF LEGISLATION ON ARIZONA’S ENGLISH LEARNERS 60
proficiency tests in 2010 to the Stanford English Language Proficiency Test (SLEP) as
the sole measure of the English proficiency. This method, researchers found, had the
effect of prematurely reclassifying students (Garcia, Lawton, & Figueiredo, 2010).
While this may account for some of the decline in the EL population, it does not
account for the entire decline in question.
The Introduction of E-Verify
Kobach (2008) noted that, in 2007, Arizona became the first state to require
employers to verify the legal status of potential hires via the federal government’s “E-
Verify” system in addition to establishing that businesses found in violation would risk
suspension of their business licenses. Kobach (2008) argued that, because all Arizona
businesses were required to use the employment verification system, unauthorized
aliens would self-deport due to lack of employment opportunities. Kobach (2008)
continues that the law had the immediate impact of causing thousands of alien tenants
to vacate their residences. Kobach (2008) further asserts that this exodus of the
affected population resulted in a $48.6 million surplus in the Arizona public school
system for FY 2008.
Kobach does not make the claim that most English learners in Arizona are
undocumented immigrants. However, as noted above, there is a strong relationship
between a state’s Hispanic population and its share of English learners. If this is paired
with the fact that most undocumented immigrants are from Latin American and
predominantly Spanish-speaking countries (Figure 24), Kobach’s assertion invites
exploration of whether an exodus of the state’s undocumented population caused the
steep decline in the EL student population.

IMPACT OF LEGISLATION ON ARIZONA’S ENGLISH LEARNERS 61
Figure 24. Source Regions of Undocumented Immigrants in the US, 2007
and 2016 (Smith, 2019; Cohn & Passel, 2018)
To address this question, one can look at how changes in the total student
population compare to changes in the EL student population. Looking at the
populations of total students and EL students in Arizona between 1995 and 2017
(Figure 25), it is not obvious that these two populations are related. For example,
between 1995, the total student population increased steadily, while the EL population
stayed fairly flat. While the total student population saw a brief, sharp decline in the
mid-2000s and then began a slight increase, the EL population, after its sharp decline
in the late 2000s, has stayed flat. As expected, if one performs a Pearson correlation
comparing the changes in the two populations between 1995 and 2017, one finds no
statistically significant correlation (r = .14, p < .10) (Smith, 2019).
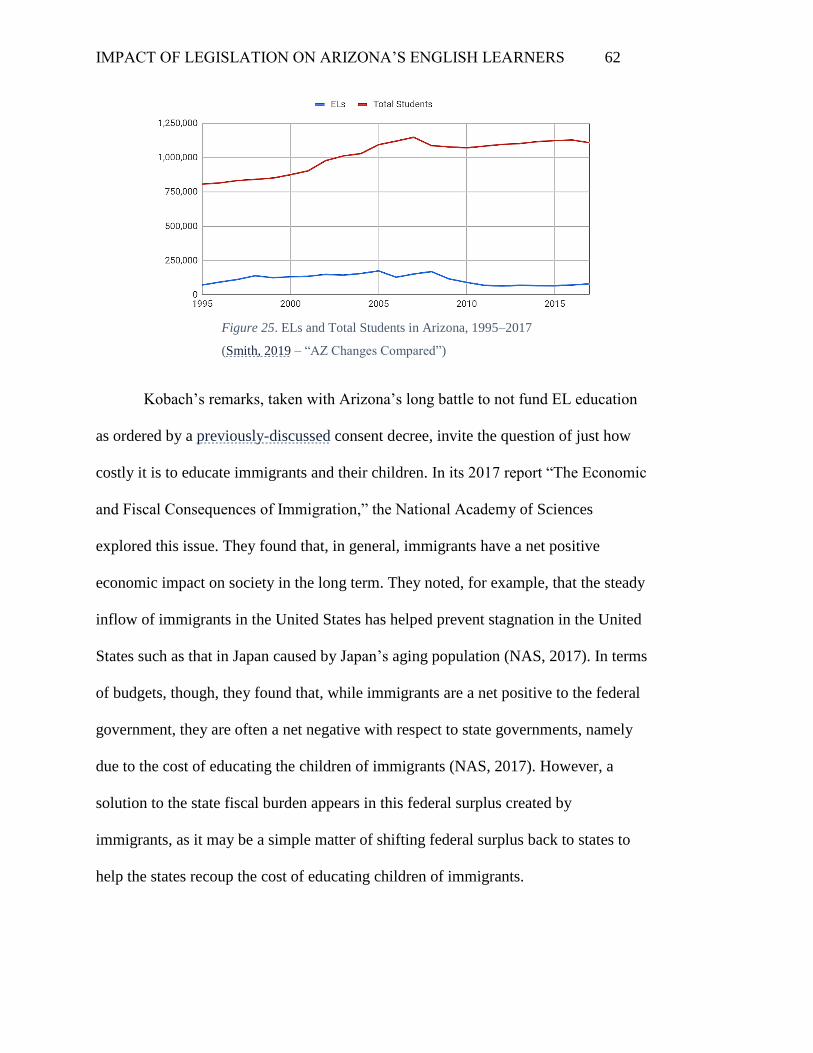
IMPACT OF LEGISLATION ON ARIZONA’S ENGLISH LEARNERS 62
Figure 25. ELs and Total Students in Arizona, 1995–2017
(Smith, 2019 – “AZ Changes Compared”)
Kobach’s remarks, taken with Arizona’s long battle to not fund EL education
as ordered by a previously-discussed consent decree, invite the question of just how
costly it is to educate immigrants and their children. In its 2017 report “The Economic
and Fiscal Consequences of Immigration,” the National Academy of Sciences
explored this issue. They found that, in general, immigrants have a net positive
economic impact on society in the long term. They noted, for example, that the steady
inflow of immigrants in the United States has helped prevent stagnation in the United
States such as that in Japan caused by Japan’s aging population (NAS, 2017). In terms
of budgets, though, they found that, while immigrants are a net positive to the federal
government, they are often a net negative with respect to state governments, namely
due to the cost of educating the children of immigrants (NAS, 2017). However, a
solution to the state fiscal burden appears in this federal surplus created by
immigrants, as it may be a simple matter of shifting federal surplus back to states to
help the states recoup the cost of educating children of immigrants.

IMPACT OF LEGISLATION ON ARIZONA’S ENGLISH LEARNERS 63
Explanation for Arizona’s Low English Learner Graduation Rates
One possible explanation offered for Arizona’s poor EL education outcomes is
Arizona’s unique method of EL instruction: Structured English Immersion (SEI).
Lillie, Markos, Arias & Wiley (2012) analyzed the English immersion model as
implemented in Arizona. They were not critical of this method of language instruction
and efficacy of acquisition so much as they found its implementation in Arizona to be
lacking. They did, however, write that, in Arizona,
ELs do not have access to quality instruction, or a curriculum that is
comparable in amount, scope, and quality to that of non-ELs. Furthermore,
deficiencies in funding abound, limiting ELs’ opportunities for the
compensatory education needed to help them catch up academically. (Lillie et
al, 2012)
It is not possible to compare EL graduation rates in Arizona prior to and after
implementation of SEI in Arizona as a measure of the degree to which SEI has
impacted education outcomes for ELs in Arizona. This is due to a paucity of EL
graduation data prior to 2000. However, the interesting history of the implementation
may provide a useful basis of comparison. As previously mentioned, Arizona’s SEI
program came about after the passage of Proposition 203 by ballot initiative in 2000.
As Crawford (2001) noted, this initiative was championed by California businessman
Ron Unz, creator of Wall Street Analytics and publisher of The American
Conservative from 2007 to 2013 (Pioneer Press, 2015).
Unz first spent large sums of his own money to get an English-only ballot
initiative, commonly referred to as “English for the Children,” passed in his home state

IMPACT OF LEGISLATION ON ARIZONA’S ENGLISH LEARNERS 64
in 1998 (Crawford, 2001). To get Proposition 203 on the ballot in Arizona, Unz
provided $186,886 of the $229,786 (81%) of the money spent on advertising and
signature-gathering (Crawford, 2001). However, a similar ballot initiative attempted in
Colorado was removed by the state supreme court which argued that, among other
reasons, the initiative was deceptive and misleading on the issue of parental choice
(Crawford, 2001).
The Arizona measure was more restrictive than the one passed in California
because the Arizona measure required more effort for parents to request exemption
(Crawford, 2001). Moore (2014) noted that, in contrast to the similar proposition
passed in California, the Arizona version also allowed parents to sue any school
personnel who used a language other than English. Yet another version of the initiative
was passed in Massachusetts in November 2002 as Proposition 202 (Moore, 2014). As
with the other initiatives, this one was engineered to almost completely eliminate
bilingual education in the state (Moore, 2014).
That English-only legislation passed in three states and failed in a fourth at
roughly the same time affords an opportunity to compare the EL graduation rates in all
four states to see the potential impact that English-only legislation might have had on
all four:

IMPACT OF LEGISLATION ON ARIZONA’S ENGLISH LEARNERS 65
EL Graduation Rates in Arizona, Colorado, California, and Massachusetts,
2010–2017
If English-only education has impacted EL graduation rates in these four states,
it is not obvious how. If it had, one would expect Arizona, the state with the most
restrictive policy, to be at the bottom, which it is. One would then expect California to
have the next-worst record, as it also has a less-restrictive English-only mandate, but it
does not have the next-worst record. This apparent lack of impact in states with
English-only outcomes supports the results of an analysis by Griffin (2004) in which
he found that English immersion had no impact on the rate at which ELs were
reclassified as English proficient and no impact on their test scores.
That SEI is not clearly the problem leaves its specific implementation in
Arizona as perhaps the next most likely explanation for the state’s poor EL graduation
rates. The previous section of this paper “Recent History of Legislation Impacting
Figure 26. EL Graduation Rates in Arizona, Colorado, California, and Massachusetts, 2010–2017
(Smith, 2019).
IMPACT OF LEGISLATION ON ARIZONA’S ENGLISH LEARNERS 66
English Learners in Arizona,” describes the creation by the Arizona State Legislator of
an English Language Task Force that, in turn, mandated a 4-hour block of English-
only instruction. This mandate causes students to be removed from their normal
coursework to receive English instruction for 4 hours per day while other students are
learning such subjects as math, science, and social studies, and is a reasonable
explanation.
Possible Solutions to the Problem of Low EL Academic Success
In their case studies in actual Arizona classrooms, Lillie et al (2010) noted that
it was rare for EL teachers to make use of the students’ “funds of knowledge,” their
existing cultural or linguistic knowledge. The researchers cite work by the National
Academy of Sciences that found that children learn most efficiently when they are able
to build on their existing knowledge. Lillie et al (2010), however, found that teachers
in 11 of the 18 classrooms studied actively discouraged student dialogue in a language
other than English. An example given is a child who shared his discovery of the
English-Spanish cognate “collar.” The teacher told the student, “You may think that is
a Spanish word, but it is not; we only have English words in this room” (Lillie et al,
2010). If students are permitted to use their existing knowledge more readily, they may
be more likely to succeed, though this might require a change to Arizona law.
A bill introduced in the 2018 legislative session by Representative Paul Boyer,
a Phoenix high school teacher, would have added greater flexibility to Arizona’s SEI
model (Flaherty, 2019; Stephenson, 2019). The bill would have kept the 4-hour rule in
place for the first year but would have allowed schools to reduce the English
instruction time thereafter to 120 minutes per day in grades K–7 and 100 minutes per

IMPACT OF LEGISLATION ON ARIZONA’S ENGLISH LEARNERS 67
day for grades 7–12 (Stephenson, 2018; Arizona Legislature, 2018). While that bill
was not formally heard in the state senate prior to the close of the legislative session, a
senate version, SB 1014, with house approval was signed into law by the Governor
Ducey on February 14th of this year (Arizona Governor, 2019).
Discussion
Arizona has a long history of trying to suppress the Spanish language that goes
back to its foundation. While Hispanics overall do not fare significantly worse than the
national average in terms of graduation rates, Arizona clearly has a long way to go to
reach either the national average in terms of EL educational outcomes or to reach
regional educational outcomes for that group. The onerous 4-hour block of English
instruction wherein the student receives no instruction in such subjects as math,
science, and social studies is the most obvious problem that may be addressed given
recently-signed legislation. Future studies that analyze educational outcomes for this
group will want to focus on recent changes mentioned above that relax this 4-hour
block.
One hypothesis that may be of interest in further analysis is the degree to
which a student’s family’s region of origin might impact language acquisition and
scholastic outcomes over time. It may be possible that Arizona’s unfavorable EL
outcomes are a result of a population of Spanish-speakers particularly ill-equipped to
learn English that also happens to favor immigration to Arizona. Research from
Volker (2007) could potentially be used to discern regions of Mexico from which most
Spanish speakers in Arizona largely originate. Massey, Rugh, and Pren (2010)
provided a detailed look at Mexican migration origin over time that uses data from

IMPACT OF LEGISLATION ON ARIZONA’S ENGLISH LEARNERS 68
Mexico’s Matrícula Consular Program. Such research techniques, combined with
research regarding Spanish-speakers from Cuba, Puerto Rico, and Central and South
America, could be used to shed further light on this question.
Regarding the likelihood that Arizona is miscategorizing perhaps tens of
thousands of students per year as English proficient who are not, this obviously also
requires further scrutiny. In the time since the 4-hour block was instituted,
miscategorized students may not have had access to EL services, but those services
may also have done more harm than good.
Regardless, there is good reason, at least superficially, to think that Arizona
can better use outcomes in surrounding states to improve outcomes for ELs in
Arizona. Such an analysis may require better comparisons using nationally
standardized tests to compensate for potential differences in graduation criteria
between different states. Future studies, one hopes, might also refine the methods used
above to support or refute the hypothesis of widescale miscategorization. As of
publication of this analysis, the Arizona Department of Education has not been able to
satisfactorily explain it despite multiple requests to do so.

IMPACT OF LEGISLATION ON ARIZONA’S ENGLISH LEARNERS Smith I
References
A–E
Antonisse, L. & Garfield, R. (2018). The Relationship Between Work and Health: Findings from
a Literature Review. Kaiser Family Foundation. Retrieved February 10, 2019 from
https://www.kff.org/medicaid/issue-brief/the-relationship-between-work-and-health-
findings-from-a-literature-review/
Arizona Department of Education. (n.d.). Average Class Size Survey User Guide. Retrieved
March 31, 2019 from
https://cms.azed.gov/home/GetDocumentFile?id=580e7c4daadebe0d3c190624
Arizona Department of Education. (2016). Average Class Size Survey Webinar Powerpoint.
Retrieved March 31, 2019 from
https://cms.azed.gov/ContentCache/5807e4abaadebe05247fa54f/index.htm
Arizona Department of Education. (2017). ADE to Partner with Center for Student Achievement.
Retrieved April 27, 2019 from http://www.azed.gov/2017/05/18/ade-to-partner-with-
center-for-student-achievement/
Arizona Department of Education. (2017). EL Demographics 2016-2017. Retrieved January 19,
2019 from https://www.azed.gov/oelas/el-demographics-2016-2017/
Arizona Department of Education. (2019). English Learner (EL) Forms. Retrieved May 12, 2019
from https://www.azed.gov/oelas/forms/
Arizona Department of Education. (2019). SEI Classrooms. Office of English Language
Acquisition Services (OELAS). Retrieved March 31, 2019 from
http://www.azed.gov/oelas/sei-classrooms/

IMPACT OF LEGISLATION ON ARIZONA’S ENGLISH LEARNERS II
Associated Press Health & Science Department. (2018). AP Analysis: Unemployment, Income
Affect Life Expectancy. Retrieved February 10, 2019 from
https://www.usnews.com/news/best-states/new-york/articles/2018-12-18/ap-analysis-
unemployment-income-affect-life-expectancy
Arizona Auditor General's Office. (2011). Arizona English Language Learner Program.
https://www.azauditor.gov/sites/default/files/ELL_Highlights.pdf
Arizona Governor. (2019). Governor Ducey Signs Legislation to Improve Outcomes for English
Language Learner Students. Retrieved March 31, 2019 from
https://azgovernor.gov/governor/news/2019/02/governor-ducey-signs-legislation-
improve-outcomes-english-language-learner
Arizona Revised Statutes. (2019). Title 15 – Education, Article 3.1 – English Language
Education for Children in Public Schools, 15-753 – Parental waiver.
Retrieved March 30, 2019 from https://www.azleg.gov/ars/15/00753.htm
Arizona Senate Research Staff. (2013). Flores v. Arizona. Arizona State Legislature.
https://www.azleg.gov/briefs/Senate/FLORES%20V%20ARIZONA.pdf
Arizona Senate Research Staff. (2019). Research Briefs. Arizona State Legislature. Retrieved
April 26, 2019 from https://www.azleg.gov/research-briefs/
Arizona State Legislature. (2018). HB 2435: English language learners; instruction; budgeting.
Retrieved March 31, 2019 from
https://www.azleg.gov/legtext/53leg/2R/summary/H.HB2435_02-21-
18_HOUSEENGROSSED.DOCX.htm
Arthur, A. (2018). Birthright Citizenship: An Overview. Center for Immigration Studies.
Retrieved March 31, 2019 from https://cis.org/Report/Birthright-Citizenship-Overview

IMPACT OF LEGISLATION ON ARIZONA’S ENGLISH LEARNERS III
Balderrama, F. E. & Rodríguez, R. (2006). Decade of Betrayal: Mexican Repatriation in the
1930s. University of New Mexico Press.
Bartelt, H. G. (1992). Boarding-School Language Policy and the Spread of English Among
Indians of the American Southwest. In Lyden, F.J. & Legters, L.H. (Eds.). Native
Americans and Public Policy (pp. 137–148). Pittsburgh, PA: University of Pittsburgh
Press.
Batalova, J., & McHugh, M. (2018). Number and Growth of Students in U.S. Schools in Need of
English Instruction. Migration Policy Institute. Retrieved February 10, 2019 from
https://www.migrationpolicy.org/sites/default/files/publications/FactSheet%20EL1%20-
%20FINAL_0.pdf
Beard Rau, A. (2011). Arizona Senate rejects 5 migrant bills. The Arizona Republic. Retrieved
April 26, 2018 from
http://archive.azcentral.com/arizonarepublic/news/articles/2011/03/18/20110318xgr-
immigration0318.html
Berman, D. R. (2013). Initiative Reform in Arizona: Exploring Some Ideas. Morrison Institute
for Public Policy. Arizona State University. Retrieved March 31, 2019 from
https://morrisoninstitute.asu.edu/sites/default/files/specrprt_initiativereform.pdf
Berinsky, A. J. & Lenz, G. S. (2011). Education and Political Participation: Exploring the Causal
Link. Political Behavior, 33:357–373. 33:357–373.
http://web.mit.edu/berinsky/www/files/edu.pdf
Bialik, K., Scheller, A., & Walker, K. (2018). 6 facts about English language learners in U.S.
public schools. Pew. Retrieved April 11, 2019 from https://www.pewresearch.org/fact-
tank/2018/10/25/6-facts-about-english-language-learners-in-u-s-public-schools/
IMPACT OF LEGISLATION ON ARIZONA’S ENGLISH LEARNERS IV
Bryant, J. (1999). Immigration in the United States. Yale-New Haven Teachers Institute.
Retrieved March 23, 2019 from
http://teachersinstitute.yale.edu/curriculum/units/1999/3/99.03.01.x.html
Bureau of Labor Statistics. (2018). Great Recession, great recovery? Trends from the Current
Population Survey. Retrieved February 10, 2019 from
https://www.bls.gov/opub/mlr/2018/article/great-recession-great-recovery.htm
Carroll, S. (2006). For student Miriam Flores, fines worthwhile if they help. Arizona Republic.
Retrieved March 24, 2019 from
http://web1.nusd.k12.az.us/schools/nhs/gthomson.class/articles/education/florez/Flores.fi
nes.worthwhile.help.pdf
Center for Student Achievement. (2016). Ever Since Flores: The History of English Language
Learners in Arizona. Retrieved January 28, 2018 from
http://centerforstudentachievement.org/ever-since-flores-the-history-of-english-language-
learners-in-arizona/
Colorín Colorado. (2019). Special Populations: English Language Learners. Retrieved March 28,
2019 from http://www.colorincolorado.org/ell-basics/special-populations
de Jong, Ester. (2011). Return to Bilingual Education. Colorín Colorado. Retrieved April 28,
2019 from http://www.colorincolorado.org/article/return-bilingual-education#h-
acknowledgements
Debrandt, K. A. and Deirdre A. Gaquin. (2007). The Almanac of American Education, 2007.
Lanham, MD: Bernan Press.
Del Valle, S. (2003). Language Rights and the Law in the United States: Finding Our Voices.
Bristol, UK: Multilingual Matters.

IMPACT OF LEGISLATION ON ARIZONA’S ENGLISH LEARNERS V
Dynan, K. (2011). Retail Sales and Consumer Spending an Important Part of the Economy.
Brookings. Accessed January 27, 2018. https://www.brookings.edu/on-the-record/retail-
sales-and-consumer-spending-an-important-part-of-the-economy/
Education Commission of the States. (2014). What methods are used to identify English
language learners? Retrieved January 13, 2019 from
http://ecs.force.com/mbdata/mbquestNB2?rep=EL1403
Ennis, S. E., Ríos-Vargas, M., & Albert, N. G. (2011). The Hispanic Population: 2010. U.S.
Census Bureau. Retrieved April 21, 2019 from
https://www.census.gov/prod/cen2010/briefs/c2010br-04.pdf
Esomonu, E., Mayes, B., & Charlotte, L. (2017). English Language Learners: How Your State Is
Doing. NPR and U.S. Department of Education. Retrieved February 10, 2019 from
https://www.npr.org/sections/ed/2017/02/23/512451228/5-million-english-language-
learners-a-vast-pool-of-talent-at-risk
F–J
Faltis, K. (2011). Bilingual, ESL, and English Immersion: Educational Models for Limited
English Proficient Students in Texas. Pepperdine Policy Review, Spring 2011. Retrieved
February 10, 2019 from https://publicpolicy.pepperdine.edu/academics/research/policy-
review/2011v4/content/bilingual-esl-english-immersion.pdf
Flaherty, J. (2019). Legislation Seeks to Relax Arizona’s Restrictive English-Only Teaching
Mandate. Phoenix New Times. Retrieved March 31, 2019 from
https://www.phoenixnewtimes.com/news/lawmakers-arizona-immersion-ell-english-
language-learners-11111977

IMPACT OF LEGISLATION ON ARIZONA’S ENGLISH LEARNERS VI
Galka, M. (2016). Here’s Everyone Who’s Immigrated to the U.S. Since 1820 – U.S.
Immigration Flows by Country (% of U.S. Population), 1820s–2010s. Metrocosm.
Retrieved April 24, 2019 from http://metrocosm.com/animated-immigration-map/
Garcia, E., Lawton, K., & Diniz de Figueiredo, E.H. (2010). The Education of English Language
Learners: A Legacy of Persisting Achievement Gaps in a Restrictive Language Policy
Climate. Civil Rights Project (Proyecto Derechos Civiles). UCLA. Retrieved March 29,
2019 from https://www.civilrightsproject.ucla.edu/research/K–12-education/language-
minority-students/the-education-of-english-language-learners-in-arizona-a-legacy-of-
persisting-achievement-gaps-in-a-restrictive-language-policy-climate/garcia-az-ell-gaps-
2010.pdf
Georgetown University. (2013). RECOVERY: Projections of jobs and education requirements
through 2020. Accessed January 27, 2018. https://cew.georgetown.edu/wp-
content/uploads/2014/11/Recovery2020.SR_.Web_.pdf
Georgetown University. (2019). Number of Good Jobs in 2015 by Geography. The Good Jobs
Projects. Retrieved February 10, 2019 from https://goodjobsdata.org/good-jobs-
data/?index=nobaearn_goodpop&education=all&map=true
Goldenberg, C. & Rutherford-Quach, S. (2010). The Arizona Home Language Survey: The
Identification of Students for ELL Services. The Civil Rights Project (Proyecto Derechos
Civiles). UCLA. https://files.eric.ed.gov/fulltext/ED511326.pdf
Griffin, R.D. (1992). Hispanic Americans: Can they find economic prosperity and political
power? CQ Researcher. Accessed January 28, 2018.
http://library.cqpress.com/cqresearcher/document.php?id=cqresrre1992103000

IMPACT OF LEGISLATION ON ARIZONA’S ENGLISH LEARNERS VII
Grissom, J.B. (2004). Reclassification of English Learners. Education Policy Analysis Archives,
12:36. Retrieved March 24, 2019 from http://epaa.asu.edu/epaa/v12n36/
Griswold del Castillo, R. (2006). US-Mexican War - War’s End: Treaty of Guadalupe Hidalgo.
PBS. Retrieved March 23, 2019 from
https://www.pbs.org/kera/usmexicanwar/war/wars_end_guadalupe.html
Hamann, V. (2007). The Impact of International Labor Migration on Regional Development:
The Example of Zacatecas, Mexico. Kassel University press GmbH.
Haver, J.J. (2018). Vindicated: Closing the Hispanic Achievement Gap through English
Immersion. Rowman & Littlefield.
Hedding, J. (2004). Protect Arizona Now. About.com Phoenix. Retrieved March 31, 2019 from
https://web.archive.org/web/20140412225058/http://phoenix.about.com/b/2004/08/23/pro
tect-arizona-now.htm
Hendricks, T. (2005). Issue of illegals roiling Arizona / New law denies public services to such
immigrants. San Francisco Chronicle. Retrieved March 31, 2019 from
https://www.sfgate.com/news/article/Issue-of-illegals-roiling-Arizona-New-law-
2695243.php
Initiative and Referendum Institute. (2019). About. University of Southern California. Retrieved
April 28, 2019 from http://www.iandrinstitute.org/about.cfm
Initiative and Referendum Institute. (2019). Arizona. University of Southern California.
Retrieved January 30, 2019 from http://www.iandrinstitute.org/states/state.cfm?id=2
Initiative and Referendum Institute. (2019). What are ballot propositions, initiatives, and
referendums? University of Southern California. Retrieved March 31, 2019 from
http://www.iandrinstitute.org/quick-facts.cfm

IMPACT OF LEGISLATION ON ARIZONA’S ENGLISH LEARNERS VIII
Jiménez-Castellanos, O., Combs, M.C., Martínez, D. & Gómez, L. (2013). English Language
Learners: What’s at Stake for Arizona? ASU Morrison Institute for Public Policy.
https://drive.google.com/file/d/1VO15Qby4zpL9bQXxGXM68I7rSn1ZHxMg/view?usp
=sharing
Jost, K. (2009). Bilingual Education vs. English Immersion. CQ Researcher.
Retrieved January 19, 2019 from
http://library.cqpress.com/cqresearcher/document.php?id=cqresrre2009121100
Krogstad, J.M. and Lopez, M.H. (2014). For three states, share of Hispanic population returns to
the past. Pew. Retrieved March 23, 2019 from https://www.pewresearch.org/fact-
tank/2014/06/10/for-three-states-share-of-hispanic-population-returns-to-the-past/
Lee Webster, N. & Lu, C. (2012). “English Language Learners”: An Analysis of Perplexing
ESL-Related Terminology. Language and Literacy 14(3).
https://journals.library.ualberta.ca/langandlit/index.php/langandlit/article/download/1062
4/14433
Lillie, K.E., Markos, A., Estrella, A., Nguyen, T., Trifiro, A., Arias, M.B., Wiley, T.G., Peer, K.,
& Pérez, K. (2010). Policy in Practice: The Implementation of Structured English
Immersion in Arizona. The Civil Rights Project (Proyecto Derechos Civiles). UCLA.
Retrieved March 29, 2019 from https://www.civilrightsproject.ucla.edu/research/K–12-
education/language-minority-students/policy-in-practice-the-implementation-of-
structured-english-immersion-in-arizona/lillie-policy-practice-sei-2010.pdf
Lillie, K.E., Markos, A., Arias, M.B., & Wiley, T.G. (2012). Separate and Not Equal: The
Implementation of Structured English Immersion in Arizona's Classrooms. Teachers

IMPACT OF LEGISLATION ON ARIZONA’S ENGLISH LEARNERS IX
College Record, 114(9). Retrieved February 10, 2019 from
https://eric.ed.gov/?id=EJ1001978
K–O
Kobach, K. (2008). Attrition through Enforcement: A Rational Approach to Illegal Immigration.
Tulsa Journal of Comparative and International Law, 15(2), 155–163.
Krogstad, J.M. and Lopez, M.H. 2014. For three states, share of Hispanic population returns to
the past. Pew Research Fact Tank. Retrieved April 24, 2019 from
https://www.pewresearch.org/fact-tank/2014/06/10/for-three-states-share-of-hispanic-
population-returns-to-the-past/
Language Proficiency Assessment Committee. (2011). Language Proficiency Assessment
Committee Framework Manual. Texas Education Agency.
Retrieved March 23, 2019 from
https://web.archive.org/web/20130310114249/http://portal.esc20.net/portal/page/portal/es
c20public/bilesl/LPACFramework/Files/LPAC_Framework_Manual_Accessible_2011-
12_2.pdf
Lunda, G.T. (1998). Chicana/Chicano Land Tenure in the Agrarian Domain: On the Edge of a
"Naked Knife." Michigan Journal of Race and Law, 4(1).
https://repository.law.umich.edu/cgi/viewcontent.cgi?article=1230&context=mjrl
Macías, Francisco. (2014). Before Brown v. Board of Education There Was Méndez v.
Westminster. Library of Congress. Retrieved April 28, 2019 from
https://blogs.loc.gov/law/2014/05/before-brown-v-board-of-education-there-was-mendez-
v-westminster/

IMPACT OF LEGISLATION ON ARIZONA’S ENGLISH LEARNERS X
Massey, D.S., Rugh, J.S. & Pren, K.A. (2010). The Geography of Undocumented Mexican
Migration. Estudios mexicanos, 26(1), 129-152.
Milem, J. F., Salazar, K. G., & Bryan, W.P. (2016). Arizona Minority Student Progress Report,
6th Edition. Arizona Minority Education Policy Analysis Center. Retrieved February 10,
2019 from https://highered.az.gov/sites/default/files/16%20MSRP%20Report.pdf
Miller, M.L. & Chin, G.J. (2012). Online symposium: S.B.1070 rides off into the sunset. Scotus
Blog. Retrieved April 29, 2019 from https://www.scotusblog.com/2012/06/online-
symposium-s-b-1070-rides-off-into-the-sunset/
Mintz, S., & McNeil, S. (2018). Treaty of Guadalupe Hidalgo. Digital History. Retrieved March
23, 2019 from http://www.digitalhistory.uh.edu/disp_textbook.cfm?smtID=3&psid=1141
Moody’s. (2019). Moody's affirms National Conference of State Legislatures' (CO) A3; outlook
stable. Retrieved May 4, 2019 from https://www.moodys.com/research/Moodys-affirms-
National-Conference-of-State-Legislatures-CO-A3-outlook--PR_905742504
Moore, S.C.K., ed. (2014). Language Policy Processes and Consequences: Arizona Case Studies.
Bristol, UK: Multilingual Matters.
Morse, A. (2011). Arizona's Immigration Enforcement Laws. National Conference of State
Legislatures. Retrieved March 31, 2019 from
http://www.ncsl.org/research/immigration/analysis-of-arizonas-immigration-law.aspx
National Academies of Sciences, Engineering, and Medicine. 2015. The Integration of
Immigrants into American Society. Washington, DC: The National Academies Press.
https://doi.org/10.17226/21746

IMPACT OF LEGISLATION ON ARIZONA’S ENGLISH LEARNERS XI
National Academies of Sciences, Engineering, and Medicine. 2017. The Economic and Fiscal
Consequences of Immigration. Washington, DC: The National Academies Press.
https://doi.org/10.17226/23550
National Clearinghouse for English Language Acquisition & Language Instruction Educational
Programs. (2019). About. Retrieved April 28, 2019 from https://ncela.ed.gov/about
National Center for Education Statistics. (2015). Table 1. Public high school 4-year adjusted
cohort graduation rate (ACGR). U.S. Department of Education. Retrieved January 19,
2019 from https://nces.ed.gov/ccd/tables/ACGR_RE_and_characteristics_2013-14.asp
National Center for Education Statistics. (2016). Selected Statistics from the Public Elementary
and Secondary Education Universe: School Year 2014–15 (NCES 2016-076). U.S.
Department of Education. Retrieved February 10, 2019 from
https://www.leg.state.nv.us/Division/Research/Publications/EdDataBook/
National Center for Education Statistics. (2017). English language learner (EL) students enrolled
in public elementary and secondary schools, by state: Selected years, fall 2000 through
fall 2015. U.S. Department of Education. Retrieved January 16, 2019 from
https://nces.ed.gov/programs/digest/d17/tables/dt17_204.20.asp
National Center for Education Statistics. (2018). Characteristics of Children's Families. U.S.
Department of Education. Retrieved April 15, 2019 from
https://nces.ed.gov/programs/coe/indicator_cce.asp
National Center for Education Statistics. (2018). English Language Learners in Public Schools.
U.S. Department of Education. Retrieved April 21, 2019 from
https://nces.ed.gov/programs/coe/indicator_cgf.asp

IMPACT OF LEGISLATION ON ARIZONA’S ENGLISH LEARNERS XII
National Center for Education Statistics. (2018). Table 1. Public high school 4-year adjusted
cohort graduation rate (ACGR), by race/ethnicity and selected demographic
characteristics for the United States, the 50 states, and the District of Columbia: School
year 2016–17. U.S. Department of Education. Retrieved March 30, 2019 from
https://nces.ed.gov/ccd/tables/ACGR_RE_and_characteristics_2016-17.asp
Ojeda, C. (2018). The Two Income-Participation Gaps. American Journal of Political Science,
62: 4. https://onlinelibrary.wiley.com/doi/full/10.1111/ajps.12375
Orozco, Cynthia. (2016). Del Rio ISD v. Salvatierra. Texas State Historical Association.
Retrieved April 25, 2019 from https://tshaonline.org/handbook/online/articles/jrd02
Ovando, C.J. (2003). Bilingual Education in the United States: Historical Development and
Current Issues. Bilingual Research Journal, 27:1 Spring 2003.
Oyez. (2019). “Player v. Doe.” Retrieved March 23, 2019, from
https://www.oyez.org/cases/1981/80-1538
P–T
Pahre, Jennifer. (2017). Consent Decrees. Legal Issues in the News – University of Illinois.
Retrieved April 26, 2019 from
https://will.illinois.edu/legalissuesinthenews/program/consent-decrees
Patterson, T. (1906). Protest Against Union of Arizona with New Mexico. Center for Southwest
Research, University Libraries, University of New Mexico. Retrieved April 28, 2019
from https://nmdigital.unm.edu/digital/collection/Manuscripts/id/1439
Pioneer Press. (2015). Bio: Ron Unz, seeking to raise minimum wage. Retrieved March 24, 2019
from https://www.twincities.com/2014/01/11/bio-ron-unz-seeking-to-raise-minimum-
wage/

IMPACT OF LEGISLATION ON ARIZONA’S ENGLISH LEARNERS XIII
Proctor, K., Wilson-Frederick, S. M., & Haffer, S. C. (2018). The Limited English Proficient
Population: Describing Medicare, Medicaid, and Dual Beneficiaries. Health equity, 2(1),
82–89. doi:10.1089/heq.2017.0036
Ring, B. (2013). Ring's Reflections: How Arizona got its shape. Arizona Daily Star. Retrieved
March 24, 2019 from https://tucson.com/news/local/foothills/ring-s-reflections-how-
arizona-got-its-shape/article_4201cfbf-e95f-5691-93e4-42d3a56c76a7.html
Ruiz Soto, A.G., Hooker, S. & Batalova, J. (2015). Top Languages Spoken by English Language
Learners Nationally and by State. Migration Policy Institute. Retrieved January 13, 2019
from https://www.migrationpolicy.org/research/top-languages-spoken-english-language-
learners-nationally-and-state
Sawe, B.E. (2018). The 50 U.S. States Ranked by Population. World Atlas. Retrieved March 22,
2019 from https://www.worldatlas.com/articles/us-states-by-population.html
Schmid, C.L. (2001). The Politics of Language: Conflict, Identity, and Cultural Pluralism in
Comparative Perspective. Oxford University Press.
Singh, G.K. & Siahpush, M. (2016). Inequalities in U.S. Life Expectancy by Area
Unemployment Level, 1990–2010. Scientifica, 2016, Article ID 8290435, 2016.
https://doi.org/10.1155/2016/8290435
Smith, C. (2019). Arizona ELs, 1995–2017. Compiled from NCES data linked within
spreadsheet. Updated April 26, 2019 at
https://docs.google.com/spreadsheets/d/1mxWlo5HIdlJWWd-
ij_PQutSdq1RU1qzSiiVHlx2gPPI/edit#gid=1475283446
Smith, C. (2019). EL HS Graduation Rates 2013-2016. Compiled from NCES data linked within
spreadsheet. Updated March 22, 2019 at

IMPACT OF LEGISLATION ON ARIZONA’S ENGLISH LEARNERS XIV
https://docs.google.com/spreadsheets/d/1Qhfb3KAVrkGEEM2_iXSFqqjrBLv0Mai-
hfu6m9T6Szw/edit?usp=sharing
Smith, C. (2019). EL Student Population Changes, 2000–2015. Compiled from NCES data
linked within spreadsheet. Updated April 26, 2019 at
https://docs.google.com/spreadsheets/d/1WBzJ-
rZadDheBoHu1F4vjJWCP01Lh__SXT12yJKq2WE/edit?usp=sharing
Smith, C. (2019). EL Students by State, 2000–2015. Compiled from NCES data linked within
spreadsheet. Updated March 22, 2019 at
https://docs.google.com/spreadsheets/d/1aho_364wezfIWWyxdCsLCP6AFwtP7SUAR64
B9dAAYSc/edit?usp=sharing
Smith, C. (2019). Population Distribution by Race-Ethnicity 2017. Compiled from Kaiser
Family Foundation Data Sourced from the U.S. Census Bureau American Community
Survey, 2008-2017. Updated March 22, 2019 at
https://docs.google.com/spreadsheets/d/19B4QWRLH2t-
b_Ef5NZCKT5b13pw2JNJ08OmiiJZZ4uc/edit?usp=sharing
Smith, C. (2019). Predicting 2005 and 2010 EL% Based on 2000. Compiled from NCES data
linked within spreadsheet. Updated April 27, 2019 at
https://docs.google.com/spreadsheets/d/1wwcT2BbY0IrLdRJ_kAPxaMvPrLfGOfxtMq2
RI5XkzPI/edit?usp=sharing
Smith, C. (2019). Predicting a State's Proportion of ELs Based on Hispanic Population.
Compiled from NCES/USCB data linked within spreadsheet. Updated April 11, 2019 at
https://docs.google.com/spreadsheets/d/1S3IPMoSN4voE3PO0hB5hLsyGXcG2OirUCea
sHl_WeAs/edit?usp=sharing

IMPACT OF LEGISLATION ON ARIZONA’S ENGLISH LEARNERS XV
Smith, C. (2019). Share of Total Immigrant Population in Southwest, 1975–2014. Compiled
from NAS data linked within spreadsheet. Updated April 25, 2019 at
https://docs.google.com/spreadsheets/d/1F4LG8Tr2plUoN3NXxeZcViso0oog2bsTtwesIi
prjyY/edit?usp=sharing
Smith, C. (2019). Total ELs by State, 2016–2017. Compiled from U.S. Department of Education
data linked within spreadsheet. Updated April 27, 2019 at
https://docs.google.com/spreadsheets/d/1ClhE9DxHt_2lVe32af0aGGrangXG36fnBL1h9
NGcHzs/edit#gid=0
Smith, C. (2019). U.S. Southwest EL Population, 2000–2015. Compiled from NCES data linked
within spreadsheet. Updated April 20, 2019 at
https://docs.google.com/spreadsheets/d/1yyrgFg-
p7MuXTxg8W0KUkvwUGaZZTi_te5rs3B-e5QE/edit?usp=sharing
Smith, C. (2019). U.S. and Southwest High School Graduation Rates 2010-2016. Compiled from
NCES data linked within spreadsheet. Updated March 29, 2019 at
https://docs.google.com/spreadsheets/d/1NlDMLZ70KWRHVbiQ1sCPGpO7K-
PZVDkJm6IMFPdNkKI/edit?usp=sharing
Smith, C. (2019). U.S. Undocumented Immigrants, 2007 and 2016. Compiled from Pew data
linked within the spreadsheet. Updated April 23, 2019 at
https://docs.google.com/spreadsheets/d/1SlVLo5k3fmPnPlxcL-
7MBZJdsgXa2A4oVCrHF4mKWx0/edit?usp=sharing
StateScape. (n.d.). Bill Signing Deadlines. Retrieved April 26, 2019 from
http://statescape.com/resources/legislative/bill-signing-deadlines.aspx
IMPACT OF LEGISLATION ON ARIZONA’S ENGLISH LEARNERS XVI
Stephenson, H. (2018). Arizona lawmakers weighing major changes in how English-language
learners are educated. Arizona Daily Star. Retrieved March 31, 2019 from
https://tucson.com/arizona-lawmakers-weighing-major-changes-in-how-english-
language-learners/article_be6c4a6e-f8ce-5a24-8957-ef6762c2c595.html
Stephenson, H. (2018). Bill amending Arizona's English-language-learner model is revived.
Arizona Daily Star. Retrieved March 31, 2019 from https://tucson.com/news/local/bill-
amending-arizona-s-english-language-learner-model-is-revived/article_a8fe42dd-6b6f-
53d9-b9ed-cfa917e79a4d.html
Stepler, R. and Lopez, M.H. (2016). 4. Ranking the Latino population in the states. Pew.
Retrieved March 23, 2019 from http://www.pewhispanic.org/2016/09/08/4-ranking-the-
latino-population-in-the-states
Stewner-Manzanares, G. (1988). The Bilingual Education Act: Twenty Years Later. New Focus
National Clearinghouse for Bilingual Education.
https://ncela.ed.gov/files/rcd/BE021037/Fall88_6.pdf
Stratton, C. 2016. Education for Empire: American Schools, Race, and the Paths of Good
Citizenship. Oakland, CA: University of California Press.
Stull, G.C. (2012). Language, Borders, and Education: Language Policy and The Making of New
Mexico and Arizona. Working Papers in Educational Linguistics, 27 (10).
https://repository.upenn.edu/cgi/viewcontent.cgi?article=1232&context=wpel
Sugarman, Julie. (2016). Funding an Equitable Education for English Learners in the United
States. Migration Policy Institute. Retrieved April 28, 2019 from
https://www.migrationpolicy.org/sites/default/files/publications/US-Funding-FINAL.pdf

IMPACT OF LEGISLATION ON ARIZONA’S ENGLISH LEARNERS XVII
Téllez, M., Sanidad, C., & de la Fuente, N. (2011). VIVENCIAS: Reports from the Field.
Immigration and the state of labor: Building a movement in the valley of the sun. Latino
Studies, 9: 145–154. doi:10.1057/lst.2011.10
Texas Christian University. (2019). “What is the Texas Education Agency?” Texas Education
Agency Resources. Retrieved April 27, 2019 from https://coe.tcu.edu/about/texas-
education-agency-resources/
Thomas, M.H., Aletheiani, D.R., Carlson, D.L., & Ewbank, A.D. (2014). ‘Keeping Up the Good
Fight’: the said and unsaid in Flores v. Arizona. Policy Futures in Education, 12(2).
https://journals.sagepub.com/doi/pdf/10.2304/pfie.2014.12.2.242
U–Z
University of Arizona. (2017). Poverty Rate: How Are We Doing? Retrieved February 10, 2019
from https://mapazdashboard.arizona.edu/health-social-wEL-being/poverty-rate
U.S. Census Bureau. (2017). Annual Estimates of the Resident Population for the United States,
Regions, States, and Puerto Rico: April 1, 2010 to July 1, 2018. Retrieved January 19,
2019 from https://www2.census.gov/programs-surveys/popest/tables/2010-
2017/state/totals/nst-est2017-01.xlsx
U.S. Census Bureau. (2018). Annual Estimates of the Resident Population for the United States,
Regions, States, and Puerto Rico: April 1, 2010 to July 1, 2018. Retrieved April 11, 2019
from https://www2.census.gov/programs-surveys/popest/tables/2010-
2018/state/totals/nst-est2018-01.xlsx
U.S. Commission on Civil Rights. (1972). The Excluded Student. Educational Practices
Affecting Mexican Americans in the Southwest.
https://www2.law.umaryland.edu/marshall/usccr/documents/cr12m573rp3.pdf
IMPACT OF LEGISLATION ON ARIZONA’S ENGLISH LEARNERS XVIII
U.S. Commission on Civil Rights. (2018). About – Mission. Retrieved April 26, 2019 from
https://www.usccr.gov/about/index.php
U.S. Department of Education. (2017). SY 2015-2016 Consolidated State Performance Reports
Part I. Retrieved February 10, 2019 from
https://www2.ed.gov/admins/lead/account/consolidated/sy15-16part1/index.html#wv
Williams, J. (2011). Children Versus Texas: The Legacy of Plyler v. Doe. University of
California, Berkeley. Retrieved March 31, 2019 from
https://www.law.berkeley.edu/files/Children_v._Texas_Williams.pdf
Wolfram Alpha. (2019). Comparison of Arizona, Colorado, Nevada, New Mexico, and Utah –
Based on data from United States Census Bureau, State & County QuickFacts. Retrieved
March 22, 2019 from
https://www.wolframalpha.com/input/?i=compare+arizona,+colorado,+nevada,+new+Me
xico
Wright, W.E. and Daniel, C. (2006). The impact of language and high-stakes testing Policies on
elementary school English Language learners in Arizona. Education Policy Analysis
Archives, 14. DOI: 10.14507/epaa.v14n13.2006
Wright, W.E. (2010). Foundations for Teaching English Language Learners: Research, Theory,
Policy, and Practice. Excerpt from Chapter 3, "Language and Education Policy for
ELLs." (pp. 70-76). Caslon Publishing. http://www.colorincolorado.org/article/landmark-
court-rulings-regarding-english-language-learners
Zong, J. & Batalova, J. (2015). The Limited English Proficient Population in the United States.
Migration Policy Institute. Retrieved April 24, 2019 from

IMPACT OF LEGISLATION ON ARIZONA’S ENGLISH LEARNERS XIX
https://www.migrationpolicy.org/article/limited-english-proficient-population-united-
states#Age,%20Race,%20and%20Ethnicity


