Russia — A Market Overview
Country Overview

COUNTRY OVERVIEW
Largest Country by Area
– 17,098,242 sq km
– 1.8 times larger than U.S.
– Spans 9 time zones
Natural Resources and Land Use
– Vast natural resources including oil, natural gas, coal, strategic minerals, rare earth elements and timber
– 7.17% of land is arable (43,460 sq km of land is irrigated [as of 2008[)
Geography
COUNTRY OVERVIEW
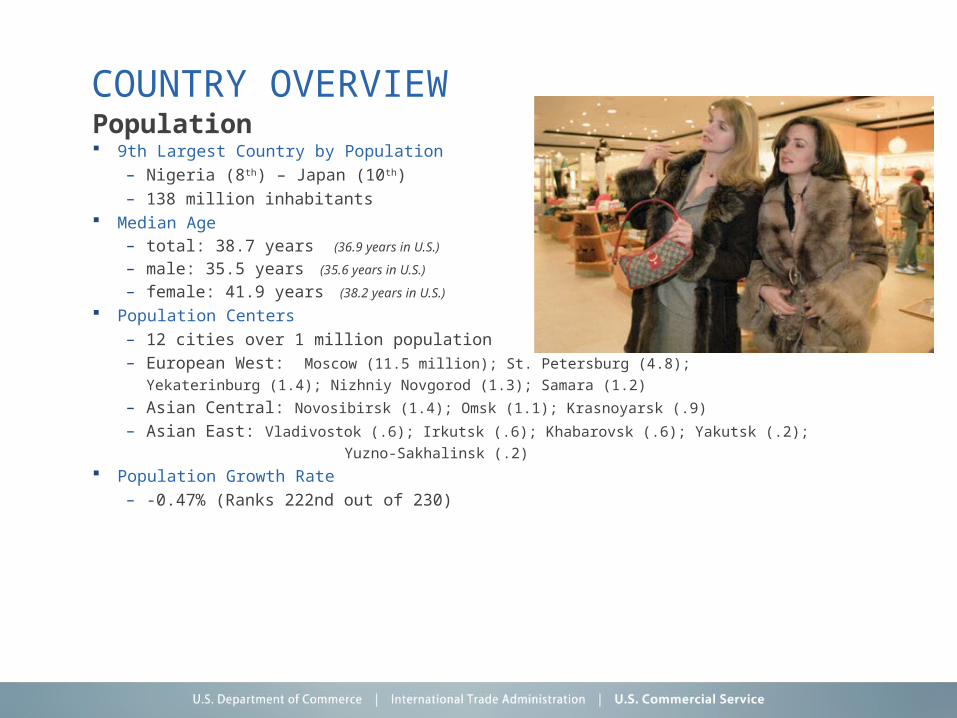
9th Largest Country by Population – Nigeria (8th) – Japan (10th) – 138 million inhabitants
Median Age– total: 38.7 years (36.9 years in U.S.)
– male: 35.5 years (35.6 years in U.S.)
– female: 41.9 years (38.2 years in U.S.)
Population Centers– 12 cities over 1 million population– European West: Moscow (11.5 million); St. Petersburg (4.8);
Yekaterinburg (1.4); Nizhniy Novgorod (1.3); Samara (1.2)
– Asian Central: Novosibirsk (1.4); Omsk (1.1); Krasnoyarsk (.9)
– Asian East: Vladivostok (.6); Irkutsk (.6); Khabarovsk (.6); Yakutsk (.2);
Yuzno-Sakhalinsk (.2)
Population Growth Rate– -0.47% (Ranks 222nd out of 230)
Population
COUNTRY OVERVIEW
7th Largest Economy– $2.223 trillion GDP– Germany (6th), UK (8th)
Projected Growth (Source: IMF)
– 4.3% - 2011– 4.1% - 2012
Unemployment Projections (Source: IMF)
– 7.3% - 2011– 7.1% - 2012
GDP Per Capita (Source: CIA World Fact Book)
– $15,900 (2010 est.)
– Highest of BRIC Countries (Brazil, $10,800 – China, $7,600 – India, $3,500)
Economy

COUNTRY OVERVIEW
Positive Trends– Per Capita Growth of 84% by 2015
– (Source: Business Monitor Int.)
– Affluent, urban population strong
base for consumer goods– World Trade Organization Membership
•Fully Membership by 2012•Lower Tariffs
– Average legally binding tariff ceiling» 7.8% after WTO» 10% currently (Source: WTO)
•Trade Policies Subject to Multinational Overview
Economy

COUNTRY OVERVIEW
World Bank 2010 Ease of Doing Business Index
– Rank 123 of 183 (116 in 2009)
– China (79), Brazil (127), India (134)
Transparency International 2010 Corruption Perceptions Index
– Russia 154 of 178
– Brazil (69), China (78), India (87)
Intellectual Property Protections
– Trade Mark and Domain Name Squatters
Governance/Concerns

Music Instrument Market Overview

HS Code “Chapter 92”
MUSIC INSTRUMENT MARKET OVERVIEWGeneral Trends
HS Code “Chapter 92”
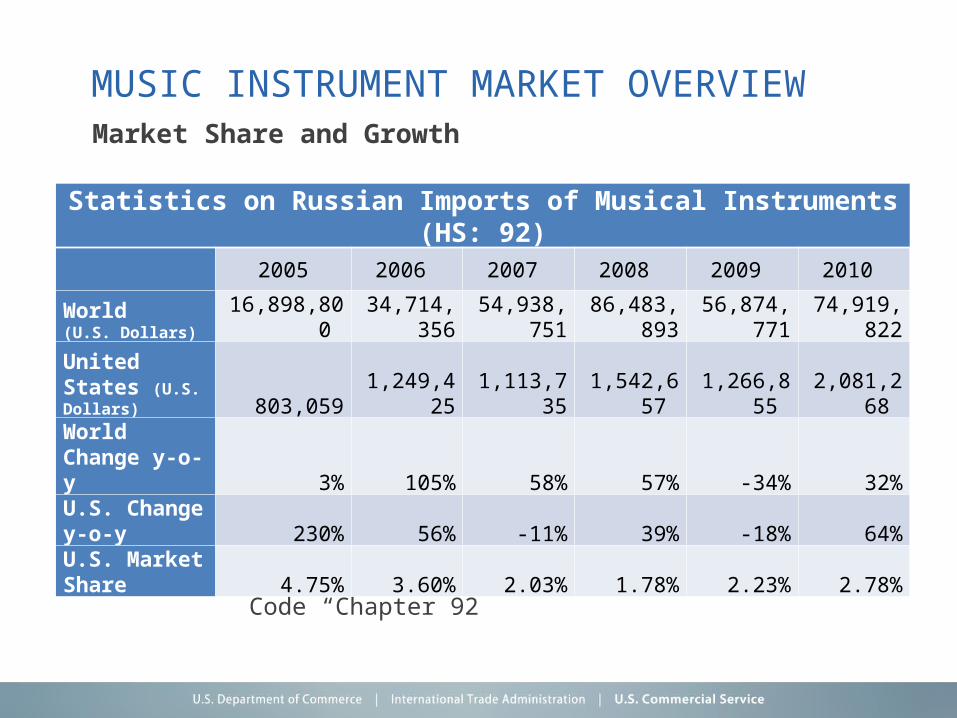
Statistics on Russian Imports of Musical Instruments (HS: 92)
2005 2006 2007 2008 2009 2010
World (U.S. Dollars) 16,898,800 34,714,356 54,938,751 86,483,893 56,874,771 74,919,822United States (U.S. Dollars) 803,059 1,249,425 1,113,735 1,542,657 1,266,855 2,081,268 World Change y-o-y 3% 105% 58% 57% -34% 32%U.S. Change y-o-y 230% 56% -11% 39% -18% 64%U.S. Market Share 4.75% 3.60% 2.03% 1.78% 2.23% 2.78%
MUSIC INSTRUMENT MARKET OVERVIEWMarket Share and Growth
HS Code “Chapter 92”
MUSIC INSTRUMENT MARKET OVERVIEWYear to Date August 2011
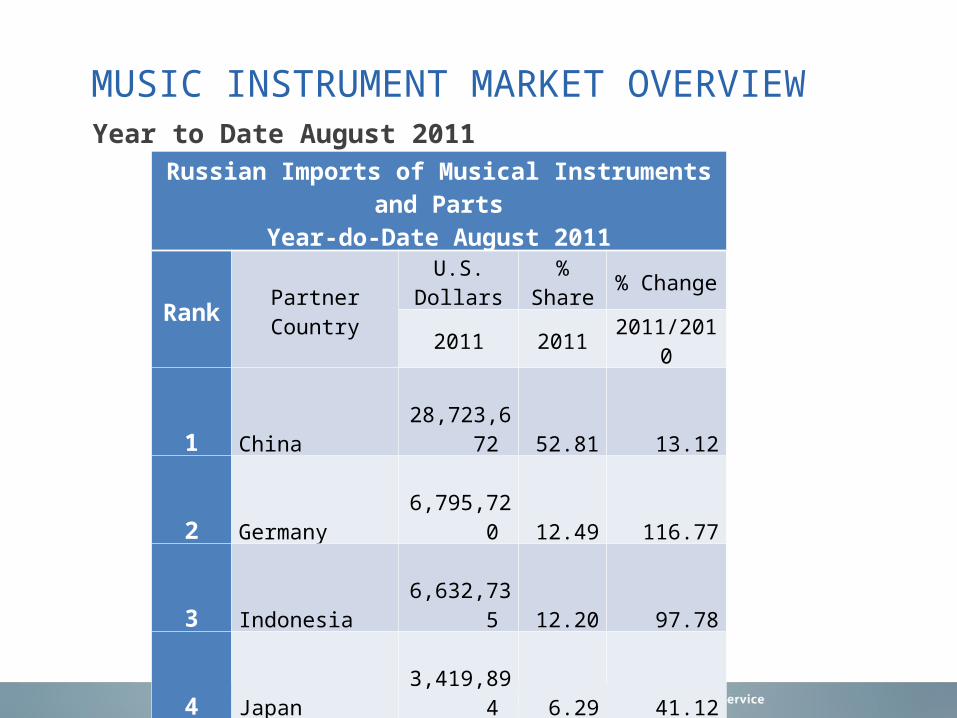
Russian Imports of Musical Instruments and PartsYear-do-Date August 2011
Rank Partner CountryU.S. Dollars % Share % Change
2011 2011 2011/2010
1 China 28,723,672 52.81 13.12
2 Germany 6,795,720 12.49 116.77
3 Indonesia 6,632,735 12.20 97.78
4 Japan 3,419,894 6.29 41.12
5 Czech Republic 1,825,124 3.36 69.76
6 Taiwan 1,668,711 3.07 57.17
7 United States 1,380,204 2.54 14.50
8 Italy 1,273,687 2.34 71.08
9 Austria 663,437 1.22 259.92
10 Korea South 283,440 0.52 - 37.34
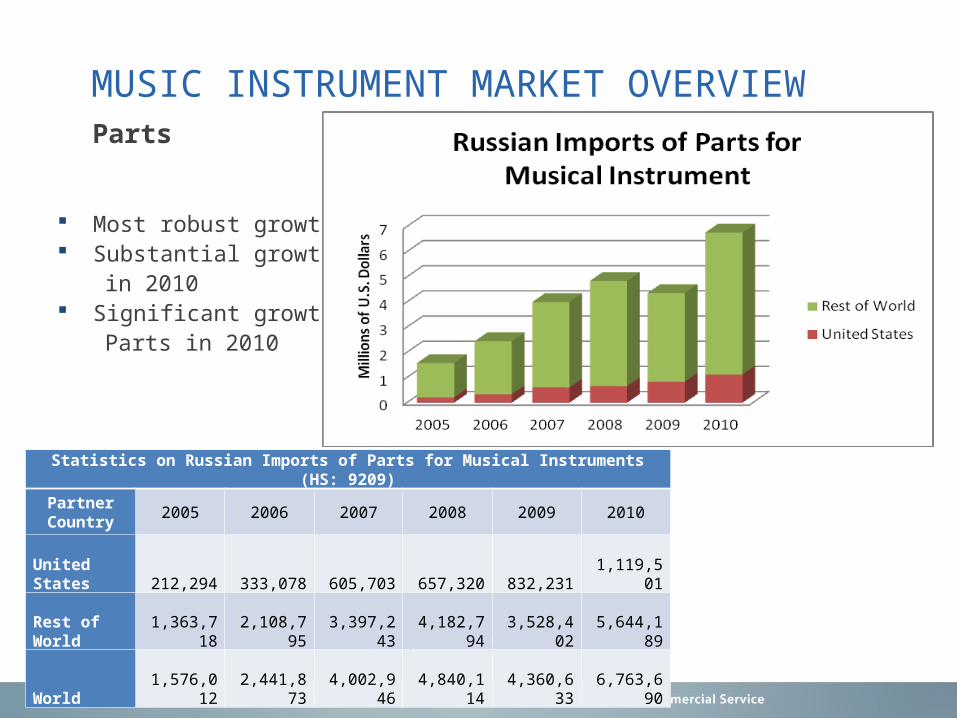
Most robust growth Substantial growth
in 2010 Significant growth in
Parts in 2010
HS Code “Chapter 92”
MUSIC INSTRUMENT MARKET OVERVIEWParts
Statistics on Russian Imports of Parts for Musical Instruments (HS: 9209)
Partner Country 2005 2006 2007 2008 2009 2010
United States 212,294 333,078 605,703 657,320 832,231 1,119,501
Rest of World 1,363,718 2,108,795 3,397,243 4,182,794 3,528,402 5,644,189
World 1,576,012 2,441,873 4,002,946 4,840,114 4,360,633 6,763,690
MUSIC INSTRUMENT MARKET OVERVIEW
Significant Growth
– Parts and Instruments
– Approaching and Possibly Surpassing Pre-Crisis Levels
– Quality Products Appreciated (Germany #2 importer) U.S. Growth Diversifying
– Higher Percentage of Exports for Instruments
– Fast Growth in Non-Parts in 2010 & y-t-d 2011
Summary
Tariffs and Certifications
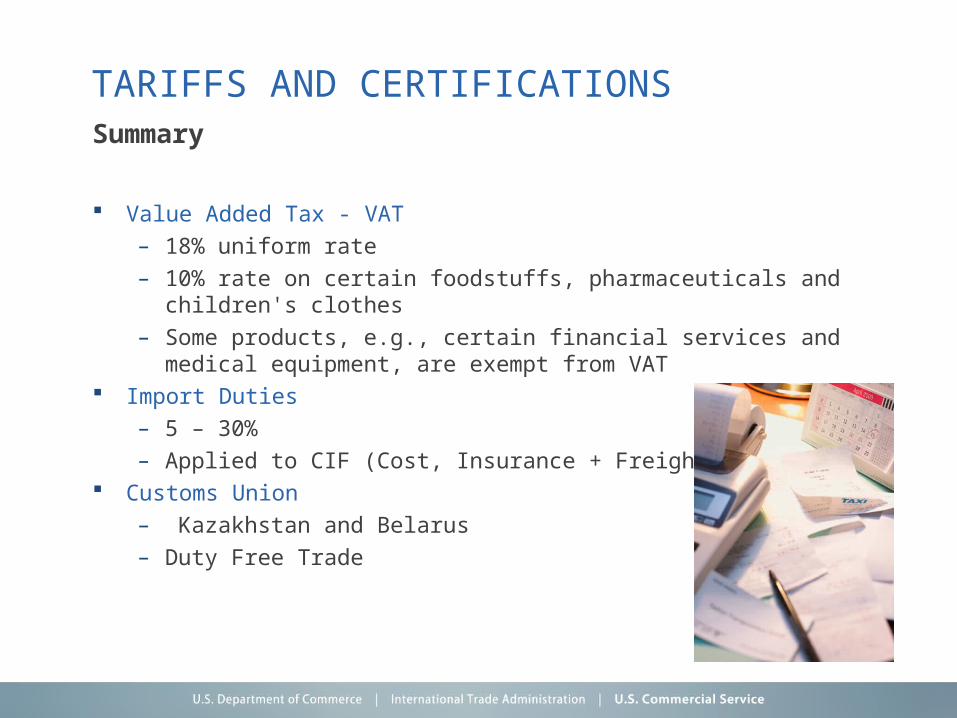
TARIFFS AND CERTIFICATIONS
Value Added Tax - VAT– 18% uniform rate– 10% rate on certain foodstuffs, pharmaceuticals and children's clothes– Some products, e.g., certain financial services and medical
equipment, are exempt from VAT Import Duties
– 5 – 30%– Applied to CIF (Cost, Insurance + Freight)
Customs Union– Kazakhstan and Belarus– Duty Free Trade
Summary

TARIFFS AND CERTIFICATIONS
Pianos – 15%
Stringed Instruments (guitars, violins) – 5%
Wind Instruments (trumpets, clarinets) – 5%
Percussion Instruments – 5%
Electric Instruments (guitars, synthesizers) – 15%
Parts for Musical Instruments - 5%
Select Import Duties

TARIFFS AND CERTIFICATIONS
Certificate of Conformity
– Applies to Electronic Instruments and Equipment
– GOST R (former name)
– Local Certification Companies
Certifications
Selling in the Russian Market

SELLING IN THE RUSSIAN MARKET
Four Basic Channels
– Agents
– Distributors
– Representative/Branch Office
– Foreign Subsidiaries
Distribution Channels

SELLING IN THE RUSSIAN MARKET
Territory
– Ensure Coverage of Russia’s Vast Territory
Customs
– Choose a Partner with Customs Experience
Logistics
– Many Underdeveloped Logistics Systems
Payment
– Uneven Access to Credit
Intellectual Property
– Take Responsibility
Distribution Challenges

SELLING IN THE RUSSIAN MARKET
Key distributors
– Mir Muziki (http://www.mirm.ru/)
– Muztorg (http://www.muztorg.ru/)
– Muzikalniy Arsenal (http://www.arsenalmusic.ru/)
– Asia Music Trade (http://www.asiamusic.ru/)
Major Distributors
Commercial Service Solutions
COMMERCIAL SERVICE SOLUTIONS
Counseling
– Goal to Increase U.S. Exports
– Provide Answers to Questions
– Find Local Resources Research
– Market Research Reports
– Country Commercial Guide
• www.Export.gov
• http://export.gov/mrktresearch/index.asp
– Customized Research
Counseling and Research

COMMERCIAL SERVICE SOLUTIONS
Gold Key Service– Appointments (typically four per day) with prescreened Russian firms – Background and contact information on potential partners– Customized market briefing with U.S. Commercial Service staff – Available market research on the relevant industry sector – Debriefing with U.S. Commercial staff to discuss results and plan follow-up
action Preliminary Market Assessment
– Conducted Prior to Gold Key– Determines Potential for your Product
Pricing Small/Medium Companies - $700 ($400 – preliminary) Large Company - $2,300 ($1,100)
Buyer Matchmaking

COMMERCIAL SERVICE SOLUTIONS
International Company Profile (ICP)
– Determines Suitability of Overseas Partners
– Factual Report Containing:
• Management details
• Business activities
• Product/service lines
• Financial condition
• Credit-worthiness
• Trading experience
• Market coverage
• Business connections in the target country Pricing
Small/Medium Companies - $600 Large Company - $900
Risk Assessment
COMMERCIAL SERVICE SOLUTIONS
Single Company Promotion (SCP)
– Product Demonstration or Reception
– Private Location
– Assistance With Invitation List
– Delivery of Invitations
– Follow-up
– Catering and Location Assistance
Pricing Based on Time and Actual Costs
Sales/Client Presentations
Contact us today.
Ken Walsh, Commercial Officer
+7-495-728-5369
Oksana Prokofieva, Commercial Specialist
+7-495-728-5405


