
S. Chand and Company Limited
Q4 – FY2018-19
Investor Update
May 28th, 2019
SUMMARY
• FY19 – CHALLENGING YEAR FOR THE INDUSTRY • FY19 REVENUES ADVERSELY IMPACTED BY EXPECTATION
OF NEW EDUCATION POLICY• OTHER QUATERLY HIGHLIGHTS• EARS TO THE GROUND – NEW EDUCATION POLICY• COST SAVINGS MESAURES FOR FY20• S CHAND 3.0 – FOCUS ON CASH FLOW IMPROVEMENT• CONSOLIDATED FINANCIALS• WORKING CAPITAL CYCLE - METRICS MARRED BY ONE
OFF YEAR • DIGITAL INITIATIVES – SYNERGIES TO THE CORE BUSINESS • SHAREHOLDING STRUCTURE• GOING AHEAD • ANNEXURE:
• China vs India – A Case Study in Education Sector• Indian Education Sector - Overview• S Chand – Group Profile
2
FY19 – CHALLENGING YEAR FOR THE INDUSTRY
3
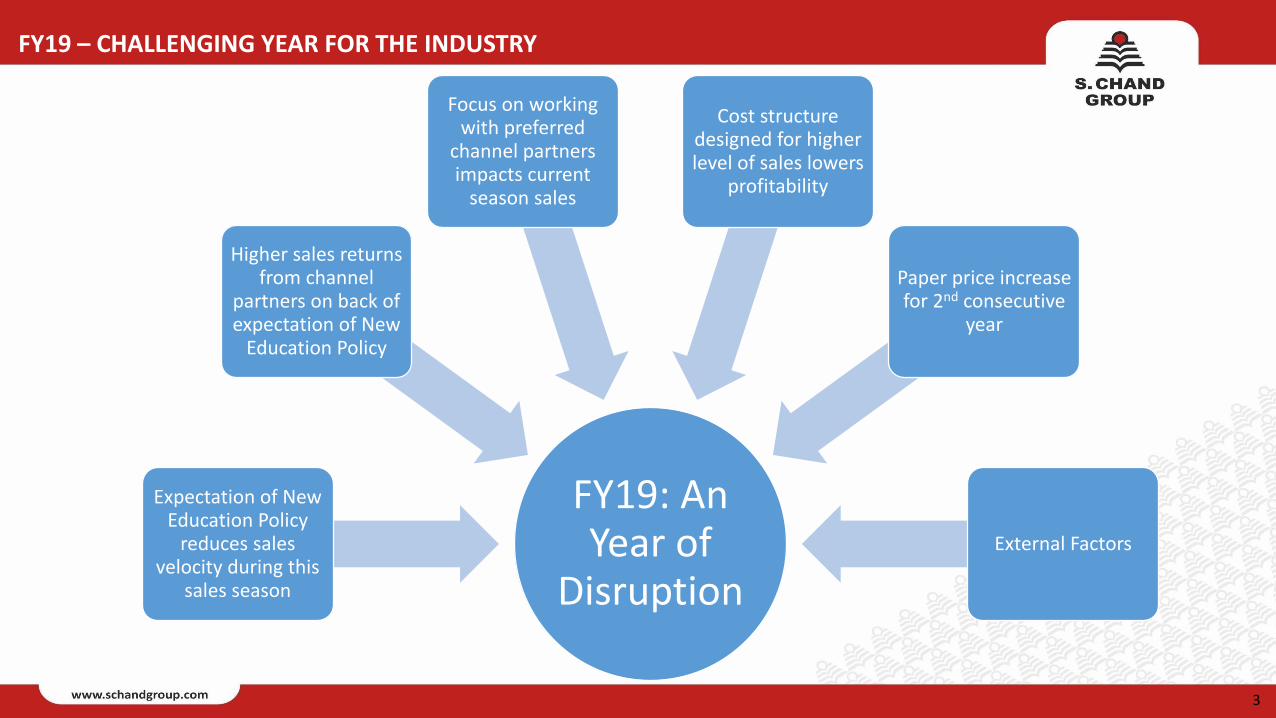
FY19: An Year of
Disruption
Expectation of New Education Policy
reduces sales velocity during this
sales season
Higher sales returns from channel
partners on back of expectation of New
Education Policy
Focus on working with preferred
channel partners impacts current
season sales
Cost structure designed for higher level of sales lowers
profitability
Paper price increase for 2nd consecutive
year
External Factors
FY19 – CHALLENGING YEAR FOR THE INDUSTRY
4
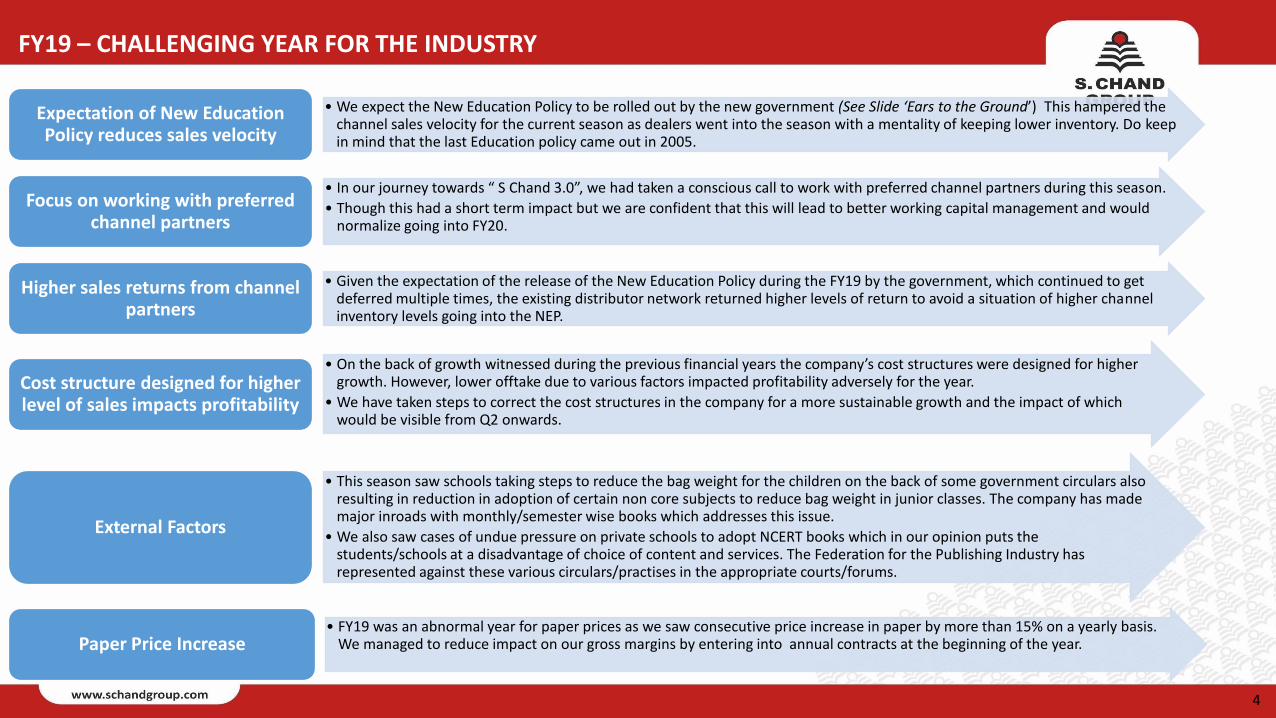
• We expect the New Education Policy to be rolled out by the new government (See Slide ‘Ears to the Ground’) This hampered the channel sales velocity for the current season as dealers went into the season with a mentality of keeping lower inventory. Do keep in mind that the last Education policy came out in 2005.
Expectation of New Education Policy reduces sales velocity
• In our journey towards “ S Chand 3.0”, we had taken a conscious call to work with preferred channel partners during this season.
• Though this had a short term impact but we are confident that this will lead to better working capital management and would normalize going into FY20.
Focus on working with preferred channel partners
• Given the expectation of the release of the New Education Policy during the FY19 by the government, which continued to get deferred multiple times, the existing distributor network returned higher levels of return to avoid a situation of higher channel inventory levels going into the NEP.
Higher sales returns from channel partners
• On the back of growth witnessed during the previous financial years the company’s cost structures were designed for higher growth. However, lower offtake due to various factors impacted profitability adversely for the year.
• We have taken steps to correct the cost structures in the company for a more sustainable growth and the impact of which would be visible from Q2 onwards.
Cost structure designed for higher level of sales impacts profitability
• This season saw schools taking steps to reduce the bag weight for the children on the back of some government circulars also resulting in reduction in adoption of certain non core subjects to reduce bag weight in junior classes. The company has made major inroads with monthly/semester wise books which addresses this issue.
• We also saw cases of undue pressure on private schools to adopt NCERT books which in our opinion puts the students/schools at a disadvantage of choice of content and services. The Federation for the Publishing Industry has represented against these various circulars/practises in the appropriate courts/forums.
External Factors
• FY19 was an abnormal year for paper prices as we saw consecutive price increase in paper by more than 15% on a yearly basis. We managed to reduce impact on our gross margins by entering into annual contracts at the beginning of the year.Paper Price Increase

FY19 REVENUES ADVERSELY IMPACTED BY EXPECTATION OF NEW EDUCATION POLICY
• In our view, FY19 reported Revenues of Rs522cr was adversely impacted by -:
• Higher Incremental provisioning of Rs. 74 cr.
• 28% higher level of sales return vs. FY18 by the channel partners on back of uncertainty around the New Education Policy.
• However, we want to highlight that our gross dispatches for K-12 academic season were down only ~11% vs. Reported Net
sales down by 31% during the quarter.
• Lower sales offtake in the distribution channel
• In anticipation of the New Education Policy, the channel partners lowered their sales offtake so as to control the level of
inventory with them.
• The government has been talking about the state of readiness of the New Education Policy in various media articles and public
forums which we expect to come out post elections (See ‘Ears to the Ground’ slide).
• Higher sales return from channel on back of expectation of New Education Policy
• Due to the expectation of the New Education Policy, our channel partners did higher that expected/usual sales returns during
this season.
• Conservative approach to sales this season from the company
• The company also took steps to work with better channel partners for achieving superior cash flows in the coming quarters
inspite of the lower sales being witnessed in this sales season.
5

OTHER QUARTERLY HIGHLIGHTS
• Continuing on the “S Chand 3.0” journey focused on increasing Free cash flow generation
• We had shared in 3Q that we had launched “S Chand 3.0” program which is aimed at generating higher free cash flows in
the coming years from the business.
• We started on this journey by targeting better trade terms with channel partners during the current sales season.
• We have focused on various operational and business cost control measures across the group which should lead to
significant savings and improve cash flow metrics during FY20. This is highlighted in the slide “Cost Saving Measures for
FY20”.
• Chhaya Prakashani acquisition completed
• We completed the process of acquiring final 26% stake and taking our stake to 100% during the quarter.
6

EARS TO THE GROUND – NEW EDUCATION POLICY
7
• Article - Modi govt will finally announce New Education Policy by 31 May after 4-year delay
• Link - https://theprint.in/india/education/modi-govt-will-finally-announce-new-education-policy-by-31-may-after-4-year-delay/240532/
• Article - NCERT set for mega review of 2005 curriculum guidelines
• Link - https://timesofindia.indiatimes.com/india/after-14-years-ncert-reviews-guidelines-on-curriculum/articleshow/69381082.cms
May, 2019
• Article - New National Education Policy Draft to Wait Till Lok Sabha Elections 2019 Results, Says Prakash Javadekar
• Link - https://www.latestly.com/india/education/new-national-education-policy-draft-to-wait-till-lok-sabha-elections-2019-results-says-prakash-javadekar-700164.html
March, 2019
• Article - Government will unveil draft education policy soon, says Javadekar
• Link - https://www.livemint.com/Politics/lpaHGhD1gLq9Jc8T6fLC9N/Government-will-unveil-draft-education-policy-soon-says-Jav.html
January, 2019
• Article - Draft National Education Policy ready: Javadekar
• Link - https://timesofindia.indiatimes.com/home/education/news/draft-national-education-policy-ready-javadekar/articleshow/67108512.cms
• Article - National Education Policy draft may be out in public domain soon
• Link - https://www.hindustantimes.com/india-news/national-education-policy-draft-may-be-out-in-public-domain-soon/story-m69vKg2PWYTTXygzDpXMKL.html
December, 2018
The New Education Policy would usher in a period of strong & sustainable growth for multiple years on back of the 2nd hand book market getting cleaned from the system.

COST SAVINGS MESAURES SHOULD TRANSLATE INTO ANNUALIZED COST SAVINGS OF Rs60CR TO Rs80CR
8
• The organization has been right sized by over 400 employees (Number of employees as of FY18: ~2200). Full benefits to flow infrom 2QFY20 onwards.
• The management has decided to not have any salary hikes for FY20.
• Introduction of performance based variable pay structure ranging from 7.5% to 15%.
Employee Costs
• Rationalized regional offices across states in the country. Over 10 offices right sized. Rents of major offices being renegotiated and this should reflect in lower rental costs for the company.
• Consolidation of warehouses across the country. Over 15 smaller warehouses merged with regional warehouses. This should also reduce inventory levels going ahead.
Numbers of Offices & Warehouse/Rentals
Rationalization
• Working to renegotiate all major contracts with suppliers towards lower costs. Some of the spends include telecom, office supplies, transportation etc.
• Increased usage of technology to reduce spends on internal meetings, travel and events.
• Events rationalized based on ROI
Evaluation of Internal Expenses and eliminating
dispensable spends
• Going into FY20, we are looking to improve contribution per MT of paper consumed.
• Realignment of grammage and size of paper depending upon titles/markets/subjects/end product pricing.
• Consolidation of warehouses and better freight/courier management through the use of Business analytics to optimize inventory routing and reduced delivery times.
Paper & Freight
• We have renegotiated certain Royalty agreements with our authors to ensure that Royalty costs are paid as per current market practises and dynamics.
Royalty
In spite of our rationalization on costs, we remain focused on our relationship management with teachers, schools and preferred distributor partners to ensure no negative impact on revenues & market share going ahead.

S CHAND 3.0 – FOCUS ON CASH FLOW IMPROVEMENT
9
• Right Sizing of our employee base by over 400 employees (FY18: 2200+)
• Rationalization of number of offices and consolidation of warehouses at over 25 locations
• Focus on manpower optimization through shared services across group companies.
• Renegotiations of all major operational cost items to bring costs lower.
Lowering operating costs
• Focusing on better terms with channel partners, improved velocity of collection, sale productivity metrics etc.
• Focus on higher margin products.
• Tightening of discounting structure.
Working with higher quality
channel partners
• Focus on portfolio of faster moving titles.
• Warehouse consolidation at 15 locations.
• Rationalizing number of SKU’s.
• Eliminating print of titles which do not meet sales threshold limits.
Lower Inventory levels
• Prioritizing our channel partners based on historic receivable efficiency.
• Strict escalation of delay in receivable collection from channel partners in the appropriate manner.
• Dealer loyalty program launched.
• Best-selling titles being sold against reduced credit / advance payment.
Faster Receivables
collection cycle
Boost to return ratios
Improved margin profile
Increased Free Cash
Flows
Improved operational efficiency

CONSOLIDATED FINANCIAL PERFORMANCE
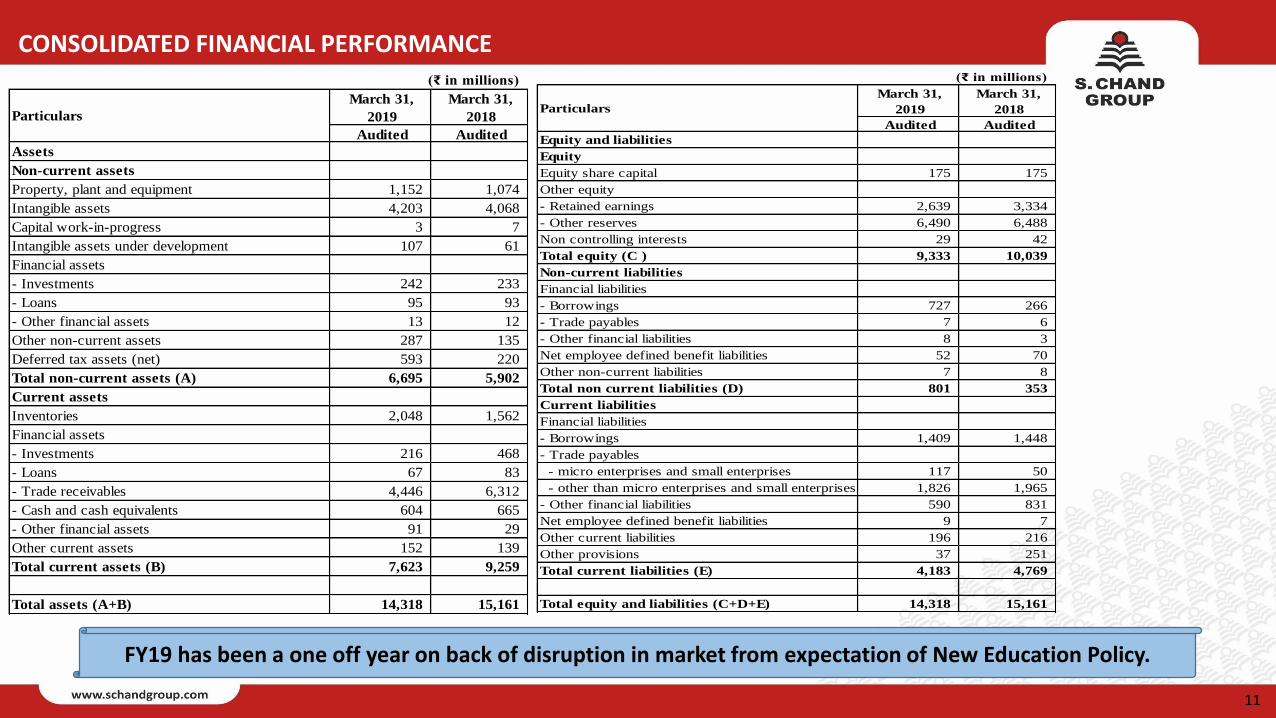
FY19 has been a one off year on back of disruption in market from expectation of New Education Policy.
10
(₹ in millions) Q4FY19 Q4FY18 Y-o-Y% FY19 FY18 Y-o-Y%
Revenue from operations 4,491 6,547 (31)% 5,220 7,944 (34)%
Other income 42 67 (37)% 116 126 (8)%
Total income 4,534 6,613 (31)% 5,336 8,071 (34)%
Cost of published goods/materials consumed 921 1,177 (22)% 2,094 2,346 (11)%
Publication expenses 56 62 (10)% 154 117 31%
Purchases of traded goods 567 767 (26)% (440) 99 (544)%
(Increase)/decrease in inventories of finished goods and WIP 227 391 (42)% 448 683 (34)%
Selling and distribution expenses 244 283 (14)% 884 737 20%
Employee benefits expenses 384 371 4% 1,511 1,386 9%
Other expenses 265 151 76% 881 649 36%
EBITDA 1,870 3,412 (45)% (195) 2,054 (110)%
EBITDA Margin (%) 41% 52% -4% 25%
Finance cost 90 60 49% 272 240 13%
Depreciation and amortization expense 60 52 17% 237 193 23%
Profit/(loss) before share of loss in associates, exceptional items and tax 1,719 3,300 (48)% (705) 1,622 (143)%
Share of profit/(loss) in associates 5 (2) (296)% (14) (12) 18%
Exceptional items (refer note 11) 51 - n.a (233) - n.a
Profit/(loss) before tax 1,775 3,297 (46)% (953) 1,609 (159)%
Tax 560 1,046 (46)% (283) 539 (153)%
Profit/(loss) for the year 1,215 2,251 (46)% (669) 1,071 (162)%
Earnings/(loss) per equity share (in ₹) (for discontinued and continuing
operations)
1) Basic 34.74 64.52 -46% (19.13) 31.14 -161%
2) Diluted 34.66 64.44 -46% (19.13) 31.06 -162%
CONSOLIDATED FINANCIAL PERFORMANCE
FY19 has been a one off year on back of disruption in market from expectation of New Education Policy.
11
(₹ in millions)
March 31,
2019
March 31,
2018
Audited Audited
Assets
Non-current assets
Property, plant and equipment 1,152 1,074
Intangible assets 4,203 4,068
Capital work-in-progress 3 7
Intangible assets under development 107 61
Financial assets
- Investments 242 233
- Loans 95 93
- Other financial assets 13 12
Other non-current assets 287 135
Deferred tax assets (net) 593 220
Total non-current assets (A) 6,695 5,902
Current assets
Inventories 2,048 1,562
Financial assets
- Investments 216 468
- Loans 67 83
- Trade receivables 4,446 6,312
- Cash and cash equivalents 604 665
- Other financial assets 91 29
Other current assets 152 139
Total current assets (B) 7,623 9,259
Total assets (A+B) 14,318 15,161
Particulars
(₹ in millions)
March 31,
2019
March 31,
2018
Audited Audited
Equity and liabilities
Equity
Equity share capital 175 175
Other equity
- Retained earnings 2,639 3,334
- Other reserves 6,490 6,488
Non controlling interests 29 42
Total equity (C ) 9,333 10,039
Non-current liabilities
Financial liabilities
- Borrowings 727 266
- Trade payables 7 6
- Other financial liabilities 8 3
Net employee defined benefit liabilities 52 70
Other non-current liabilities 7 8
Total non current liabilities (D) 801 353
Current liabilities
Financial liabilities
- Borrowings 1,409 1,448
- Trade payables
- micro enterprises and small enterprises 117 50
- other than micro enterprises and small enterprises 1,826 1,965
- Other financial liabilities 590 831
Net employee defined benefit liabilities 9 7
Other current liabilities 196 216
Other provisions 37 251
Total current liabilities (E) 4,183 4,769
Total equity and liabilities (C+D+E) 14,318 15,161
Particulars

CONSOLIDATED FINANCIAL PERFORMANCE
12
• Our strategy of focusing on the cash flows has started yielding results with the Net cash generated from operations of
Rs38cr in FY19 (vs. Rs39cr in FY18). This is in spite of the 34% drop in the net revenues for the year.
• Debt metrics include-:
• Gross Debt: Rs248cr
• Cash & Equivalents: Rs82cr
• Net Debt: Rs166cr
• We are at a comfortable Debt to Equity ratio of 0.3x and we expect debt levels to reduce going ahead on back of higher
free cash flow generation from business.

• Debtors reduced from Rs6,312m as of Q4FY18 to Rs4,446m as of Q4FY19 (vs. Rs5,016m in Q1FY19 & Rs3,866m in Q2FY19 & Rs3,085m in 3QFY19)
• Inventory increased to Rs2,048m as of 4QFY19 (vs. Rs1,562m in Q4FY18) on back of higher sales returns from channel partners.
• We expect improved terms of trade with channel partners during this sales season and focus on inventory rationalization to reduce working capital
exposure in the coming quarters.
WORKING CAPITAL CYCLE – METRICS MARRED BY ONE OFF YEAR
FY19 working capital metrics are one off in nature on back of the disruption in the market from expectations of the New Education Policy.
198
148 127
260
204
151 144
290
228
182
160
311
229
197 217
250
237
207 186
253
235
202
224
317
100
150
200
250
300
350
Q1FY17 Q2FY17 Q3FY17 Q4FY17 Q1FY18 Q2FY18 Q3FY18 Q4FY18 Q1FY19 Q2FY19 Q3FY19 Q4FY19
Receivable Days and Net Working Capital Days (Consolidated)
Recievable Days Net Working Capital Days
13
DIGITAL INITIATIVES – SYNERGIES TO THE CORE BUSINESS
14
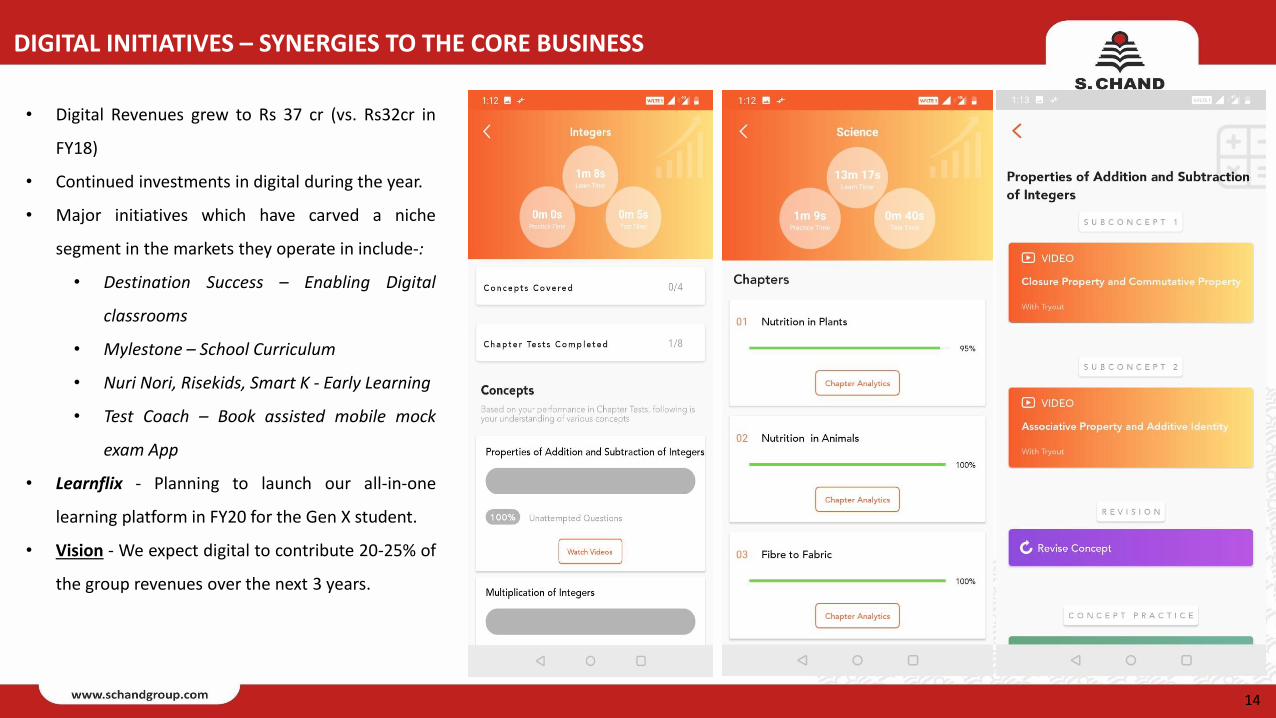
• Digital Revenues grew to Rs 37 cr (vs. Rs32cr in
FY18)
• Continued investments in digital during the year.
• Major initiatives which have carved a niche
segment in the markets they operate in include-:
• Destination Success – Enabling Digital
classrooms
• Mylestone – School Curriculum
• Nuri Nori, Risekids, Smart K - Early Learning
• Test Coach – Book assisted mobile mock
exam App
• Learnflix - Planning to launch our all-in-one
learning platform in FY20 for the Gen X student.
• Vision - We expect digital to contribute 20-25% of
the group revenues over the next 3 years.
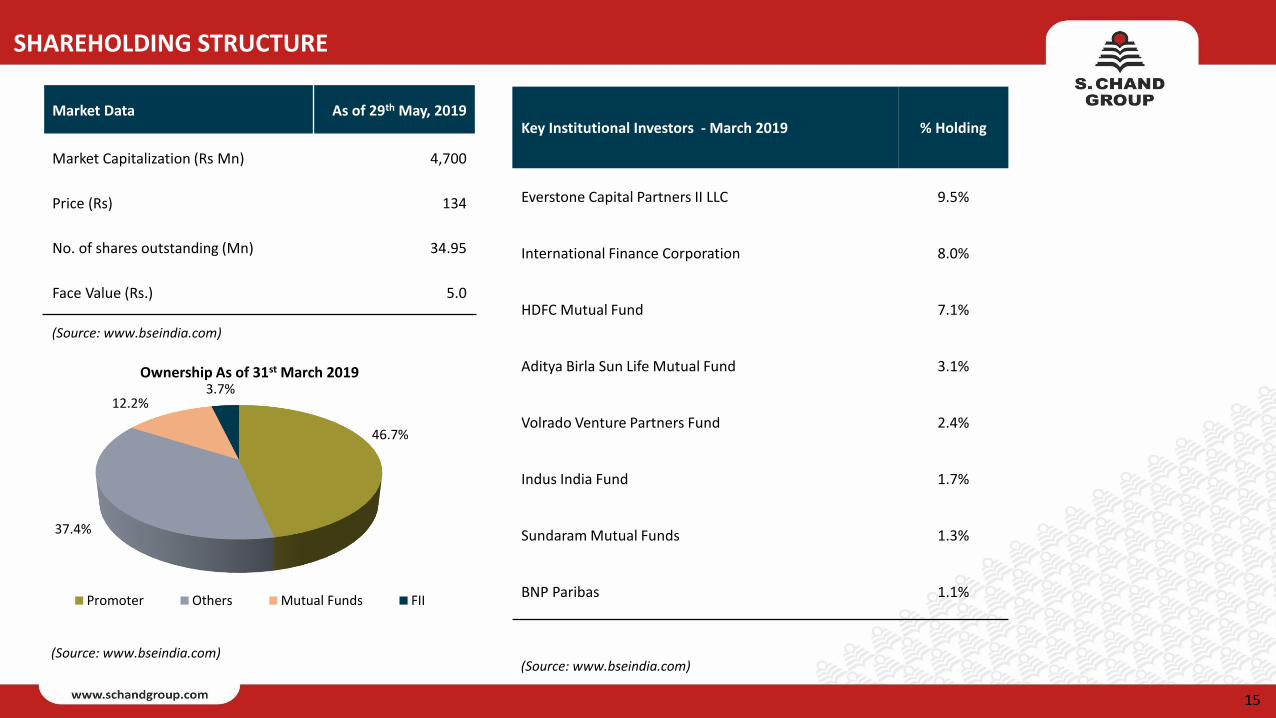
Key Institutional Investors - March 2019 % Holding
Everstone Capital Partners II LLC 9.5%
International Finance Corporation 8.0%
HDFC Mutual Fund 7.1%
Aditya Birla Sun Life Mutual Fund 3.1%
Volrado Venture Partners Fund 2.4%
Indus India Fund 1.7%
Sundaram Mutual Funds 1.3%
BNP Paribas 1.1%
Market Data As of 29th May, 2019
Market Capitalization (Rs Mn) 4,700
Price (Rs) 134
No. of shares outstanding (Mn) 34.95
Face Value (Rs.) 5.0
46.7%
37.4%
12.2%3.7%
Ownership As of 31st March 2019
Promoter Others Mutual Funds FII
(Source: www.bseindia.com)
(Source: www.bseindia.com)(Source: www.bseindia.com)
SHAREHOLDING STRUCTURE
15

GOING AHEAD
• FY20
• Target EBITDA/FCF generation ratio of 50%.
• Higher EBITDA margin levels on back of cost savings driven from “S Chand 3.0” implementation.
• Target at least 35%-40% lower Sales returns vs. FY19 on back of controlled sales to channel.
• Better terms of trade with channel partners and inventory rationalization to reduce working capital metrics.
• We see ourselves well positioned to benefit from the New Education Policy which should be announced during
FY20 leading to a period of strong & sustainable growth for the company in a medium time period. Given the
uncertainty around the actual timing of the announcement, it would not be prudent to give a revenue guidance for
FY20 at this point of time. We have our ears to the ground and are ready for further developments on this front.
• We would like to highlight that when the education policy is announced, it translates into strong revenue growth for
multiple years as the 2nd hand book market gets expunged due to the new syllabus.
• Medium term – 3 years
• Debt free in 3 years from the increased focus on free cash flows.
• Increasing the share of Digital & Services segment to 20- 25% over the next 3 years
16

Annexure:
- China vs India – A Case Study in Education Sector
- Indian Education Sector -Overview
- S Chand Group
17

CHINA - A CASE STUDY IN GROWTH - INDIA EXPECTED TO FOLLOW SUIT
• GDP per capita US$ 2,100.• Private education market < US$ 50 Billion*.
CHINA 2006
CHINA 2017
INDIA 2017
• GDP per capital US$ 8,836• K-12 market doubled in last 5 years.• Private education market at US$ 260 Billion, expected to touch US$
330 Billion by 2020.• Largest global educational companies in book publishing, digital and
vocational learning. (TAL - $ 21B, New Oriental - $ 15B, China South Publishing – $ 4 B).
* Industry estimates. ** Per market estimates of GDP being US$ 5 trillion by 2025.
• GDP per capita US$ 1,940• K-12 market growing at ~ 20%.• Private education market ~ US$ 30 Billion*.• Education market expected to double to US$
180 Billion by 2020.
INDIA 2025
• GDP per capita expected ~ US$ 3,600**.• Over 50% students expected to enroll in
private schools.• Emergence of private education market led
by K-12 segment.• Billion dollar enterprises in education
industry.
230 MN Student Population 315 MN
18
(Source: Technopak Research Report. Technopak Outlook on India’s Schooling Segment June 2017. Nielsen: India Book Market Report 2015)
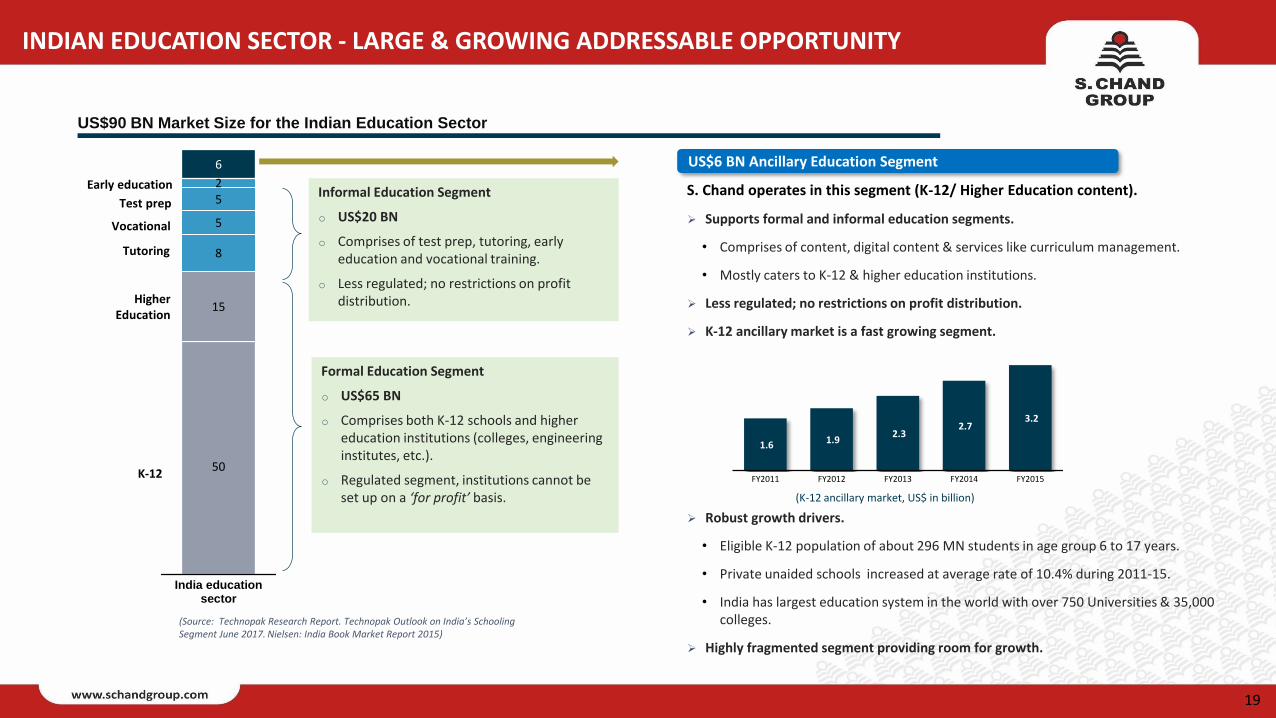
US$90 BN Market Size for the Indian Education Sector
50
15
8
5
52
6
India educationsector
Formal Education Segment
o US$65 BN
o Comprises both K-12 schools and higher education institutions (colleges, engineering institutes, etc.).
o Regulated segment, institutions cannot be set up on a ‘for profit’ basis.
Informal Education Segment
o US$20 BN
o Comprises of test prep, tutoring, early education and vocational training.
o Less regulated; no restrictions on profit distribution.
1.6 1.9 2.3
2.7 3.2
FY2011 FY2012 FY2013 FY2014 FY2015
(K-12 ancillary market, US$ in billion)
K-12
Higher Education
Test prep
Vocational
Tutoring
Early education S. Chand operates in this segment (K-12/ Higher Education content).
➢ Supports formal and informal education segments.
• Comprises of content, digital content & services like curriculum management.
• Mostly caters to K-12 & higher education institutions.
➢ Less regulated; no restrictions on profit distribution.
➢ K-12 ancillary market is a fast growing segment.
➢ Robust growth drivers.
• Eligible K-12 population of about 296 MN students in age group 6 to 17 years.
• Private unaided schools increased at average rate of 10.4% during 2011-15.
• India has largest education system in the world with over 750 Universities & 35,000 colleges.
➢ Highly fragmented segment providing room for growth.
US$6 BN Ancillary Education Segment
INDIAN EDUCATION SECTOR - LARGE & GROWING ADDRESSABLE OPPORTUNITY
19

113 127 133 121 111
348
188
66
9% 11% 11% 10% 9%
29%
16%
6%
-30%
-20%
-10%
0%
10%
20%
30%
40%
0
50
100
150
200
250
300
350
400
450
500
0 to 4 5 to 9 10 to 14 15 to 19 20 to 24 25 to 44 45 to 64 above 65
No. of people (mn) Percentage of total people
Age-wise population distribution in India : S. Chand target market
Potential Market of 492 MN = 41% of total population
• Gross enrolment ratio and students completing primary &secondary education gradually improving in India.
• Falling dropout rates and increased girls participation led toimprovement in literacy rate.
• Government promoting education through various schemes withbudgetary support.
Literacy rate improving with higher participation from students
S. Chand well positioned to benefit from sector tailwinds
5.6%
4.7%4.3%
0.00%
1.00%
2.00%
3.00%
4.00%
5.00%
6.00%
7.00%
8.00%
9.00%
10.00%
2012 2013 2014
Decrease in drop-out rates for primary education in India
(Source: IBEF Report)
(Source: Nielsen Report)
Estimated Population
Level of Education % 2017 (MN) % 2022 (MN)
Illiterate 20% 269 18% 250
Literate but no formal schooling 2% 27 1% 14
School - Up to 5th standard 35% 471 36% 501
School - Up to 10th standard 18% 242 18% 250
School - Up to 12th standard 11% 148 11% 153
Some college but not graduate 5% 67 5% 70
Graduate 6% 81 7% 97
Postgraduate 3% 40 4% 56
Literate 80% 1076 82% 1141
Total 100% 1345 100% 1391
(Source: Technopak’s Outlook on India Schooling Segment)
INDIAN EDUCATION SECTOR: INFLECTION POINT, STRONG POTENTIAL
20

Private schools market share increasing every year
80.0% 78.8% 78.5% 77.9% 77.0%
20.0% 21.2% 21.5% 22.1% 23.0%
0%
20%
40%
60%
80%
100%
120%
FY11 FY12 FY13 FY14 FY15Government schools Private Schools
• Student share of private schools increasing consistently despite subsidisedfees and free meals/ books in government schools.
• Government schools losing favour even amongst the rural and not soaffluent population.
• CBSE and ICSE schools are preferred for their superior curriculum and betterpedagogy.
• S. Chand is a key beneficiary of increasing number of CBSE and ICSE schools,being the leading content provider to such schools amongst the privatepublishers.
CBSE & ICSE increasing faster amongst affiliated board schools
Board 2010-11 2011-12 2012-13 2013-14 2014-15 2015-16 2016-17 CAGR
CBSE 11,349 12,337 13,898 14,778 15,933 17,474 19,446 9.4%
ICSE 1,461 1,565 1,678 1,798 1,927 2,181 2,295 7.8%
State
Boards13,16,401 13,63,862 14,47,487 14,65,871 14,60,455 NA NA NA
Total 13,29,211 13,77,764 14,63,063 14,63,447 14,78,315 NA NA NA
(Source : Nielsen Research Report, School Board reports, DISE)
Preference towards private schools continue to rise
Indian K-12 education infrastructure
Number of Schools: 1.5 MN
Government: 1.1 MN Private: 0.4 MN
Number of Students: 260 MN
Government: 150 MN Private: 110 MN
No. of Teachers: 9 MN
Government: 5 MN Private: 4 MN
Annual Intake: 18 MN
Government: 10 MN Private: 8 MN
Additional Capacity Required: 36 MN
Additional Requirement of Teachers: 2 MN
Additional Resources: USD 55 BN
(Source: Technopak’s Outlook on India’s Schooling Segment)(Source: IBEF Report)
PREFERENCE TOWARDS PRIVATE, CENTRAL CURRICULUM SCHOOLS
21

PREFERENCE TOWARDS PRIVATE, CENTRAL CURRICULUM SCHOOLS
Intl Schools
CBSE + ICSE Schools
Unaffiliated Private English Medium Schools
Private Unaided and Large Govt. State Board Schools in
Tier 1 and 2 cities
Govt. Aided State Board Schools with Low Student Population
25-300 Schools
20,000 schools
55,000 -60,000 schools
220,000 -240,000 schools
32,00,000 schools
Total Schools in India ~ 15,00,000 schools
• Currently covering 38,000 schools in the target market
• Target market growing at 8-10% annually in the no. ofschools
• Total student strength in India is est. 260 million
• Students strength in the target market is est. 120million and growing at 7-8 annually.
Target Market is 3,00,000 schools – growing at 8-10 % annually and student strength growing at 7-8%
22
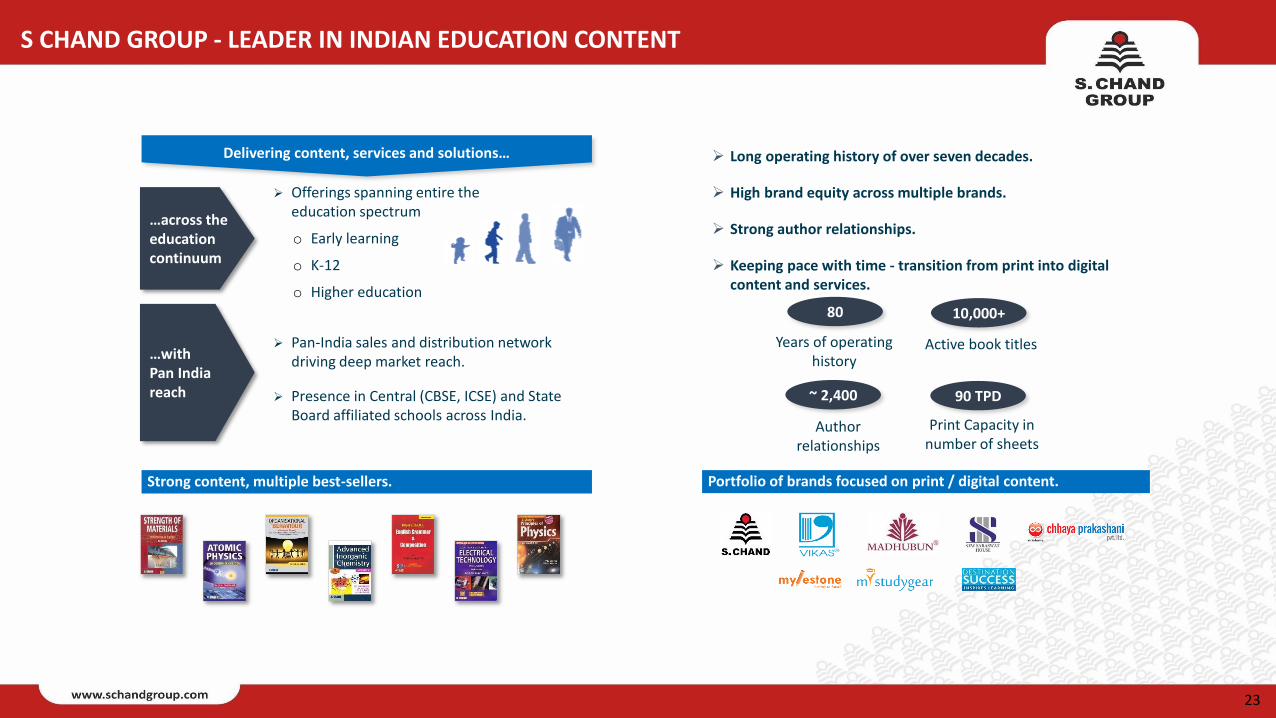
Strong content, multiple best-sellers.
➢ Offerings spanning entire the education spectrum
o Early learning
o K-12
o Higher education
➢ Pan-India sales and distribution network driving deep market reach.
➢ Presence in Central (CBSE, ICSE) and State Board affiliated schools across India.
Delivering content, services and solutions…
…across the education continuum
…with Pan India reach
Portfolio of brands focused on print / digital content.
➢ Long operating history of over seven decades.
➢ High brand equity across multiple brands.
➢ Strong author relationships.
➢ Keeping pace with time - transition from print into digital content and services.
80
Years of operating history
Active book titles
Author relationships
~ 2,400
10,000+
90 TPD
Print Capacity in number of sheets
S CHAND GROUP - LEADER IN INDIAN EDUCATION CONTENT
23

Q1 April - June Q2 July - September Q3 October - December Q4 January - March
o Last leg of K-12 sales for new academic session and delivery of books to distributors/ schools.
o New academic session commences in April for CBSE/ ISCE schools.
o Annual paper contracts negotiated.
o Finalisation of title catalogue for next academic year (new and revised titles).
o Sales performance review. (regional/ branches)
o Content revision/ development by editorial team in collaboration with authors.
o Engagement with schools & teachers. (training sessions, workshops, etc.).
o Sample distribution. (September)
o Return of unsold stock from distributors as per contractual agreement.
o Semester 1 (Higher Education) and Test preparation sales based on government vacancy examinations.
o Sample distribution and evaluation by schools.
o Printing of back list and best seller titles.
o Final reconciliation and closure of distributor accounts before commencement of season sales.
o Order visibility from schools starts building up.
o Significant sales quarter for HE segment.
o K-12 season sales and delivery to distributors/ schools. (Peak Season)
o Semester 2 (Higher Education) and Test preparation sales based on government vacancy examinations.
o Printing of front list titles.
o Additional printing runs for back list / best seller titles based on demand.
80% to 85% of annual revenues;
Peak Receivables
Less than 5% of annual revenues;
Peak Inventory
Less than 10% of annual revenues;
Negative WC
Less than 5% of annual revenues;
Negative WC
S CHAND GROUP - SEASONAL NATURE OF OUR BUSINESS
24
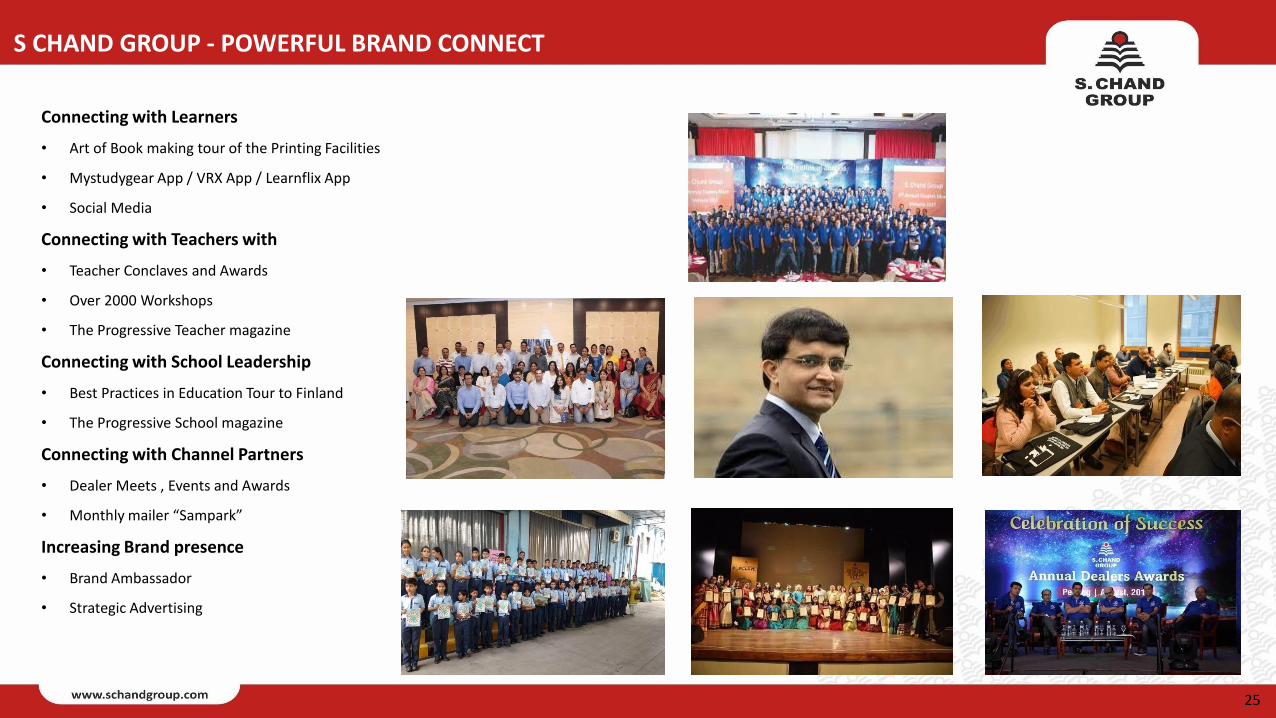
Connecting with Learners
• Art of Book making tour of the Printing Facilities
• Mystudygear App / VRX App / Learnflix App
• Social Media
Connecting with Teachers with
• Teacher Conclaves and Awards
• Over 2000 Workshops
• The Progressive Teacher magazine
Connecting with School Leadership
• Best Practices in Education Tour to Finland
• The Progressive School magazine
Connecting with Channel Partners
• Dealer Meets , Events and Awards
• Monthly mailer “Sampark”
Increasing Brand presence
• Brand Ambassador
• Strategic Advertising
S CHAND GROUP - POWERFUL BRAND CONNECT
25

In-House (Revenue Stream)
• Offerings include digital classroom learning solutions,
learning management systems and curriculum
management which contribute to the revenue streams in
the business.
• Approximated Investments is Rs1300 million.
S CHAND GROUP - DIGITAL INITIATIVES – SYNERGIES TO THE CORE BUSINESS
Digital Investments (Inorganic)
• Focused on investing in early stage digital companies.
• Total investments in digital investee companies is approx.Rs.300m.
• Currently, Investment portfolio commands a valuation ofaround 2X as per the latest funding rounds for respectivecompanies.
• Focus is on establishing synergies with core businessalong with investment returns.
26
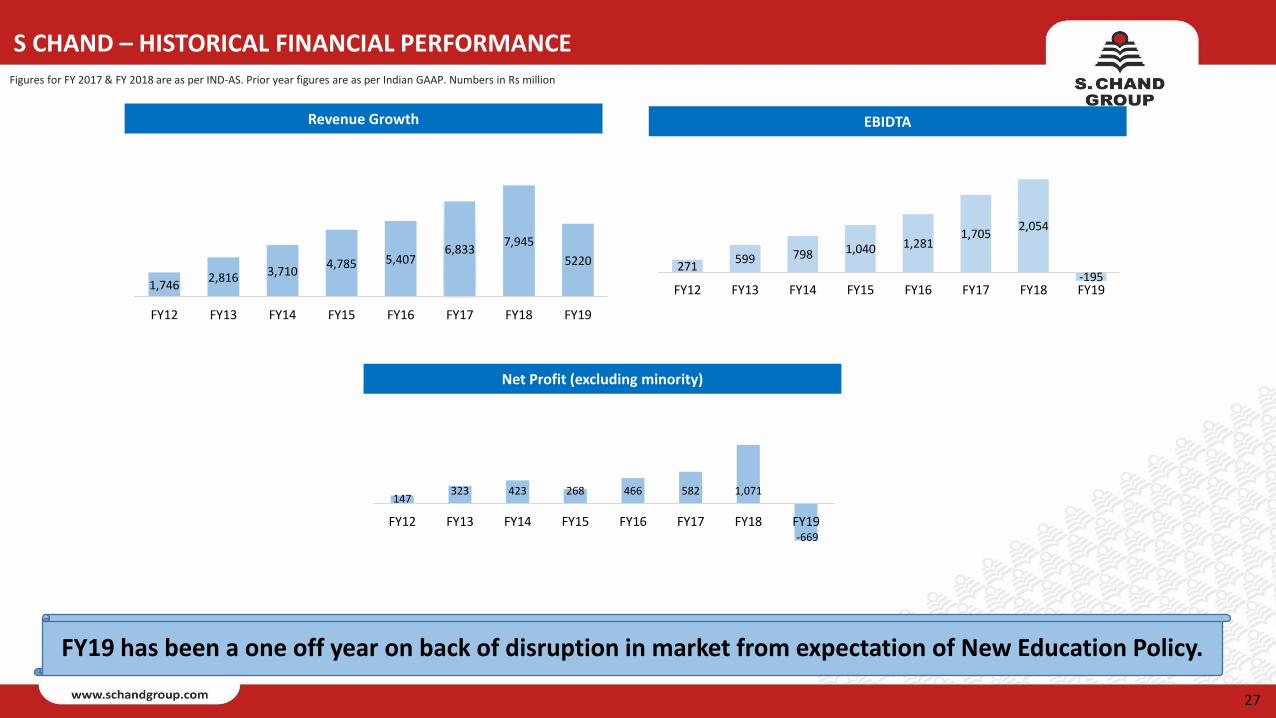
Revenue Growth
1,7462,816 3,710
4,785 5,4076,833
7,945
5220
FY12 FY13 FY14 FY15 FY16 FY17 FY18 FY19
EBIDTA
271599 798 1,040 1,281
1,7052,054
-195FY12 FY13 FY14 FY15 FY16 FY17 FY18 FY19
Net Profit (excluding minority)
147323 423 268 466 582 1,071
-669
FY12 FY13 FY14 FY15 FY16 FY17 FY18 FY19
Figures for FY 2017 & FY 2018 are as per IND-AS. Prior year figures are as per Indian GAAP. Numbers in Rs million
S CHAND – HISTORICAL FINANCIAL PERFORMANCE
27
FY19 has been a one off year on back of disruption in market from expectation of New Education Policy.

Disclaimer
This presentation and the following discussion may contain “forward looking statements”by S. Chand & Company Limited (“S. Chand” or the Company) that are not historical innature. These forward looking statements, which may include statements relating to futureresults of operations, financial condition, business prospects, plans and objectives, arebased on the current beliefs, assumptions, expectations, estimates, and projections of themanagement of S. Chand about the business, industry and markets in which S. Chandoperates.
These statements are not guarantees of future performance, and are subject to known andunknown risks, uncertainties, and other factors, some of which are beyond S. Chand’scontrol and difficult to predict, that could cause actual results, performance orachievements to differ materially from those in the forward looking statements. Suchstatements are not, and should not be construed, as a representation as to futureperformance or achievements of S. Chand.
In particular, such statements should not be regarded as a projection of future performanceof S. Chand. It should be noted that the actual performance or achievements of S. Chand may vary significantly from such statements.
Saurabh MittalChief Finance OfficerContact No : +91 11 4973 1800Email : [email protected]
Atul SoniHead – Investor RelationsContact No : +91 11 4973 1800Email : [email protected]
CIN: L22219DL1970PLC005400Registered Office: Ravindra Mansion, Ram Nagar, New Delhi-110055, India.
28

PRESS RELEASE
• FY19 was a challenging year for the whole industry on the back of the expectation of
announcement of the New Education Policy (NEP) which has been awaited for the last 4
years.
• Despite the sluggish offtake during the season, the company continued its earlier stated
strategy of sales to the preferred channel partners for achieving longer term goals of
improved working capital and FCF generation even while taking a short-term impact on sales
growth for the current year.
• Faced external environment headwinds which also impacted revenues during this season
like circulars from state governments on reducing bag weight for students, pressure for
adoption of NCERT books and reduction of certain noncore subjects in junior classes etc.
• Reported Revenues have been impacted by higher provisioning for returns taking a
conservative view based on higher than expected returns received during this period, which
would not be a recurring aspect of business in coming years. Gross dispatches were down
only ~11% in the K-12 Academic season vs. Reported Net sales down by 31%.
• Profitability was impacted by lower Reported Revenues, One time Higher provisioning and
cost levels which were built to cater to the higher level of sales during the year.
• Our strategy of focusing on the cash flows has started yielding results with the Cash
generated from operations of Rs 38 cr (vs. Rs 39 cr in FY18).
• The company has already embarked “S Chand 3.0” Plan which focuses on various cost
rationalisation measures including improving productivity and gross margins, headcount
right sizing, offices/warehouse consolidation on a group level which should lead to annual
cost savings to the tune of Rs 60 cr- Rs 80 cr.
• In our view, FY19 was an aberration for the industry. We see FY20 bringing back growth with
the benefits of improved productivity, lower sales returns, higher FCF generation and lower
costs flowing into the bottom line for the company.
• The company is well positioned to benefit from the New Education Policy which we expect
to be announced immediately post elections, during FY20 which should lead to a period of
strong & sustainable growth for the company in the medium term as had been witnessed
post the 2005 Education Policy.
New Delhi, May 28th, 2019. S Chand Publishing, India’s leading education content publisher and book
publisher reported its results for the fourth quarter & for the financial year ending 31st March 2019.
Broadly speaking, this year has been a challenging year for the Educational Publication industry. The
company has a very seasonal business on account of K-12 segment, which accounts for more than 80%
of the business and 80-85% of the annual revenues come in the fourth quarter itself. This year when
we entered the sales season, we were impacted by the expectation of the launch of the New Education
Policy during 2018-19 which was later deferred to be announced after elections (See Media Links at
the end). This led to the following challenges-:
1. Expectation of Education policy impacts FY19 Sales. The Honourable Education Minister of
the 2014-19 NDA government, Mr Prakash Javdekar, has been talking about the Education
policy being ready in various media interactions (See Links below). The expectation of the
industry is that when the new government is formed, New Education Policy would be one of
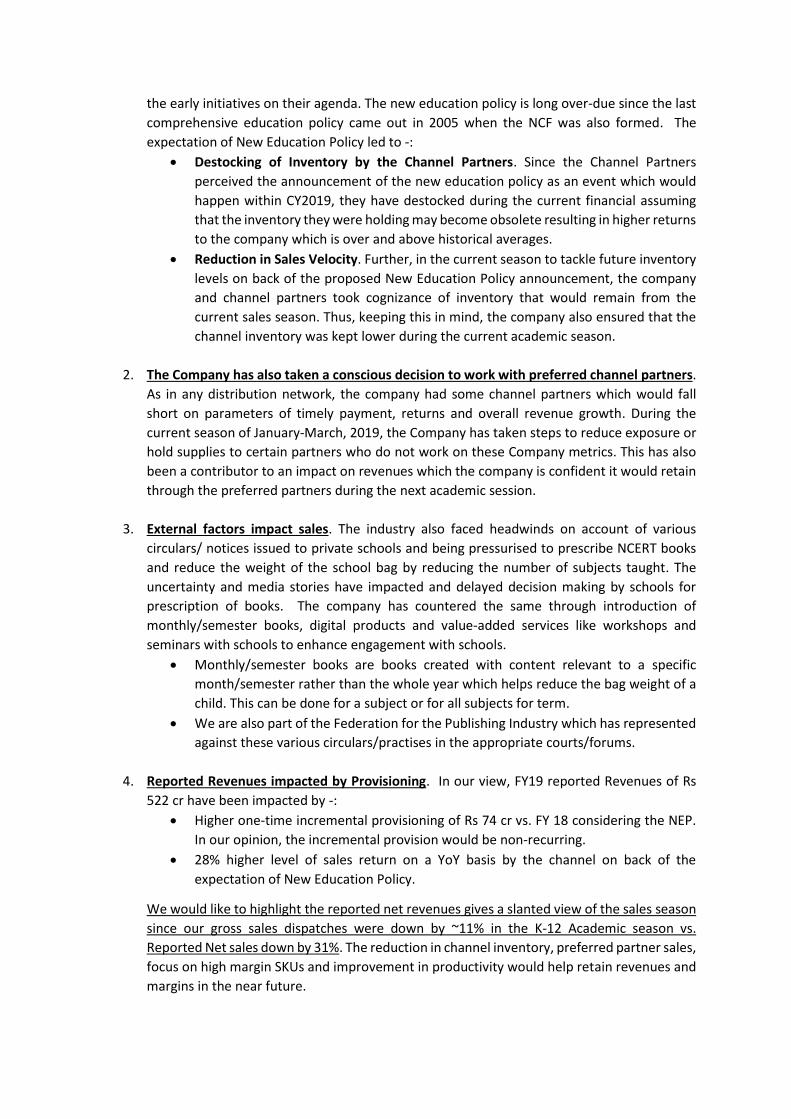
the early initiatives on their agenda. The new education policy is long over-due since the last
comprehensive education policy came out in 2005 when the NCF was also formed. The
expectation of New Education Policy led to -:
• Destocking of Inventory by the Channel Partners. Since the Channel Partners
perceived the announcement of the new education policy as an event which would
happen within CY2019, they have destocked during the current financial assuming
that the inventory they were holding may become obsolete resulting in higher returns
to the company which is over and above historical averages.
• Reduction in Sales Velocity. Further, in the current season to tackle future inventory
levels on back of the proposed New Education Policy announcement, the company
and channel partners took cognizance of inventory that would remain from the
current sales season. Thus, keeping this in mind, the company also ensured that the
channel inventory was kept lower during the current academic season.
2. The Company has also taken a conscious decision to work with preferred channel partners.
As in any distribution network, the company had some channel partners which would fall
short on parameters of timely payment, returns and overall revenue growth. During the
current season of January-March, 2019, the Company has taken steps to reduce exposure or
hold supplies to certain partners who do not work on these Company metrics. This has also
been a contributor to an impact on revenues which the company is confident it would retain
through the preferred partners during the next academic session.
3. External factors impact sales. The industry also faced headwinds on account of various
circulars/ notices issued to private schools and being pressurised to prescribe NCERT books
and reduce the weight of the school bag by reducing the number of subjects taught. The
uncertainty and media stories have impacted and delayed decision making by schools for
prescription of books. The company has countered the same through introduction of
monthly/semester books, digital products and value-added services like workshops and
seminars with schools to enhance engagement with schools.
• Monthly/semester books are books created with content relevant to a specific
month/semester rather than the whole year which helps reduce the bag weight of a
child. This can be done for a subject or for all subjects for term.
• We are also part of the Federation for the Publishing Industry which has represented
against these various circulars/practises in the appropriate courts/forums.
4. Reported Revenues impacted by Provisioning. In our view, FY19 reported Revenues of Rs
522 cr have been impacted by -:
• Higher one-time incremental provisioning of Rs 74 cr vs. FY 18 considering the NEP.
In our opinion, the incremental provision would be non-recurring.
• 28% higher level of sales return on a YoY basis by the channel on back of the
expectation of New Education Policy.
We would like to highlight the reported net revenues gives a slanted view of the sales season
since our gross sales dispatches were down by ~11% in the K-12 Academic season vs.
Reported Net sales down by 31%. The reduction in channel inventory, preferred partner sales,
focus on high margin SKUs and improvement in productivity would help retain revenues and
margins in the near future.
5. Focus on improving internal efficiency and reducing operational costs. We have turned our
focus on eliminating inefficiencies from our business. This would include working on
improving the efficiency and productivity of our sales force and delivery teams, eliminate non-
core projects and investment in technology to improve decision making. Various steps are
being taken on this front including rationalizing the number of offices and warehousing space
across India, rationalising the payroll through consolidation of shared services, improving
revenue per MT of paper consumed and increasing consumer engagement through digital
marketing and products. The company is targeting annual cost saving in the range of Rs60cr-
Rs80cr from the S Chand 3.0 program implementation.
6. Increase in share of Digital & Services business. The company has forayed into various other
products and services in the past few years to build alternate product and service lines. Some
of the initiatives have gained traction as Destination Success, Mylestone, Smart K, Test Coach
and Risekids, all of which have carved a niche segment in the markets they operate. This
would enable the company to spread revenue through the first three quarters, enhance
visibility and de-risk the present business model.
To augment books the company has also rolled out the App Mystudygear (Approx 1 Mn
downloads) for ensuring the books of the company offer a blended learning solution in the
form of Digitally Enabled Books (i.e DEBs). The company recognises the need of the Gen X
student to learn on various media not limited to printed books, but augmented by Interactive
Videos, Test generators, Online assessments and analytics, Virtual Reality and Games. Almost
2/3rd of the titles in the K-12 segment are DEBs which enable this 360 degree learning. The
company is also geared to launch its all-in-one learning platform Learnflix in FY20. This would
enable a larger audience to Learn on the move.
7. Increased focus on free cash flow generation for FY20. The company announced during its
3rd quarter results that we are looking to enhance focus on improving free cash flows from
operations. Our strategy of focusing on the cash flows has started yielding results with the
Cash generated from operations of Rs38cr in FY19 (vs. Rs39cr in FY18). This is despite the
34% drop in the net revenues for the year. We are looking to increase this by focusing on
inventory reduction going ahead, improving the collection of receivables and reducing costs
in our system. We are targeting a higher conversion of EBITDA to free cash flow in excess of
50% in the future.
8. Benefit from New Education Policy to flow though from FY20 onwards. While there has been
an impact on revenues from multiple factors discussed earlier in the current financial year, a
New Education Policy is normally followed by a change in curriculum which is greatly
beneficial to the Company and sector as it removes piracy and used books from circulation
helping publishers with higher than usual volumes for multiple years. This phenomenon has
been seen regularly with State curriculum changes and we expect to derive benefit from the
same in due course of time.
9. Going ahead. With our increased focus on free cash flow generation, going ahead the
company has an ambitious target of turning debt free in the next three years and increasing
EBITDA to free cash flow conversion rate to over 50%. We see ourselves well positioned to
benefit from the New Education Policy which we expect to be announced during FY20 which

should lead to a period of strong & sustainable growth for the company in the medium
term.
Ears to the ground on Expectation of New Education Policy
About S Chand
S. Chand is a leading education content company delivering content across the length and breadth of
the country. We provide content, solutions and services across the education lifecycle through our
presence in three business segments – Early Learning, K-12 and Higher Education. We have a strong
foothold in the CBSE/ICSE affiliated schools, with increasing presence in the state board affiliated
schools across India. We develop and nurture our relationships with customers by developing quality
content and educational innovations, and in recent years have increased our focus on investing and
improving our digital offerings in each of our business segments.
With over 40 branches, marketing offices and extensive distribution system across India, our content
reaches all the 29 states and 7 union territories. We also export our printed content to over 20
countries and digital content to 5 countries in Asia, the Middle East, Africa and other parts of the
world. Our strength lies in the efforts of our 1800+ employees, some having more than 20 years of
experience, who help us in reaching out to our customers and maintaining our growth. Our prestigious
brands include some of the best-selling and popular print content, such as S Chand, Vikas, Madhubun,
New Saraswati House and Chhaya Prakashani.
For more information please contact:
Saurabh Mittal
Chief Finance Officer
Contact No : +91 11 4973 1800
Email: [email protected]
Atul Soni
Head – Investor Relations
Contact No : +91 11 4973 1800
Email: [email protected]


