
Mathias Wagner, Jakob Progsch
GTC 2017
S7445 - WHAT THE PROFILER IS TELLING YOUOPTIMIZING WHOLE APPLICATION PERFORMANCE

2
BEFORE YOU START
1. Know your application
• What does it compute? How is it parallelized? What final performance is expected?
2. Know your hardware
• What are the target machines and how many? Machine-specific optimizations okay?
3. Know your tools
• Strengths and weaknesses of each tool? Learn how to use them.
4. Know your process
• Performance optimization is a constant learning process
5. Make it so!
The five steps to enlightenment

3
PERFORMANCE OPTIMIZATION
You might have a feeling where your application spends most of it’s time …
… but a more analytic approach might be better
What exactly is the performance bottleneck?

4
WHOLE APPLICATION PERFORMANCE
You might spend hours on optimizing GPU kernels …
… but at the end your application is still not really faster
Introduce imbalance in your system
Amdahl’s law applies
Kernel performance in companion talk: S7444 (next)
Need to consider all components and their interaction
Image: https://www.flickr.com/photos/jurvetson/480227362

5
ASSESS PERFORMANCE
Various tools available depending on your requirements
Different levels of sophistication (amount of information scales with effort …)
Simple wallclock time
Timers build in your code
Simple CPU profilers (gprof)
GPU Timelines and profiles and details: CUDA profiling toolsnvprof, NVIDIA Visual Profiler (NVVP), NVIDIA Nsight Vistual Studio Edition
MPI, OpenMP, CPU Details (3rd party tools)
Tools required

6
TAU PERFORMANCE SYSTEM ®
3RD PARTY PROFILING TOOLS(without even trying to be complete)
VAMPIRTRACE
HPC TOOLKITPAPI CUDA COMPONENT

7
You should get an idea about how to assess whole application performance and identify somebottlenecks.
There are way to many potential bottlenecks to provide a cook book.
8
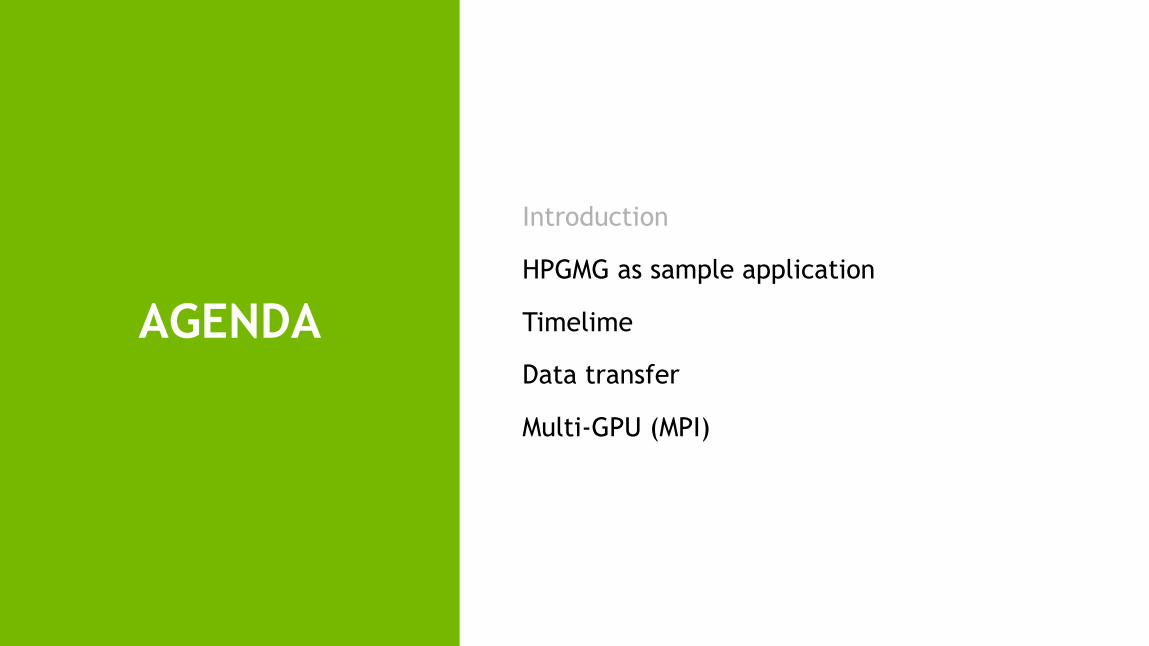
AGENDA
Introduction
HPGMG as sample application
Timelime
Data transfer
Multi-GPU (MPI)

9
HPGMG
10
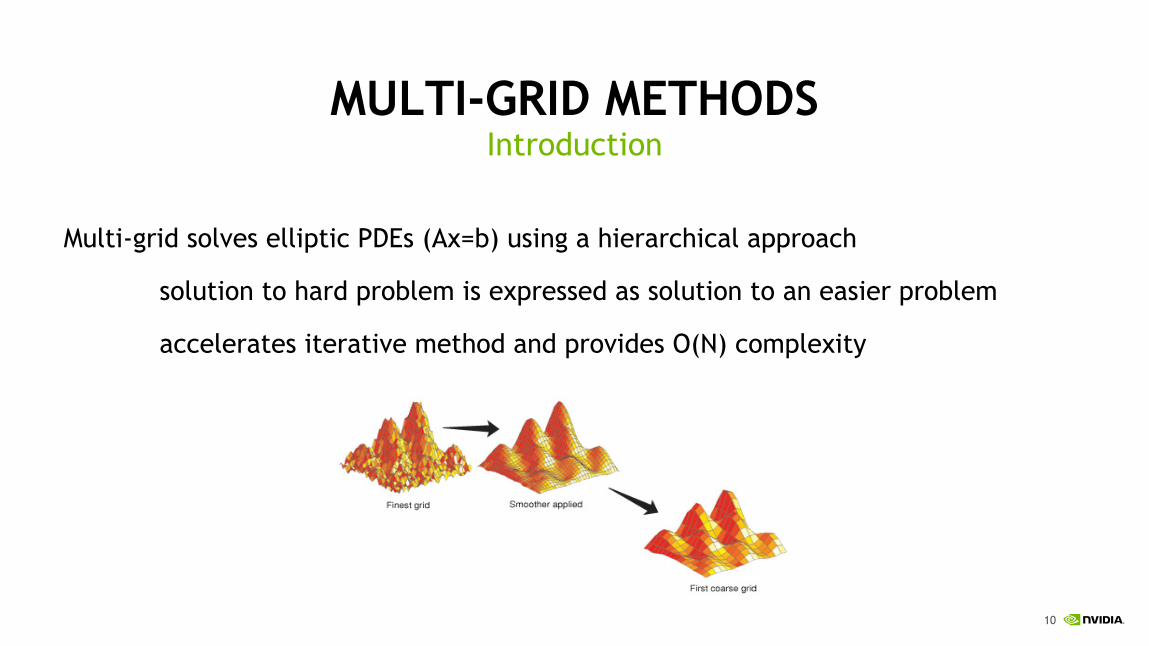
MULTI-GRID METHODSIntroduction
Multi-grid solves elliptic PDEs (Ax=b) using a hierarchical approach
solution to hard problem is expressed as solution to an easier problem
accelerates iterative method and provides O(N) complexity
5/23/17
11
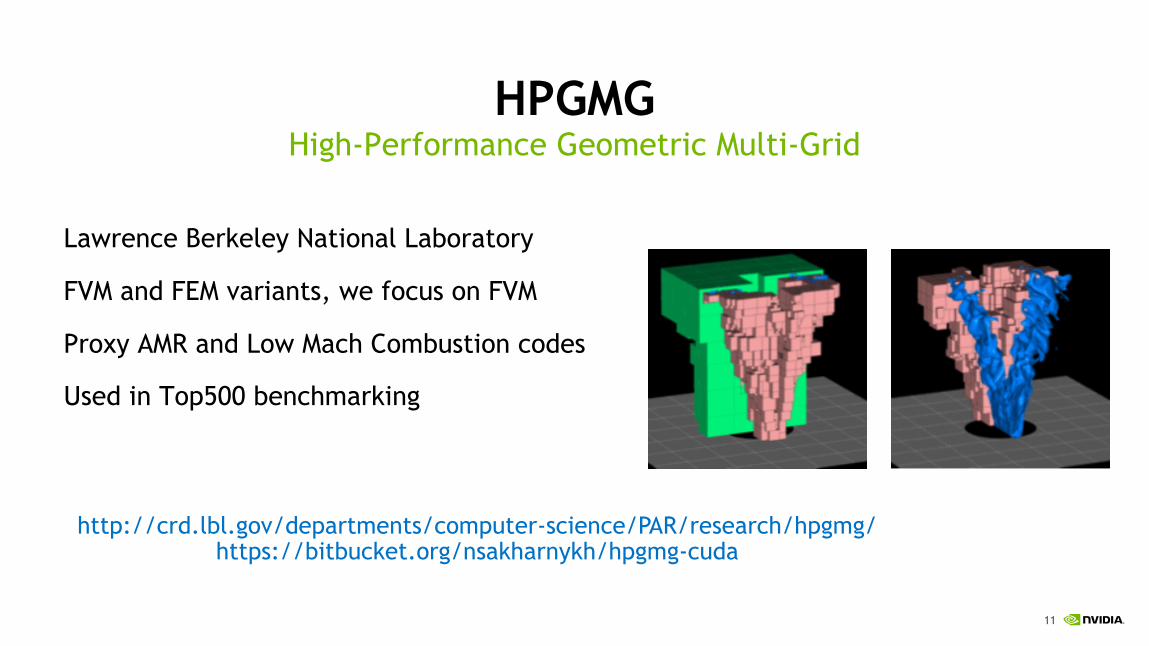
HPGMGHigh-Performance Geometric Multi-Grid
Lawrence Berkeley National Laboratory
FVM and FEM variants, we focus on FVM
Proxy AMR and Low Mach Combustion codes
Used in Top500 benchmarking
5/23/17
http://crd.lbl.gov/departments/computer-science/PAR/research/hpgmg/https://bitbucket.org/nsakharnykh/hpgmg-cuda

12
HPGMGMulti-grid cycles
HPGMG implements F-cycle which has better convergence rate than V-cycle
Poisson or Helmholtz operator using 2nd or 4th order discretization
5/23/17
V-CYCLE F-CYCLE
DIRECT SOLVE
FEW FINER GRIDS
MANY COARSER GRIDS
SMOOTHER& RESIDUAL
SMOOTHER& RESIDUAL
SMOOTHER
SMOOTHER

13
FIRST LOOK AT THE PERFORMANCE

14
RUN THE APPLICATION
You might have a feeling where your application spends most of it’s time …
… but a more analytic approach might be better
15
PROFILE IT
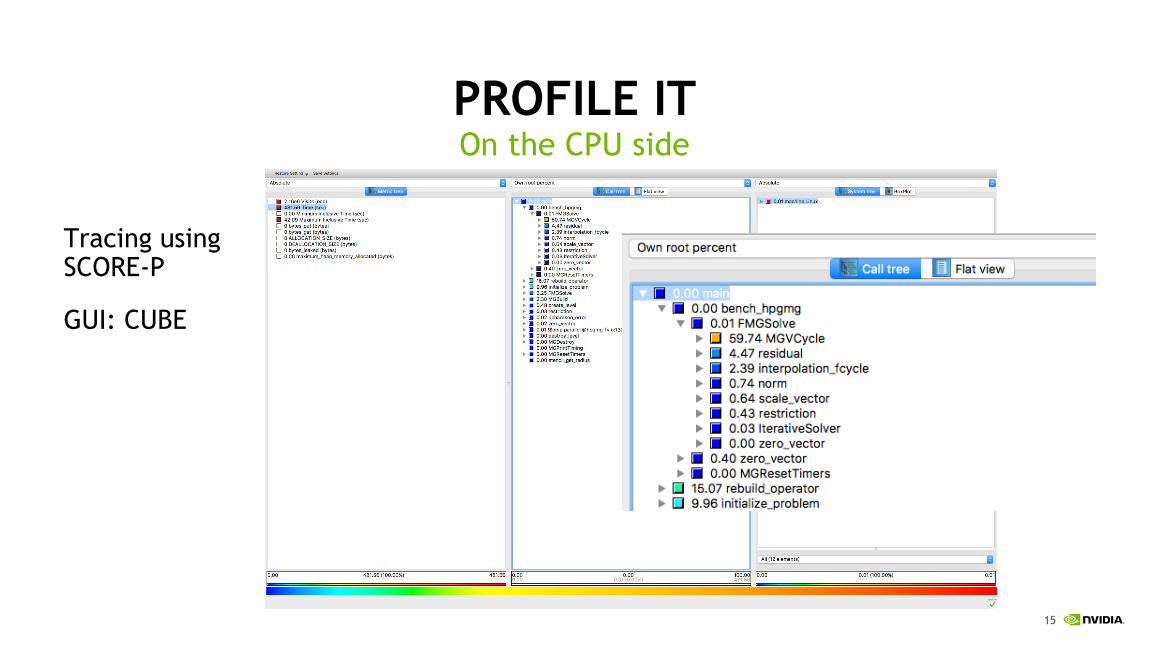
Tracing usingSCORE-P
GUI: CUBE
On the CPU side

16
TIMELINE

17
THE PROFILER WINDOWNVVP as one possible tool to display timelines
Timeline
Analysis Results
Summary
Guide

18
IF REQ’D: REMOTE PROFILING
various approaches to remote profiling
A. Run profiler on remote machine and use remote desktop (X11 forwarding, NX, VNC, …)
B. Collect data using command line profiler nvprof and view your local workstation
# generate time linenvprof –o myprofile.timeline ./a.out# collect data needed for guided analysis nvprof –o myprofile.analysis --analysis-metrics ./a.out# custom selection of metrics for detailed investigations nvprof –o myprofile.metrics –-metrics <...> ./a.out
C. Use remote connection feature to create a new session
Application you want to profile for might not run locally

19
CREATE A REMOTE CONNECTION
Start with new session

20
TIMELINEOnly shows GPU activity …

21
NVTX MARKUP
NVVP by default only shows GPU activity on timelines
Markup can be used to mark regions with CPU activity
Also useful to group phases of your application for easier navigation
Annotate your code
Link against libnvToolsExt
NVIDIA Tools Extension

22
NVTX MARKUP
#include "nvToolsExt.h"
...
void init_host_data( int n, double * x ) {
nvtxRangePushA("init_host_data");
//initialize x on host
...
nvtxRangePop();
}
Code sample

23
NVTX MARKUP
Use macros: PUSH_RANGE(name,cid), POP_RANGE
Use C++ tracer class
Exploit compiler instrumentation
Details:https://devblogs.nvidia.com/parallelforall/cuda-pro-tip-generate-custom-application-profile-timelines-nvtx/
Simplify use of NVTX

24
CPU TIMELINE

25
CPU TIMELINEOne single solve

26
… PORTING TO GPUS …

27
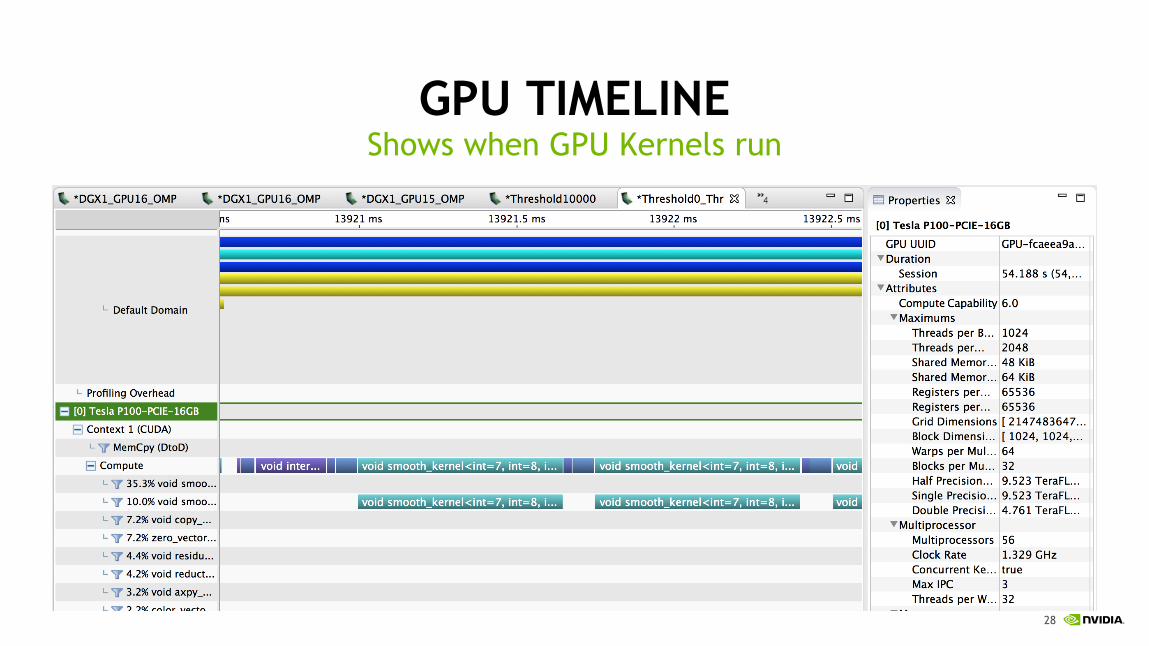
GPU TIMELINE
28
GPU TIMELINEShows when GPU Kernels run

29
CAN WE DO BETTER ?

30
HYBRID IMPLEMENTATIONTake advantage of both architectures
Fine levels are executed on throughput-optimized processors (GPU)
Coarse levels are executed on latency-optimized processors (CPU)
5/23/17
GPU
CPU
THRESHOLD
V-CYCLE F-CYCLE

31
HYBRID TIMELINE

32
HYBRID TIMELINE
For each level: Decide whether to run on the CPU or GPU
Naïve performance estimate:
GPU Time Level 0 – GPU Time Level X + CPU Time Level X

33
HYBRID TIMELINE
For each level: Decide whether to run on the CPU or GPU
Naïve estimate: GPU Time Level 0 – GPU Time Level X + CPU Time Level X81.467 ms – 3.211 ms + 0.419 ms = 78.765 ms

34
HYBRIDTIMELINECPU PROFLIING
TAKEAWAYS
Get an estimate of your hotspots
Profile might not be detailed enough(sum, avg, max)
Useful first estimate
Strong GPU and Strong CPU
Use both
Troughput -> GPU
Latency -> CPU
See what is going on
Information on each call
NVTX markup for CPU, grouping
May also show voids, dependencies, …
Estimate speedups

35
DATA MIGRATION

36
MEMORY MANAGEMENTUsing Unified Memory
No changes to data structures
No explicit data movements
Single pointer for CPU and GPU data
Use cudaMallocManaged for allocations
5/23/17
Developer View With Unified Memory
Unified Memory

37
UNIFIED MEMORYSimplified GPU programming
Minimal modifications to the original code:
(1) malloc replaced with cudaMallocManaged for levels accessed by GPU
(2) Invoke CUDA kernel if level size is greater than threshold
5/23/17
void smooth(level_type *level,...){...if(level->use_cuda) {
// run on GPUcuda_cheby_smooth(level,...);
}else {
// run on CPU#pragma omp parallel forfor(block = 0; block < num_blocks; block++)
...}}

38
PAGE FAULTS Segmented view

39
PAGE FAULTS Details

40
PAGE FAULTS Details

41
Level N (large) is shared between CPU and GPU
Solution: allocate the first CPU level with cudaMallocHost (zero-copy memory)
Level N+1 (small) is shared between CPU and GPU
UNIFIED MEMORYEliminating page migrations and faults
5/23/17
Level N Level N+1
Smoother Residual Restriction
data
GPU kernels
Smoother
CPU functions
Residual

42
PAGE FAULTS Almost gone

43
NEW HINTS API IN CUDA 8Not used here
cudaMemPrefetchAsync(ptr, length, destDevice, stream)
Migrate data to destDevice: overlap with computeUpdate page table: much lower overhead than page fault in kernelAsync operation that follows CUDA stream semantics
cudaMemAdvise(ptr, length, advice, device)
Specifies allocation and usage policy for memory regionUser can set and unset at any time
5/23/17

44
CONCURRENCY THROUGH PIPELINING
Serial
Concurrent– overlap kernel and D2H copy
Use CUDA streams to hide data transfers
K1
K2
K3
K4
cudaMemcpyAsync(H2D) cudaMemcpyAsync(D2H)Kernel<<<>>> time
cudaMemcpyAsync(H2D) DH1
DH2
DH3
DH4time
performance improvement

45
…OPTIMIZE CPU AND GPU (S7444 – UP NEXT)…

46
HIGHER PERFORMANCEOptimized GPU Kernels + OpenMP on CPU

47
REVISITING HYBRID STRATEGYTi
me
[sec
onds
]
Max grid size on CPU threshold
0.060
0.070
0.080
0.090
0.100
0.110
0.120
0.130
1 2 4 8 16 32 64 128
256
512
1024
2048
4096
8192
16384
32768
65536
131072Unoptimized Optimized

48
RE-ITERATECUDAMALLOCUNIFIED MEMORY
TAKEAWAYS
No manual data transfers necessary
Avoid page faults
Use prefetch and cudaMemAdvise
After optimizing kernels revisit your timeline
Previous assumption might no longer apply
Hybrid approaches strongly depend on used CPU and GPU
Bottlenecks shift
Familarize with variants
CudaMalloc
CudaMallocHost
CudaMallocManaged

49
DEPENDENCY ANALYSIS

50
DEPENDENCY ANALYSIS
The longest running kernel is not always the most critical optimization target
Easily find the critical parts to optimize
A wai
t
B wait
Kernel X Kernel Y
5% 40%
TimelineOptimize Here
CPU
GPU

51NVIDIA CONFIDENTIAL. DO NOT DISTRIBUTE.
DEPENDENCY ANALYSISVisual Profiler
Unguided Analysis Generating critical path
Dependency AnalysisFunctions on critical path

52
DEPENDENCY ANALYSISVisual profiler
Inbound dependencies
Launch copy_kernel MemCpy HtoD [sync]
Outbound dependencies
MemCpy DtoH [sync]

53
MULTI-GPU USING MPI

54
MPICompiling and Launching
$ mpicc -o myapp myapp.c$ mpirun -np 4 ./myapp <args>
myapp myapp myapp myapp
rank = 0 rank = 1 rank = 2 rank = 3

55
PROFILING MPI APPLICATIONSUsing nvprof
Embed MPI rank in output filename, process name, and context name
mpirun -np $np nvprof --output-profile profile.%q{OMPI_COMM_WORLD_RANK}.nvvp
5/23/17
OpenMPI: OMPI_COMM_WORLD_RANK
MVAPICH2: MV2_COMM_WORLD_RANKUse the import Wizard

56
MULTI GPU TIMELINE

57
MPI ACTIVITY IN NVVP
MPI provides a MPI Profiling interface (PMPI)
Intercept MPI calls and perform actions before and after the MPI call
Python script to generate necessary wrapper is available
python wrap/wrap.py -g -o nvtx_pmpi.c nvtx.wmpicc -c nvtx_pmpi.cmpicc … nvtx_pmpi.o –o myapplication -L$CUDA_HOME/lib64 -lnvToolsExt
Details:https://devblogs.nvidia.com/parallelforall/gpu-pro-tip-track-mpi-calls-nvidia-visual-profiler/
Use NVTX

58
MULTI GPU TIMELINE
MPI activity

59
MPI TRANSFERSWithout CUDA aware MPI

60
CUDA AWARE MPIMPI knows about the GPU
Use MPI directly on GPU pointers (no manual copy to host required)
Unified Memory needs explicit support from the CUDA-aware MPI implementation
Check your MPI implementation for support (OpenMPI >1.8.5, MVAPICH2-GDR > 2.2b)
Unified Memory and regular (non CUDA-aware) MPI
Requires unmanaged staging buffer
Regular MPI has no knowledge of Unified Memory
5/23/17
61
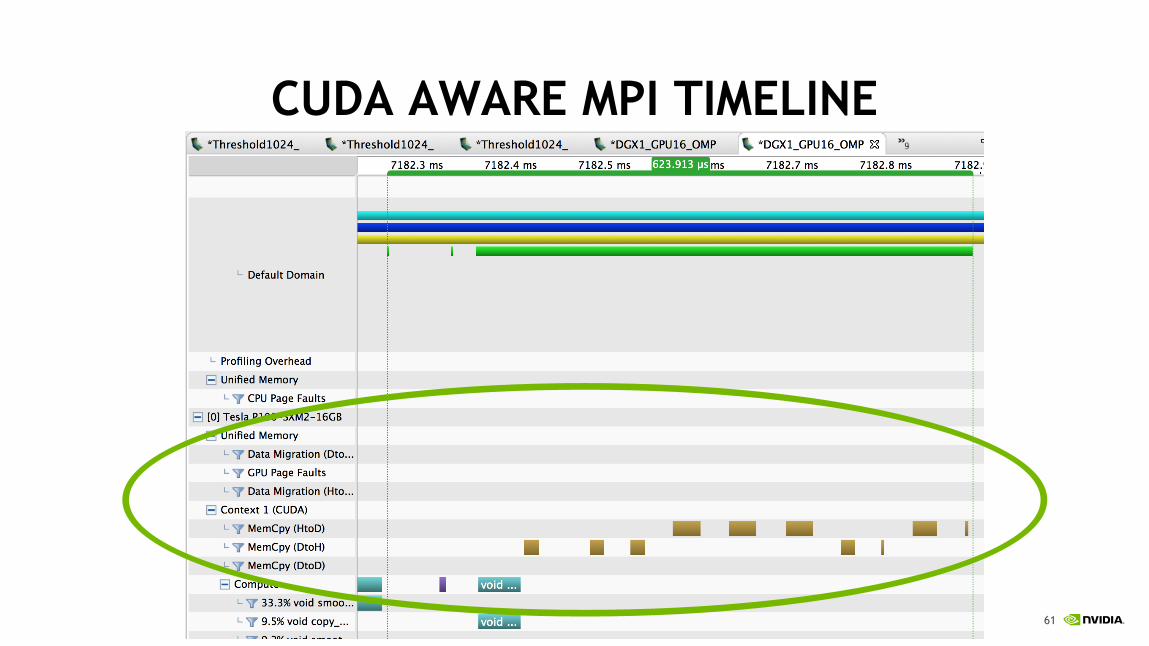
CUDA AWARE MPI TIMELINE

62
NVIDIA GPUDIRECT™Peer to Peer Transfers
5/23/17
GPU1
GPU1Memory
PCI-e
CPU
Chipset
GPU2
GPU2Memory
IB
SystemMemory

63
NVIDIA GPUDIRECT™Peer to Peer Transfers
5/23/17
GPU1
GPU1Memory
PCI-e
CPU
Chipset
GPU2
GPU2Memory
IB
SystemMemory
NVLink

64
PEER TO PEER
Not supported on unified memory buffers
Use pinned memory buffer for MPI
Still staging through host ???
Using a pinned buffer for MPI

65
TOPOLOGY
Fat GPU nodes
Mutiple CPUs
System memory attached to a single CPU
Multiple GPUs
P2P via NVLink or shared PCIe
Multiple Network (IB) adapter
Without direct connection: staging through host
DGX-1

66
TOPOLOGY
GPU0 GPU1 GPU2 GPU3 GPU4 GPU5 GPU6 GPU7 mlx5_0 mlx5_2 mlx5_1 mlx5_3 CPU AffinityGPU0 X NV1 NV1 NV1 NV1 SOC SOC SOC PIX SOC PHB SOC 0-19GPU1 NV1 X NV1 NV1 SOC NV1 SOC SOC PIX SOC PHB SOC 0-19GPU2 NV1 NV1 X NV1 SOC SOC NV1 SOC PHB SOC PIX SOC 0-19GPU3 NV1 NV1 NV1 X SOC SOC SOC NV1 PHB SOC PIX SOC 0-19GPU4 NV1 SOC SOC SOC X NV1 NV1 NV1 SOC PIX SOC PHB 20-39GPU5 SOC NV1 SOC SOC NV1 X NV1 NV1 SOC PIX SOC PHB 20-39GPU6 SOC SOC NV1 SOC NV1 NV1 X NV1 SOC PHB SOC PIX 20-39GPU7 SOC SOC SOC NV1 NV1 NV1 NV1 X SOC PHB SOC PIX 20-39mlx5_0 PIX PIX PHB PHB SOC SOC SOC SOC X SOC PHB SOCmlx5_2 SOC SOC SOC SOC PIX PIX PHB PHB SOC X SOC PHBmlx5_1 PHB PHB PIX PIX SOC SOC SOC SOC PHB SOC X SOCmlx5_3 SOC SOC SOC SOC PHB PHB PIX PIX SOC PHB SOC X
Legend:
X = Self SOC = Connection traversing PCIe as well as the SMP link between CPU sockets(e.g. QPI)PHB = Connection traversing PCIe as well as a PCIe Host Bridge (typically the CPU)PXB = Connection traversing multiple PCIe switches (without traversing the PCIe Host Bridge)PIX = Connection traversing a single PCIe switchNV# = Connection traversing a bonded set of # NVLinks
Query information using nvidia-smi topo -m

67
PEER TO PEER
No staging through host
Here via NVLink
With directly connected GPUs
68
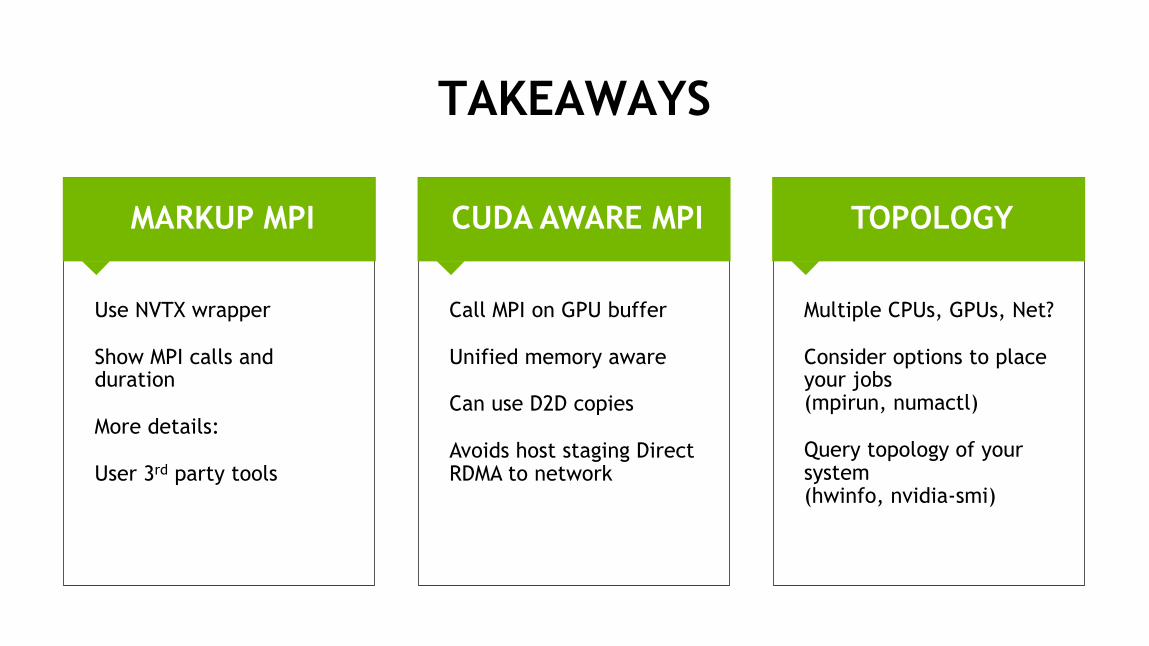
TOPOLOGYCUDA AWARE MPIMARKUP MPI
TAKEAWAYS
Use NVTX wrapper
Show MPI calls and duration
More details:
User 3rd party tools
Multiple CPUs, GPUs, Net?
Consider options to place your jobs(mpirun, numactl)
Query topology of your system(hwinfo, nvidia-smi)
Call MPI on GPU buffer
Unified memory aware
Can use D2D copies
Avoids host staging Direct RDMA to network

69
SUMMARY

70
LEARNOPTIMIZEPROFILE
TAKEAWAYS
Use available toolsUse as many as needed
Consider your whole application
Focus on representative parts / smaller problems
Check for overhead
Build knowledge
No optimization cookbook
Look for dependencies
Use streams to overlap work
Be aware of unified memory page faults
Use CUDA aware MPI
Consider topology

71
LEARNING RESOURCESS7444 - WHAT THE PROFILER IS TELLING YOU: OPTIMIZING GPU KERNELS
L7115 - PERFORMANCE ANALYSIS […] SCORE-P and VAMPIRS7684 - PERFORMANCE ANALYSIS OF CUDA DEEP LEARNING NETWORKS USING TAUS7573 - DEVELOPING, DEBUGGING, AND OPTIMIZING […] WITH ALLINEA FORGE
3RD PARTY PROFILINGS7495 - OPTIMIZING APPLICATION PERFORMANCE WITH CUDA PROFILING TOOLSS7824 - DEVELOPER TOOLS UPDATE IN CUDA 9
CUDA PROFILING
S7133 - MULTI-GPU PROGRAMMING WITH MPIL7114 - MULTI GPU PROGRAMMING WITH MPI AND OPENACCS7142 - MULTI-GPU PROGRAMMING MODELSS7285 - UNIFIED MEMORY ON THE LATEST GPU ARCHITECTURES
MPI AND UNIFIED MEMORYProgramming Guide, Best Practices, Tuning Guides
Parallel for-all Blog, GTC on-demand
Stackoverflow
CUDA DOCUMENTATION


