
1Slide #
Safety based shelf life for ready to eatpre-packaged refrigerated foods
Cold Chain Management III
Bonn Germany June 2-3, 2008
Dr. Ted Labuza & Dr. Francisco Diez & Dr. Amit Pal
University of Minnesota St Paul MN 55108
QuickTime™ and aTIFF (Uncompressed) decompressor
are needed to see this picture.
QuickTime™ and aTIFF (Uncompressed) decompressor
are needed to see this picture.
QuickTime™ and aTIFF (Uncompressed) decompressor
are needed to see this picture.

Greetings from Minnesota, USA
We are 4.4 million
15,129 lakes
Two ocean going seaport ports
State bird is a mosquito
Rated one of best places to live in USA but climate goes from -35°C to +37°C

3Slide #

4Slide #
What do we want to know ?• Get the location of a case-lot of food in the cold
distribution chain in case of an adverse event (eg. recall) – ISO 9000-2000 Clause 3.5.4 Traceability is the ability to trace the
history or location of what is under consideration
• What is the shelf life left of the product at each point in the distribution? “Quality”
• Is the food safe when we eat it, determined either by sensors or by modeling the time-temperature history in the cold chain?
QuickTime™ and aTIFF (Uncompressed) decompressor
are needed to see this picture.

5Slide #
Expiration Dating of foods & Safety
The last package of of hotdogs you sold me was no good !!!
Did the date expire ?
No, but the dog I gave it to did !
Mike’s Hotdog Stand
Mike’s Hotdog Stand
Question of safety vs food quality
US regulatory Value of life = $6.5 MM

6Slide #
U.S. Regulatory Stance on Shelf Life• Federal Laws
– Required for drugs, OTC and infant formula– Drugs 10% loss below label value on lower 95% CL line
– All other food products voluntary
• State laws – 30 states regulate some dates (dairy, meat)– Minnesota ≤ 90 days– None based on safety , more for commerce
• GMA v Mass. Dept. Public Health– 393 NE2nd 881 (1981)– Court rules state can require dating based on public
health concerns re US Constitution

7Slide #
EU Food Dating RulesDirective 97/4/EEC Article 9 of 79/112/EEC
1.The date of minimum durability of a foodstuff shall be the date until which the foodstuff retains its specific properties when properly stored. It shall be indicated in accordance with the provisions of this article.
2.The date shall be preceded by the words:--“Best before…” when the date includes an indication of the day,--“Best before end…” in other cases
3. In the case of foodstuffs which, from the microbiological point of view, are highly perishable and are therefore likely after a short period to constitute an immediate danger to human health, the date of minimum durability shall be replaced by the “use by” date.

8Slide #
Types of food datingCode date
Born on date
Sell by date
Better if used by
Freeze by
Best when purchased by
Best if used by - minimum durability
Death date - use by (expiration)

9Slide #
Temperature Abuse• Szybist and Labuza 2001
– 100 homes
42°F = 5.6°C

10Slide #
Taoukis study Greece
0
5
10
15
203 5 7 9 11 13 15 17
temperature (�C)
% of cases
0
5
10
15
20
3 5 7 9 11
tem perature (oC)
Left: Temperature distribution in commercial chilled storage. (Measurements in 150 supermarkets in the metropolitan area of Athens).
Right: Temperature distribution in domestic refrigerators. (Based on measurements at 40 households).(Adapted from Taoukis et al., 1998.)

11Slide #
So dates by themselves ignore t-T history in refrigerated distribution
Thus to ensure safety need t-T integration

12Slide #
Degradation Kinetic parameters• Rate of degradation as f(T)
• Arrhenius function ln rate vs 1/T in K --> Ea
• simple Ln time to X (or rate) vs temperature --> Q10
• Olley square root of rate vs T
k = koe−Ea
RT lnk = lnko −Ea
RTlogτ = τ r − bT
k = A + bT3.73.63.53.43.33.2
1
10
100
ARRHENIUS PLOT TTI I
1/Tx10 (K )3
-1
k
Or
TTD

13Slide #
0 2 4 6 8 10 12 1410
50
100200500
Hours
Temperature °C
Sensory Shelf Life Plot of Skim Milkmarker problem
2x10²CFU/mL 3x10²
CFU/mL
2x10⁴CFU/mL
4x10⁷CFU/mL
8x10⁴CFU/mL
Q10 ~ 5
MN-SD Dairy Research Center

14Slide #
Area under T vs t curve
Shelf life depends on the rate and temperature sensitivity Ea or Q10, ie how much faster for a 10 °C increase in T

15Slide #
Using kinetics
% fcon=100(1/90) x 3.320/10 =10.7%
fcon =100 (20/90) x 3.31/10 = 25%
Hot dog Q10 = 3.3 ts 0°C = 90 days
%fconsumed =100 (t/ ts0°C ) x Q10ΔT/10

16Slide #
Sensory of Skim MilkAmount of Change for Q10 = 5 t 0°C=28 days
• for 1 day @ 20°C• %fconsumed =100 (1/ 28 )x 6 20/10 =128% (long dead)
• for 20 days at 1°C• %fconsumed = 100 (20/28) x 6 1/10 = 85% or 4 days left @1°C

17Slide #
Time Temperature Integration• Combine T vs t, k and Ea or Q10 functions in
algorithm– Temperature vs time measurement– Algorithm for Reaction extent as f(t,T)– Use an integrating tag TTI
time
T °CΔt

18Slide #
USDA -FSIS 1998 Guidance for Beef Grinders to Better Protect
Public Health
Guidance for Minimizing Impact Associated with a Food Safety Hazard in Raw Ground
Meat and Other FSIS Regulated Products
Install a time-temperature indicator on the package to indicate adequate temperature of storage, distribution, and display (in grocery and other retail establishments).
19Slide #
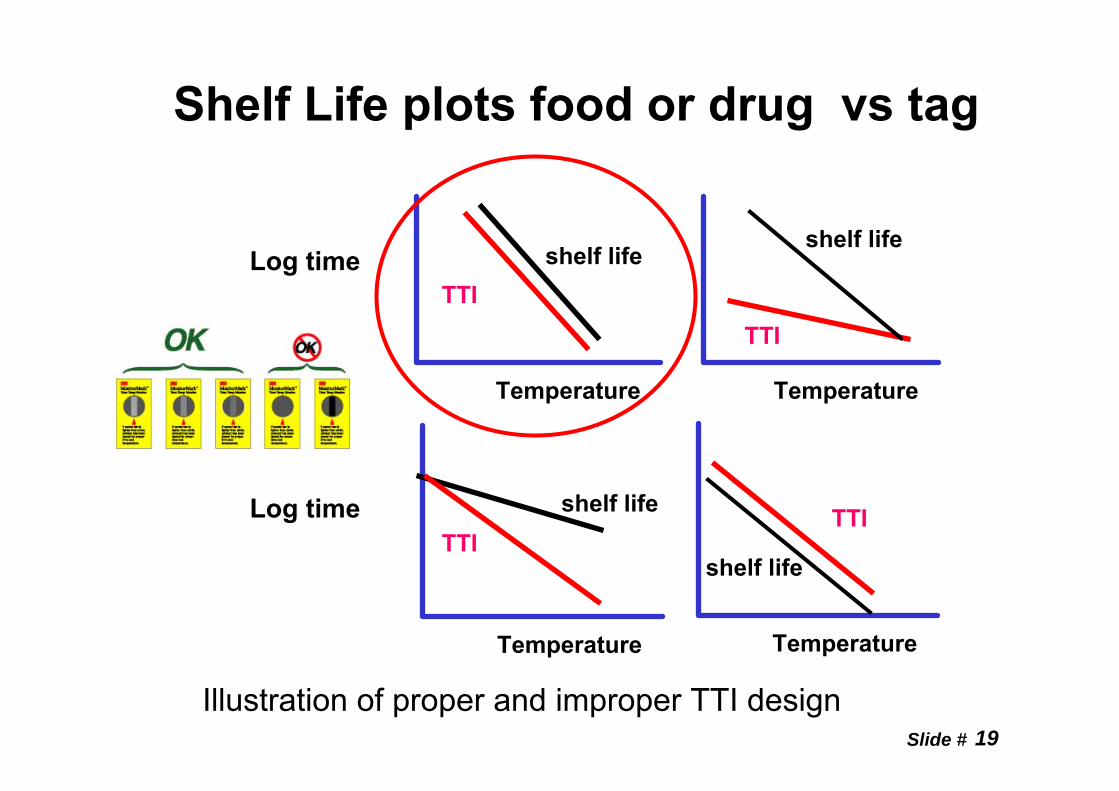
Shelf Life plots food or drug vs tag
TTIshelf life
Temperature
shelf life
Temperature
shelf life
Temperature
shelf life
Temperature
Log time
Log time TTITTI
TTI
Illustration of proper and improper TTI design

20Slide #
Shelf Life Dating Warnings• August 1998 Prevention Magazine - NBC survey
– 61% feel sell by is last date to safely sell– 34% feel use by is last date to safely use
• 1999 US IFT document to RCs related to safety through label date
• 1999 National Enquirer– Use by date is a stern warning on meats, poultry, fish and other
perishables. Pay close attention and do not use once date is passed
• Food Technology July 1999 “Playing the Open Dating Game” Ted Labuza and Lynn Szybist

21Slide #
• FIFO vs LSFO system Taoukis et al – ≥15% savings (EU programs including SMAS)– Taoukis, P.S., Bili M., Giannakourou M. (1998). “Application of shelf life
modelling of chilled salad products to a TTI based distribution and stock rotation system.“ Proceedings of the International Symposium on Applications of Modelling as an Innovative Technology in the Agri-Food-Chain Ed. L.M.M. Tijskens, Wageningen, Netherlands, p. 131-140.
– Case study with fish in Greece to Italy chain store– Basis for formation of SMAS
• http://www.vitsab.com/htdocs/default.htm• Contact [email protected]
22Slide #
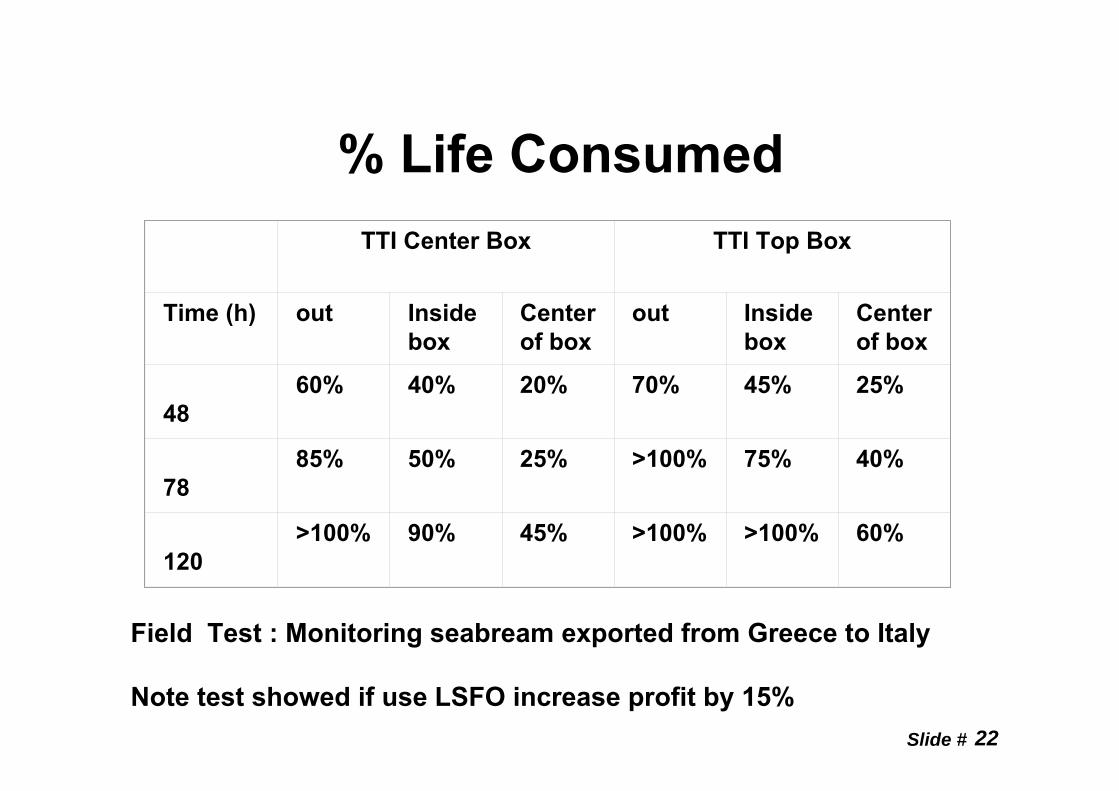
% Life Consumed
Field Test : Monitoring seabream exported from Greece to Italy
Note test showed if use LSFO increase profit by 15%
TTI Center Box TTI Top Box
Time (h) out Inside box
Center of box
out Inside box
Center of box
4860% 40% 20% 70% 45% 25%
7885% 50% 25% >100% 75% 40%
120>100% 90% 45% >100% >100% 60%

23Slide #
-0.10
0.00
0.10
0.20
0.30
0.40
0.50
-16 -14 -12 -10 -8 -6 -4 -2 0
Log probability of illness
Pro
babi
lity
FIFOSMAS
Theoretical Probability of Reduction in illness using LSFO
To prove it need data for growth of pathogens or toxin production
Pro
babi
lity

24Slide #

25Slide #
1. What are the scientific parameters for establishing safety-based ‘‘use-by’’ date labels for refrigerated RTE foods?
2. What effect do the multiple factors that influence the growth and survival of L. monocytogenes, i.e., strain differences, food matrices, production and distribution systems, consumer susceptibility, etc., have on the establishment of safety based ‘‘use-by’’ date labels for refrigerated RTE foods?
3. What data need to be acquired to scientifically validate and verify the adequacy of a proposed safety-based ‘‘use-by’’date label for a refrigerated RTE food?
Note sushi/sashimi are RTE consumed as raw products as are oysters

26Slide #
4. Should safety-based ‘‘use-by’’ date labels for refrigerated RTE foods be established using mathematical modeling techniques? If so, what modeling approaches are best suited to the development of labels for refrigerated RTE foods?
5. What impact would safety-based ‘‘use-by’’ date labels created for one psychrotrophic pathogen, e.g., L. monocytogenes, likely have on the control of other foodborne pathogens in refrigerated RTE foods?
Note that in US under FDA, Listeria is an adulterant so if you detect it (1 CFU/25 g) then the food is considered adulterated while EU & Canada rules allow up to 100 CFU/g or 2500 per 25 g in a food as long as it does not allow growth above that.

27Slide #
TimeTime--toto--Detect (TTD) ConceptDetect (TTD) ConceptGrowth from initial counts below detection since if present is adulterated (TTD)or growth to 100 CFU/gOr time to + toxin
Vital to satisfy FSO (food safety objective)
Baranyi and Pin, 1999
Limit time = TTD (conservative) or
Limit time = TTD + λ + [ln(N/No)]/μ
Or just assume growth rate below detection is same as above starting at some probable level for No
TTDDispatch Shelf life →

28Slide #
Days to detect botulinum toxin in CAP/MAP partially cooked fish
Baker & Genigeorgis 1990
0.1
1.0
10
100
Days
0 10 20 30 40Temperature °C
Safety Line
Q10 ~ 4
Ea ~ 21.3 Kcal/mole

29Slide #
Shelf Life and Storage ConditionsShelf Life and Storage ConditionsShelf life of frankfurters and other deli meats: ≤ 90 days at X°C At 5 °C, mean generation time of Lm from math modeling program
1.77 days in frankfurters or 12 days to reach 100 CFU/g @ 5°C2.45 days in deli meats or 16 days (US FDA/CFSAN, USDA/FSIS & CDC, 2003)
The risks from Lm could be considered minimal ifInitial contamination No with Lm is at very low levels (≤10-5 CFU/g)No temperature/time abuse during storageIf assume same growth rate at below detection then at No = 10-5
TTD = [ ln (1/No)] x G/0.693 or for hotdogs TTD is 29 days @ 5°C andat No = 10-6 it is 35 daysSeems too short or likely growth rate much less
69-78% of consumers store opened packages of deli meats for a week 10-13% for 1-3 weeks in their refrigerators so vacuum lost (USDA-FSIS, 2006)
USDA-FSIS noted in BilMar outbreak that contaminated hotdogs were consumed near or beyond end of shelf life labeled on package
R E A L I T Y

30Slide #
Shelf Life Evaluation of ReadyShelf Life Evaluation of Ready--toto--Eat Eat Meat and Poultry Products based on Meat and Poultry Products based on Listeria monocytogenesListeria monocytogenes growthgrowth
Dan Belina MS & Amit Pal Ph.D.

31Slide #
RTE Meat ProcessingRTE Meat Processing
Blender
Trimming
Stuffer
Smoking/Cooking
Cooler & Peeler
Weighing &Sorting
Vacuum Packing
Source: http://www.hotdogcartsdirect.com/how_hot_dogs_are_made.htm
CONSUMER

32Slide #
Safety-Based Shelf life Dating (SBDL)
• Strain differences• Food matrices• Competing microflora and packaging• Production, distribution, and handling practices• Consumer susceptibility• Initial level• Growth kinetics
Lm contamination levels in RTE meats are mostly <10 CFU/g(Gombas et al., 2003; Draughon et al., 2006)

33Slide #
So what temperature shouldSo what temperature should date be based on?date be based on?
1.3234
151222231034
Retail (%)
0.160 – 630.457 – 590.554 – 560.451 – 53348 – 50545 – 471842 – 442939 – 412536 – 381033 – 359< 32
Home (%)Lunch Meat Temperature (°F) Audits International, 1999
13% door and 4% bottom of the household refrigerators >45°F (>7.2 °C) Godwin et al, 2007

34Slide #
Inoculum Size and TTDInoculum Size and TTD
TSB 1.2 M NaCl in TSB
Fuqua et al., 1994; Robinson et al., 2001
Note Ln(1/No) = [0.693/G] x timeThis data suggests the model works with constant G and thus could model to level at below detection.
Robinson et al., 2001
Inoculum size Log (cells/mL)
TTD
(hou
rs)

35Slide #
PRELIMINARY STUDYPRELIMINARY STUDYFrancisco Diez-Gonzalez, Daniel Belina, Theodore P. Labuza and Amit Pal. Modeling the Growth of Listeria monocytogenes Based on the Time-to-Detect in Culture Media and Frankfurters Intl. J. Food Microbiology 113:277-283; 2007
Listeria monocytogenes H7776Implicated in hotdog outbreakGrowth part No = 5 CFU/gTTD part No= 0.01 CFU/g or 0.25 CFU/25 g ie less than detectionSix temperatures 4 to 36°CTwo media
TSB brothHPP processed hotdogs
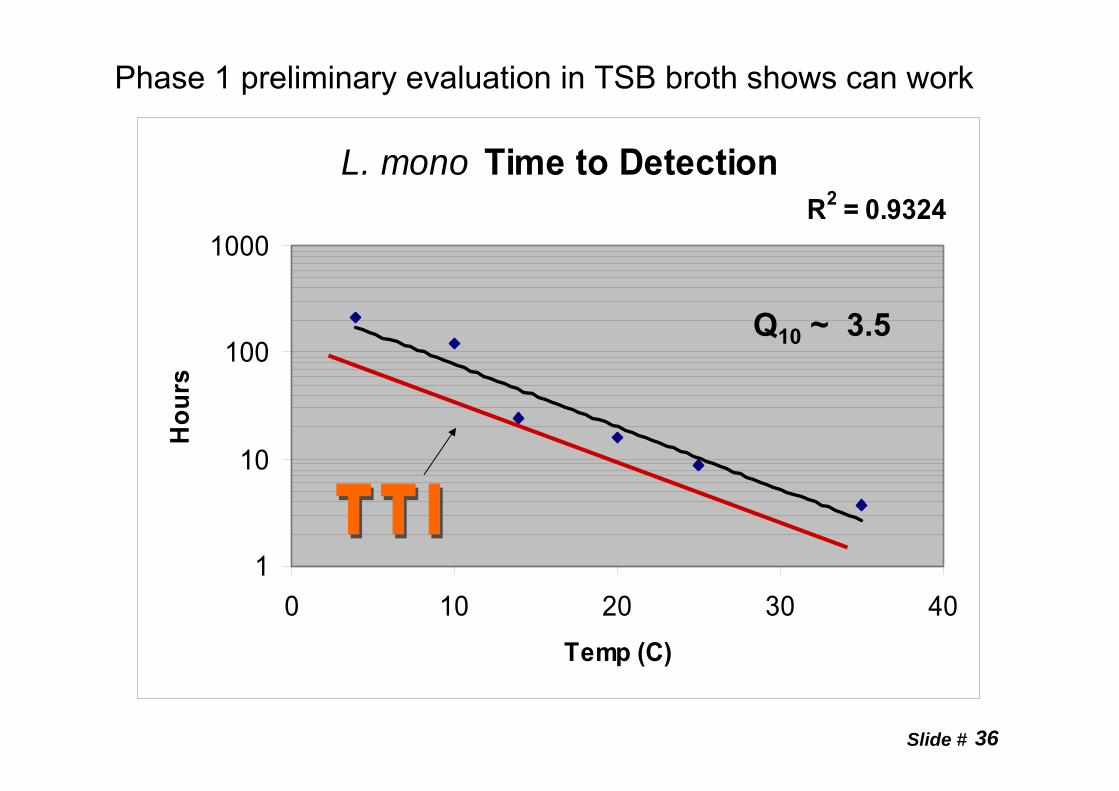
36Slide #
L. mono Time to DetectionR2 = 0.9324
1
10
100
1000
0 10 20 30 40Temp (C)
Hou
rs
Q10 ~ 3.5
Phase 1 preliminary evaluation in TSB broth shows can work

37Slide #
Phase 1 TTD in hot dogsPhase 1 TTD in hot dogs
Ln Q10 =(Ea x 10)/[R T1T2]
Q10 = 3.45

38Slide #
Arrhenius plots of TTDArrhenius plots of TTD
TSB R2 ~ 0.91 hotdogs R2 ~ 0.96

39Slide #
18°C Growth CurveTSB
so time to 100 ~1 day
0
1
2
3
4
5
6
7
8
9
10
0 20 40 60 80 100 120
Hours
Log
CFU
/mL Log phase
7.9 hours per logk =0.293 hr-1
Lag = 13 hr
Stationary phase
time to 102 = 25 hrLog
CFU
/mL

40Slide #
Summary of growth dataSummary of growth data
Note at 4°C (39.2°F) G is ~ 33 hr much longer than USDA model of 1.77 hr
29 days
9 days

41Slide #
Summary ofSummary of temperature effecttemperature effect
Note that this means just can’t use one Q10 or use largest one which would mean throwing away good food
Q10 4.39 3.35 4.01
Q10 3.32 7.2 9.68

42Slide #
Phase 2 Finding fastest growersPhase 2 Finding fastest growers
Total 19 Lm ribotypes (ID by DUP-XXXX) with 2 reps
4 °C
109 CFU/ml
8 °C 12 °C
Plate Counting
on PALCAM
103-4 CFU/ml
+
1 part frank ORturkey breast 3 part PW
30 ml slurry
× 2
× 2
With orwithoutPL/SD
Stomached to slurry

43Slide #
Growth ModelsGrowth Models
exp A.= ][-exp1]t)-(
A.e[ +λμ
yGompertz
Transformation → y = (N/No)
t>λ
1= y t<λLinear
exp= )]-t([ λμy
]2)(4exp[1
A= +−+ t
A
yλμ
)ln(e1t= )( )(t λμμλμ
μ+−− −++ teetA
Logistic
Baranyi )e
1eln(1-A(t)y= )(y
A(t)
o max oyy −
+++
μ
μ
Growth curve
TimeLag time
y = µt + cNo
λ = [Ln(No) – c] / µ

44Slide #
Listeria monocytogenes Strains• Three strains used
−Provided by Dr. M. Weidman’s ILSI Listeria database, Cornell University
−Selected based on their manifesting the fastest growth characteristics on culture media and a frankfurter slurry
• DUP-1044A− 1998-99, multistate outbreak, frankfurter, 4b
• DUP-1042B− 2000, epidemic, Mexican style cheese, 4b
• DUP-1039C− 1998, sporadic, human, 3a

45Slide #
Phase 2 FindingsPhase 2 FindingsNo significant difference between model performances (P > 0.05)So use the simplest ln N/No vs timeVariability in lag times and maximum growth rates was not similar among strains –No single strain consistently had the fastest growth at all growth conditions on broth or meat slurries
fastest strains selected were: DUP-1044A, 1039C, 1030A, and 1042B No definitive link between serotype and fastest strainsAverage lag Q10 = 7.6 and Average Log phase Q10 = 7Time to 102 Q10 = 7.4Pal, A, Labuza, T.P. and Diez-Gonzalez. F. Comparison of Primary Predictive Models Study the Growth of Listeria monocytogenes at Low-Temperatures in Liquid Cultures and Selection of Fastest Growing Ribotypes in Meat and Turkey Product SlurriesJ. Food Microbiology 25:460-470; 2008

46Slide #
PhasePhase 3 Growth on Frankfurters3 Growth on Frankfurters
4 °C109 CFU/ml
8 °C
12 °C102 CFU
~52.44 g and 121.9 cm2
LmCounting
on PALCAM
× 2
× 2 PsychrotrophsCountingon PCA
× 2
20 ml PW40 sec rinse
0.1 ml rinse or 1 ml in 4 plates
Using the 3 fastest growers in air vs vacuum, w/wo antimicrobial, & each w/wo competition with psychrotrops at 39.2, 46.4 & 53.6 °F
Initial No at < 2 CFU/g (0.3 Log) ie less than 100 CFU/g

47Slide #
DUPDUP--1044A at 4 1044A at 4 °°C (Vacuum packaged)C (Vacuum packaged)
-2
0
2
4
6
8
10
0 20 40 60 80 100Time (days)
log1
0 (C
FU/c
m2 )
Control (V)HPP (V)PL/SD + HPP (V)PL/SD (V)
Sig. Diff. between HPP and control
Survivedbut
no growth
V vacuum packed
HPP slices treated in package at 400 MPa (15 min) for 106 reduction, then inoculated
PL/SD 2%Potassium acetate + 0.2% Na-Lactate in meat formula

48Slide #
DUPDUP--1044A at 12 1044A at 12 °°C (Vacuum packaged)C (Vacuum packaged)
-202468
10
0 20 40 60Time (days)
log1
0 (C
FU/c
m2 )
Control (V)HPP (V)PL/SD + HPP (V)PL/SD (V)
>3 log(CFU/cm2)
25 days vs label of 90 days but started at above detection

49Slide #
Lm vs PPC – Comparison at 8°C8°C-vacuum
-2
0
2
4
6
8
10
0 20 40 60 80
8°C-vacuum
-2
0
2
4
6
8
10
0 20 40 60 80
Psychotrophs growth -Spoilage Indicator
Q10 ~ 6
Listeria monocytogenes growth - Safety Indicator
(♦) PL/SD + HPP (▲) PL/SD (□) HPP (○) Control
(○) Control
(○) Control
(□) HPP
(♦) PL/SD + HPP
(□) HPP
(▲) PL/SD
(▲) PL/SD
(♦) PL/SD + HPP

50Slide #
3-6*
Q10 = 4.7
5-12*19-49*NG-21 (air packaging)
NG-65 (air packaging)
NGDUP-1042B
oC
4-7*
Q10 = 4.7
8-10*18-45*NGNGNGDUP-1039C
2-3*
Q10 = 4.7
3-5*22-44*18-25NGNGDUP-1044A
12Psy 6 day Q10 = 6
8Psy 18 day
4 Psy 45 day
1284
Strain
Without‘P Lact. + Sod. Diac.’
With‘P Lact. + Sod. Diac.’
Franks
NG: No Growth ≤ 1 log growth in >90 days psy = 106psychrotrops
Phase 3 Results Summary Time to 100Time to 100--fold fold ListeriaListeria populationpopulation

51Slide #
Phase 3 FindingsPhase 3 FindingsLm growth strain dependent so which one do we use for standard ?Even with PL/SD, Lm DUP-1044 was able to grow to 102 CFU/g but longer than quality-based shelf life of 6 days at 12 °CWithout the PL/SD, pathogen level to 100 CFU/g occurs before spoilageat all temps whereas in fish@ < 10°C, bot toxin slower than spoilage Reddy et al 1999
Results could be used to create a safety based tag but would need to account for initial levels below the detection limit
Pal, A, Labuza, T.P. and Diez-Gonzalez. F. Evaluating the growth of Listeria monocytogenes in refrigerated ready-to-eat frankfurters –Influence of strain, temperature, packaging, lactate and diacetate, and background microflora. (J. Food Protection accepted – in press) 2008

52Slide #
Phase 4 TTD ModelingPhase 4 TTD Modeling
5 ml PDX-LIB
(CFU/25g)(g)
0.1815000.251000
12502.5100
No Size
0.55 g × 3
37 °C for 48 h
MOXagar
True positive = when at least two out of the three replicates showed confirmed presenceSampling frequency: 3 days (4 °C), 2 days (8 °C), and 1 day (12 °C) TTD = first out of three consecutive positive samples
~10 CFU (DUP-1044A)
Assumption 100 lb = 1000 g25 g = 0.55 g
+ + -

53Slide #
TTD (days) vs. Inoculum size (Ln NTTD (days) vs. Inoculum size (Ln Noo))
TTD = -3.95 ln(No) + 32.09R2 = 0.97
30.0
40.0
50.0
60.0
-5.50 -4.50 -3.50 -2.50
a
a
bb
TTD = -1.24 ln(No) + 1.92R2 = 0.89
0.0
2.0
4.0
6.0
8.0
10.0
-5.50 -4.50 -3.50 -2.50
aa
a
b
TTD = -0.62 ln(No) + 0.56R2 = 0.95
0.0
2.0
4.0
6.0
-5.50 -4.50 -3.50 -2.50
a a
abb
Observed TTDExpected TTD (Phase 2 data)Safe growth limit
4 °C 8 °C
12 °C
0.007 0.01 0.04 0.1 CFU/g
TTDs with common letter are not significantly different (P > 0.05) from pair-wise t-test

54Slide #
Shelf Life Model (TTD vs Temp.)Shelf Life Model (TTD vs Temp.)
TTD1 = 185.17e-0.34T
R2 = 0.96
TTD2 = 151.84e-0.38T
R2 = 0.93
1.0
10.0
100.0
2 4 6 8 10 12 14
Temperature (°C)
TTD
(day
s)0.1 CFU/g 0.04 CFU/g 0.01 CFU/g 0.007 CFU/g
)exp( bTShelfLifeShelfLife oT −=
)10exp(10 bTQ =
Guadagni, 1968; Labuza, 1972
47 days
23 days
6 days
3.4 days
Q10= 31
Q10= 24

55Slide #
PhasePhase 5 Findings5 FindingsSignificant difference between TTDs existed when the inoculum sizes differed by at least 2-log (P < 0.05) but followed expected pattern of log No vs time
The Q10 values for the TTD of Listeria shelf life plot ranged from 24 to 31 while lag and growth phase was about 7 in slurry and 4.6 on hotdog
Q10 values change with process, composition, matrix and packaging
We cannot design the proper safety tag without agreement on the right input data and would need a dual tag for safety & shelf life!

56Slide #
Micro-electronic TTI tag• Infratab (US) (www.infratab.com)
– Micro-electronic TTI integrator• RFID capability for traceability• US Patent # 5,442,669• ePC global compatible
– Possible to program for all 3 growth phases which one cannot do with chemical tag

57Slide #
References• Audits International/FDA. 2006. U.S. food temperature evaluation. Available at:
http://www.foodrisk.org/Audits-FDA_temp_study.htm. Accessed 12 June 2007.
• Center for Food Safety and Applied Nutrition, Food Safety and Inspection Service, Centers for Disease Control and Prevention. 2003. Quantitative assessment of the relative risk to public health from foodborne Listeria monocytogenes among selected categories of ready-to-eat foods. Washington, D.C.: U.S. Department of Health and Human Services and U.S. Department of Agriculture. Available at: http://www.foodsafety.gov/~dms/lmr2-toc.html. Accessed 12 June 2007.
• Mead, P. S., L. Slutsker, V. Dietz, L. F. McCaig, J. S. Bresee, C. Shapiro, P. M. Griffin, and R. V. Tauxe. 1999. Food-related illness and death in the United States. Emerg. Infect. Dis. 5:607-625.
• NACMSF. 2005. Considerations for establishing safety-based consume-by date labels for refrigerated ready-to-eat foods. J. Food Prot. 68:1761-1775.
• Pleasant, A.B., Soboleva, T.K., Dykes, G.A., Jones, R.J., and Filippov, A.E. 2001. Modelling of the growth of Listeria monocytogenes and a bacteriocin-producing strain of Lactobacillus in pure and mixed cultures. Food Microbiol. 18:605-615.
• Reddy, N. R., H. M. Solomon, and E. J. Rhodehamel. 1999. Comparison of margin of safety between sensory spoilage and onset of Clostridium botulinum toxin development during storage of modified atmosphere(MA)-packaged fresh marine cod fillets with MA-packaged aquacultured fish fillets. J. Food Saf. 19:171-183.
• USDA-FSIS. 2006. Consumer attitudes and behaviors regarding ready-to-eat foods. Available at: http://www.fsis.usda.gov/OPPDE/rdad/FRPubs/02-041N/conley_lm.htm. Accessed 12 June 2007.

58Slide #
ContactDr. Theodore LabuzaDepartment of Food Science and NutritionUniversity of [email protected] 612-624-9701 fax 651-483-3302 cell 651-307-2985http://www.ardilla.umn.edu/Ted_Labuza


