
Santa Barbara Coastal LTER &
California’s Marine Protected Areas
Dave Siegel
University of California, Santa Barbara
Santa Barbara Coastal LTER

Santa Barbara Coastal
Long Term Ecological Research
• ~ 10,000 km2
• Steep coastal mountains• Small estuaries• Shallow rocky reefs• Deep ocean basin• Offshore islands
• Mediterranean climate• Strong ENSO signal• Major biogeographic boundary

Giant Kelp Forests
• Worldwide distribution on shallow temperate reefs
• High productivity
• High species diversity
• Complex trophic interactions
• Biological habitat formation
• High economic importance

U.S. West Coast Rockfish
Source: Pacific Fisheries Management Council, 2001
0%
20%
40%
60%
80%
100%
120%
140%
1960 1965 1970 1975 1980 1985 1990 1995 2000
Year
widow
darkblotched
canary
bocaccio
cowcod
POP
unfished
overfishedthreshold
rebuildingtarget
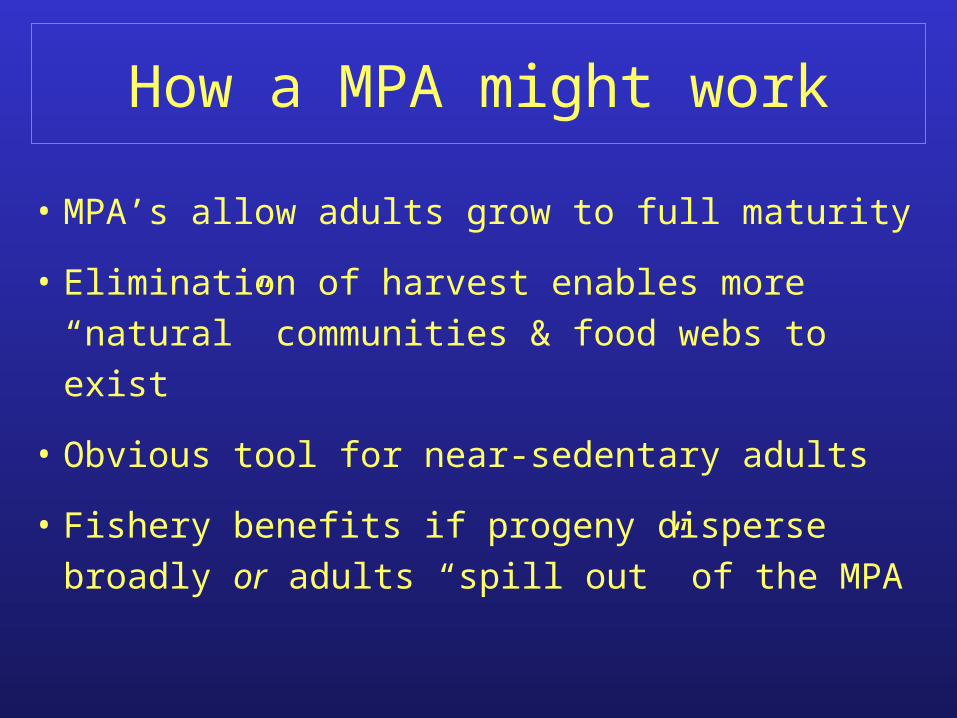
How a MPA might work
• MPA’s allow adults grow to full maturity
• Elimination of harvest enables more “natural” communities & food webs to exist
• Obvious tool for near-sedentary adults
• Fishery benefits if progeny disperse broadly or adults “spill out” of the MPA

Fished Organism Life Cycle is Important

How a MPA might work
Key: Spatial Management of a Fishery
Fish(x)MPA
Distance ->
Spillover

MPA’s Work WithinTheir
Borders
From Halpern [2002]

A Benefit of Getting Old & Fat

MPA’s in Channel Islands
• State-federal process to implement
Marine Protected Areas around the
Channel Island National Marine Sanctuary
• Stakeholder driven goals:
– protect biodiversity
– maintain fishery yields & incomes

Conservation vs. Fisheries
Valu
e
Fractional Set Aside
Conservation Goal
Fishery Goal
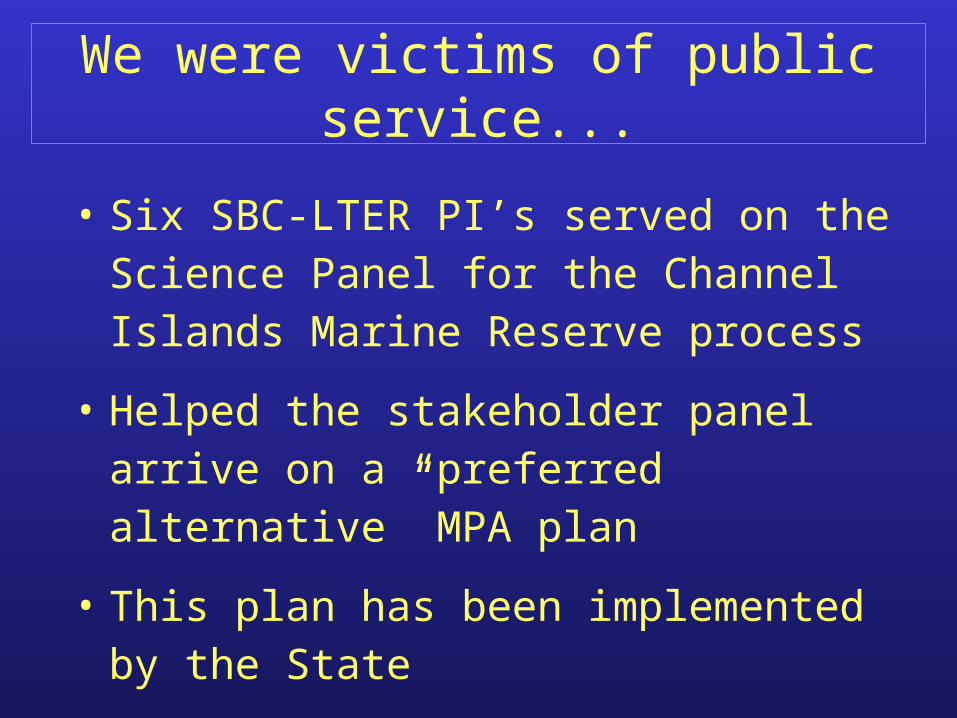
We were victims of public service...
• Six SBC-LTER PI’s served on the Science Panel for the Channel Islands Marine Reserve process
• Helped the stakeholder panel arrive on a “preferred alternative” MPA plan
• This plan has been implemented by the State

Approved Oct. 24, 2002 forstate waters
Federal approval in the works

What did/can SBC-LTER contribute??
• Local data & expertise
– SBC-LTER & partner program data
• Theoretical & synthetic analyses
– How big, how many, how connected?
– How hard will it be to assess MPA efficiency??
• Next steps
– Flow, Fish & Fishing (F3) Biocomplexity Project
– MLPA, California-wide MPA designation legislation

Kinlan & Gaines [2003; Ecology 84: 2007-2020].
Dispersal Scales for Marine Organisms

Larval Transport Modeling
• Provide a metric for source-to-destination exchanges among nearshore populations
• Incorporate important oceanographic & organism life history characteristics
• Constrain using easily obtained observations
• Useful for modeling spatial population dynamics
Siegel et al. [2003; Marine Ecology Progress Series 260: 83-96]

Larval Transport Modeling
Planktonic larval duration: 6 to 8 weeks
Flow Statistics: U = 5 cm/s, u = 15 cm/s
-600 -400 -200 0 200 400 600 800 10000
10
20
30
40
50
60
70
80
90
100
U = 5 ustd = 15 To = 42 T
f = 56
tota
l set
tlers
= 1
024
tot
al p
art
= 5
000
alongcoast (km) (a,b,c = 84.815 200.39 216.62)
N = 5000

Regional Scale Self Seeding
What fraction of larvae settle within a region of size L?
Will a MPA seed itself or its surroundings?
Scales as Dd/LDd
smallL large
Dd large
L small

A MPA will retain or export progeny based on the organism’s dispersion scale & the size of the MPA
Will a MPA Retain or Export??D
esig
n fo
rExport
Desi
gn
for
Con
serv
ati
on 50%
retention
Dd/L~0.5

Is a MPA a Source or Sink?
• A single MPA will be both a larval source &
sink
• Points to networks of reserves for
conservation
If MPA has L= 10 km, exports if Dd 5 km
Retains Exports

Reserve Networks
• Enable conservation & fisheries goals to be achieved simultaneously
• Reserves must not be spaced too far apart
Size --> adult movementSpacing --> larval
dispersal

Approved Oct. 24, 2002State waters implemented
Federal in the works

Larval Transport, Time & Fish Stock Uncertainty
• Larval dispersal calculated represents
ensemble mean conditions
• The implied time to construct this
mean estimate is ~20 years!!
– Assumes larval releases are daily & a
decorrelation time scale of 3 days

• Annual recruitment may be a small sampling of the kernel (N = 10?, or less!!)
– (300 releases / year) * (10% survival) / (3 day L)
• Example - intermediate disperser (N = 100)
Time, continued...
-100 -50 0 50 100 150 200 250 300 3500
0.2
0.4
0.6
0.8
1
1.2
1.4
1.6
1.8
2
U = 5 Ustd = 15 To = 14 Tf = 21
tota
l set
tlers
= 1
3 t
otal
par
t =
100
alongcoast (km)
• Implies that connections among sites are stochastic & intermittent
• Critical for assessing “MPA success” as a fishery tool
N=5000

160 180 200 220 240 260 280 300 3200
10
20
30
40
50
60
70
JD 2001
# se
ttle
rs/d
eplo
ymen
t
Ellwood Invert Setttlment Time Series
Mytilus Clams (excl razor & HIAARC) any marine snail (excl. veligers, limp)Limpet species Snail veliger any seastar Hiatella arctica
Time series sampling – t = 2 d
Invertebrate Settlement – SBC-LTER/PISCO

Interpreting Settlement Time Series
• Stochastic, quasi-random time series
• No correlation of settling among species
• Few settlement events for each species
• Events are short
(2 days)
160 180 200 220 240 260 280 300 3200
10
20
30
40
50
60
70
JD 2001
# s
ett
lers
/deplo
ym
ent
Ellwood Invert Setttlment Time Series
Mytilus Clams (excl razor & HIAARC) any marine snail (excl. veligers, limp)Limpet species Snail veliger any seastar Hiatella arctica

Implications for MPA Assessment
• MPA increases in fishery yields will be difficult to discern from inherent system variability
• A variable fishery response is expected
• Proper MPA assessment needs to be done over some long time (not really known yet)
• Need real predictive tools (including fishing
dynamics)
Flow, Fish & Fishing - www.icess.ucsb.edu/~davey/F_cubed
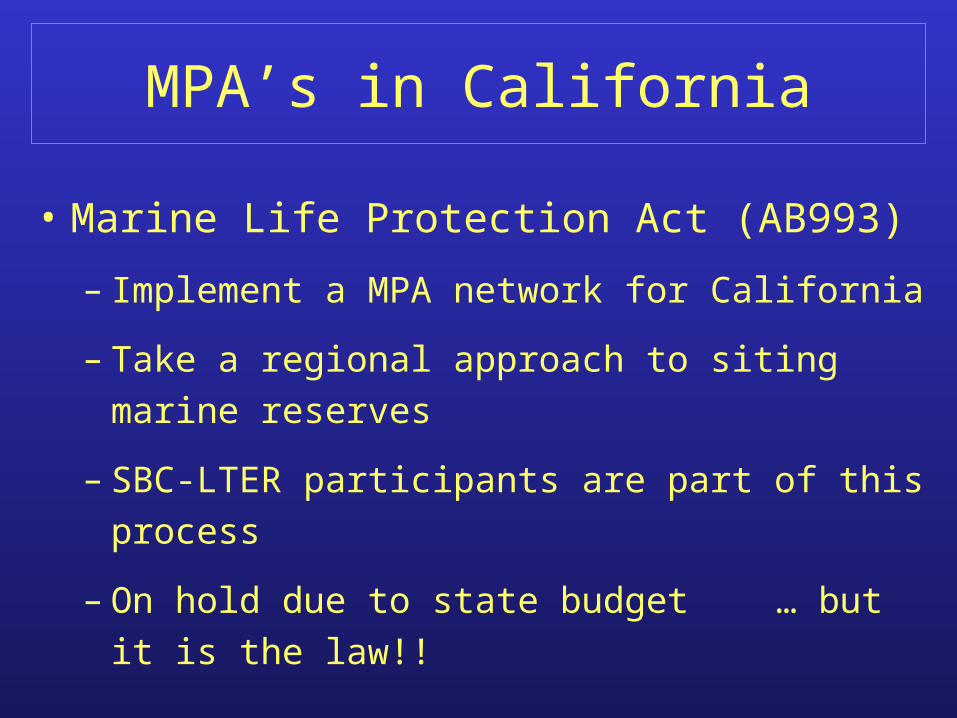
MPA’s in California
• Marine Life Protection Act (AB993)
– Implement a MPA network for California
– Take a regional approach to siting marine reserves
– SBC-LTER participants are part of this process
– On hold due to state budget … but it is the law!!

SBC-LTER & the MPA Process
• Theoretical & synthetic analyses for MPA
– How big, how many, how connected?
– Assessment of MPA efficiency??
• Other relevant SBC results for MLPA process
– Long-term observations of the kelp ecosystem
– Terrestrial inputs of nutrients, sediments, etc.
• Our forays into the world of “broader impacts” will continue throughout SBC’s lifespan

Thank You!!


