Delta Elementary Charter School
By February 1 of each year, every school in California is required by state law to publish a School Accountability Report Card (SARC).The SARC contains information aboutthe condit ion and performance of each California public school. Under the Local Control Funding Formula (LCFF) all local educat ional agencies (LEAs) are required toprepare a Local Control Accountability Plan (LCAP), which describes how they intend to meet annual school-specific goals for all pupils, w ith specific act ivit ies to addressstate and local priorit ies. Addit ionally, data reported in an LCAP is to be consistent w ith data reported in the SARC.
For more information about SARC requirements, see the California Department of Educat ion (CDE) SARC Web page at http://www.cde.ca.gov/ta/ac/sa/.
For more information about the LCFF or LCAP, see the CDE LCFF Web page at http://www.cde.ca.gov/fg/aa/lc/.
For addit ional information about the school, parents/guardians, and community members should contact the school principal or the district office.
DataQuest
Internet Access
California Department of Education
School Accountability Report CardReported Using Data from the 2014-15 School Year
Published During 2015-16
DataQuest is an online data tool located on the CDE DataQuest Web page that contains addit ional information about this school and comparisons of the school tothe district , the county, and the state. Specifically, DataQuest is a dynamic system that provides reports for accountability (e.g., test data, enrollment, highschool graduates, dropouts, course enrollments, staffing, and data regarding English learners.
Internet access is available at public libraries and other locat ions that are publicly accessible (e.g., the California State Library). Access to the Internet at librariesand public locat ions is generally provided on a first-come, first-served basis. Other use restrict ions may include the hours of operat ion, the length of t ime that aworkstat ion may be used (depending on availability), the types of software programs available on a workstat ion, and the ability to print documents.
Mrs. Vanessa BelairPrincipal, Delta Elementary Charter School
Delta Elementary Charter School (DECS) strives to cult ivate and grow Extraordinary Leaders and Scholars through acollaborat ive curlture and community. Our goal is for all students to “Achieve Greatness” through academic learning,school/community involvement, and personal growth. Delta Elementary Charter School offers an except ional educat ionalprogram of strong academic rigor that is balanced w ith outstanding student support and a w ide range of cross curricularand extracurricular opportunit ies. DECS has a talented faculty that works each day to foster advanced academic learningand promote social and emotional growth for all students. Our goal is to create a true home/school partnership to ensurethat all students, staff and families feel safe and welcome at DECS.
The DECS community encourages students and their families to get involved in our school. Parents make DECS a truecommunity and our volunteers make a difference on our campus. Our DECS staff and community members are committedto ensuring that all students have the best educat ional experience possible and are well prepared for success in thetwenty-first century.
We are a Project Based Learning school that truly takes advantage of our agricultural backyard. I encourage all interestedfamilies to call me direct ly to set up a tour of our school. I look forward to meeting you and your child in Clarksburg soon.
Delta Elementary Charter School 36230 North School St.Clarksburg, CA 95612
Phone: 916-744-1200E-mail: [email protected]
About Our SchoolAbout Our School
ContactContact

Last updated: 1/15/2016
Last updated: 1/15/2016
About This School
Contact Information - Most Recent YearContact Information - Most Recent Year
District Contact Information - Most Recent Year
District Name River Delta Joint Unified
Phone Number (707) 374-1700
Superintendent Don Beno
E-mail Address [email protected]
Web Site http://riverdelta.org
School Contact Information - Most Recent Year
School Name Delta Elementary Charter School
Street 36230 North School St.
City, State, Zip Clarksburg, Ca, 95612
Phone Number 916-744-1200
Principal Mrs. Vanessa Belair
E-mail Address [email protected]
Web Site www.deltacharter.org
County-District-School (CDS) Code
34674130114660
School Description and Mission Statement - Most Recent YearSchool Description and Mission Statement - Most Recent Year
The Mission Statement of Delta Elementary Charter School in Clarksburg is:“Growing Leaders and Scholars through Collaborat ive Culture and Community.”
The Core Values of Delta Elementary Charter School are:Posit ive Att itude: At DECS, we exemplify empathy and compassion. We assume posit ive intent and pride ourselves on having a posit ive out look and perspect ivedaily.
Self-Reflect ion: At DECS, we strive for cont inuous improvement through pract icing humility, listening act ively, having a w illingness to change, and speaking ourtruth.
Collaborat ion: At DECS, we work as a team to communicate w ith all stakeholders, build trust ing relat ionships, and engage in courageous conversat ions. We arevalued contributors who work together to develop and achieve common goals.
2014-15 SARC - Delta Elementary Charter School
Page 2 of 29
Last updated: 1/25/2016
Last updated: 1/25/2016
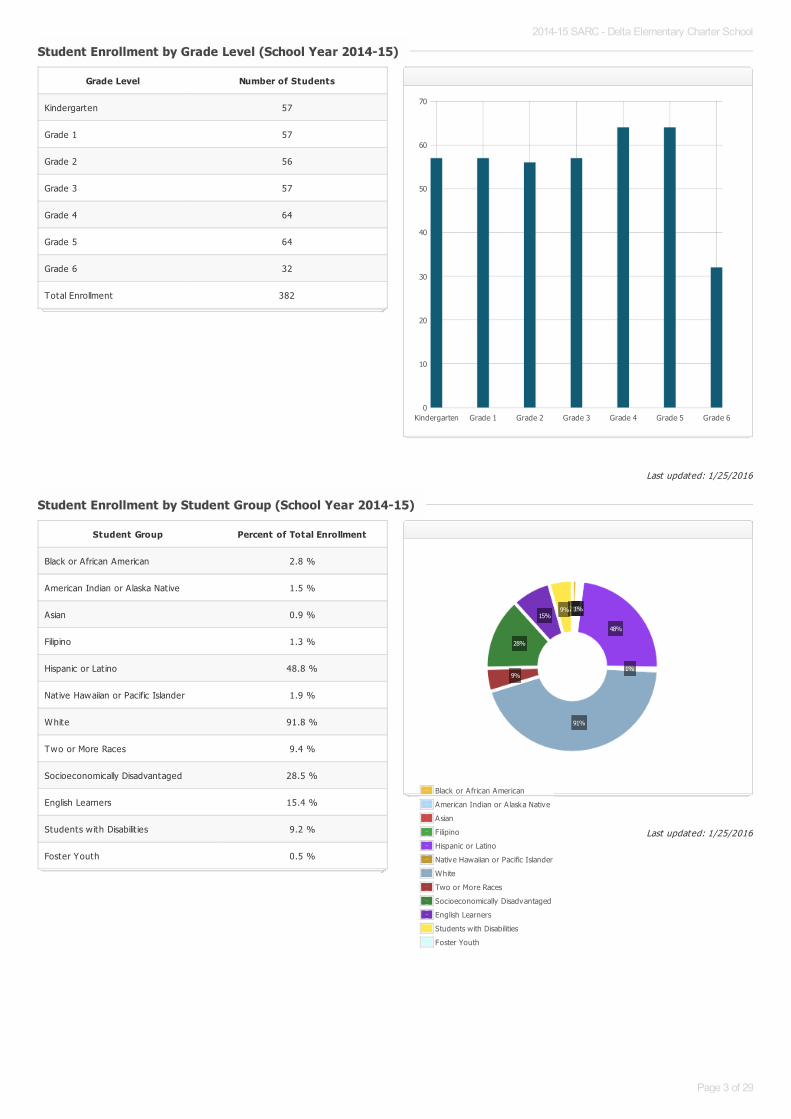
Student Enrollment by Grade Level (School Year 2014-15)Student Enrollment by Grade Level (School Year 2014-15)
Grade Level Number of Students
Kindergarten 57
Grade 1 57
Grade 2 56
Grade 3 57
Grade 4 64
Grade 5 64
Grade 6 32
Total Enrollment 382
Kindergarten Grade 1 Grade 2 Grade 3 Grade 4 Grade 5 Grade 60
10
20
30
40
50
60
70
Student Enrollment by Student Group (School Year 2014-15)Student Enrollment by Student Group (School Year 2014-15)
Student Group Percent of Total Enrollment
Black or African American 2.8 %
American Indian or Alaska Nat ive 1.5 %
Asian 0.9 %
Filipino 1.3 %
Hispanic or Lat ino 48.8 %
Native Hawaiian or Pacific Islander 1.9 %
White 91.8 %
Two or More Races 9.4 %
Socioeconomically Disadvantaged 28.5 %
English Learners 15.4 %
Students w ith Disabilit ies 9.2 %
Foster Youth 0.5 %
Black or African American
American Indian or A laska Native
Asian
Filipino
Hispanic or Latino
Native Hawaiian or Pacific Islander
White
Two or More Races
Socioeconomically Disadvantaged
English Learners
Students with Disabilities
Foster Youth
2%1%1%
48%
1%
91%
9%
28%
15%9%
2014-15 SARC - Delta Elementary Charter School
Page 3 of 29
Last updated: 1/25/2016
Last updated: 1/25/2016
A. Conditions of Learning
State Priority: Basic
The SARC provides the follow ing information relevant to the State priority: Basic (Priority 1):
Degree to which teachers are appropriately assigned and fully credent ialed in the subject area and for the pupils they are teaching;Pupils have access to standards-aligned instruct ional materials; andSchool facilit ies are maintained in good repair
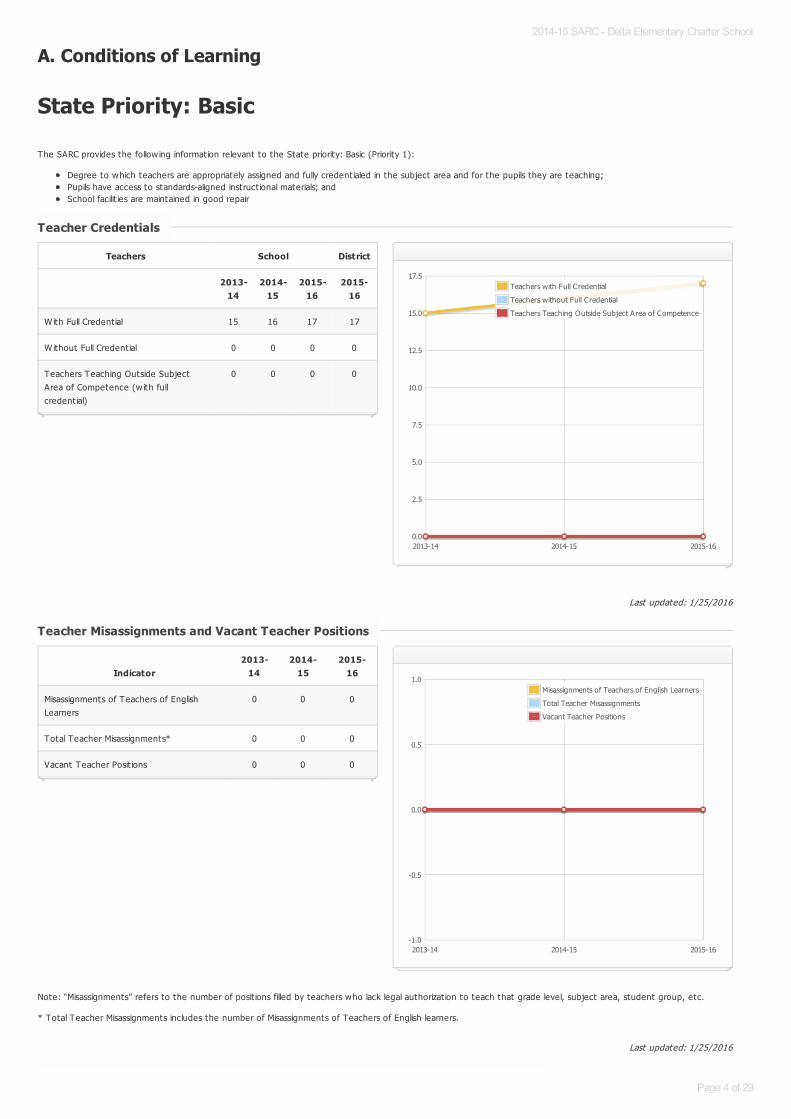
Note: “Misassignments” refers to the number of posit ions filled by teachers who lack legal authorizat ion to teach that grade level, subject area, student group, etc.
* Total Teacher Misassignments includes the number of Misassignments of Teachers of English learners.
Teacher CredentialsTeacher Credentials
Teachers School District
2013-14
2014-15
2015-16
2015-16
With Full Credent ial 15 16 17 17
Without Full Credent ial 0 0 0 0
Teachers Teaching Outside SubjectArea of Competence (w ith fullcredent ial)
0 0 0 0
2013-14 2014-15 2015-160.0
2.5
5.0
7.5
10.0
12.5
15.0
17.5Teachers with Full Credential
Teachers without Full Credential
Teachers Teaching Outside Subject Area of Competence
Teacher Misassignments and Vacant Teacher PositionsTeacher Misassignments and Vacant Teacher Positions
Indicator2013-
142014-
152015-
16
Misassignments of Teachers of EnglishLearners
0 0 0
Total Teacher Misassignments* 0 0 0
Vacant Teacher Posit ions 0 0 0
2013-14 2014-15 2015-16-1.0
-0.5
0.0
0.5
1.0Misassignments of Teachers of English Learners
Total Teacher Misassignments
Vacant Teacher Positions
2014-15 SARC - Delta Elementary Charter School
Page 4 of 29
Last updated: 1/25/2016
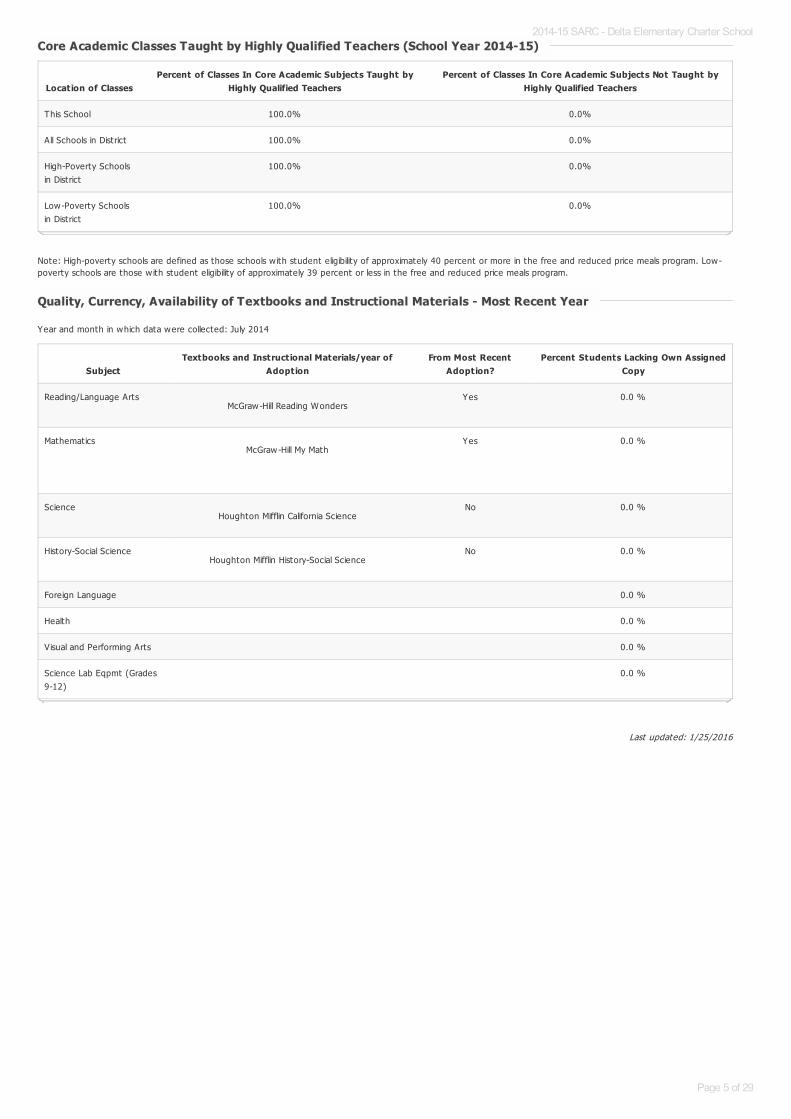
Note: High-poverty schools are defined as those schools w ith student eligibility of approximately 40 percent or more in the free and reduced price meals program. Low-poverty schools are those w ith student eligibility of approximately 39 percent or less in the free and reduced price meals program.
Year and month in which data were collected: July 2014
Core Academic Classes Taught by Highly Qualified Teachers (School Year 2014-15)Core Academic Classes Taught by Highly Qualified Teachers (School Year 2014-15)
Location of ClassesPercent of Classes In Core Academic Subjects Taught by
Highly Qualified TeachersPercent of Classes In Core Academic Subjects Not Taught by
Highly Qualified Teachers
This School 100.0% 0.0%
All Schools in District 100.0% 0.0%
High-Poverty Schoolsin District
100.0% 0.0%
Low-Poverty Schoolsin District
100.0% 0.0%
Quality, Currency, Availability of Textbooks and Instructional Materials - Most Recent YearQuality, Currency, Availability of Textbooks and Instructional Materials - Most Recent Year
SubjectTextbooks and Instructional Materials/year of
AdoptionFrom Most Recent
Adoption?Percent Students Lacking Own Assigned
Copy
Reading/Language ArtsMcGraw-Hill Reading Wonders
Yes 0.0 %
MathematicsMcGraw-Hill My Math
Yes 0.0 %
ScienceHoughton Mifflin California Science
No 0.0 %
History-Social ScienceHoughton Mifflin History-Social Science
No 0.0 %
Foreign Language 0.0 %
Health 0.0 %
Visual and Performing Arts 0.0 %
Science Lab Eqpmt (Grades9-12)
0.0 %
2014-15 SARC - Delta Elementary Charter School
Page 5 of 29
Last updated: 1/25/2016
Last updated: 1/25/2016
School Facility Good Repair Status - Most Recent YearYear and month in which data were collected: August 2014
Overall Facility Rate - Most Recent YearYear and month in which data were collected: August 2014
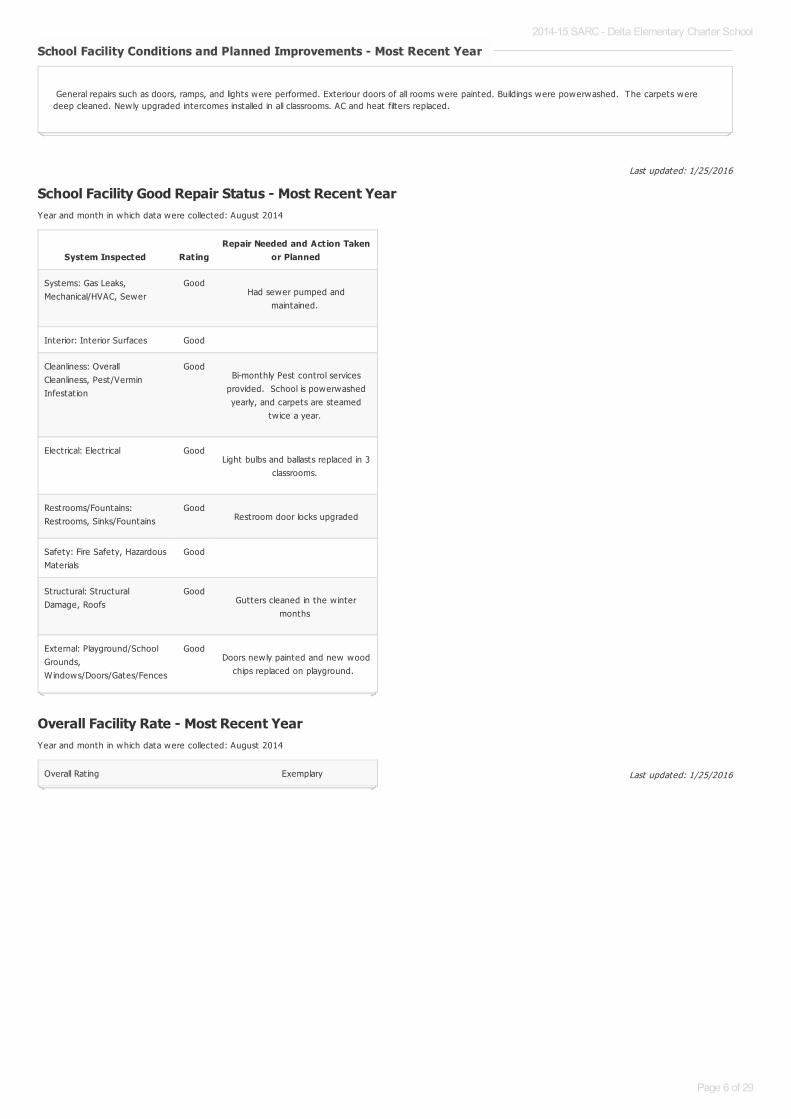
School Facility Conditions and Planned Improvements - Most Recent YearSchool Facility Conditions and Planned Improvements - Most Recent Year
General repairs such as doors, ramps, and lights were performed. Exteriour doors of all rooms were painted. Buildings were powerwashed. The carpets weredeep cleaned. Newly upgraded intercomes installed in all classrooms. AC and heat filters replaced.
System Inspected RatingRepair Needed and Action Taken
or Planned
Systems: Gas Leaks,Mechanical/HVAC, Sewer
GoodHad sewer pumped and
maintained.
Interior: Interior Surfaces Good
Cleanliness: OverallCleanliness, Pest/VerminInfestat ion
GoodBi-monthly Pest control services
provided. School is powerwashedyearly, and carpets are steamed
tw ice a year.
Electrical: Electrical GoodLight bulbs and ballasts replaced in 3
classrooms.
Restrooms/Fountains:Restrooms, Sinks/Fountains
GoodRestroom door locks upgraded
Safety: Fire Safety, HazardousMaterials
Good
Structural: StructuralDamage, Roofs
GoodGutters cleaned in the w inter
months
External: Playground/SchoolGrounds,W indows/Doors/Gates/Fences
GoodDoors newly painted and new wood
chips replaced on playground.
Overall Rat ing Exemplary
2014-15 SARC - Delta Elementary Charter School
Page 6 of 29
Last updated: 1/25/2016
B. Pupil Outcomes
State Priority: Pupil Achievement
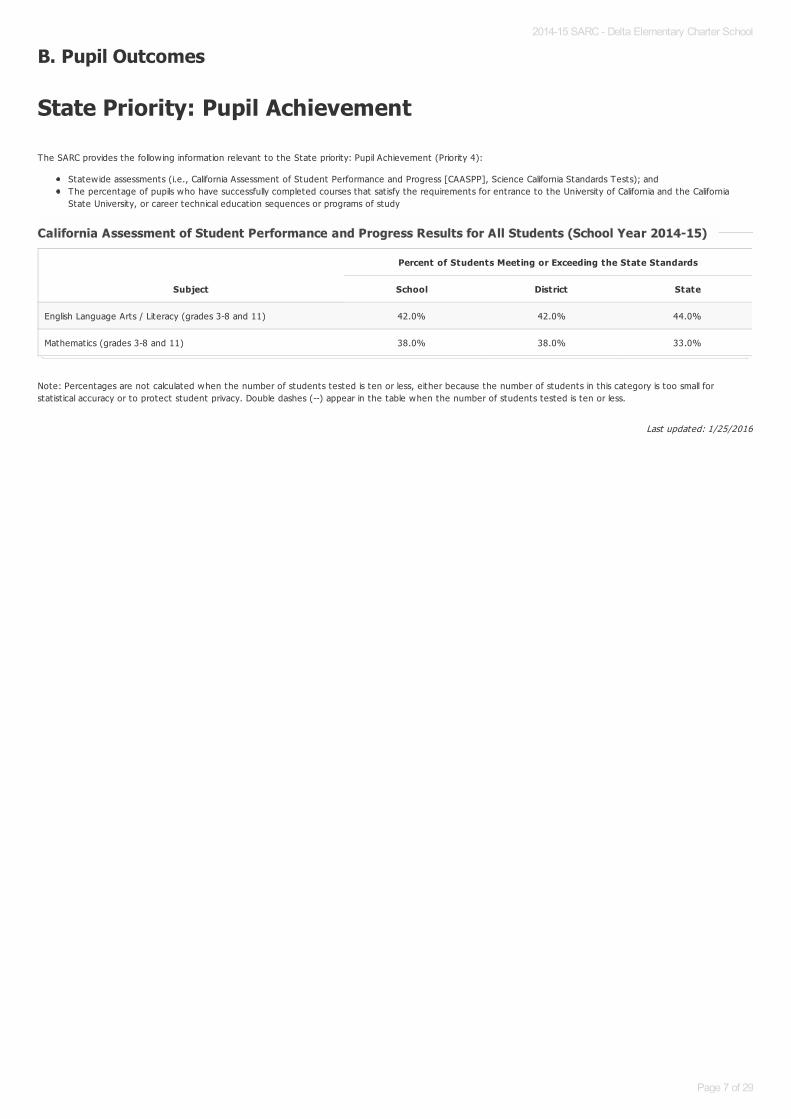
The SARC provides the follow ing information relevant to the State priority: Pupil Achievement (Priority 4):
Statew ide assessments (i.e., California Assessment of Student Performance and Progress [CAASPP], Science California Standards Tests); andThe percentage of pupils who have successfully completed courses that sat isfy the requirements for entrance to the University of California and the CaliforniaState University, or career technical educat ion sequences or programs of study
Note: Percentages are not calculated when the number of students tested is ten or less, either because the number of students in this category is too small forstat ist ical accuracy or to protect student privacy. Double dashes (--) appear in the table when the number of students tested is ten or less.
California Assessment of Student Performance and Progress Results for All Students (School Year 2014-15)California Assessment of Student Performance and Progress Results for All Students (School Year 2014-15)
Subject
Percent of Students Meeting or Exceeding the State Standards
School District State
English Language Arts / Literacy (grades 3-8 and 11) 42.0% 42.0% 44.0%
Mathematics (grades 3-8 and 11) 38.0% 38.0% 33.0%
2014-15 SARC - Delta Elementary Charter School
Page 7 of 29

Last updated: 1/26/2016
Double dashes (--) appear in the table when the number of students is ten or less, either because the number of students in this category is too small for stat ist icalaccuracy or to protect student privacy.
Note: The number of students tested includes students that did not receive a score; however the number of students tested is not the number that was used tocalculate the achievement level percentages. The achievement level percentages are calculated using students w ith scores.
* Level 1 = Standard not met Level 2 = Standard nearly met Level 3 = Standard met Level 4 = Standard exceeded
CAASPP Assessment Results - English Language Arts (ELA) CAASPP Assessment Results - English Language Arts (ELA)
Disaggregated by Student Groups, Grades Three through Eight and Eleven (School Year 2014-15)Disaggregated by Student Groups, Grades Three through Eight and Eleven (School Year 2014-15)
ELA - Grade 3ELA - Grade 3
Student GroupTotal
EnrollmentNumberTested
PercentTested
PercentAchievement
Level 1*
PercentAchievement
Level 2*
PercentAchievement
Level 3*
PercentAchievement
Level 4*
All Students 57 57 100.0% 21.0% 33.0% 32.0% 14.0%
Male 30 30 100.0% 20.0% 37.0% 30.0% 13.0%
Female 27 27 100.0% 22.0% 30.0% 33.0% 15.0%
Black or African American 1 1 100.0% 100.0% 0.0% 0.0% 0.0%
American Indian or Alaska Nat ive 0 0 0.0% 0.0% 0.0% 0.0% 0.0%
Asian 0 0 0.0% 0.0% 0.0% 0.0% 0.0%
Filipino 0 0 0.0% 0.0% 0.0% 0.0% 0.0%
Hispanic or Lat ino 22 22 100.0% 27.0% 36.0% 27.0% 9.0%
Native Hawaiian or Pacific Islander 0 0 0.0% 0.0% 0.0% 0.0% 0.0%
White 28 28 100.0% 18.0% 32.0% 36.0% 14.0%
Two or More Races 6 6 100.0% 0.0% 33.0% 33.0% 33.0%
Socioeconomically Disadvantaged 12 12 100.0% 42.0% 25.0% 25.0% 8.0%
English Learners 7 7 100.0% 57.0% 29.0% 14.0% 0.0%
Students w ith Disabilit ies 4 4 100.0% 25.0% 75.0% 0.0% 0.0%
Students Receiving MigrantEducat ion Services
1 1 100.0% 100.0% 0.0% 0.0% 0.0%
Foster Youth 0 0 0.0% 0.0% 0.0% 0.0% 0.0%
2014-15 SARC - Delta Elementary Charter School
Page 8 of 29
Last updated: 1/26/2016
Double dashes (--) appear in the table when the number of students is ten or less, either because the number of students in this category is too small for stat ist icalaccuracy or to protect student privacy.
Note: The number of students tested includes students that did not receive a score; however the number of students tested is not the number that was used tocalculate the achievement level percentages. The achievement level percentages are calculated using students w ith scores.
* Level 1 = Standard not met Level 2 = Standard nearly met Level 3 = Standard met Level 4 = Standard exceeded
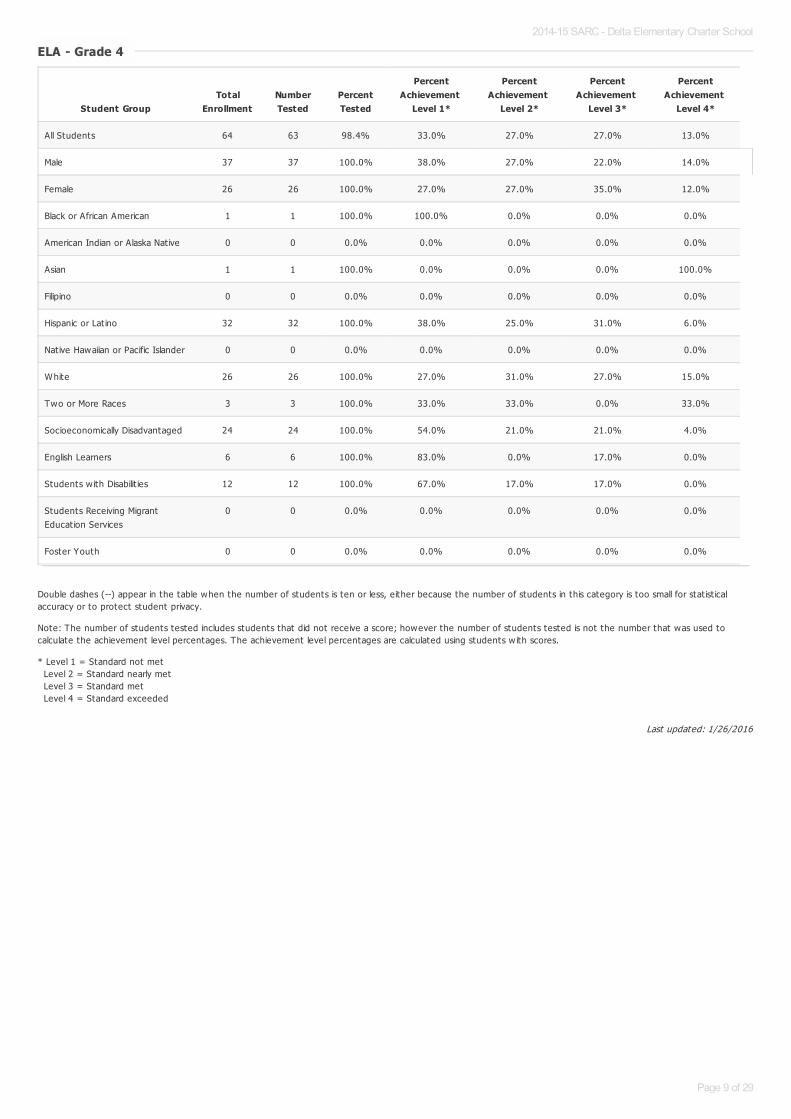
ELA - Grade 4ELA - Grade 4
Student GroupTotal
EnrollmentNumberTested
PercentTested
PercentAchievement
Level 1*
PercentAchievement
Level 2*
PercentAchievement
Level 3*
PercentAchievement
Level 4*
All Students 64 63 98.4% 33.0% 27.0% 27.0% 13.0%
Male 37 37 100.0% 38.0% 27.0% 22.0% 14.0%
Female 26 26 100.0% 27.0% 27.0% 35.0% 12.0%
Black or African American 1 1 100.0% 100.0% 0.0% 0.0% 0.0%
American Indian or Alaska Nat ive 0 0 0.0% 0.0% 0.0% 0.0% 0.0%
Asian 1 1 100.0% 0.0% 0.0% 0.0% 100.0%
Filipino 0 0 0.0% 0.0% 0.0% 0.0% 0.0%
Hispanic or Lat ino 32 32 100.0% 38.0% 25.0% 31.0% 6.0%
Native Hawaiian or Pacific Islander 0 0 0.0% 0.0% 0.0% 0.0% 0.0%
White 26 26 100.0% 27.0% 31.0% 27.0% 15.0%
Two or More Races 3 3 100.0% 33.0% 33.0% 0.0% 33.0%
Socioeconomically Disadvantaged 24 24 100.0% 54.0% 21.0% 21.0% 4.0%
English Learners 6 6 100.0% 83.0% 0.0% 17.0% 0.0%
Students w ith Disabilit ies 12 12 100.0% 67.0% 17.0% 17.0% 0.0%
Students Receiving MigrantEducat ion Services
0 0 0.0% 0.0% 0.0% 0.0% 0.0%
Foster Youth 0 0 0.0% 0.0% 0.0% 0.0% 0.0%
2014-15 SARC - Delta Elementary Charter School
Page 9 of 29

Last updated: 1/26/2016
Double dashes (--) appear in the table when the number of students is ten or less, either because the number of students in this category is too small for stat ist icalaccuracy or to protect student privacy.
Note: The number of students tested includes students that did not receive a score; however the number of students tested is not the number that was used tocalculate the achievement level percentages. The achievement level percentages are calculated using students w ith scores.
* Level 1 = Standard not met Level 2 = Standard nearly met Level 3 = Standard met Level 4 = Standard exceeded
ELA - Grade 5ELA - Grade 5
Student GroupTotal
EnrollmentNumberTested
PercentTested
PercentAchievement
Level 1*
PercentAchievement
Level 2*
PercentAchievement
Level 3*
PercentAchievement
Level 4*
All Students 64 63 98.4% 38.0% 16.0% 30.0% 16.0%
Male 30 30 100.0% 40.0% 17.0% 33.0% 10.0%
Female 33 33 100.0% 36.0% 15.0% 27.0% 21.0%
Black or African American 2 2 100.0% 100.0% 0.0% 0.0% 0.0%
American Indian or Alaska Nat ive 0 0 0.0% 0.0% 0.0% 0.0% 0.0%
Asian 0 0 0.0% 0.0% 0.0% 0.0% 0.0%
Filipino 0 0 0.0% 0.0% 0.0% 0.0% 0.0%
Hispanic or Lat ino 22 22 100.0% 55.0% 23.0% 14.0% 9.0%
Native Hawaiian or Pacific Islander 0 0 0.0% 0.0% 0.0% 0.0% 0.0%
White 35 35 100.0% 29.0% 14.0% 40.0% 17.0%
Two or More Races 4 4 100.0% 0.0% 0.0% 50.0% 50.0%
Socioeconomically Disadvantaged 19 19 100.0% 37.0% 26.0% 32.0% 5.0%
English Learners 10 10 100.0% 60.0% 10.0% 20.0% 10.0%
Students w ith Disabilit ies 8 8 100.0% 100.0% 0.0% 0.0% 0.0%
Students Receiving MigrantEducat ion Services
1 1 100.0% 0.0% 0.0% 0.0% 100.0%
Foster Youth 0 0 0.0% 0.0% 0.0% 0.0% 0.0%
2014-15 SARC - Delta Elementary Charter School
Page 10 of 29

Last updated: 1/26/2016
Double dashes (--) appear in the table when the number of students is ten or less, either because the number of students in this category is too small for stat ist icalaccuracy or to protect student privacy.
Note: The number of students tested includes students that did not receive a score; however the number of students tested is not the number that was used tocalculate the achievement level percentages. The achievement level percentages are calculated using students w ith scores.
* Level 1 = Standard not met Level 2 = Standard nearly met Level 3 = Standard met Level 4 = Standard exceeded
ELA- ELA- Grade 6Grade 6
Student GroupTotal
EnrollmentNumberTested
PercentTested
PercentAchievement
Level 1*
PercentAchievement
Level 2*
PercentAchievement
Level 3*
PercentAchievement
Level 4*
All Students 32 31 96.8% 29.0% 35.0% 26.0% 10.0%
Male 15 15 100.0% 40.0% 33.0% 13.0% 13.0%
Female 16 16 100.0% 19.0% 38.0% 38.0% 6.0%
Black or African American 1 1 100.0% 0.0% 0.0% 100.0% 0.0%
American Indian or Alaska Nat ive 0 0 0.0% 0.0% 0.0% 0.0% 0.0%
Asian 0 0 0.0% 0.0% 0.0% 0.0% 0.0%
Filipino 0 0 0.0% 0.0% 0.0% 0.0% 0.0%
Hispanic or Lat ino 11 11 100.0% 45.0% 45.0% 9.0% 0.0%
Native Hawaiian or Pacific Islander 0 0 0.0% 0.0% 0.0% 0.0% 0.0%
White 18 18 100.0% 22.0% 28.0% 33.0% 17.0%
Two or More Races 1 1 100.0% 0.0% 100.0% 0.0% 0.0%
Socioeconomically Disadvantaged 13 13 100.0% 31.0% 38.0% 23.0% 8.0%
English Learners 5 5 100.0% 80.0% 20.0% 0.0% 0.0%
Students w ith Disabilit ies 1 1 100.0% 0.0% 100.0% 0.0% 0.0%
Students Receiving MigrantEducat ion Services
1 1 100.0% 100.0% 0.0% 0.0% 0.0%
Foster Youth 0 0 0.0% 0.0% 0.0% 0.0% 0.0%
2014-15 SARC - Delta Elementary Charter School
Page 11 of 29

Last updated: 1/26/2016
Double dashes (--) appear in the table when the number of students is ten or less, either because the number of students in this category is too small for stat ist icalaccuracy or to protect student privacy.
Note: The number of students tested includes students that did not receive a score; however the number of students tested is not the number that was used tocalculate the achievement level percentages. The achievement level percentages are calculated using students w ith scores.
* Level 1 = Standard not met Level 2 = Standard nearly met Level 3 = Standard met Level 4 = Standard exceeded
ELA - Grade 7ELA - Grade 7
Student GroupTotal
EnrollmentNumberTested
PercentTested
PercentAchievement
Level 1*
PercentAchievement
Level 2*
PercentAchievement
Level 3*
PercentAchievement
Level 4*
All Students 0 0 0.0% 0.0% 0.0% 0.0% 0.0%
Male 0 0 0.0% 0.0% 0.0% 0.0% 0.0%
Female 0 0 0.0% 0.0% 0.0% 0.0% 0.0%
Black or African American 0 0 0.0% 0.0% 0.0% 0.0% 0.0%
American Indian or Alaska Nat ive 0 0 0.0% 0.0% 0.0% 0.0% 0.0%
Asian 0 0 0.0% 0.0% 0.0% 0.0% 0.0%
Filipino 0 0 0.0% 0.0% 0.0% 0.0% 0.0%
Hispanic or Lat ino 0 0 0.0% 0.0% 0.0% 0.0% 0.0%
Native Hawaiian or Pacific Islander 0 0 0.0% 0.0% 0.0% 0.0% 0.0%
White 0 0 0.0% 0.0% 0.0% 0.0% 0.0%
Two or More Races 0 0 0.0% 0.0% 0.0% 0.0% 0.0%
Socioeconomically Disadvantaged 0 0 0.0% 0.0% 0.0% 0.0% 0.0%
English Learners 0 0 0.0% 0.0% 0.0% 0.0% 0.0%
Students w ith Disabilit ies 0 0 0.0% 0.0% 0.0% 0.0% 0.0%
Students Receiving MigrantEducat ion Services
0 0 0.0% 0.0% 0.0% 0.0% 0.0%
Foster Youth 0 0 0.0% 0.0% 0.0% 0.0% 0.0%
2014-15 SARC - Delta Elementary Charter School
Page 12 of 29

Last updated: 1/26/2016
Double dashes (--) appear in the table when the number of students is ten or less, either because the number of students in this category is too small for stat ist icalaccuracy or to protect student privacy.
Note: The number of students tested includes students that did not receive a score; however the number of students tested is not the number that was used tocalculate the achievement level percentages. The achievement level percentages are calculated using students w ith scores.
* Level 1 = Standard not met Level 2 = Standard nearly met Level 3 = Standard met Level 4 = Standard exceeded
ELA - Grade 8ELA - Grade 8
Student GroupTotal
EnrollmentNumberTested
PercentTested
PercentAchievement
Level 1*
PercentAchievement
Level 2*
PercentAchievement
Level 3*
PercentAchievement
Level 4*
All Students 0 0 0.0% 0.0% 0.0% 0.0% 0.0%
Male 0 0 0.0% 0.0% 0.0% 0.0% 0.0%
Female 0 0 0.0% 0.0% 0.0% 0.0% 0.0%
Black or African American 0 0 0.0% 0.0% 0.0% 0.0% 0.0%
American Indian or Alaska Nat ive 0 0 0.0% 0.0% 0.0% 0.0% 0.0%
Asian 0 0 0.0% 0.0% 0.0% 0.0% 0.0%
Filipino 0 0 0.0% 0.0% 0.0% 0.0% 0.0%
Hispanic or Lat ino 0 0 0.0% 0.0% 0.0% 0.0% 0.0%
Native Hawaiian or Pacific Islander 0 0 0.0% 0.0% 0.0% 0.0% 0.0%
White 0 0 0.0% 0.0% 0.0% 0.0% 0.0%
Two or More Races 0 0 0.0% 0.0% 0.0% 0.0% 0.0%
Socioeconomically Disadvantaged 0 0 0.0% 0.0% 0.0% 0.0% 0.0%
English Learners 0 0 0.0% 0.0% 0.0% 0.0% 0.0%
Students w ith Disabilit ies 0 0 0.0% 0.0% 0.0% 0.0% 0.0%
Students Receiving MigrantEducat ion Services
0 0 0.0% 0.0% 0.0% 0.0% 0.0%
Foster Youth 0 0 0.0% 0.0% 0.0% 0.0% 0.0%
2014-15 SARC - Delta Elementary Charter School
Page 13 of 29
Last updated: 1/26/2016
Double dashes (--) appear in the table when the number of students is ten or less, either because the number of students in this category is too small for stat ist icalaccuracy or to protect student privacy.
Note: The number of students tested includes students that did not receive a score; however the number of students tested is not the number that was used tocalculate the achievement level percentages. The achievement level percentages are calculated using students w ith scores.
* Level 1 = Standard not met Level 2 = Standard nearly met Level 3 = Standard met Level 4 = Standard exceeded
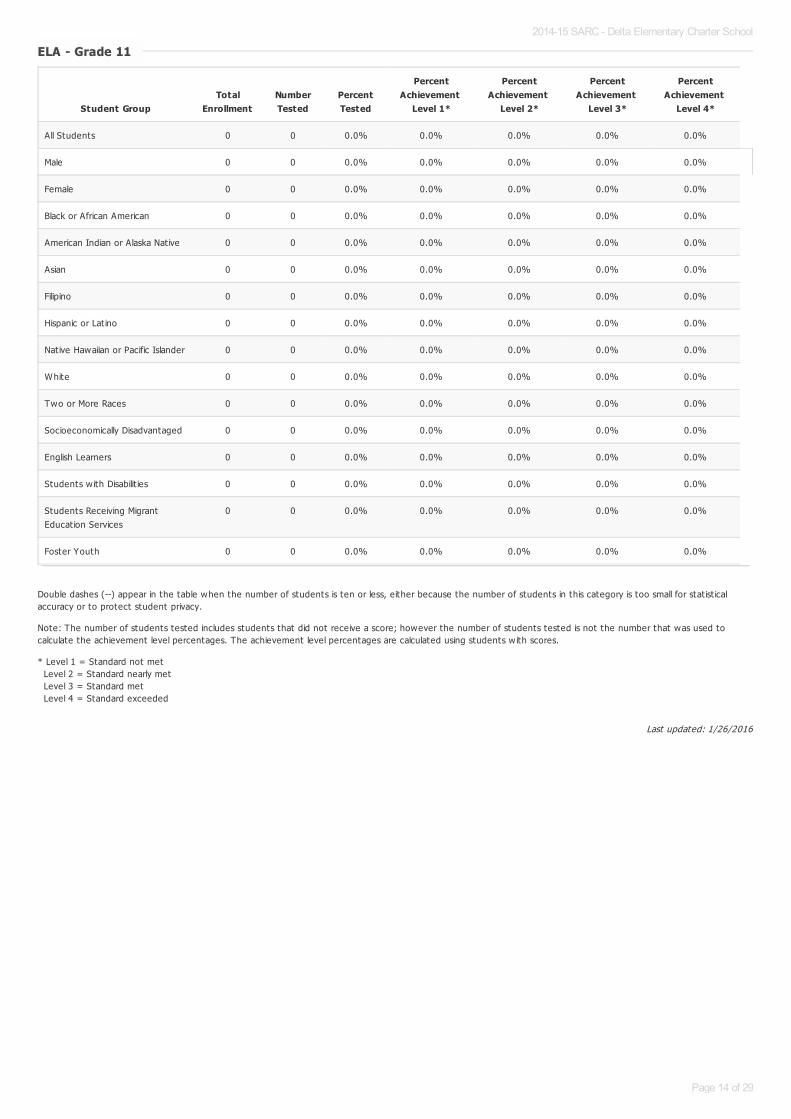
ELA - Grade 11ELA - Grade 11
Student GroupTotal
EnrollmentNumberTested
PercentTested
PercentAchievement
Level 1*
PercentAchievement
Level 2*
PercentAchievement
Level 3*
PercentAchievement
Level 4*
All Students 0 0 0.0% 0.0% 0.0% 0.0% 0.0%
Male 0 0 0.0% 0.0% 0.0% 0.0% 0.0%
Female 0 0 0.0% 0.0% 0.0% 0.0% 0.0%
Black or African American 0 0 0.0% 0.0% 0.0% 0.0% 0.0%
American Indian or Alaska Nat ive 0 0 0.0% 0.0% 0.0% 0.0% 0.0%
Asian 0 0 0.0% 0.0% 0.0% 0.0% 0.0%
Filipino 0 0 0.0% 0.0% 0.0% 0.0% 0.0%
Hispanic or Lat ino 0 0 0.0% 0.0% 0.0% 0.0% 0.0%
Native Hawaiian or Pacific Islander 0 0 0.0% 0.0% 0.0% 0.0% 0.0%
White 0 0 0.0% 0.0% 0.0% 0.0% 0.0%
Two or More Races 0 0 0.0% 0.0% 0.0% 0.0% 0.0%
Socioeconomically Disadvantaged 0 0 0.0% 0.0% 0.0% 0.0% 0.0%
English Learners 0 0 0.0% 0.0% 0.0% 0.0% 0.0%
Students w ith Disabilit ies 0 0 0.0% 0.0% 0.0% 0.0% 0.0%
Students Receiving MigrantEducat ion Services
0 0 0.0% 0.0% 0.0% 0.0% 0.0%
Foster Youth 0 0 0.0% 0.0% 0.0% 0.0% 0.0%
2014-15 SARC - Delta Elementary Charter School
Page 14 of 29

Last updated: 1/26/2016
Double dashes (--) appear in the table when the number of students is ten or less, either because the number of students in this category is too small for stat ist icalaccuracy or to protect student privacy.
Note: The number of students tested includes students that did not receive a score; however the number of students tested is not the number that was used tocalculate the achievement level percentages. The achievement level percentages are calculated using students w ith scores.
* Level 1 = Standard not met Level 2 = Standard nearly met Level 3 = Standard met Level 4 = Standard exceeded
CAASPP Assessment Results - Mathematics CAASPP Assessment Results - Mathematics
Disaggregated by Student Groups, Grades Three through Eight and Eleven (School Year 2014-15)Disaggregated by Student Groups, Grades Three through Eight and Eleven (School Year 2014-15)
Mathematics - Grade 3Mathematics - Grade 3
Student GroupTotal
EnrollmentNumberTested
PercentTested
PercentAchievement
Level 1*
PercentAchievement
Level 2*
PercentAchievement
Level 3*
PercentAchievement
Level 4*
All Students 57 57 100.0% 11.0% 44.0% 33.0% 12.0%
Male 30 30 100.0% 13.0% 40.0% 33.0% 13.0%
Female 27 27 100.0% 7.0% 48.0% 33.0% 11.0%
Black or African American 1 1 100.0% 0.0% 100.0% 0.0% 0.0%
American Indian or Alaska Nat ive 0 0 0.0% 0.0% 0.0% 0.0% 0.0%
Asian 0 0 0.0% 0.0% 0.0% 0.0% 0.0%
Filipino 0 0 0.0% 0.0% 0.0% 0.0% 0.0%
Hispanic or Lat ino 22 22 100.0% 14.0% 50.0% 27.0% 9.0%
Native Hawaiian or Pacific Islander 0 0 0.0% 0.0% 0.0% 0.0% 0.0%
White 28 28 100.0% 11.0% 36.0% 39.0% 14.0%
Two or More Races 6 6 100.0% 0.0% 50.0% 33.0% 17.0%
Socioeconomically Disadvantaged 12 12 100.0% 25.0% 50.0% 25.0% 0.0%
English Learners 7 7 100.0% 43.0% 14.0% 43.0% 0.0%
Students w ith Disabilit ies 4 4 100.0% 25.0% 50.0% 25.0% 0.0%
Students Receiving MigrantEducat ion Services
1 1 100.0% 100.0% 0.0% 0.0% 0.0%
Foster Youth 0 0 0.0% 0.0% 0.0% 0.0% 0.0%
2014-15 SARC - Delta Elementary Charter School
Page 15 of 29

Last updated: 1/26/2016
Double dashes (--) appear in the table when the number of students is ten or less, either because the number of students in this category is too small for stat ist icalaccuracy or to protect student privacy.
Note: The number of students tested includes students that did not receive a score; however the number of students tested is not the number that was used tocalculate the achievement level percentages. The achievement level percentages are calculated using students w ith scores.
* Level 1 = Standard not met Level 2 = Standard nearly met Level 3 = Standard met Level 4 = Standard exceeded
Mathematics - Grade 4Mathematics - Grade 4
Student GroupTotal
EnrollmentNumberTested
PercentTested
PercentAchievement
Level 1*
PercentAchievement
Level 2*
PercentAchievement
Level 3*
PercentAchievement
Level 4*
All Students 64 63 98.4% 14.0% 49.0% 27.0% 10.0%
Male 37 37 100.0% 11.0% 54.0% 24.0% 11.0%
Female 26 26 100.0% 19.0% 42.0% 31.0% 8.0%
Black or African American 1 1 100.0% 100.0% 0.0% 0.0% 0.0%
American Indian or Alaska Nat ive 0 0 0.0% 0.0% 0.0% 0.0% 0.0%
Asian 1 1 100.0% 0.0% 0.0% 0.0% 100.0%
Filipino 0 0 0.0% 0.0% 0.0% 0.0% 0.0%
Hispanic or Lat ino 32 32 100.0% 25.0% 41.0% 31.0% 3.0%
Native Hawaiian or Pacific Islander 0 0 0.0% 0.0% 0.0% 0.0% 0.0%
White 26 26 100.0% 4.0% 58.0% 27.0% 12.0%
Two or More Races 3 3 100.0% 0.0% 67.0% 0.0% 33.0%
Socioeconomically Disadvantaged 24 24 100.0% 38.0% 46.0% 17.0% 0.0%
English Learners 6 6 100.0% 67.0% 33.0% 0.0% 0.0%
Students w ith Disabilit ies 12 12 100.0% 17.0% 58.0% 25.0% 0.0%
Students Receiving MigrantEducat ion Services
0 0 0.0% 0.0% 0.0% 0.0% 0.0%
Foster Youth 0 0 0.0% 0.0% 0.0% 0.0% 0.0%
2014-15 SARC - Delta Elementary Charter School
Page 16 of 29
Last updated: 1/26/2016
Double dashes (--) appear in the table when the number of students is ten or less, either because the number of students in this category is too small for stat ist icalaccuracy or to protect student privacy.
Note: The number of students tested includes students that did not receive a score; however the number of students tested is not the number that was used tocalculate the achievement level percentages. The achievement level percentages are calculated using students w ith scores.
* Level 1 = Standard not met Level 2 = Standard nearly met Level 3 = Standard met Level 4 = Standard exceeded
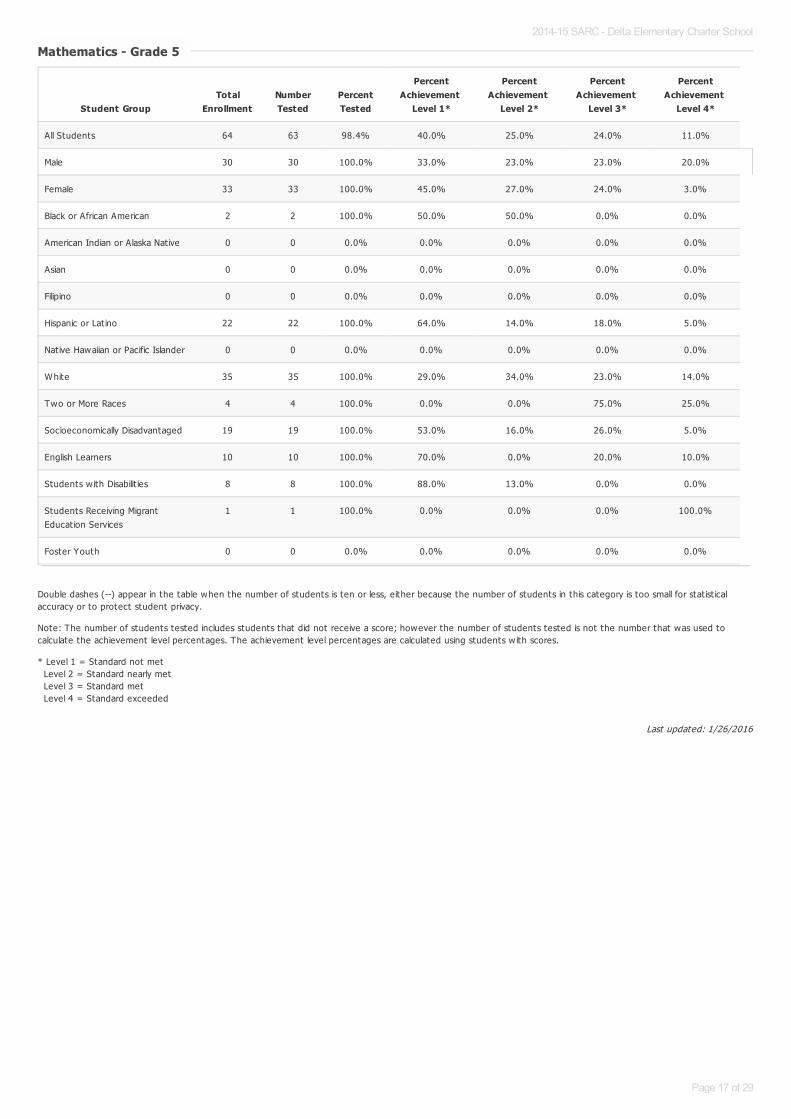
Mathematics - Grade 5Mathematics - Grade 5
Student GroupTotal
EnrollmentNumberTested
PercentTested
PercentAchievement
Level 1*
PercentAchievement
Level 2*
PercentAchievement
Level 3*
PercentAchievement
Level 4*
All Students 64 63 98.4% 40.0% 25.0% 24.0% 11.0%
Male 30 30 100.0% 33.0% 23.0% 23.0% 20.0%
Female 33 33 100.0% 45.0% 27.0% 24.0% 3.0%
Black or African American 2 2 100.0% 50.0% 50.0% 0.0% 0.0%
American Indian or Alaska Nat ive 0 0 0.0% 0.0% 0.0% 0.0% 0.0%
Asian 0 0 0.0% 0.0% 0.0% 0.0% 0.0%
Filipino 0 0 0.0% 0.0% 0.0% 0.0% 0.0%
Hispanic or Lat ino 22 22 100.0% 64.0% 14.0% 18.0% 5.0%
Native Hawaiian or Pacific Islander 0 0 0.0% 0.0% 0.0% 0.0% 0.0%
White 35 35 100.0% 29.0% 34.0% 23.0% 14.0%
Two or More Races 4 4 100.0% 0.0% 0.0% 75.0% 25.0%
Socioeconomically Disadvantaged 19 19 100.0% 53.0% 16.0% 26.0% 5.0%
English Learners 10 10 100.0% 70.0% 0.0% 20.0% 10.0%
Students w ith Disabilit ies 8 8 100.0% 88.0% 13.0% 0.0% 0.0%
Students Receiving MigrantEducat ion Services
1 1 100.0% 0.0% 0.0% 0.0% 100.0%
Foster Youth 0 0 0.0% 0.0% 0.0% 0.0% 0.0%
2014-15 SARC - Delta Elementary Charter School
Page 17 of 29

Last updated: 1/26/2016
Double dashes (--) appear in the table when the number of students is ten or less, either because the number of students in this category is too small for stat ist icalaccuracy or to protect student privacy.
Note: The number of students tested includes students that did not receive a score; however the number of students tested is not the number that was used tocalculate the achievement level percentages. The achievement level percentages are calculated using students w ith scores.
* Level 1 = Standard not met Level 2 = Standard nearly met Level 3 = Standard met Level 4 = Standard exceeded
Mathematics - Grade 6Mathematics - Grade 6
Student GroupTotal
EnrollmentNumberTested
PercentTested
PercentAchievement
Level 1*
PercentAchievement
Level 2*
PercentAchievement
Level 3*
PercentAchievement
Level 4*
All Students 32 31 96.9% 26.0% 42.0% 6.0% 26.0%
Male 15 15 100.0% 27.0% 47.0% 7.0% 20.0%
Female 16 16 100.0% 25.0% 38.0% 6.0% 31.0%
Black or African American 1 1 100.0% 0.0% 0.0% 100.0% 0.0%
American Indian or Alaska Nat ive 0 0 0.0% 0.0% 0.0% 0.0% 0.0%
Asian 0 0 0.0% 0.0% 0.0% 0.0% 0.0%
Filipino 0 0 0.0% 0.0% 0.0% 0.0% 0.0%
Hispanic or Lat ino 11 11 100.0% 36.0% 45.0% 0.0% 18.0%
Native Hawaiian or Pacific Islander 0 0 0.0% 0.0% 0.0% 0.0% 0.0%
White 18 18 100.0% 22.0% 39.0% 6.0% 33.0%
Two or More Races 1 1 100.0% 0.0% 100.0% 0.0% 0.0%
Socioeconomically Disadvantaged 13 13 100.0% 23.0% 38.0% 8.0% 31.0%
English Learners 5 5 100.0% 60.0% 40.0% 0.0% 0.0%
Students w ith Disabilit ies 1 1 100.0% 0.0% 100.0% 0.0% 0.0%
Students Receiving MigrantEducat ion Services
1 1 100.0% 0.0% 100.0% 0.0% 0.0%
Foster Youth 0 0 0.0% 0.0% 0.0% 0.0% 0.0%
2014-15 SARC - Delta Elementary Charter School
Page 18 of 29
Last updated: 1/26/2016
Double dashes (--) appear in the table when the number of students is ten or less, either because the number of students in this category is too small for stat ist icalaccuracy or to protect student privacy.
Note: The number of students tested includes students that did not receive a score; however the number of students tested is not the number that was used tocalculate the achievement level percentages. The achievement level percentages are calculated using students w ith scores.
* Level 1 = Standard not met Level 2 = Standard nearly met Level 3 = Standard met Level 4 = Standard exceeded
Mathematics - Grade 7Mathematics - Grade 7
Student GroupTotal
EnrollmentNumberTested
PercentTested
PercentAchievement
Level 1*
PercentAchievement
Level 2*
PercentAchievement
Level 3*
PercentAchievement
Level 4*
All Students 0 0 0.0% 0.0% 0.0% 0.0% 0.0%
Male 0 0 0.0% 0.0% 0.0% 0.0% 0.0%
Female 0 0 0.0% 0.0% 0.0% 0.0% 0.0%
Black or African American 0 0 0.0% 0.0% 0.0% 0.0% 0.0%
American Indian or Alaska Nat ive 0 0 0.0% 0.0% 0.0% 0.0% 0.0%
Asian 0 0 0.0% 0.0% 0.0% 0.0% 0.0%
Filipino 0 0 0.0% 0.0% 0.0% 0.0% 0.0%
Hispanic or Lat ino 0 0 0.0% 0.0% 0.0% 0.0% 0.0%
Native Hawaiian or Pacific Islander 0 0 0.0% 0.0% 0.0% 0.0% 0.0%
White 0 0 0.0% 0.0% 0.0% 0.0% 0.0%
Two or More Races 0 0 0.0% 0.0% 0.0% 0.0% 0.0%
Socioeconomically Disadvantaged 0 0 0.0% 0.0% 0.0% 0.0% 0.0%
English Learners 0 0 0.0% 0.0% 0.0% 0.0% 0.0%
Students w ith Disabilit ies 0 0 0.0% 0.0% 0.0% 0.0% 0.0%
Students Receiving MigrantEducat ion Services
0 0 0.0% 0.0% 0.0% 0.0% 0.0%
Foster Youth 0 0 0.0% 0.0% 0.0% 0.0% 0.0%
2014-15 SARC - Delta Elementary Charter School
Page 19 of 29

Last updated: 1/26/2016
Double dashes (--) appear in the table when the number of students is ten or less, either because the number of students in this category is too small for stat ist icalaccuracy or to protect student privacy.
Note: The number of students tested includes students that did not receive a score; however the number of students tested is not the number that was used tocalculate the achievement level percentages. The achievement level percentages are calculated using students w ith scores.
* Level 1 = Standard not met Level 2 = Standard nearly met Level 3 = Standard met Level 4 = Standard exceeded
Mathematics - Grade 8Mathematics - Grade 8
Student GroupTotal
EnrollmentNumberTested
PercentTested
PercentAchievement
Level 1*
PercentAchievement
Level 2*
PercentAchievement
Level 3*
PercentAchievement
Level 4*
All Students 0 0 0.0% 0.0% 0.0% 0.0% 0.0%
Male 0 0 0.0% 0.0% 0.0% 0.0% 0.0%
Female 0 0 0.0% 0.0% 0.0% 0.0% 0.0%
Black or African American 0 0 0.0% 0.0% 0.0% 0.0% 0.0%
American Indian or Alaska Nat ive 0 0 0.0% 0.0% 0.0% 0.0% 0.0%
Asian 0 0 0.0% 0.0% 0.0% 0.0% 0.0%
Filipino 0 0 0.0% 0.0% 0.0% 0.0% 0.0%
Hispanic or Lat ino 0 0 0.0% 0.0% 0.0% 0.0% 0.0%
Native Hawaiian or Pacific Islander 0 0 0.0% 0.0% 0.0% 0.0% 0.0%
White 0 0 0.0% 0.0% 0.0% 0.0% 0.0%
Two or More Races 0 0 0.0% 0.0% 0.0% 0.0% 0.0%
Socioeconomically Disadvantaged 0 0 0.0% 0.0% 0.0% 0.0% 0.0%
English Learners 0 0 0.0% 0.0% 0.0% 0.0% 0.0%
Students w ith Disabilit ies 0 0 0.0% 0.0% 0.0% 0.0% 0.0%
Students Receiving MigrantEducat ion Services
0 0 0.0% 0.0% 0.0% 0.0% 0.0%
Foster Youth 0 0 0.0% 0.0% 0.0% 0.0% 0.0%
2014-15 SARC - Delta Elementary Charter School
Page 20 of 29

Last updated: 1/26/2016
Double dashes (--) appear in the table when the number of students is ten or less, either because the number of students in this category is too small for stat ist icalaccuracy or to protect student privacy.
Note: The number of students tested includes students that did not receive a score; however the number of students tested is not the number that was used tocalculate the achievement level percentages. The achievement level percentages are calculated using students w ith scores.
* Level 1 = Standard not met Level 2 = Standard nearly met Level 3 = Standard met Level 4 = Standard exceeded
Mathematics - Grade 11Mathematics - Grade 11
Student GroupTotal
EnrollmentNumberTested
PercentTested
PercentAchievement
Level 1*
PercentAchievement
Level 2*
PercentAchievement
Level 3*
PercentAchievement
Level 4*
All Students 0 0 0.0% 0.0% 0.0% 0.0% 0.0%
Male 0 0 0.0% 0.0% 0.0% 0.0% 0.0%
Female 0 0 0.0% 0.0% 0.0% 0.0% 0.0%
Black or African American 0 0 0.0% 0.0% 0.0% 0.0% 0.0%
American Indian or Alaska Nat ive 0 0 0.0% 0.0% 0.0% 0.0% 0.0%
Asian 0 0 0.0% 0.0% 0.0% 0.0% 0.0%
Filipino 0 0 0.0% 0.0% 0.0% 0.0% 0.0%
Hispanic or Lat ino 0 0 0.0% 0.0% 0.0% 0.0% 0.0%
Native Hawaiian or Pacific Islander 0 0 0.0% 0.0% 0.0% 0.0% 0.0%
White 0 0 0.0% 0.0% 0.0% 0.0% 0.0%
Two or More Races 0 0 0.0% 0.0% 0.0% 0.0% 0.0%
Socioeconomically Disadvantaged 0 0 0.0% 0.0% 0.0% 0.0% 0.0%
English Learners 0 0 0.0% 0.0% 0.0% 0.0% 0.0%
Students w ith Disabilit ies 0 0 0.0% 0.0% 0.0% 0.0% 0.0%
Students Receiving MigrantEducat ion Services
0 0 0.0% 0.0% 0.0% 0.0% 0.0%
Foster Youth 0 0 0.0% 0.0% 0.0% 0.0% 0.0%
2014-15 SARC - Delta Elementary Charter School
Page 21 of 29

Last updated: 1/27/2016
Last updated: 1/27/2016
Note: Scores are not shown when the number of students tested is ten or less, either because the number of students in this category is too small for stat ist icalaccuracy or to protect student privacy. Double dashes (--) appear in the table when the number of students tested is ten or less.
California Standards Tests Results by Student Group in Science (School Year 2014-15)
Note: Scores are not shown when the number of students tested is ten or less, either because the number of students in this category is too small for stat ist icalaccuracy or to protect student privacy. Double dashes (--) appear in the table when the number of students tested is ten or less.
California Standards Tests for All Students in Science – Three-Year ComparisonCalifornia Standards Tests for All Students in Science – Three-Year Comparison
Subject
Percent of Students Scoring at Proficient or Advanced (meeting or exceeding the state standards)
School District State
2012-13 2013-14 2014-15 2012-13 2013-14 2014-15 2012-13 2013-14 2014-15
Science (grades 5, 8, and 10) 41.0% 59.0% 57.0% 56.0% 59.0% 57.0% 59.0% 60.0% 56.0%
Student Group Percent of Students Scoring at Proficient or Advanced
All Students in the LEA 57.0%
All Students at the School 412.0%
Male 26.0%
Female 31.0%
Black or African American 1.0%
American Indian or Alaska Nat ive 0.0%
Asian 0.0%
Filipino 0.0%
Hispanic or Lat ino 20.0%
Native Hawaiian or Pacific Islander 0.0%
White 32.0%
Two or More Races 4.0%
Socioeconomically Disadvantaged 18.0%
English Learners 10.0%
Students w ith Disabilit ies 2.0%
Students Receiving Migrant Educat ion Services 1.0%
Foster Youth 0.0%
2014-15 SARC - Delta Elementary Charter School
Page 22 of 29
Last updated: 1/28/2016
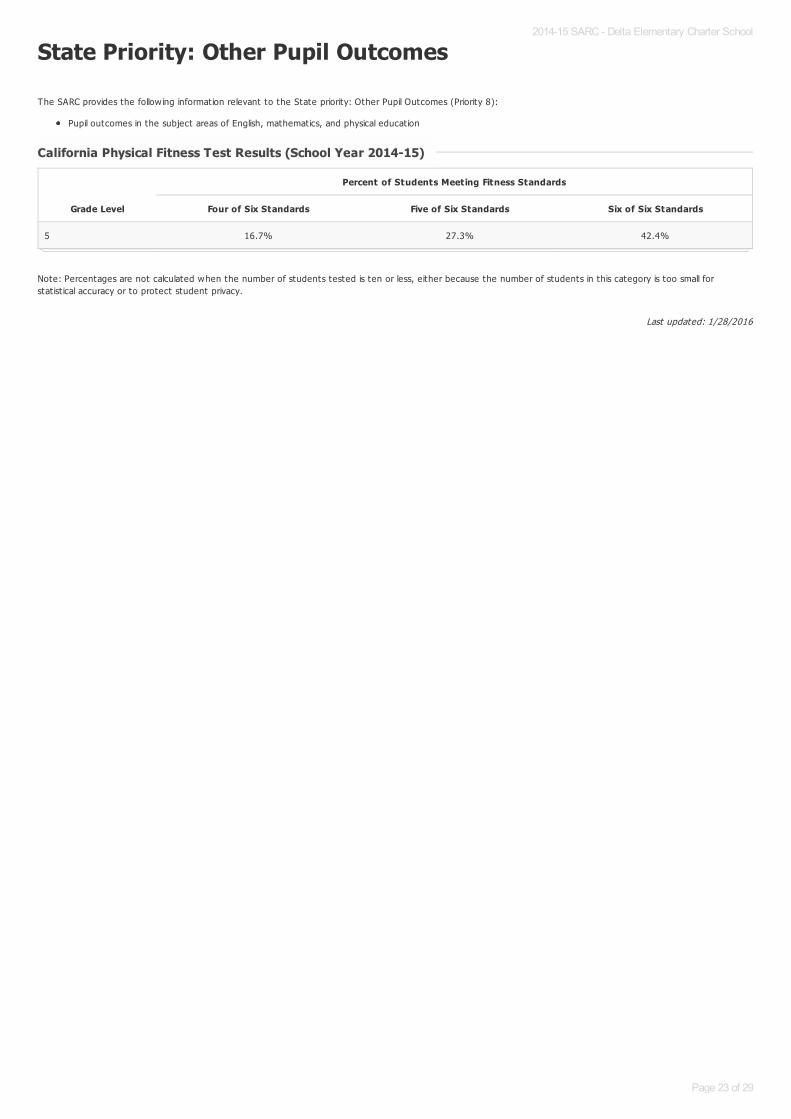
State Priority: Other Pupil Outcomes
The SARC provides the follow ing information relevant to the State priority: Other Pupil Outcomes (Priority 8):
Pupil outcomes in the subject areas of English, mathematics, and physical educat ion
Note: Percentages are not calculated when the number of students tested is ten or less, either because the number of students in this category is too small forstat ist ical accuracy or to protect student privacy.
California Physical Fitness Test Results (School Year 2014-15)California Physical Fitness Test Results (School Year 2014-15)
Grade Level
Percent of Students Meeting Fitness Standards
Four of Six Standards Five of Six Standards Six of Six Standards
5 16.7% 27.3% 42.4%
2014-15 SARC - Delta Elementary Charter School
Page 23 of 29
Last updated: 1/28/2016
C. Engagement
State Priority: Parental Involvement
The SARC provides the follow ing information relevant to the State priority: Parental Involvement (Priority 3):
Efforts the school district makes to seek parent input in making decisions for the school district and each schoolsite
State Priority: Pupil Engagement
The SARC provides the follow ing information relevant to the State priority: Pupil Engagement (Priority 5):
High school dropout rates; andHigh school graduat ion rates
Opportunities for Parental Involvement - Most Recent YearOpportunities for Parental Involvement - Most Recent Year
DECS encourages all parents to become involved in our school community. Our Parent Teacher Club is extremely strong and conducts fundraising efforts thatallow us to have a fullt ime music and art program, a focus on technology and Project Based Learning. It is our families that make the real difference at DECS.Parent volunteers are needed in our classrooms, at our outdoor learning garden and in our music and art studios. All parents wanting to assist in or out of classshould contact the front office at 916-744-1200. Our PTC can be contacted through our website at www.deltacharter.org
2014-15 SARC - Delta Elementary Charter School
Page 24 of 29
Last updated: 1/28/2016
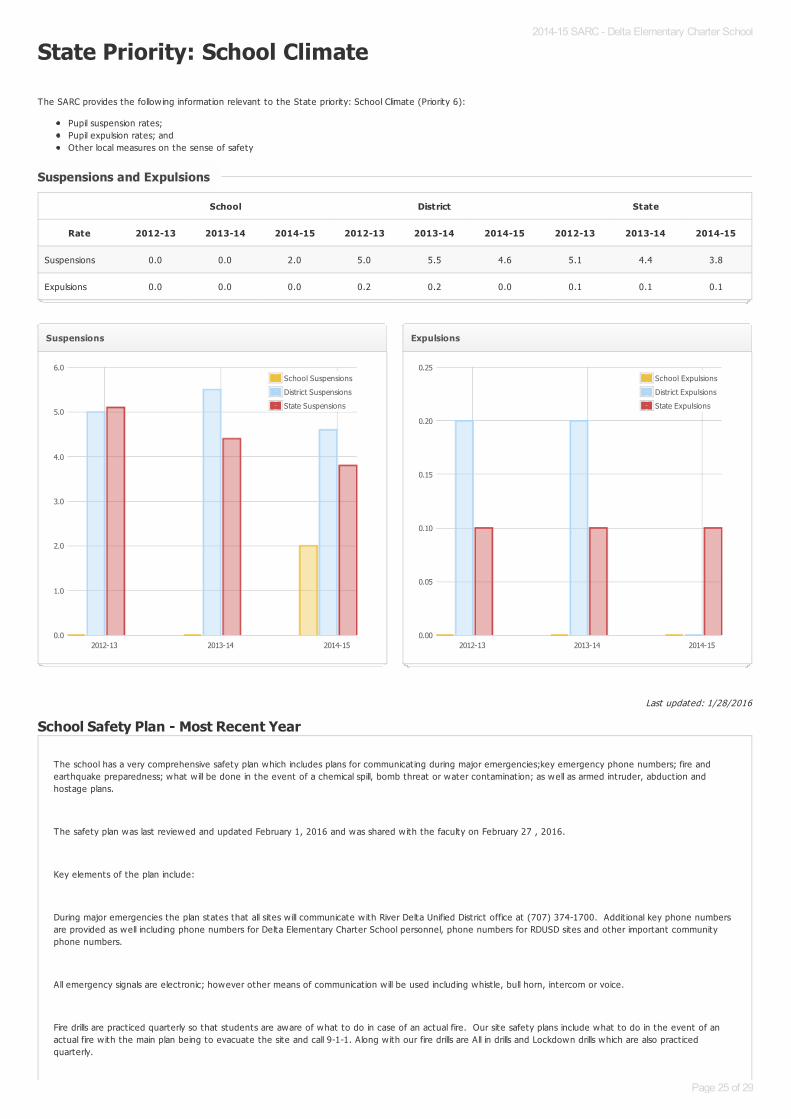
State Priority: School Climate
The SARC provides the follow ing information relevant to the State priority: School Climate (Priority 6):
Pupil suspension rates;Pupil expulsion rates; andOther local measures on the sense of safety
School Safety Plan - Most Recent Year
Suspensions and ExpulsionsSuspensions and Expulsions
School District State
Rate 2012-13 2013-14 2014-15 2012-13 2013-14 2014-15 2012-13 2013-14 2014-15
Suspensions 0.0 0.0 2.0 5.0 5.5 4.6 5.1 4.4 3.8
Expulsions 0.0 0.0 0.0 0.2 0.2 0.0 0.1 0.1 0.1
Suspensions
2012-13 2013-14 2014-150.0
1.0
2.0
3.0
4.0
5.0
6.0School Suspensions
District Suspensions
State Suspensions
Expulsions
2012-13 2013-14 2014-150.00
0.05
0.10
0.15
0.20
0.25School Expulsions
District Expulsions
State Expulsions
The school has a very comprehensive safety plan which includes plans for communicat ing during major emergencies;key emergency phone numbers; fire andearthquake preparedness; what w ill be done in the event of a chemical spill, bomb threat or water contaminat ion; as well as armed intruder, abduct ion andhostage plans.
The safety plan was last reviewed and updated February 1, 2016 and was shared w ith the faculty on February 27 , 2016.
Key elements of the plan include:
During major emergencies the plan states that all sites w ill communicate w ith River Delta Unified District office at (707) 374-1700. Addit ional key phone numbersare provided as well including phone numbers for Delta Elementary Charter School personnel, phone numbers for RDUSD sites and other important communityphone numbers.
All emergency signals are electronic; however other means of communicat ion w ill be used including whist le, bull horn, intercom or voice.
Fire drills are pract iced quarterly so that students are aware of what to do in case of an actual fire. Our site safety plans include what to do in the event of anactual fire w ith the main plan being to evacuate the site and call 9-1-1. Along w ith our fire drills are All in drills and Lockdown drills which are also pract icedquarterly.
2014-15 SARC - Delta Elementary Charter School
Page 25 of 29

Last updated: 1/28/2016
In the event of a power failure, plans are included for usage of water and bathrooms since our school is on a well which needs electricity to operate. Portablebathrooms and bott led water w ill be provided in the event that electricity is expected to be out longer than 2 hours.
Earthquake preparedness drills are pract iced both inside and outside of the classrooms and buildings. In the event of an actual earthquake, the DistrictEmergency plan w ill be act ivated.
Armed intruder drills have been pract iced w ith staff and students so that they are prepared in the event of an actual emergency.
The safety plan also includes protocols for possible Bomb threats, as well as possible water and/or food contaminat ion.
2014-15 SARC - Delta Elementary Charter School
Page 26 of 29
Last updated: 1/28/2016
Last updated: 1/28/2016
Last updated: 1/28/2016
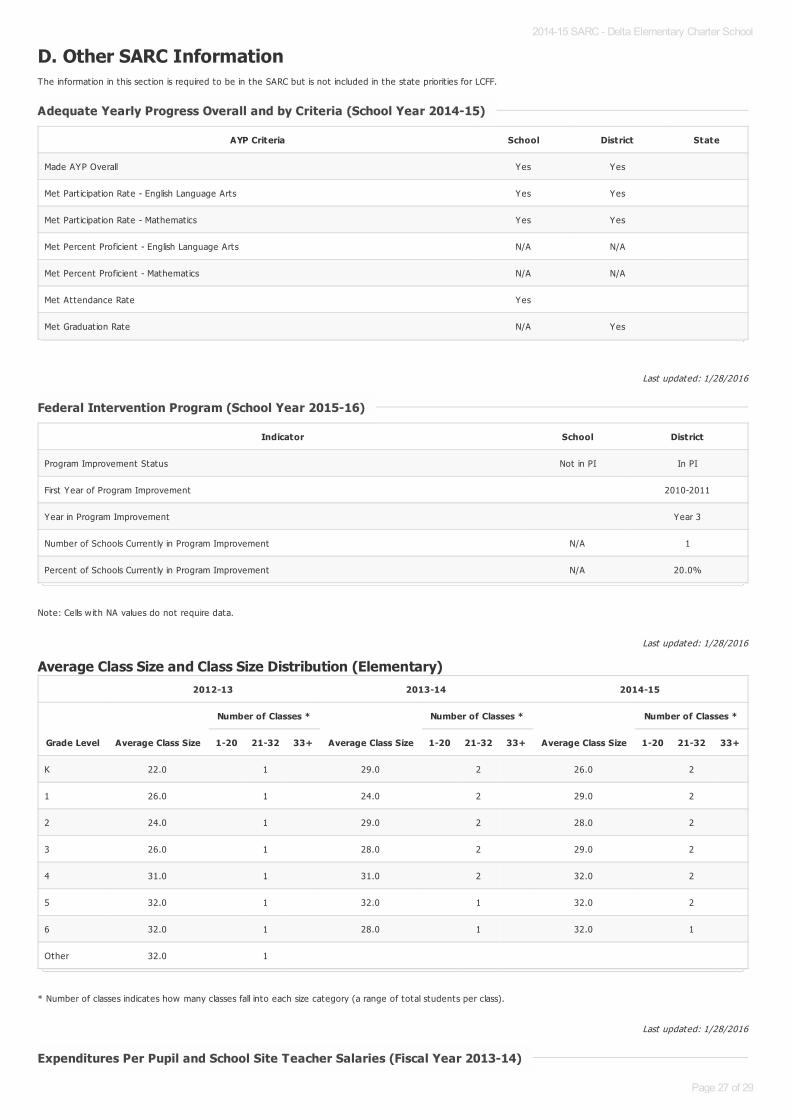
D. Other SARC InformationThe information in this sect ion is required to be in the SARC but is not included in the state priorit ies for LCFF.
Note: Cells w ith NA values do not require data.
Average Class Size and Class Size Distribution (Elementary)
* Number of classes indicates how many classes fall into each size category (a range of total students per class).
Adequate Yearly Progress Overall and by Criteria (School Year 2014-15)Adequate Yearly Progress Overall and by Criteria (School Year 2014-15)
AYP Criteria School District State
Made AYP Overall Yes Yes
Met Part icipat ion Rate - English Language Arts Yes Yes
Met Part icipat ion Rate - Mathematics Yes Yes
Met Percent Proficient - English Language Arts N/A N/A
Met Percent Proficient - Mathematics N/A N/A
Met Attendance Rate Yes
Met Graduat ion Rate N/A Yes
Federal Intervention Program (School Year 2015-16)Federal Intervention Program (School Year 2015-16)
Indicator School District
Program Improvement Status Not in PI In PI
First Year of Program Improvement 2010-2011
Year in Program Improvement Year 3
Number of Schools Current ly in Program Improvement N/A 1
Percent of Schools Current ly in Program Improvement N/A 20.0%
2012-13 2013-14 2014-15
Grade Level Average Class Size
Number of Classes *
Average Class Size
Number of Classes *
Average Class Size
Number of Classes *
1-20 21-32 33+ 1-20 21-32 33+ 1-20 21-32 33+
K 22.0 1 29.0 2 26.0 2
1 26.0 1 24.0 2 29.0 2
2 24.0 1 29.0 2 28.0 2
3 26.0 1 28.0 2 29.0 2
4 31.0 1 31.0 2 32.0 2
5 32.0 1 32.0 1 32.0 2
6 32.0 1 28.0 1 32.0 1
Other 32.0 1
Expenditures Per Pupil and School Site Teacher Salaries (Fiscal Year 2013-14)Expenditures Per Pupil and School Site Teacher Salaries (Fiscal Year 2013-14)
2014-15 SARC - Delta Elementary Charter School
Page 27 of 29
Last updated: 1/28/2016
Last updated: 1/28/2016
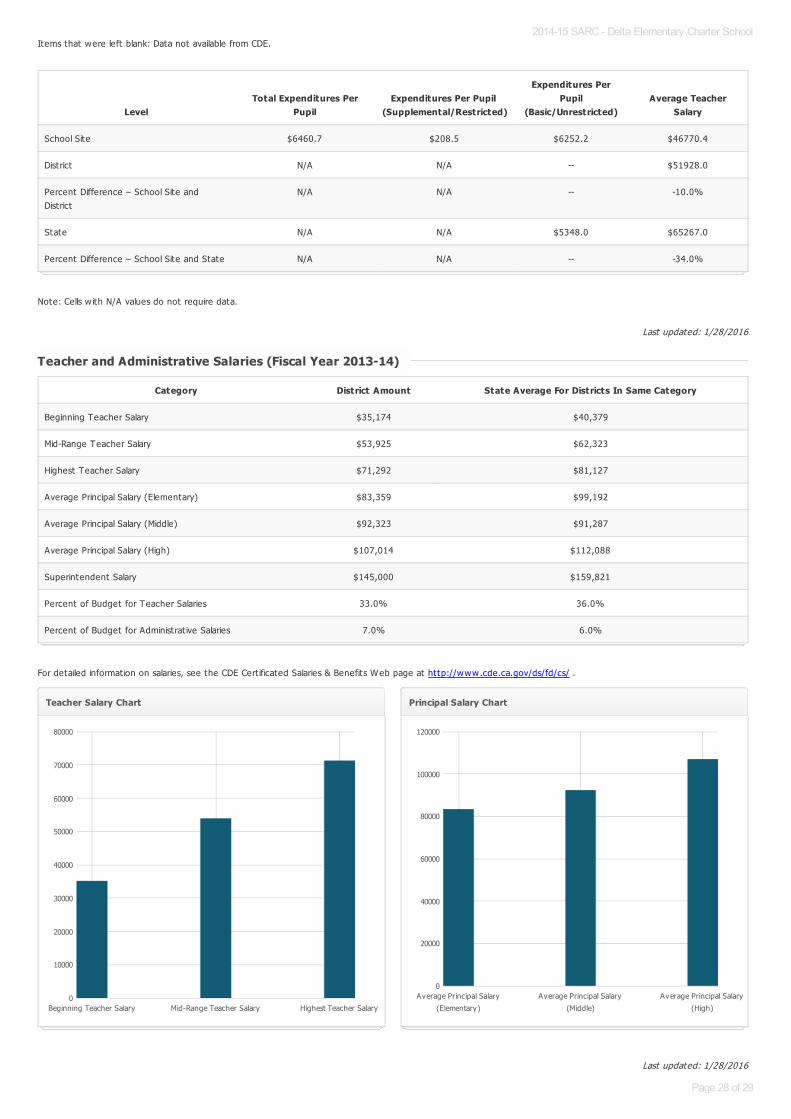
Items that were left blank: Data not available from CDE.
Note: Cells w ith N/A values do not require data.
For detailed information on salaries, see the CDE Cert ificated Salaries & Benefits Web page at http://www.cde.ca.gov/ds/fd/cs/ .
LevelTotal Expenditures Per
PupilExpenditures Per Pupil
(Supplemental/Restricted)
Expenditures PerPupil
(Basic/Unrestricted)Average Teacher
Salary
School Site $6460.7 $208.5 $6252.2 $46770.4
District N/A N/A -- $51928.0
Percent Difference – School Site andDistrict
N/A N/A -- -10.0%
State N/A N/A $5348.0 $65267.0
Percent Difference – School Site and State N/A N/A -- -34.0%
Teacher and Administrative Salaries (Fiscal Year 2013-14)Teacher and Administrative Salaries (Fiscal Year 2013-14)
Category District Amount State Average For Districts In Same Category
Beginning Teacher Salary $35,174 $40,379
Mid-Range Teacher Salary $53,925 $62,323
Highest Teacher Salary $71,292 $81,127
Average Principal Salary (Elementary) $83,359 $99,192
Average Principal Salary (Middle) $92,323 $91,287
Average Principal Salary (High) $107,014 $112,088
Superintendent Salary $145,000 $159,821
Percent of Budget for Teacher Salaries 33.0% 36.0%
Percent of Budget for Administrat ive Salaries 7.0% 6.0%
Teacher Salary Chart
Beginning Teacher Salary Mid-Range Teacher Salary Highest Teacher Salary0
10000
20000
30000
40000
50000
60000
70000
80000
Principal Salary Chart
Average Principal Salary
(Elementary)
Average Principal Salary
(Middle)
Average Principal Salary
(High)
0
20000
40000
60000
80000
100000
120000
2014-15 SARC - Delta Elementary Charter School
Page 28 of 29
Last updated: 1/28/2016
Professional Development – Most Recent Three Years
The Professional Development calendar is created each year w ith the school’s Superintendent/Principal and Leadership Team.
Student data, work samples and in class observat ions determine our PD Plan. All teachers receive an individualized plan geared to the areas they ident ify w ith thesite administrator. On site coaches and thePrincipal provides demonstrat ion lessons and observat ions on a weekly basis.
Wednesday afternoons are designated as our staff collaborat ion and are focused on ut ilizing student data to inform our teaching pract ices. The teacher supportplans that are developed by the Superintendent/Principal and are individualized to guide our coaching and provide targeted assistance where needed. DECSsupports all staff members to guarantee success that translates to effect ive teaching pract ices that engage students in their learning. Common Core professionaldevelopment has been a priority for all teachers at DECS.
2014-15 SARC - Delta Elementary Charter School
Page 29 of 29


