
SCALING UP QBD
IFPAC 2014
Tamar Ben-Avi Head of Pharmaceutical Technology
Content
Introduction
Method
Case study 1 – High Shear Granulation
Case study 2 – Blending
Case study 3 – Tablet Compression
Lesson Learnt
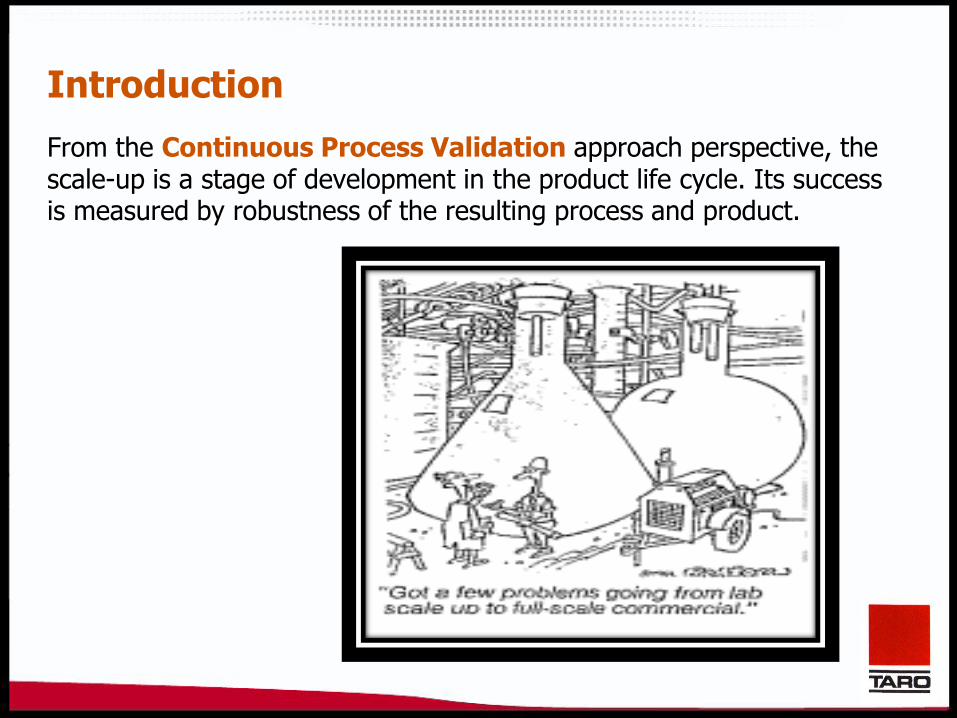
From the Continuous Process Validation approach perspective, the scale-up is a stage of development in the product life cycle. Its success is measured by robustness of the resulting process and product.
Introduction
Guide references (not many)
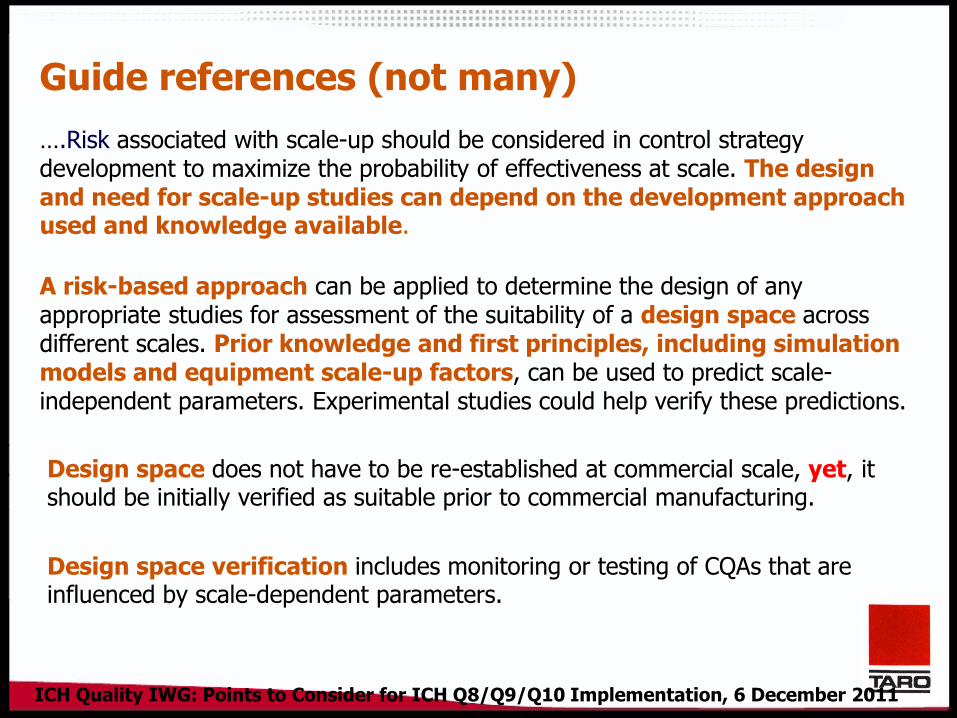
….Risk associated with scale-up should be considered in control strategy development to maximize the probability of effectiveness at scale. The design and need for scale-up studies can depend on the development approach used and knowledge available.
A risk-based approach can be applied to determine the design of any appropriate studies for assessment of the suitability of a design space across different scales. Prior knowledge and first principles, including simulation models and equipment scale-up factors, can be used to predict scale-independent parameters. Experimental studies could help verify these predictions.
Design space does not have to be re-established at commercial scale, yet, it should be initially verified as suitable prior to commercial manufacturing.
Design space verification includes monitoring or testing of CQAs that are influenced by scale-dependent parameters.
ICH Quality IWG: Points to Consider for ICH Q8/Q9/Q10 Implementation, 6 December 2011
Method
What to do? Or – How to do it?
When?
Who is on board?
Why? Well, this one is easy….
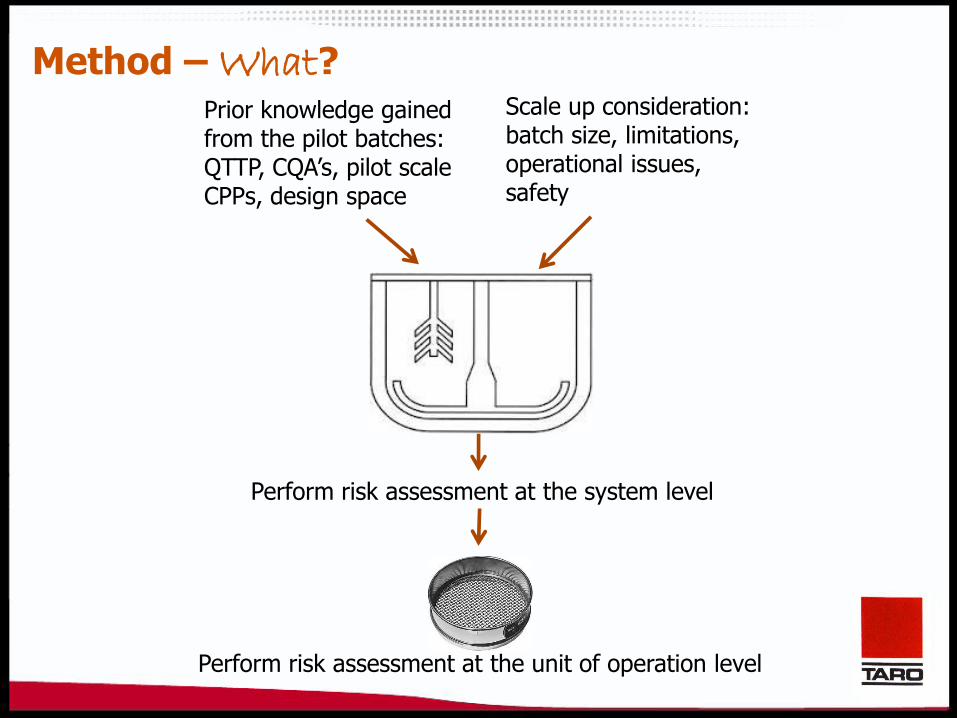
Prior knowledge gained from the pilot batches: QTTP, CQA’s, pilot scale CPPs, design space
Scale up consideration: batch size, limitations, operational issues, safety
Perform risk assessment at the system level
Perform risk assessment at the unit of operation level
Method – What?
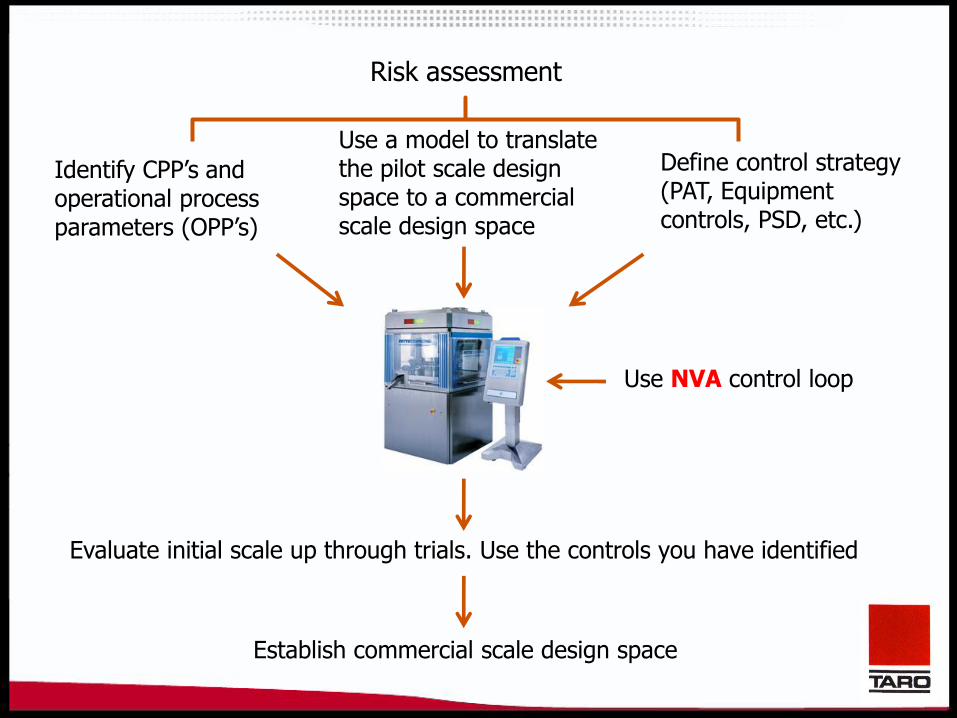
Identify CPP’s and operational process parameters (OPP’s)
Define control strategy (PAT, Equipment controls, PSD, etc.)
Use a model to translate the pilot scale design space to a commercial scale design space
Evaluate initial scale up through trials. Use the controls you have identified
Risk assessment
Establish commercial scale design space
Use NVA control loop
NVA – Non Valuable Activities
Activity/process that does not add value to your product
“Clean” process = less undesired process variability
“This really is an Innovative approach, but I’m afraid we can’t consider it. It’s never been done before.”
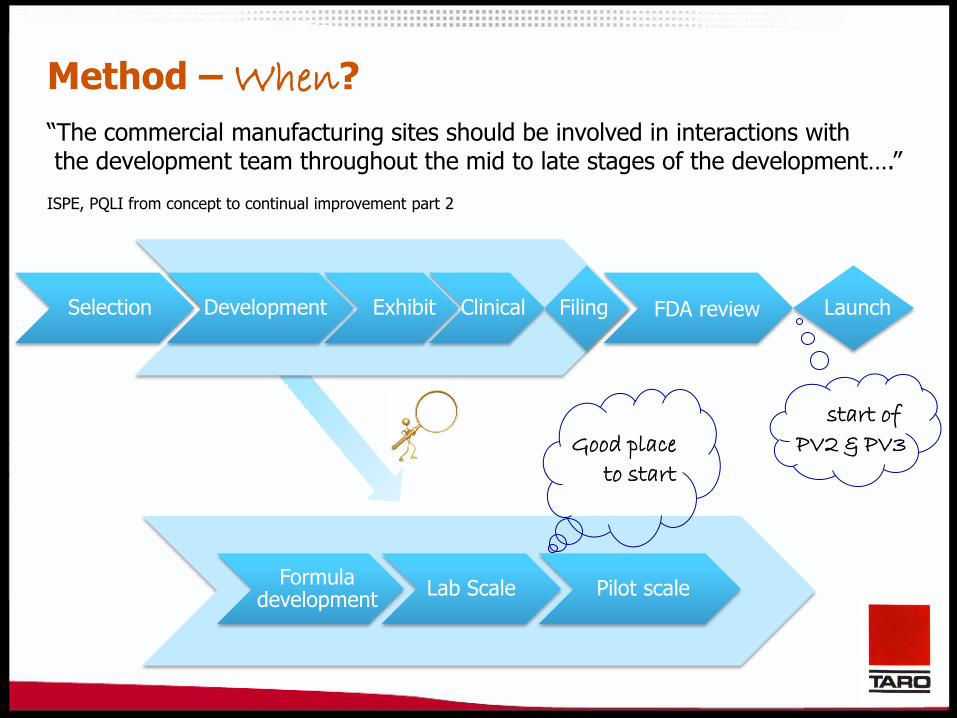
Method – When?
“The commercial manufacturing sites should be involved in interactions with the development team throughout the mid to late stages of the development….” ISPE, PQLI from concept to continual improvement part 2
Launch Filing Selection Development Exhibit Clinical FDA review
Lab Scale Formula
development Pilot scale
Good place
to start
start of
PV2 & PV3
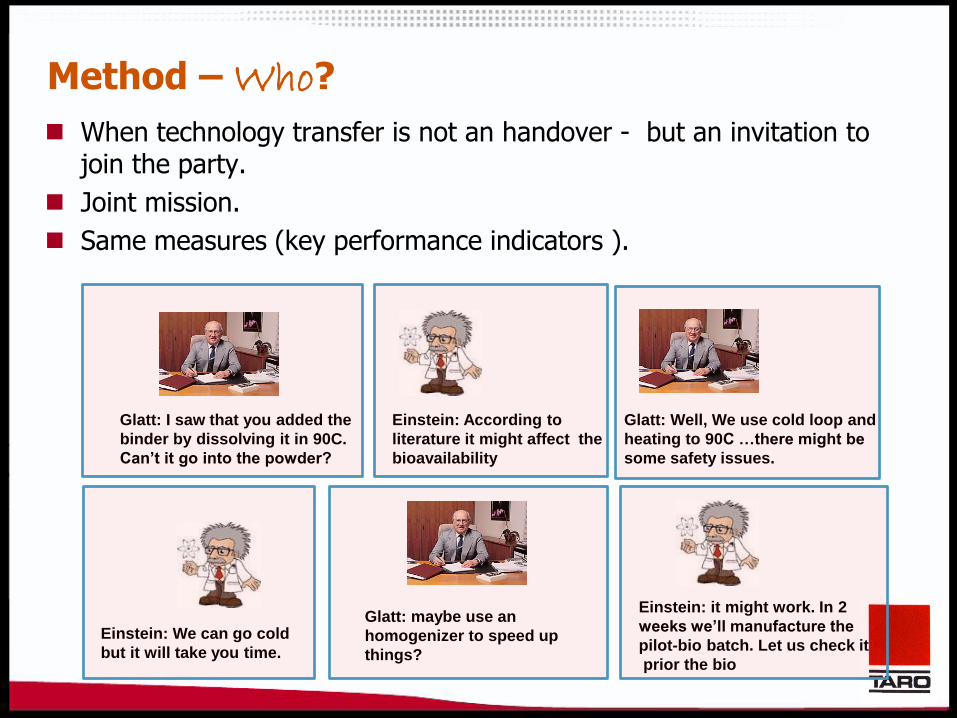
Method – Who?
When technology transfer is not an handover - but an invitation to join the party.
Joint mission.
Same measures (key performance indicators ).
Glatt: I saw that you added the
binder by dissolving it in 90C.
Can’t it go into the powder?
Einstein: According to
literature it might affect the
bioavailability
Glatt: Well, We use cold loop and
heating to 90C …there might be
some safety issues.
Einstein: We can go cold
but it will take you time.
Glatt: maybe use an
homogenizer to speed up
things?
Einstein: it might work. In 2
weeks we’ll manufacture the
pilot-bio batch. Let us check it
prior the bio
ICH Quality IWG: Points to Consider for ICH Q8/Q9/Q10 Implementation, 6 December 2011
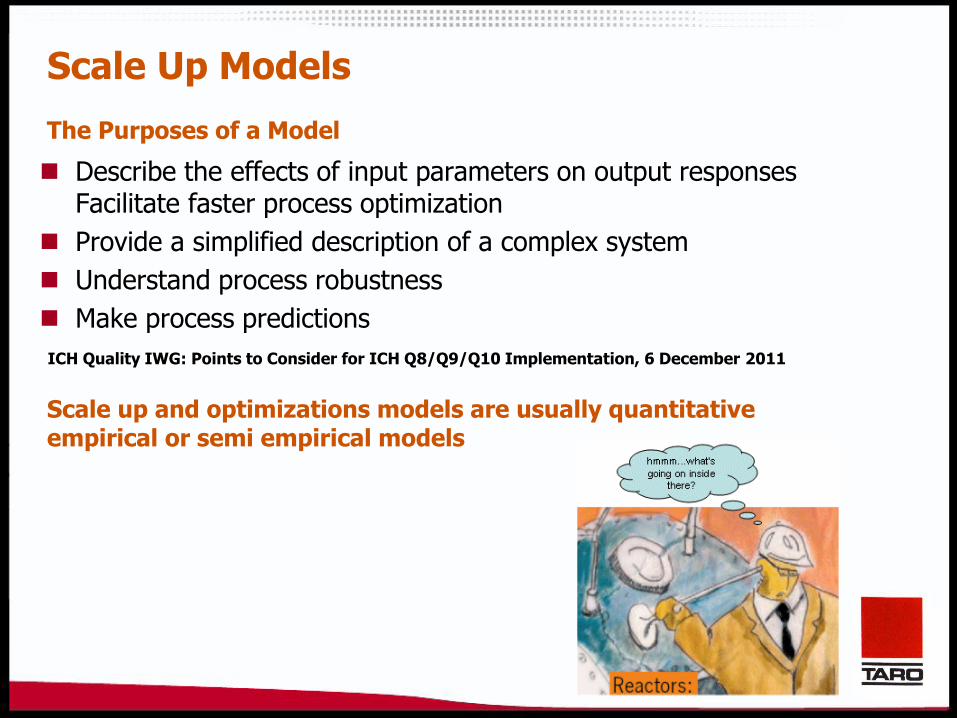
Scale Up Models
Scale up and optimizations models are usually quantitative empirical or semi empirical models
The Purposes of a Model
Describe the effects of input parameters on output responses Facilitate faster process optimization
Provide a simplified description of a complex system
Understand process robustness
Make process predictions
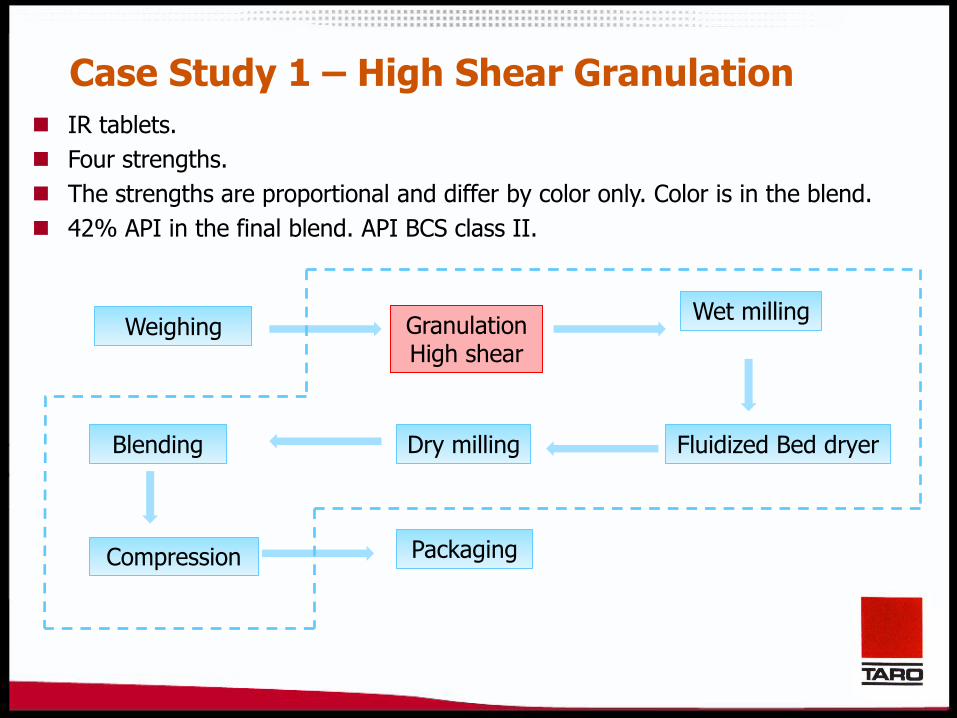
Case Study 1 – High Shear Granulation
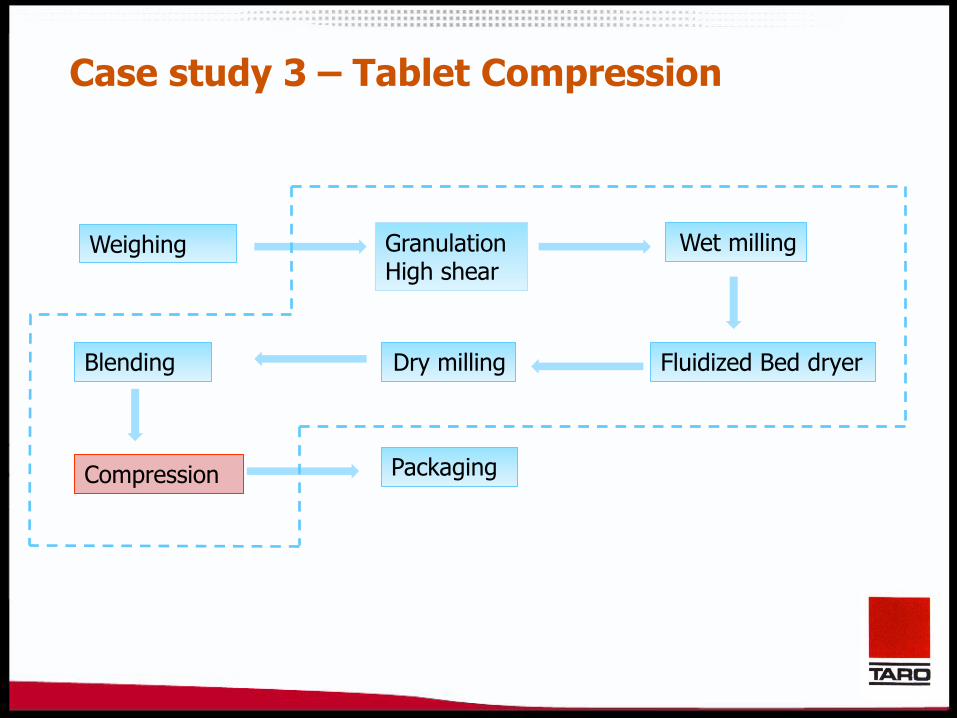
Weighing
Fluidized Bed dryer
Wet milling Granulation High shear
Dry milling Blending
Compression Packaging
IR tablets.
Four strengths.
The strengths are proportional and differ by color only. Color is in the blend.
42% API in the final blend. API BCS class II.
compression
Blending
Dry milling
Fluidized Bed dryer
Wet milling
Granulation
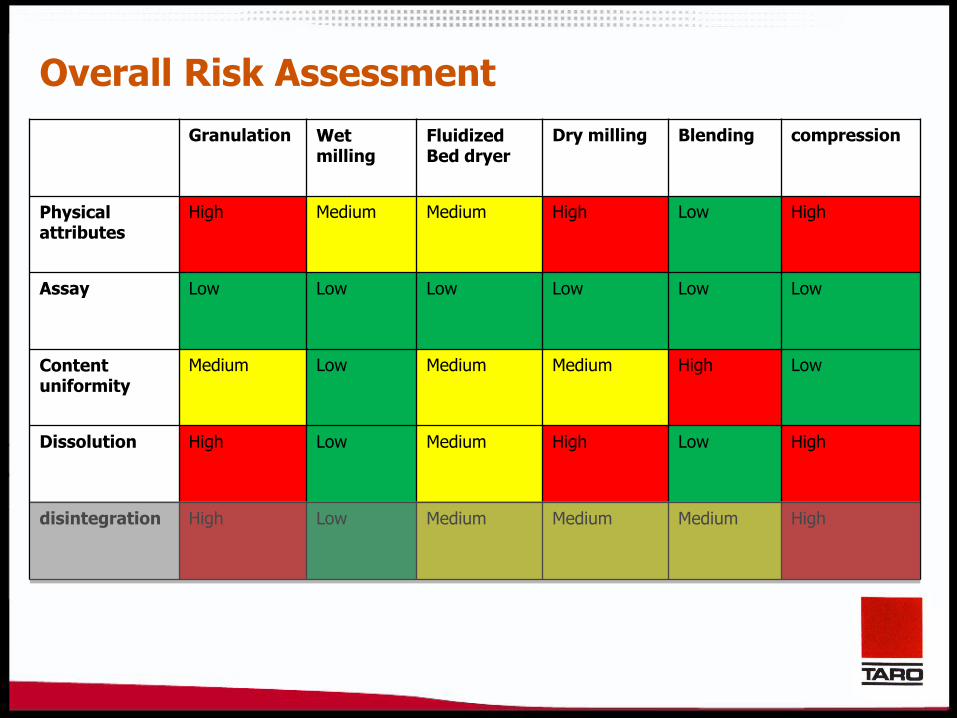
High Low High Medium Medium High Physical attributes
Low Low Low Low Low Low Assay
Low High Medium Medium Low Medium Content uniformity
High Low High Medium Low High Dissolution
High Medium Medium Medium Low High disintegration
Overall Risk Assessment
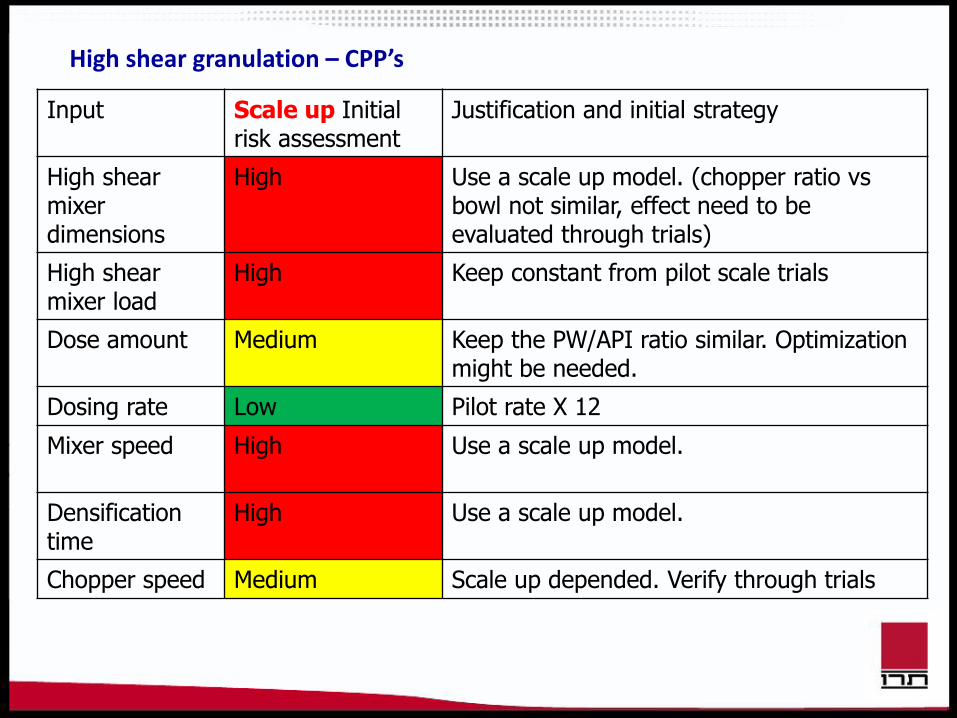
High shear granulation – CPP’s
Input Scale up Initial risk assessment
Justification and initial strategy
High shear mixer dimensions
High Use a scale up model. (chopper ratio vs bowl not similar, effect need to be evaluated through trials)
High shear mixer load
High Keep constant from pilot scale trials
Dose amount Medium Keep the PW/API ratio similar. Optimization might be needed.
Dosing rate Low Pilot rate X 12
Mixer speed High Use a scale up model.
Densification time
High Use a scale up model.
Chopper speed Medium Scale up depended. Verify through trials
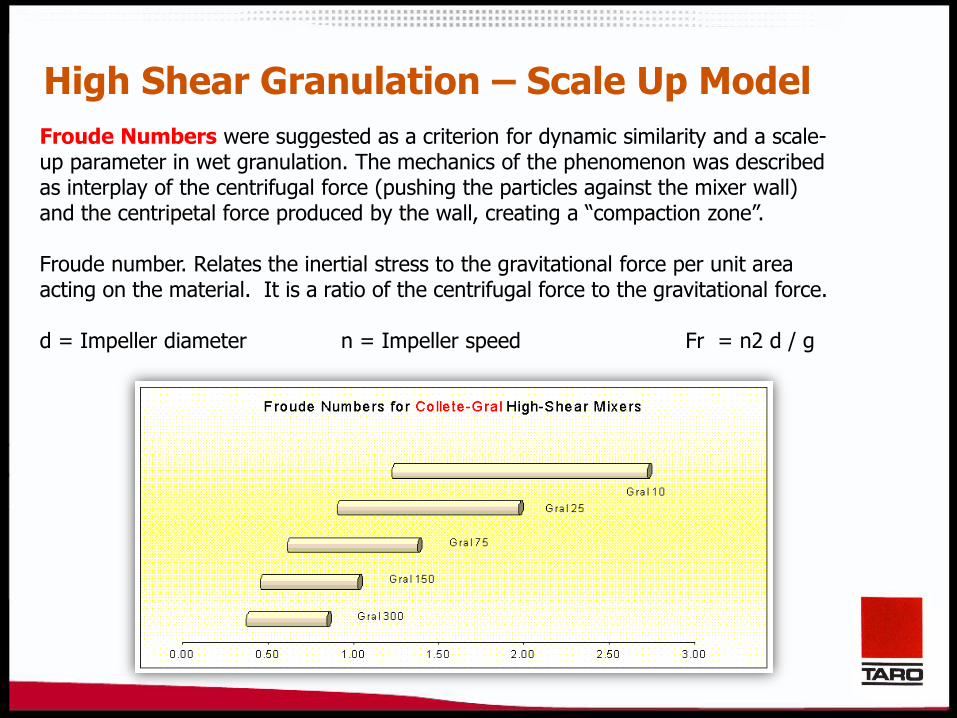
High Shear Granulation – Scale Up Model
Froude Numbers were suggested as a criterion for dynamic similarity and a scale-up parameter in wet granulation. The mechanics of the phenomenon was described as interplay of the centrifugal force (pushing the particles against the mixer wall) and the centripetal force produced by the wall, creating a “compaction zone”. Froude number. Relates the inertial stress to the gravitational force per unit area acting on the material. It is a ratio of the centrifugal force to the gravitational force.
Fr = n2 d / g n = Impeller speed d = Impeller diameter
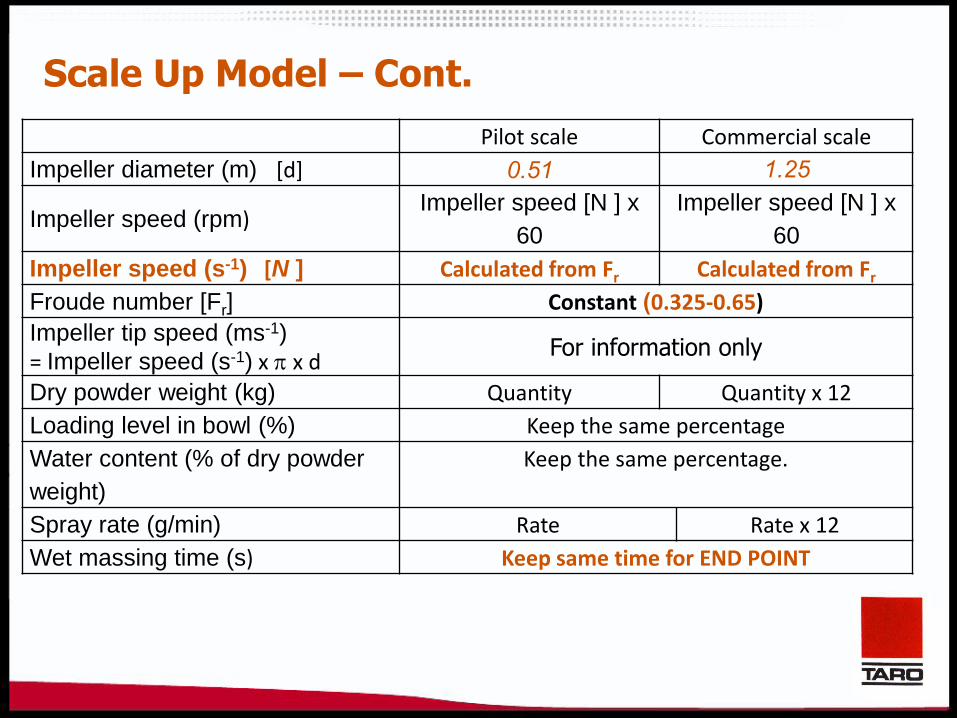
Scale Up Model – Cont.
Commercial scale Pilot scale
1.25 0.51 Impeller diameter (m) [d]
Impeller speed [N ] x
60
Impeller speed [N ] x
60 Impeller speed (rpm)
Calculated from Fr Calculated from Fr Impeller speed (s-1) [N ]
Constant )0.325-0.65) Froude number [Fr]
For information only Impeller tip speed (ms-1) = Impeller speed (s-1) x x d
Quantity x 12 Quantity Dry powder weight (kg)
Keep the same percentage Loading level in bowl (%)
Keep the same percentage. Water content (% of dry powder
weight)
Rate x 12 Rate Spray rate (g/min)
Keep same time for END POINT Wet massing time (s)
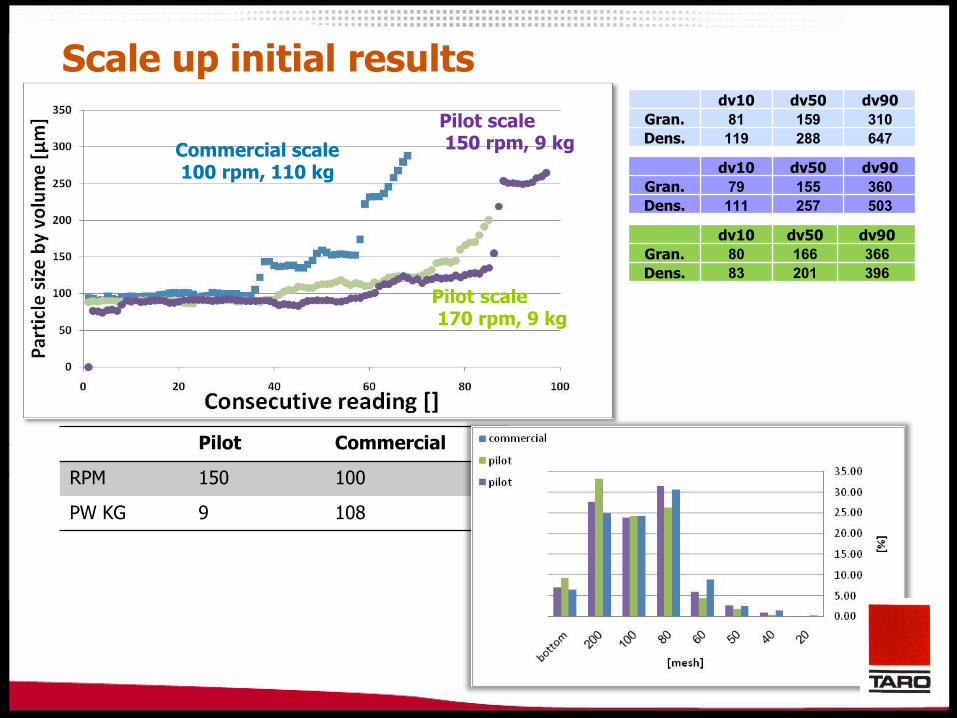
Commercial scale 100 rpm, 110 kg
Pilot scale 150 rpm, 9 kg
Pilot scale 170 rpm, 9 kg
Commercial Pilot
100 150 RPM
108 9 PW KG
dv10 dv50 dv90
Gran. 81 159 310
Dens. 119 288 647
dv10 dv50 dv90
Gran. 80 166 366
Dens. 83 201 396
dv10 dv50 dv90
Gran. 79 155 360
Dens. 111 257 503
Scale up initial results
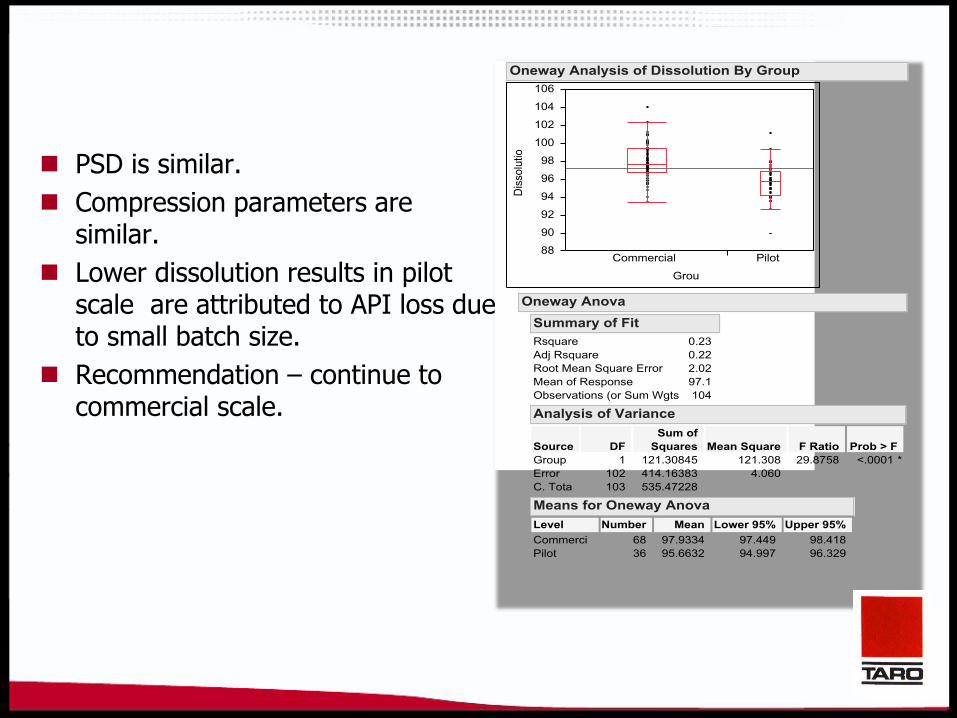
PSD is similar.
Compression parameters are similar.
Lower dissolution results in pilot scale are attributed to API loss due to small batch size.
Recommendation – continue to commercial scale.

Pattern Mixer
Speed
Dose
Amount
GMX
Solution
Flow Rate
KW
granulatio
n (KWg)
KW
densificati
on (KWd)
KW delta
(KWd-
KWg)
D50
granulation
D50
densification
300 mic 180 mic 150 mic 75 mic Dissolution
+++ 105 110 11
+−− 105 100 9
−−− 95 100 9
++− 105 110 9
−−+ 95 100 11
−+− 95 110 9
−++ 95 110 11
+−+ 105 100 11
Lower 14 15
Upper 17 18Specifications
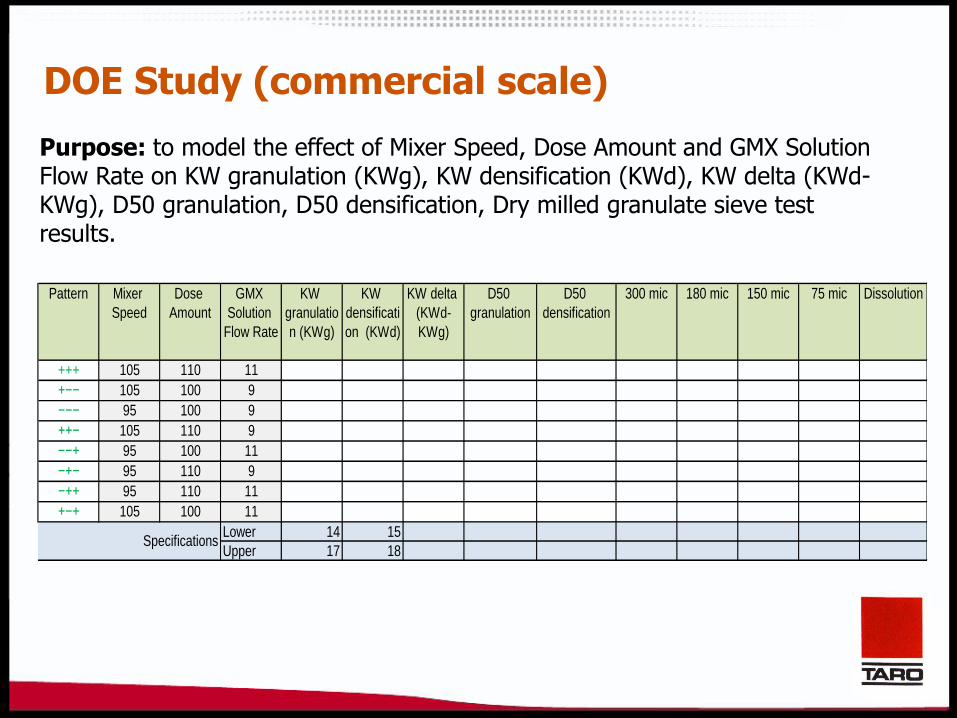
DOE Study (commercial scale)
Purpose: to model the effect of Mixer Speed, Dose Amount and GMX Solution Flow Rate on KW granulation (KWg), KW densification (KWd), KW delta (KWd-KWg), D50 granulation, D50 densification, Dry milled granulate sieve test results.
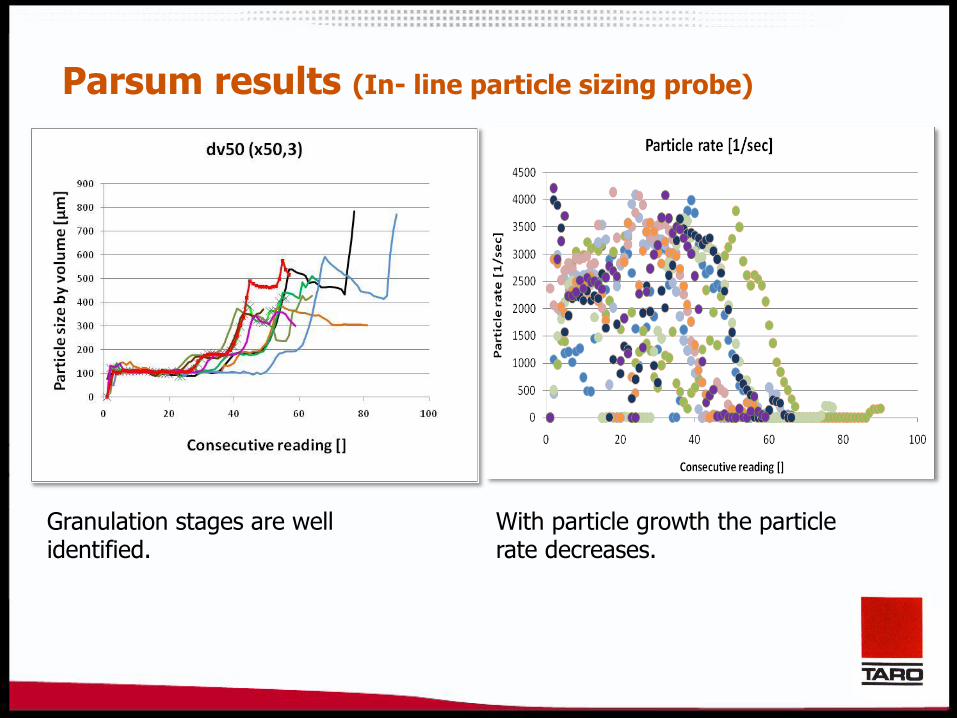
Parsum results (In- line particle sizing probe)
With particle growth the particle rate decreases.
Granulation stages are well identified.
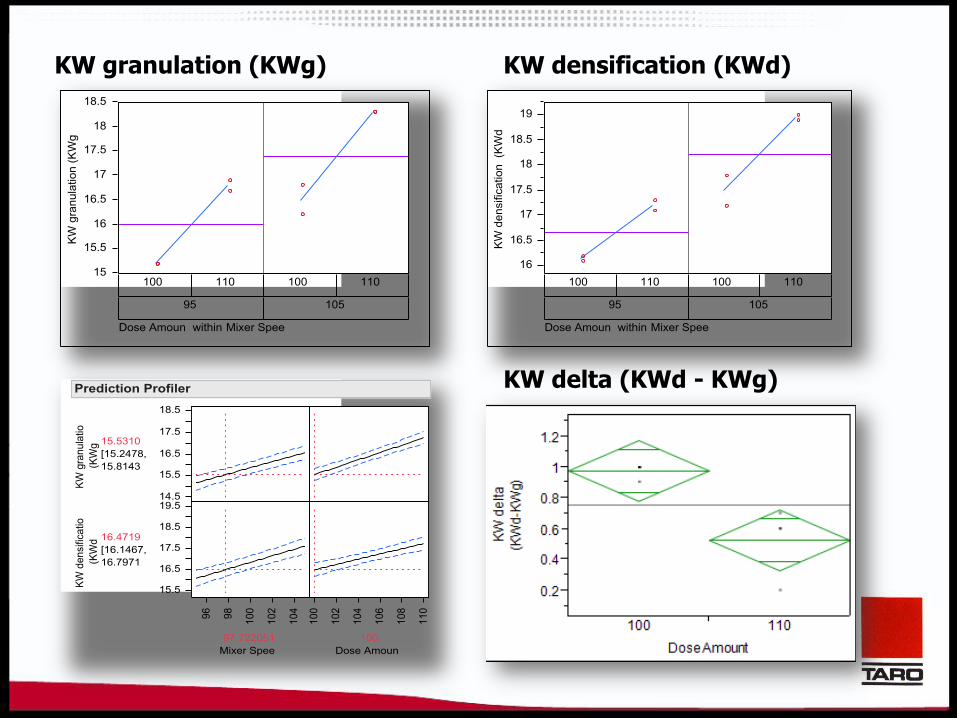
KW granulation (KWg) KW densification (KWd)
KW delta (KWd - KWg)
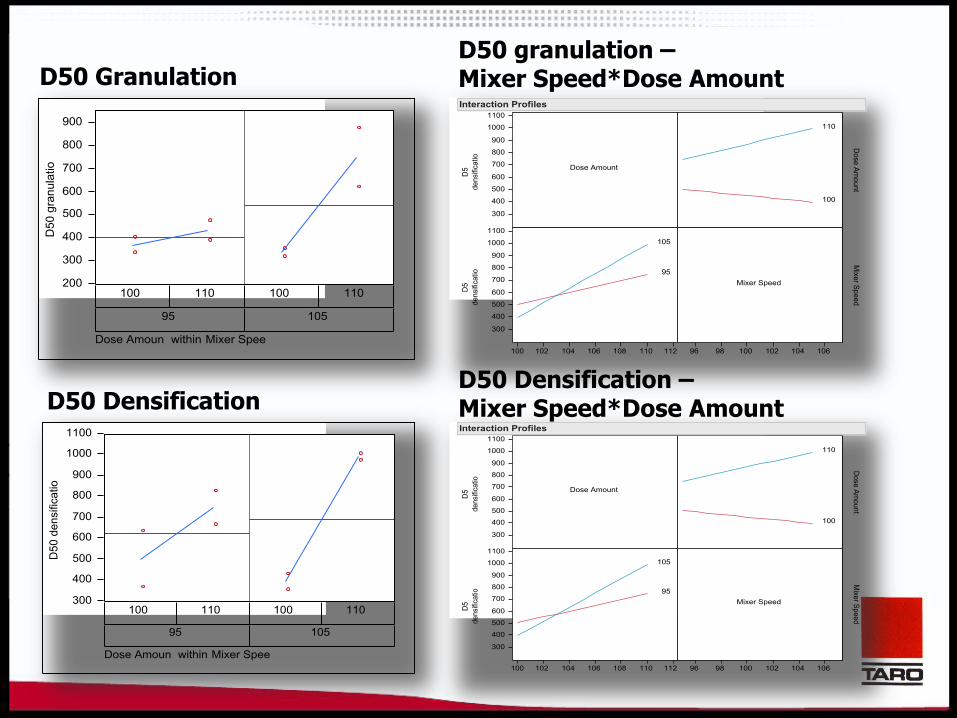
D50 Granulation D50 granulation – Mixer Speed*Dose Amount
D50 Densification D50 Densification – Mixer Speed*Dose Amount
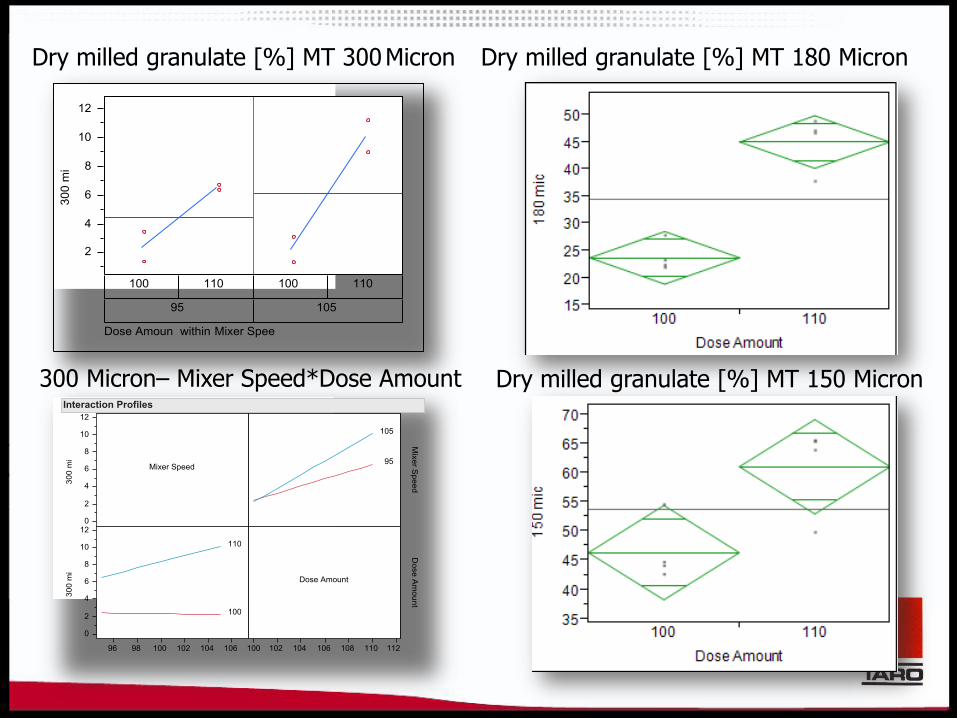
Dry milled granulate [%] MT 300 Micron Dry milled granulate [%] MT 180 Micron
Dry milled granulate [%] MT 150 Micron 300 Micron– Mixer Speed*Dose Amount
DOE Study – Initial Conclusions
For KW granulation (KWg) and KW densification (KWd) data, the factors Mixer Speed and Dose Amount were found significant
For D50 granulation and D50 densification data, the factor Dose Amount was
found significant. P-value for Mixer Speed*Dose Amount interaction was found to be higher than 0.05 but lower than 0.1, therefore the interaction effect is borderline
For 300 mic data, the factor Dose Amount was found significant. P-value for Mixer Speed*Dose Amount interaction was found to be higher than 0.05 and slightly higher than 0.1, therefore the interaction effect is borderline
For 180 mic and 150 mic data, the factor Dose Amount was found significant. For 75 mic data, no factors were found significant
It is recommended to explore more data for examination of the
interaction effect and the model
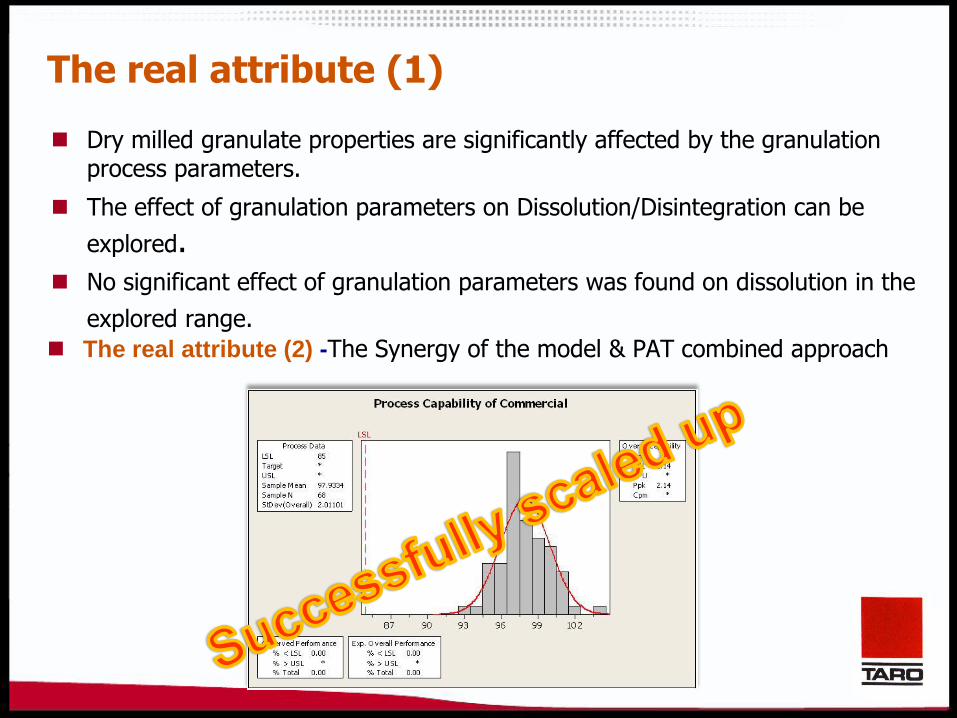
The real attribute (1)
Dry milled granulate properties are significantly affected by the granulation process parameters.
The effect of granulation parameters on Dissolution/Disintegration can be
explored.
No significant effect of granulation parameters was found on dissolution in the
explored range.
The real attribute (2) -The Synergy of the model & PAT combined approach
Case Study 2 – Blending
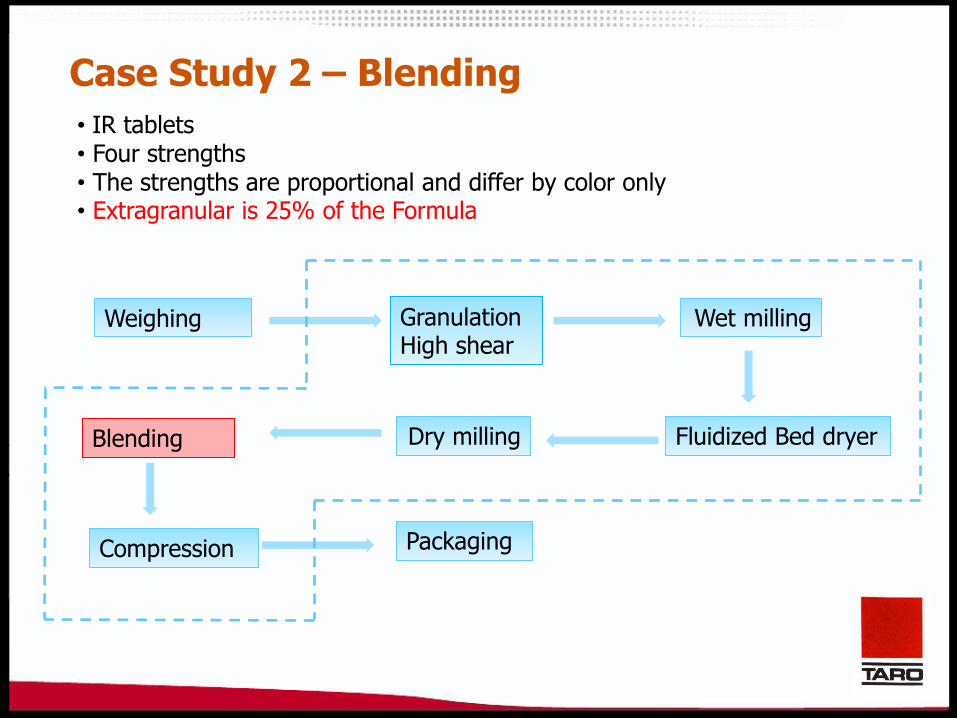
• IR tablets • Four strengths • The strengths are proportional and differ by color only • Extragranular is 25% of the Formula
Weighing
Fluidized Bed dryer
Wet milling Granulation High shear
Dry milling
Compression Packaging
Blending
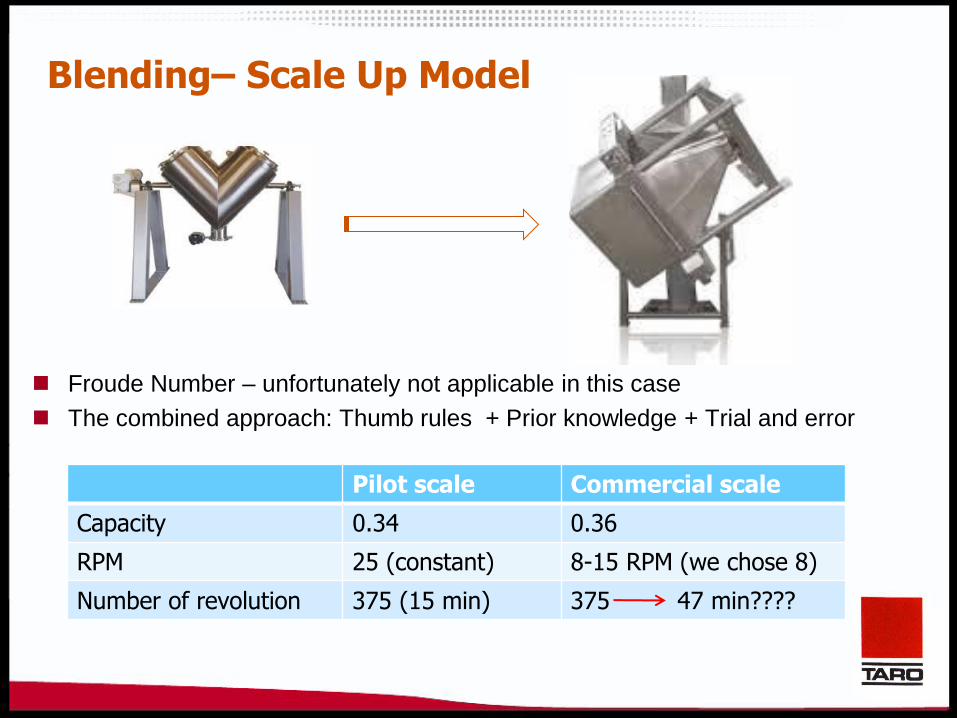
Blending– Scale Up Model
Froude Number – unfortunately not applicable in this case
The combined approach: Thumb rules + Prior knowledge + Trial and error
Commercial scale Pilot scale
0.36 0.34 Capacity
8-15 RPM (we chose 8) 25 (constant) RPM
375 47 min???? 375 (15 min) Number of revolution
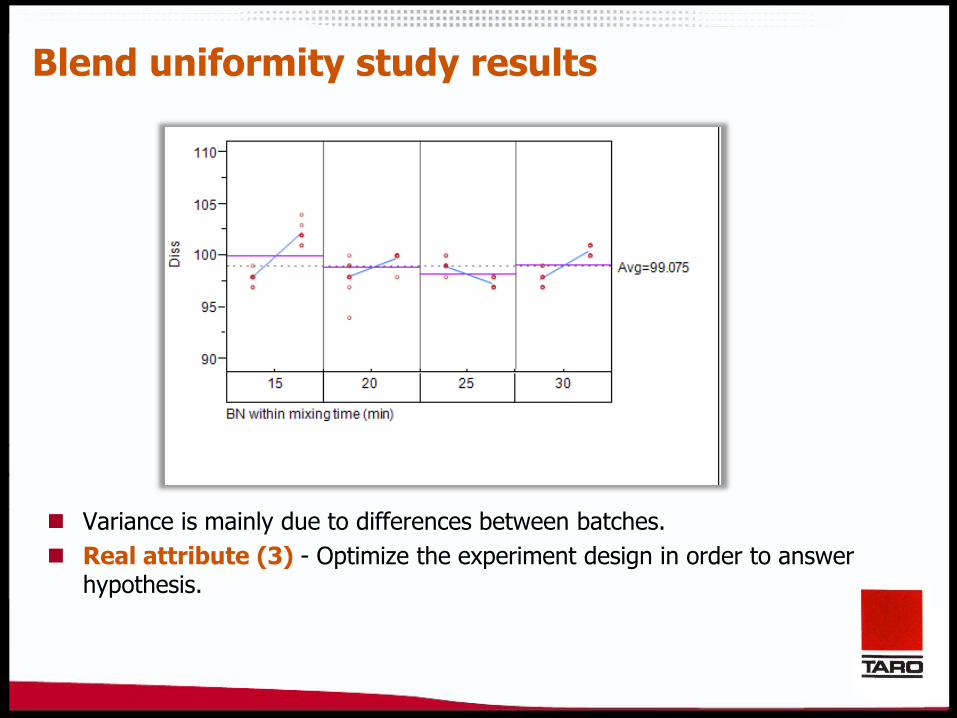
Blend uniformity study results
Variance is mainly due to differences between batches.
Real attribute (3) - Optimize the experiment design in order to answer hypothesis.
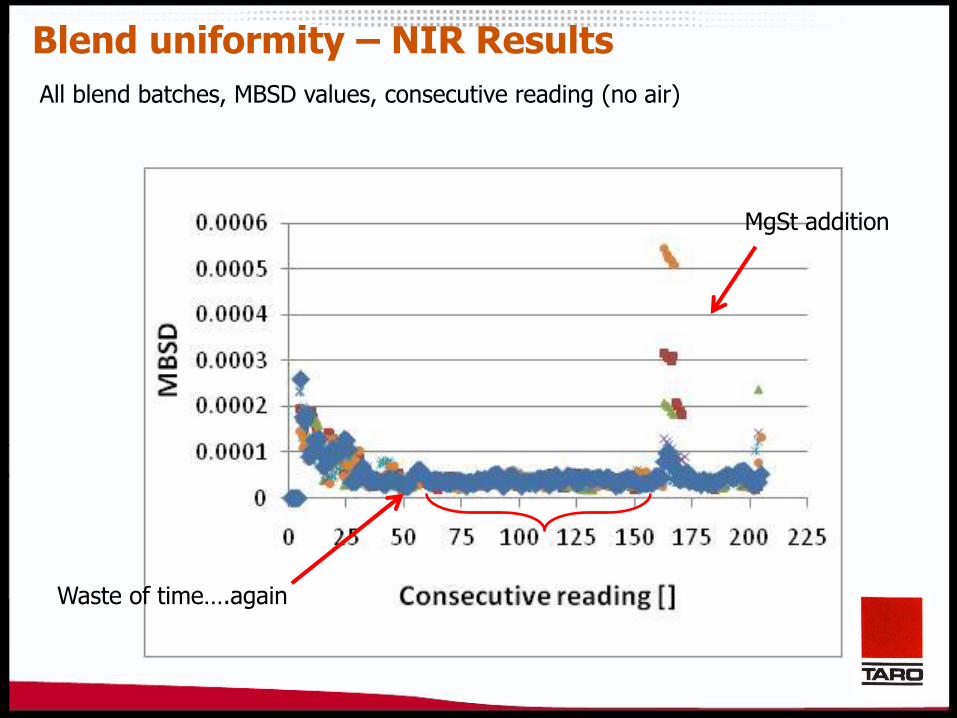
All blend batches, MBSD values, consecutive reading (no air)
MgSt addition
Waste of time….again
Blend uniformity – NIR Results
Weighing
Fluidized Bed dryer
Wet milling Granulation High shear
Dry milling Blending
Compression Packaging
Case study 3 – Tablet Compression
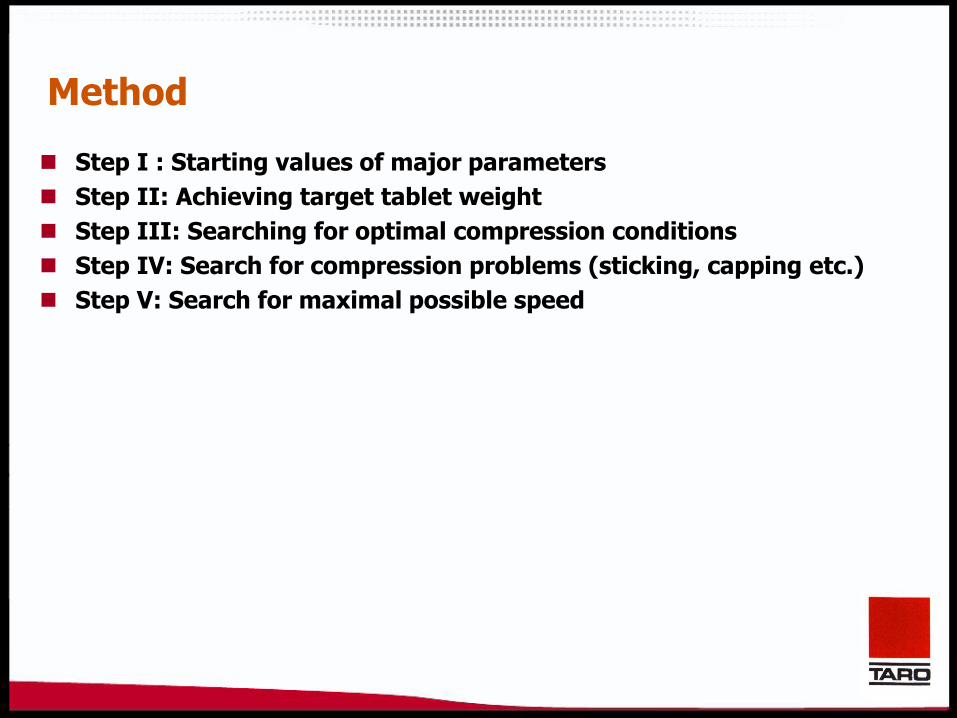
Method
Step I : Starting values of major parameters
Step II: Achieving target tablet weight
Step III: Searching for optimal compression conditions
Step IV: Search for compression problems (sticking, capping etc.)
Step V: Search for maximal possible speed
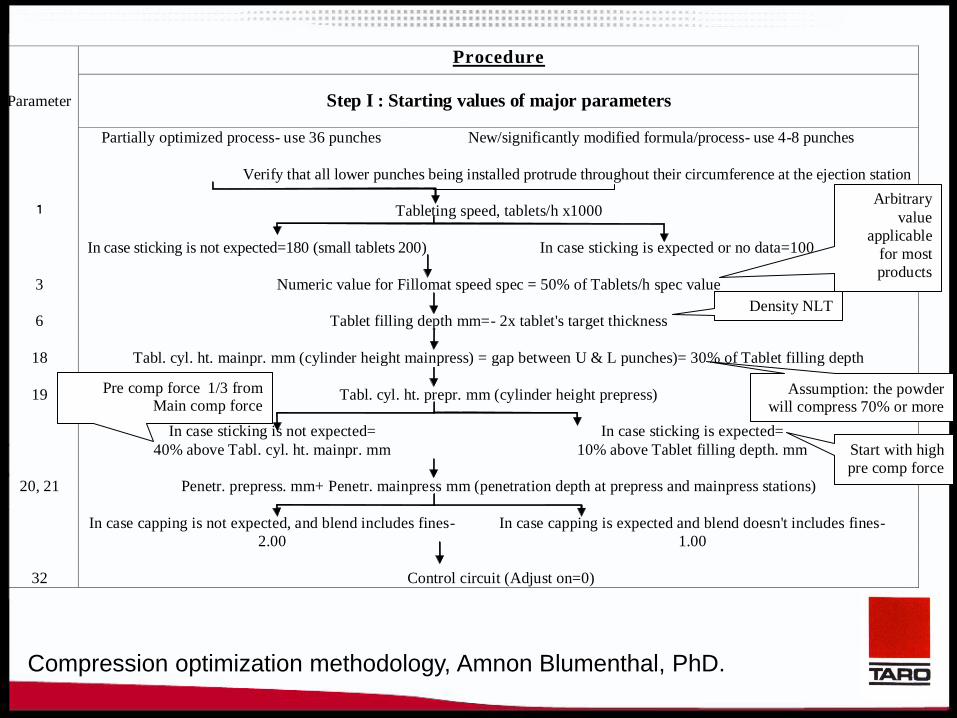
Procedure
Sub
step Parameter
Step I : Starting values of major parameters
1) Partially optimized process- use 36 punches New/significantly modified formula/process- use 4-8 punches
2) Verify that all lower punches being installed protrude throughout their circumference at the ejection station
3) 1 Tableting speed, tablets/h x1000
In case sticking is not expected=180 (small tablets 200) In case sticking is expected or no data=100
4) 3 Numeric value for Fillomat speed spec = 50% of Tablets/h spec value
5) 6 Tablet filling depth mm=- 2x tablet's target thickness
6) 18 Tabl. cyl. ht. mainpr. mm (cylinder height mainpress) = gap between U & L punches)= 30% of Tablet filling depth
19 Tabl. cyl. ht. prepr. mm (cylinder height prepress)
7) In case sticking is not expected=
40% above Tabl. cyl. ht. mainpr. mm
In case sticking is expected=
10% above Tablet filling depth. mm
20, 21 Penetr. prepress. mm+ Penetr. mainpress mm (penetration depth at prepress and mainpress stations)
8) In case capping is not expected, and blend includes fines-
2.00
In case capping is expected and blend doesn't includes fines-
1.00
9) 32 Control circuit (Adjust on=0)
Arbitrary
value
applicable
for most
products
Density NLT
0.5
Assumption: the powder will compress 70% or more
Start with high
pre comp force
Pre comp force 1/3 from Main comp force
Compression optimization methodology, Amnon Blumenthal, PhD.
0
5
10
15
20
25
30
0.8 1.3 1.8 2.3 2.8 3.3 3.8
kP
/kN
mm
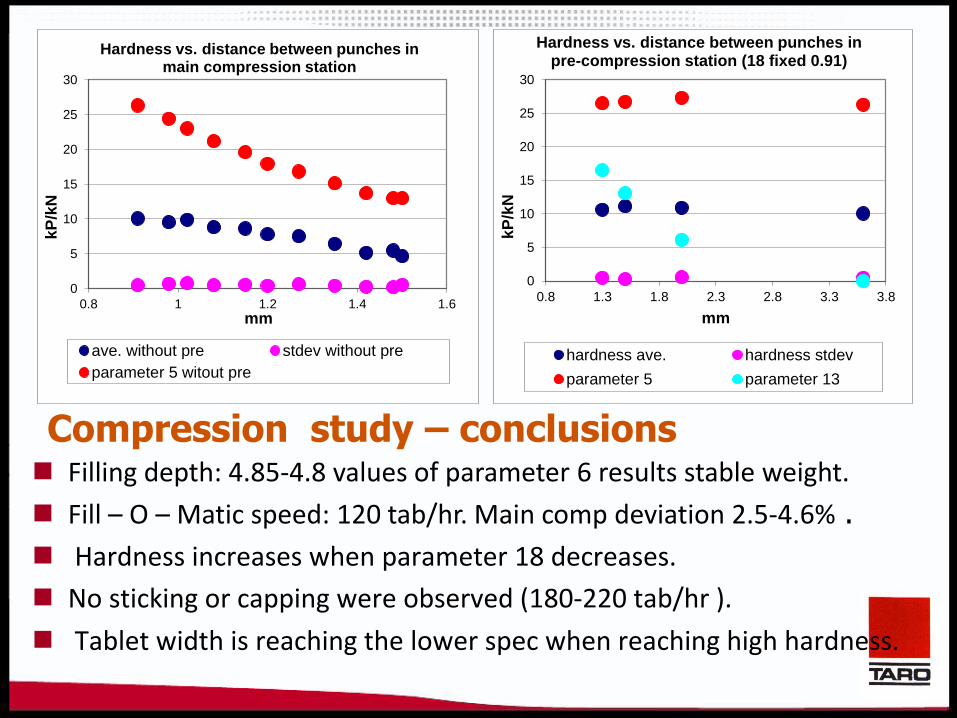
Hardness vs. distance between punches in pre-compression station (18 fixed 0.91)
hardness ave. hardness stdev
parameter 5 parameter 13
0
5
10
15
20
25
30
0.8 1 1.2 1.4 1.6
kP
/kN
mm
Hardness vs. distance between punches in main compression station
ave. without pre stdev without pre
parameter 5 witout pre
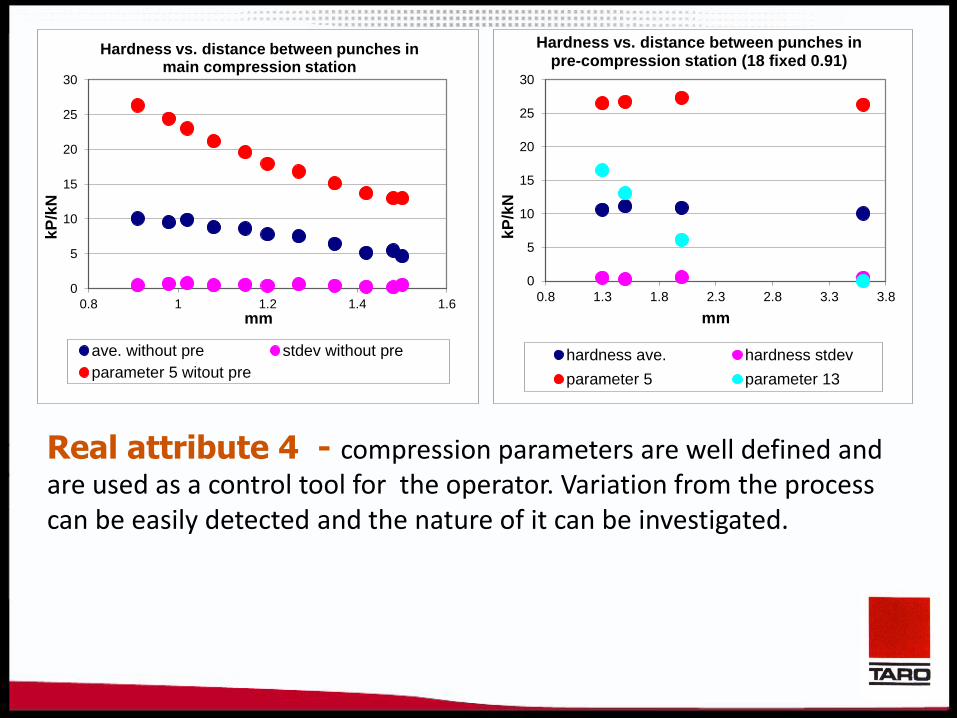
Compression study – conclusions Filling depth: 4.85-4.8 values of parameter 6 results stable weight.
Fill – O – Matic speed: 120 tab/hr. Main comp deviation 2.5-4.6% .
Hardness increases when parameter 18 decreases.
No sticking or capping were observed (180-220 tab/hr ).
Tablet width is reaching the lower spec when reaching high hardness.
0
5
10
15
20
25
30
0.8 1.3 1.8 2.3 2.8 3.3 3.8
kP
/kN
mm
Hardness vs. distance between punches in pre-compression station (18 fixed 0.91)
hardness ave. hardness stdev
parameter 5 parameter 13
0
5
10
15
20
25
30
0.8 1 1.2 1.4 1.6
kP
/kN
mm
Hardness vs. distance between punches in main compression station
ave. without pre stdev without pre
parameter 5 witout pre
Real attribute 4 - compression parameters are well defined and are used as a control tool for the operator. Variation from the process can be easily detected and the nature of it can be investigated.
This product was launched 5 years ago.
Taro purchased the Parsum system 2 years ago.
Taro purchased the first NIR system 5 years ago.
The original pilot scale parameters were not scalable.
The process was developed using the scale up methodology which was presented . Only sieve data was available.
Since launch 409 batches were manufactured, 2 were rejected. None due to process related issues.
Process capability for all CQA is greater then 1.3.
Few more facts, we are nearly there…..
So, Why we conducted this study?
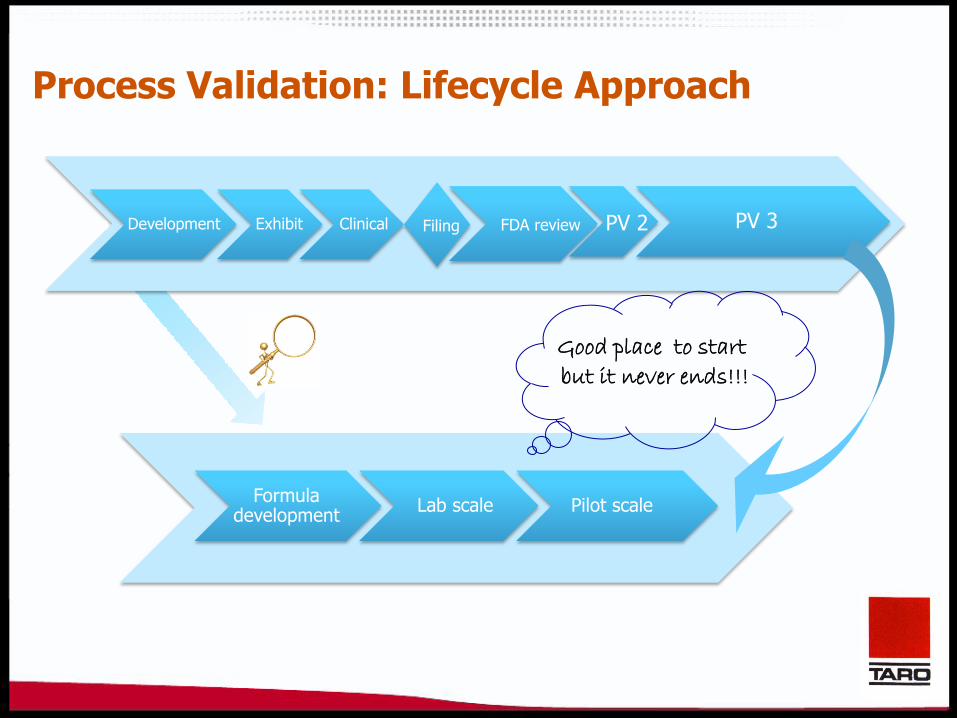
Filing Selection Development Exhibit Clinical FDA review
Lab scale Formula
development Pilot scale
Good place to start
but it never ends!!!
PV 2 PV 3
Process Validation: Lifecycle Approach
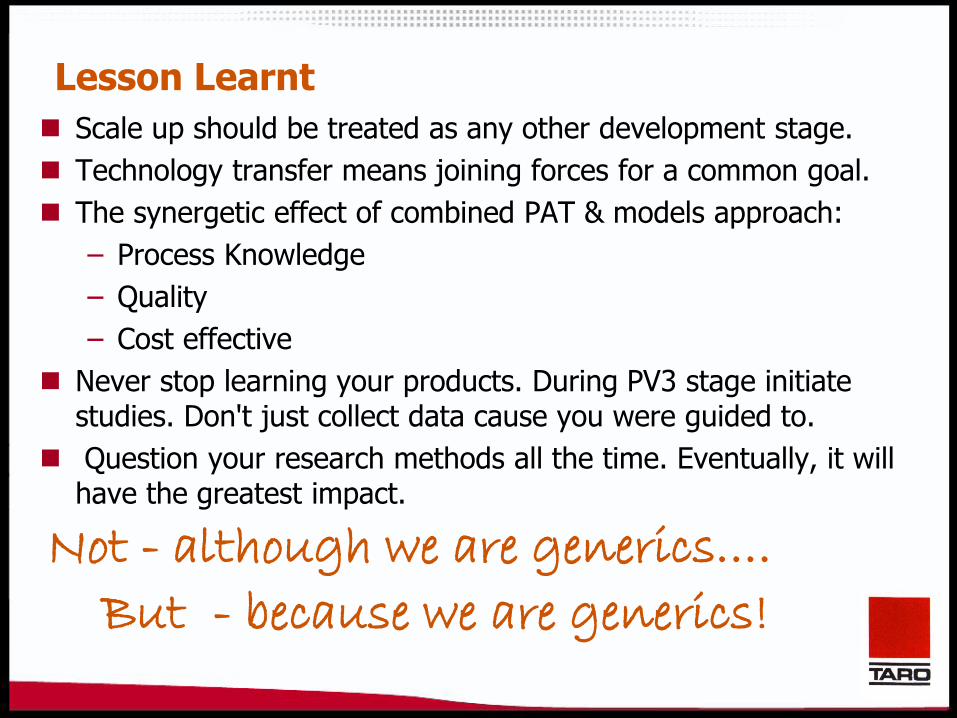
Scale up should be treated as any other development stage.
Technology transfer means joining forces for a common goal.
The synergetic effect of combined PAT & models approach:
– Process Knowledge
– Quality
– Cost effective
Never stop learning your products. During PV3 stage initiate studies. Don't just collect data cause you were guided to.
Question your research methods all the time. Eventually, it will have the greatest impact.
Lesson Learnt
Not - although we are generics….
But - because we are generics!

Acknowledgments Marta Lichtig, Senior Scientist Doron Yariv, PAT Expert Ella Katzir, Senior Technologist Sharon Levi, Statistician Rami Zajicek, site manager, for believing from the start

We lead with honesty & integrity
Our API is people
We think about what's best for
Taro
We live Quality &
Excellence
1950 Established
in Israel
1984 Topical product
operations in Canada
1988 Entered U.S. market
2010 Controlling shares
transferred to Sun Pharma
1961 Chemical synthesis
in Israel


