Download - Scania Q2 2011 Presentation
Press conference E ik Lj b C t R l tiErik Ljungberg, Corporate Relations
1
Interim Report, January–June 2011 J Ytt b CFOJan Ytterberg, CFO
2

First six months of 2011 – highlights
Stable earningsI d l– Increased volume
– Currency head-winds– Altered market mix– Investments for future growth
ROCE 44.2% (23.4%)*
*Rolling 12 month
3

Volume trendT t l d li i t k d bTotal deliveries, trucks and buses
Units
Deliveries +42% in H1 2011
24,000
20,000
More vehicles to Russia and Middle
16,000
East – fewer to Brazil 8,000
12,000
Lower production rate in first part of
4,000
pQ2 2011 Q1
0Q1 Q2 Q3 Q4 Q1 Q2 Q3 Q4 Q1Q2 Q3Q4 Q1 Q2 Q3 Q4 Q2
2007 2008 2009 20112010
4
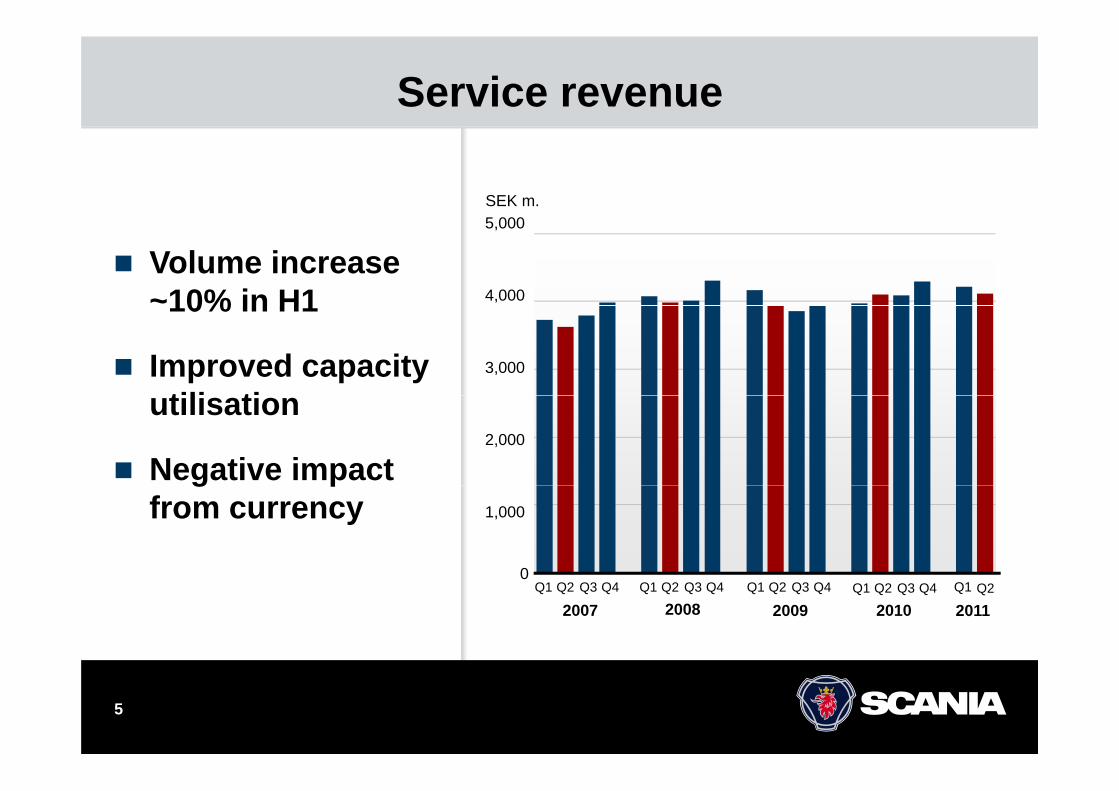
Service revenue
SEK m.
Volume increase ~10% in H1
5,000
4,00010% in H1
Improved capacity tili ti
3,000
utilisation
Negative impact 2,000
g pfrom currency 1,000
00Q1 Q2 Q3 Q4 Q1Q1 Q2 Q3 Q4 Q1 Q2 Q3 Q4 Q1 Q2 Q3 Q4
2007 2008 2009 2010 2011Q2
5
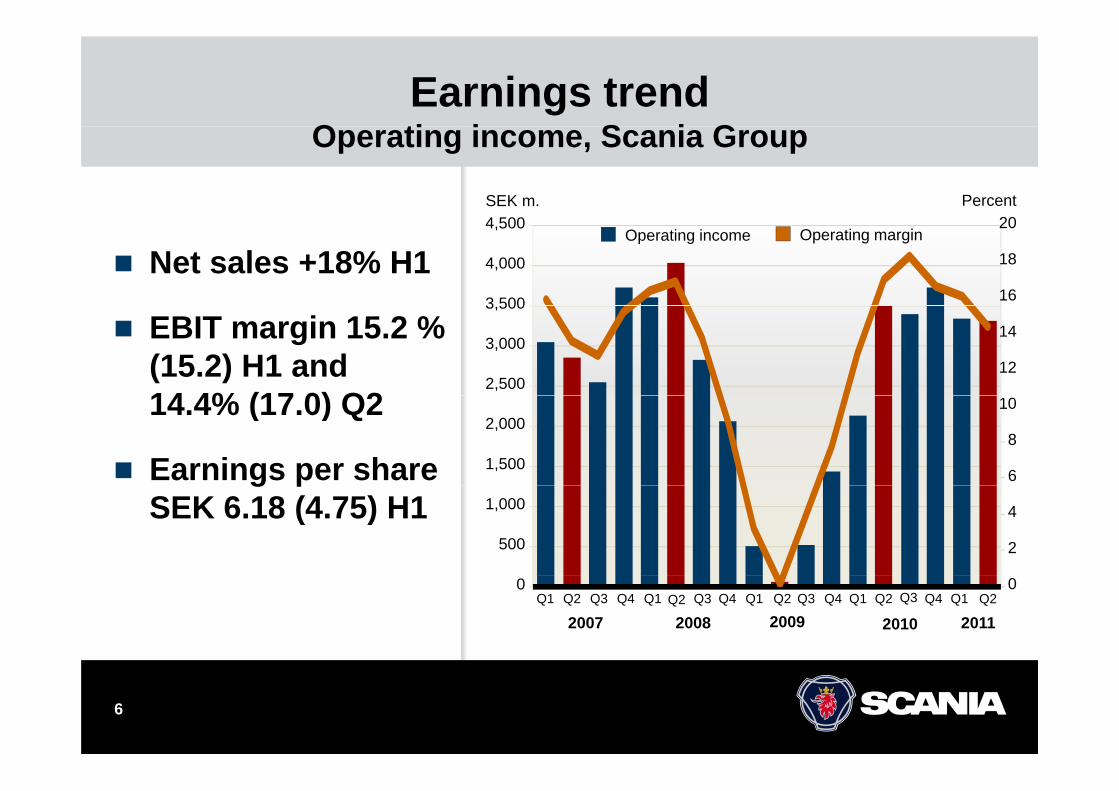
Earnings trendO ti i S i GOperating income, Scania Group
SEK m. Percent
Net sales +18% H1 4,000
4,500
3 500 16
20
18Operating marginOperating income
EBIT margin 15.2 % (15.2) H1 and 14 4% (17 0) Q2
3,000
3,500
2,50012
14
14.4% (17.0) Q2
Earnings per share 2,000
1,5008
6
10
g pSEK 6.18 (4.75) H1 1,000
500
4
2
Q2 Q3 Q4 Q1 Q2 Q3 Q4 Q1 Q2 Q3 Q4 Q1 Q2 Q3 Q4 Q10
Q10
2007 2008 2009 2010 2011Q2
6

Operating incomeV hi l d S iVehicles and Services
EBIT increase due to:
EBIT increase:
+ Volume
+ Price
– Volume– Price
SEK 821 m. H1 2011
- Currency
- Mix
- Cost level
Negative effects:– Currency - Cost levely– Market mix– Higher cost level
7
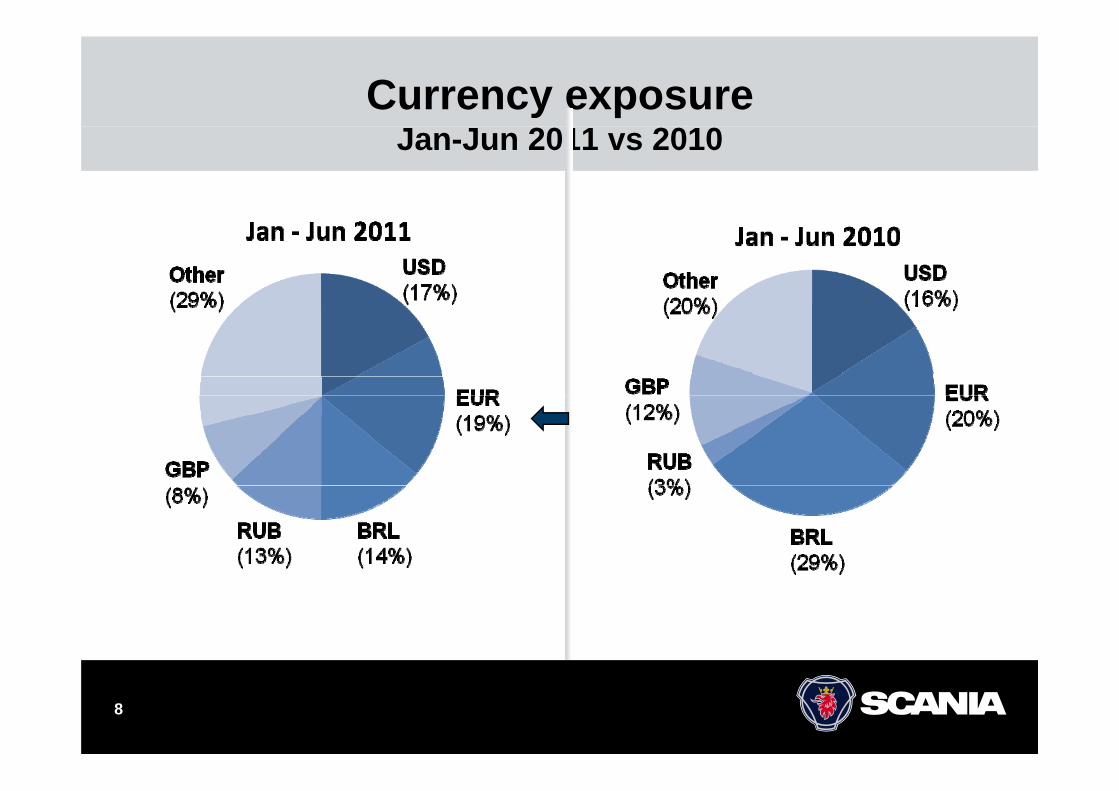
Currency exposureJan-Jun 2011 vs 2010
8
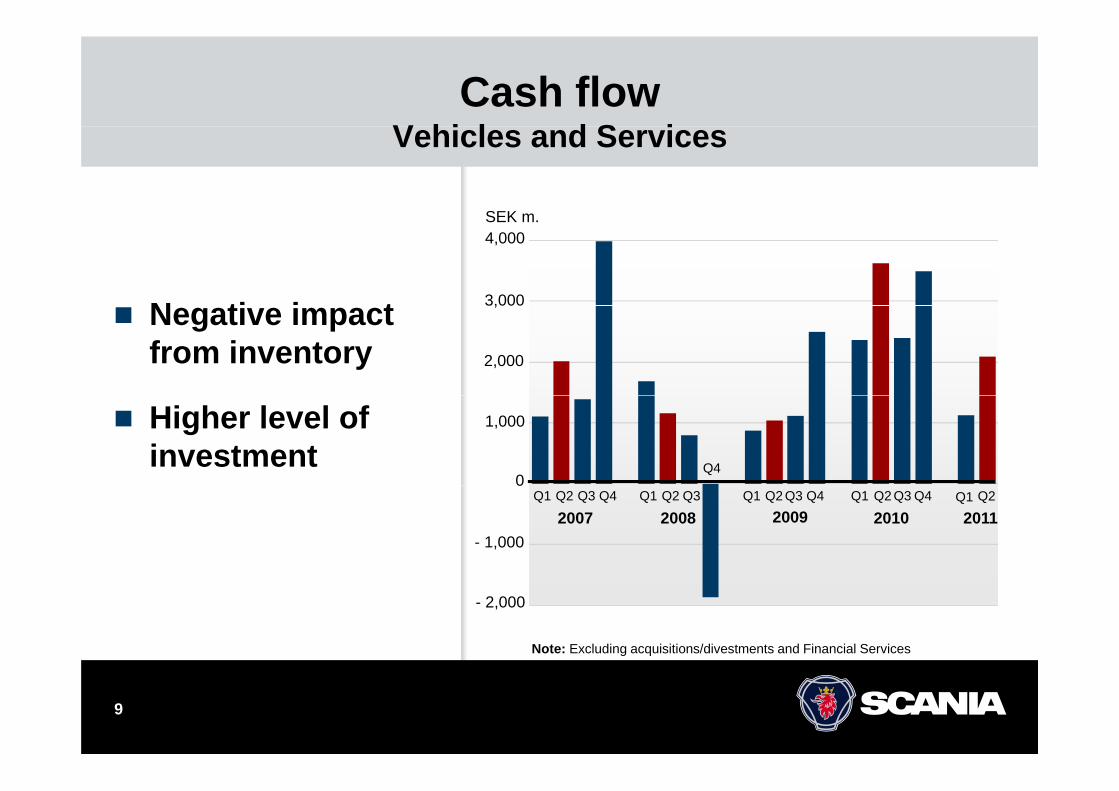
Cash flowV hi l d S iVehicles and Services
SEK m
N ti i t 3,000
4,000SEK m.
Negative impact from inventory 2,000
,
Higher level of investment
0
1,000
Q4
- 1,000
0
2007Q1 Q2 Q3 Q4
2008Q1 Q2 Q3
2009Q1 Q2 Q3 Q4
2010Q1 Q2 Q3 Q4
2011Q1 Q2
Note: Excluding acquisitions/divestments and Financial Services
- 2,000
9
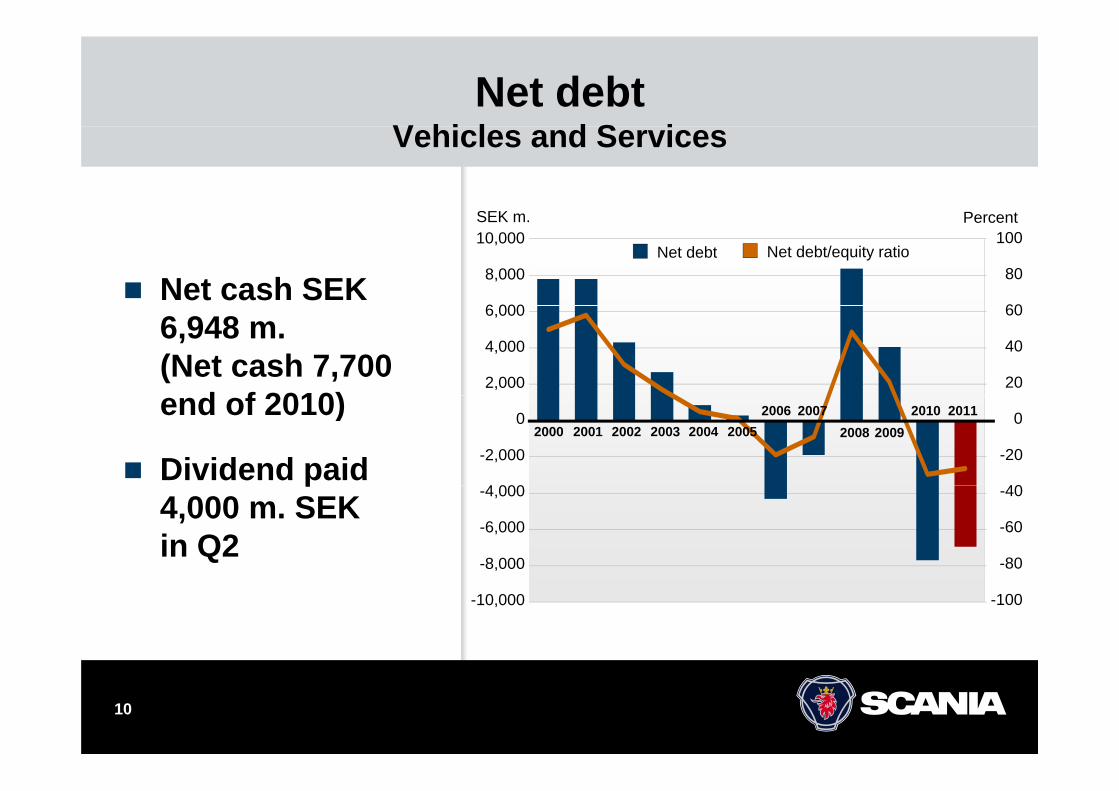
Net debtV hi l d S iVehicles and Services
SEK m Percent
Net cash SEK 8,000
6 000
SEK m.
60
100
80
Percent
Net debt/equity ratioNet debt10,000
6,948 m. (Net cash 7,700
d f 2010)2,000
6,000 60
404,000
20
end of 2010)
Dividend paid
0 20102008 20092001 2002 2003 2004 2005
2006 20072000
-2,000 -20
404 000
02011
p4,000 m. SEK in Q2
-40-4,000
-8,000
-6,000
-80
-60
-100-10,000
10

Volume trendC dit tf li Fi i l S iCredit portfolio, Financial Services
SEK m
Portfolio +8%*,i d f 2010
50,000
40 000
45,000
SEK m.
since end of 2010
Lower level of bad 30,000
35,000
40,000
debt expenses
Operating income 15 000
20,000
25,000
Operating income SEK 131 (49) m. in Q2
10,000
5,000
15,000
020071999 2001 2003 2005 20091997 2011
* In local currencies
11

Summary
Stable earningsVolume increase– Volume increase
– Currency head-windsAltered market mix– Altered market mix
– Investments for future growth
ROCE 44.2% (23.4%)*
*Rolling 12 month
12
13
OutlookL if Ö tli P id t d CEOLeif Östling, President and CEO
14

Business overview – First six months
Improved European demand
Still high demand in Latin America
Strong demand in Middle East and Russia
High demand for service
15

Growth in order bookings
Order bookings trucks per quarter30 000 Leadtimes 6-8
Units Lead times 8 10
20 000
25 000
weekstimes 8-10 months
15 000
20 000
5 000
10 000
0Q1
1996Q1
1998Q1
2000Q1
2002Q1
2004Q1
2006Q1
2008Q1
2010Q21996
Q21998
Q22000
Q22002
Q22004
Q22006
Q22008
Q220101996 1998 2000 2002 2004 2006 2008 20101996 1998 2000 2002 2004 2006 2008 2010
16
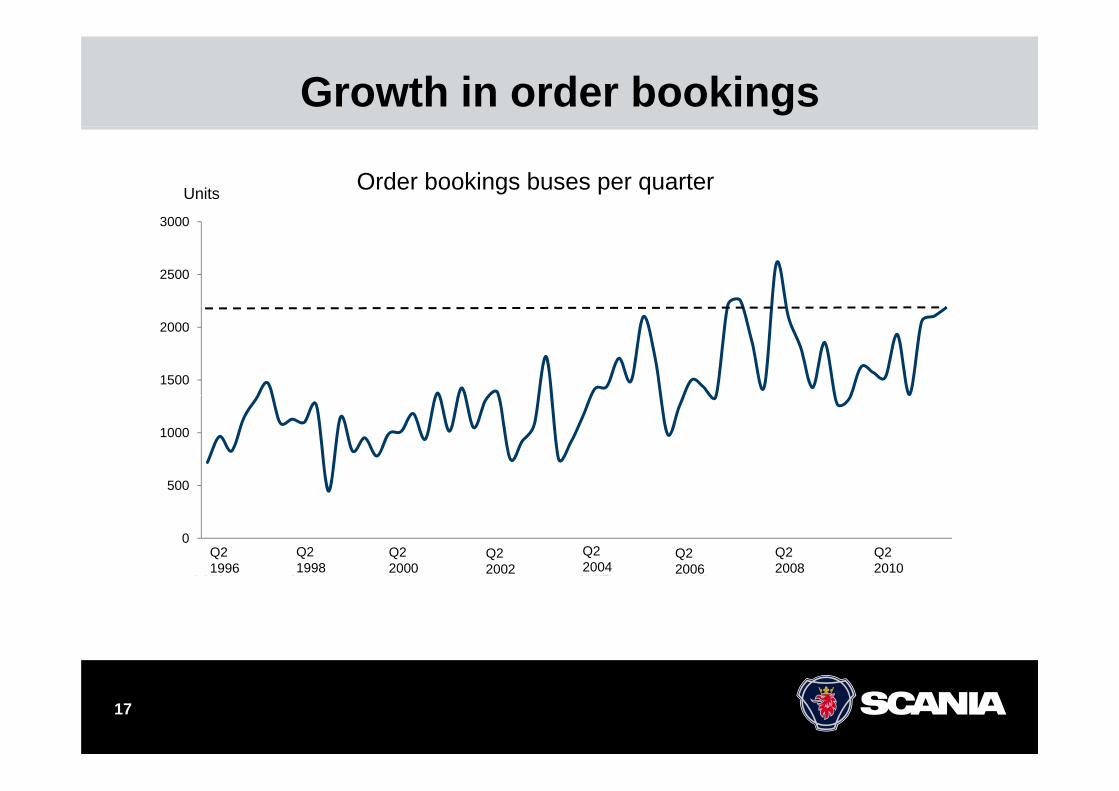
Growth in order bookings
Order bookings buses per quarterUnits
2500
3000
1500
2000
500
1000
0
500
Q11996
Q11998
Q12000
Q12002
Q12004
Q12006
Q12008
Q12010
Q21996
Q21998
Q22000
Q22002
Q22004
Q22006
Q22008
Q220101996 1998 2000 2002 2004 2006 2008 2010
17

Share of vehicle deliveries Q2 2011(2010)(2010)
EuropeEurasia
9% (2%)Europe 41% (38%)
9% (2%)
Latin America 26% (32%)
Asia19% (22%)26% (32%) Africa &
Oceania5% (6%)5% (6%)
1818

Investments to support growth
New companies in India and Japan
R&D investments to strengthen product
tf liportfolio
Investments in sales & service capacity
19
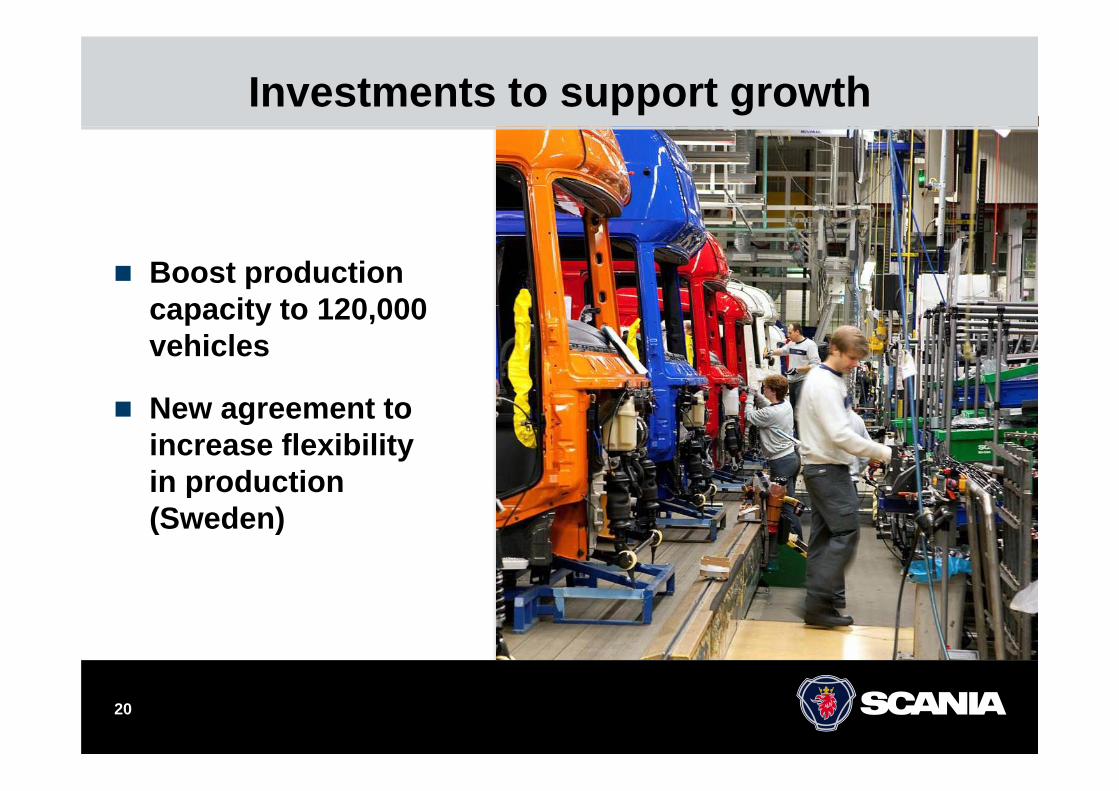
Investments to support growth
Boost production capacity to 120 000capacity to 120,000 vehicles
New agreement to increase flexibility in productionin production (Sweden)
20

21


