235
IRA-International Journal of Technology &
Engineering
ISSN 2455-4480; Vol.03, Issue 03 (2016)
Institute of Research Advances
http://research-advances.org/index.php/IRAJTE
Seasonal Variations in Water Quality of
Shipra River in Ujjain, India
Dr. Parag Dalal
Asst. Prof. Chemical Engineering Department,
Ujjain Engineering College, Ujjain , India.
DOI: http://dx.doi.org/10.21013/jte.v3.n3.p13
How to cite this paper:
Dalal, P. (2016). Seasonal Variations in Water Quality of Shipra River in Ujjain, India.
IRA-International Journal of Technology & Engineering (ISSN 2455-4480), 3(3).
doi:http://dx.doi.org/10.21013/jte.v3.n3.p13
© Institute of Research Advances
This works is licensed under a Creative Commons Attribution-Non Commercial 4.0
International License subject to proper citation to the publication source of the work.
Disclaimer: The scholarly papers as reviewed and published by the Institute of Research
Advances (IRA) are the views and opinions of their respective authors and are not the
views or opinions of the IRA. The IRA disclaims of any harm or loss caused due to the
published content to any party.
IRA-International Journal of Technology & Engineering
236
ABSTRACT
Shipra River is a major river and is lifeline of thousands of people in Ujjain city and
nearby areas. Shipra has been subjected to assault of the adverse impact of
industrialization and urbanization. The problem has aggravated because of the
uncontrolled flow of municipal and domestic sewers dumping directly into river. The
present pollution loads also contributes a lot of toxic heavy metals of industrial area of
Indore merged by Khan River water. Due to zero flow the river Shipra lacks the self
purification scheme of rivers and streams.
In this study the water samples are collected from five different Sampling zones
at a distance of 3 Kms from each other. Various Variables are found in the Downstream
of the river, co-relation between various Physico-Chemical variables are been
calculated. This depicts tremendous pollution meters and drastic change in water quality
of river water. The mixing of Narmada Water contributes in a slight restoration of water
parameters and improves the quality of water.
Keywords – Shipra River, industrialization, urbanization, Indore, Khan River, Sampling
zones, River Narmada Water, Physico-Chemical variables.
Introduction –
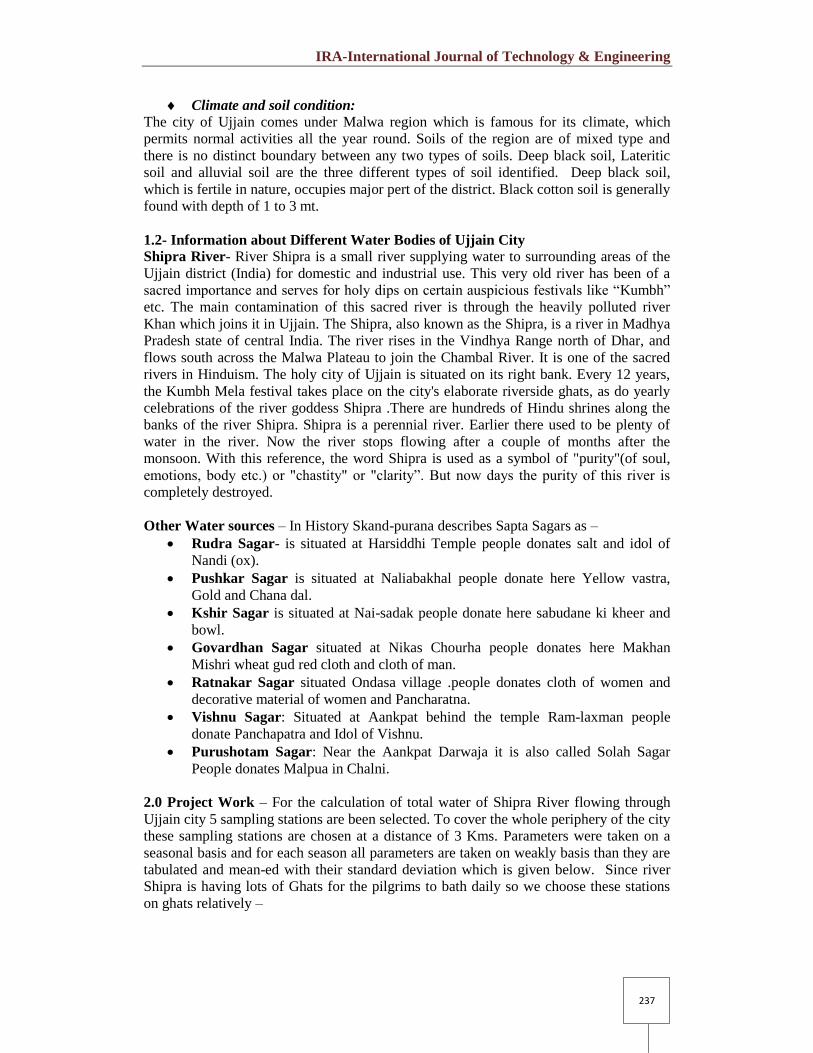
Historical Information about Ujjain:
Ujjain is a historical and religious city and is 184
km. away from Bhopal the capital of M.P. In ancient
time it is famous as Avantika, Vaishali, Ujjaini,
Shivpuri, Aravati and Padamavati. World famous
“Mahakaleshwar Jyotirling” is situated here. This is
one of the greatest Jyotirlings among all the twelve.
Its “Bhasma Aarti” is famous in the world. “Kumbha
Parva” which is also known as “Simhastha” is also
celebrated after an each interval of 12 year. It is
assumed that “Amrit” Dropped in four places during
“Samudra Manthan” Ujjain is one of them. Lord
Krishna and his brother Balram also came here for
studies “Maharishi Sandipani was their guruji. Great
King Ashoka, Bhatrathari and Vikramaditya had
ruled the Ujjain. King Vikrmaditya was famous for
his “judgment table” (Sinhasan Battisi) ujjain is the
birthplace of great Sanskrit poet “Kalidas” and also
great mathematician “Varahamihir”.
Location and regional settings
Ujjain is situated on a unique geographical location from where tropic of cancer passes. It
is the „Greenwich Mean Time‟ of India for Panchang. The tilting of earth at angle of 23.5
degree on its axis and geographical line of tropic of cancer has special cosmic influence
making it fit for absolute time location. Situated on the bank of river Shipra which is the
only river that travels straight from south to north.
IRA-International Journal of Technology & Engineering
237
Climate and soil condition:
The city of Ujjain comes under Malwa region which is famous for its climate, which
permits normal activities all the year round. Soils of the region are of mixed type and
there is no distinct boundary between any two types of soils. Deep black soil, Lateritic
soil and alluvial soil are the three different types of soil identified. Deep black soil,
which is fertile in nature, occupies major pert of the district. Black cotton soil is generally
found with depth of 1 to 3 mt.
1.2- Information about Different Water Bodies of Ujjain City
Shipra River- River Shipra is a small river supplying water to surrounding areas of the
Ujjain district (India) for domestic and industrial use. This very old river has been of a
sacred importance and serves for holy dips on certain auspicious festivals like “Kumbh”
etc. The main contamination of this sacred river is through the heavily polluted river
Khan which joins it in Ujjain. The Shipra, also known as the Shipra, is a river in Madhya
Pradesh state of central India. The river rises in the Vindhya Range north of Dhar, and
flows south across the Malwa Plateau to join the Chambal River. It is one of the sacred
rivers in Hinduism. The holy city of Ujjain is situated on its right bank. Every 12 years,
the Kumbh Mela festival takes place on the city's elaborate riverside ghats, as do yearly
celebrations of the river goddess Shipra .There are hundreds of Hindu shrines along the
banks of the river Shipra. Shipra is a perennial river. Earlier there used to be plenty of
water in the river. Now the river stops flowing after a couple of months after the
monsoon. With this reference, the word Shipra is used as a symbol of "purity"(of soul,
emotions, body etc.) or "chastity" or "clarity”. But now days the purity of this river is
completely destroyed.
Other Water sources – In History Skand-purana describes Sapta Sagars as –
Rudra Sagar- is situated at Harsiddhi Temple people donates salt and idol of
Nandi (ox).
Pushkar Sagar is situated at Naliabakhal people donate here Yellow vastra,
Gold and Chana dal.
Kshir Sagar is situated at Nai-sadak people donate here sabudane ki kheer and
bowl.
Govardhan Sagar situated at Nikas Chourha people donates here Makhan
Mishri wheat gud red cloth and cloth of man.
Ratnakar Sagar situated Ondasa village .people donates cloth of women and
decorative material of women and Pancharatna.
Vishnu Sagar: Situated at Aankpat behind the temple Ram-laxman people
donate Panchapatra and Idol of Vishnu.
Purushotam Sagar: Near the Aankpat Darwaja it is also called Solah Sagar
People donates Malpua in Chalni.
2.0 Project Work – For the calculation of total water of Shipra River flowing through
Ujjain city 5 sampling stations are been selected. To cover the whole periphery of the city
these sampling stations are chosen at a distance of 3 Kms. Parameters were taken on a
seasonal basis and for each season all parameters are taken on weakly basis than they are
tabulated and mean-ed with their standard deviation which is given below. Since river
Shipra is having lots of Ghats for the pilgrims to bath daily so we choose these stations
on ghats relatively –
IRA-International Journal of Technology & Engineering
238
Sampling Station – T – Triveni Ghat
Sampling Station – B – Bhookhi Mata Ghat
Sampling Station – R – Ram Ghat
Sampling Station – I – Industrial Area Agar Road
Sampling Station – M – Mangalnath Ghat
The parameters selected for analysis of water pollution were analyzed using standard
methods of APHA. Parameters taken at these ghats are –
Temperature
pH
Turbidity
TDS
DO
Free CO2
Hardness
BOD
COD
Chloride
Calcium
Magnesium
Phosphates
Nitrates
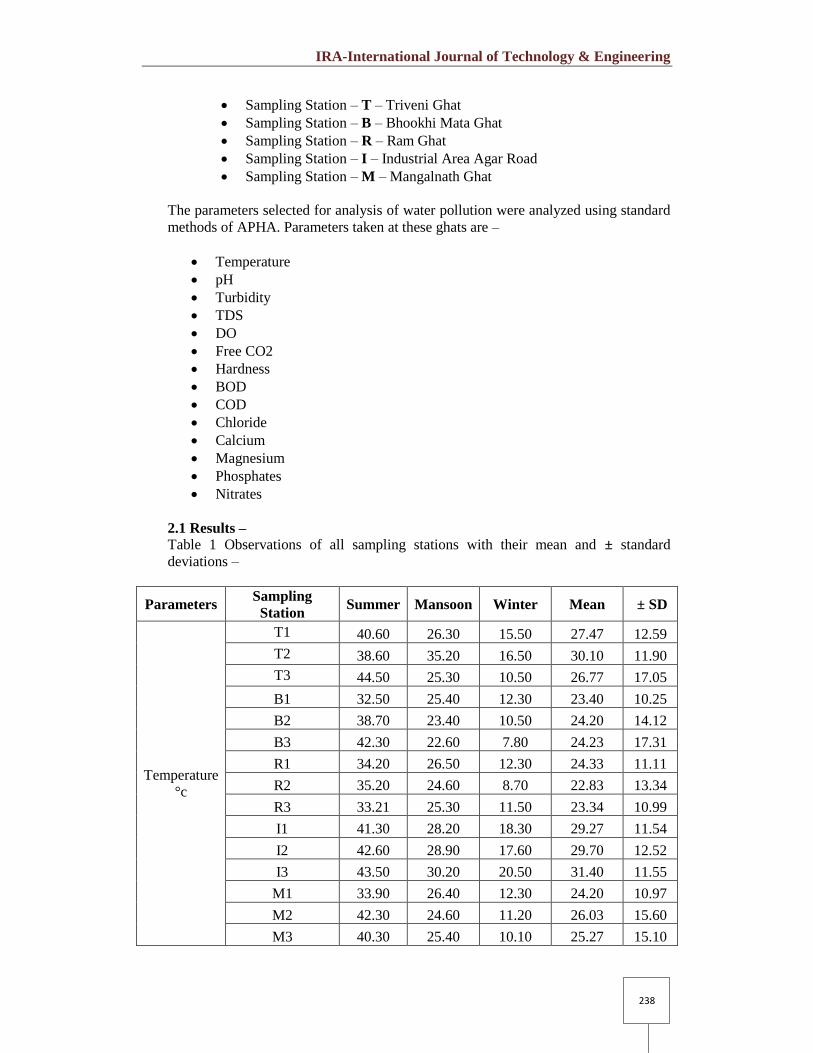
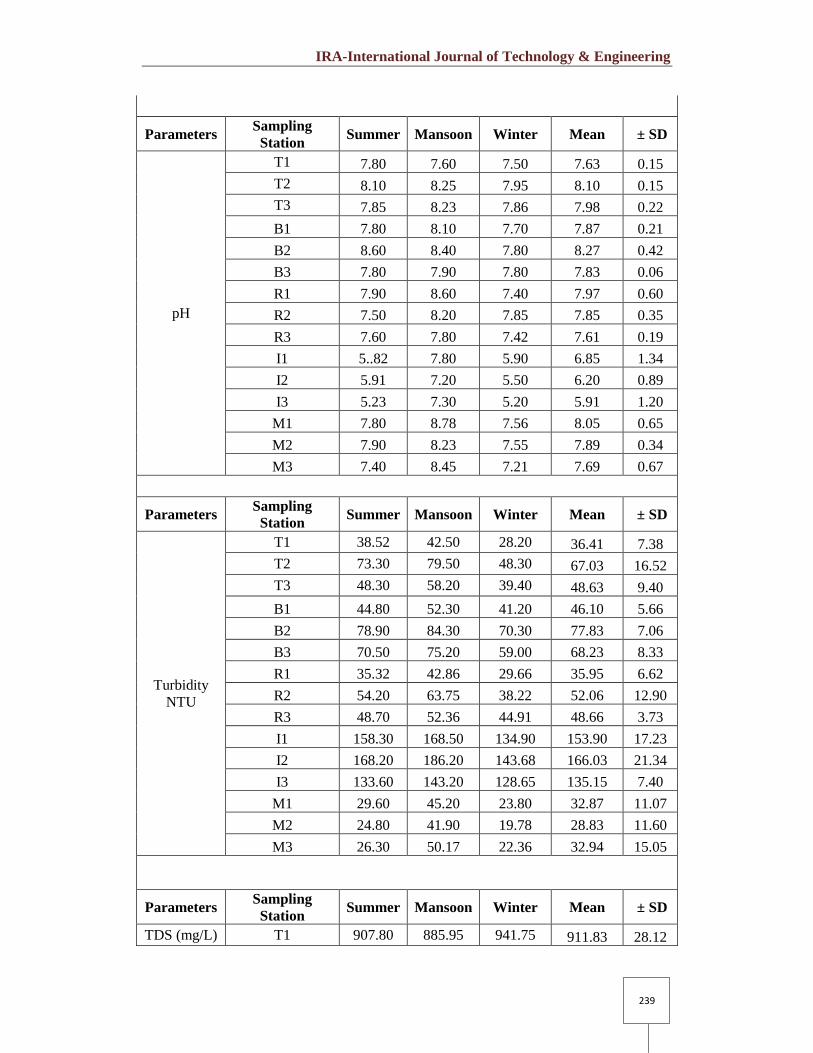
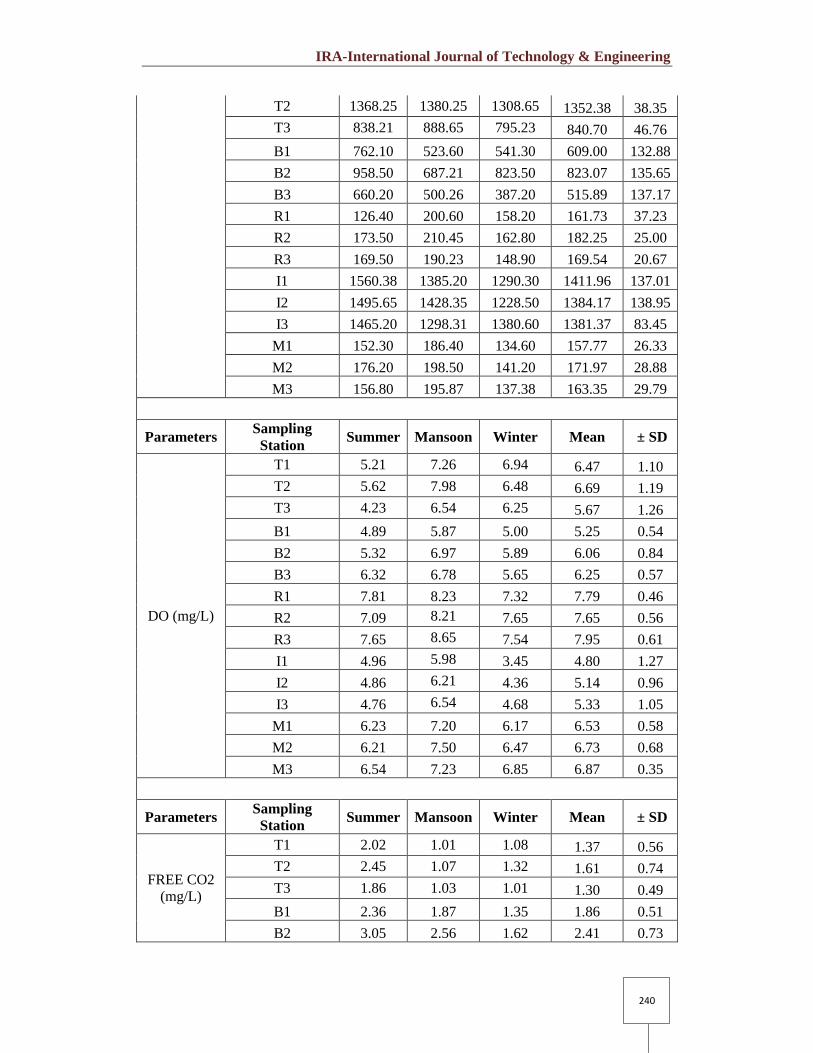
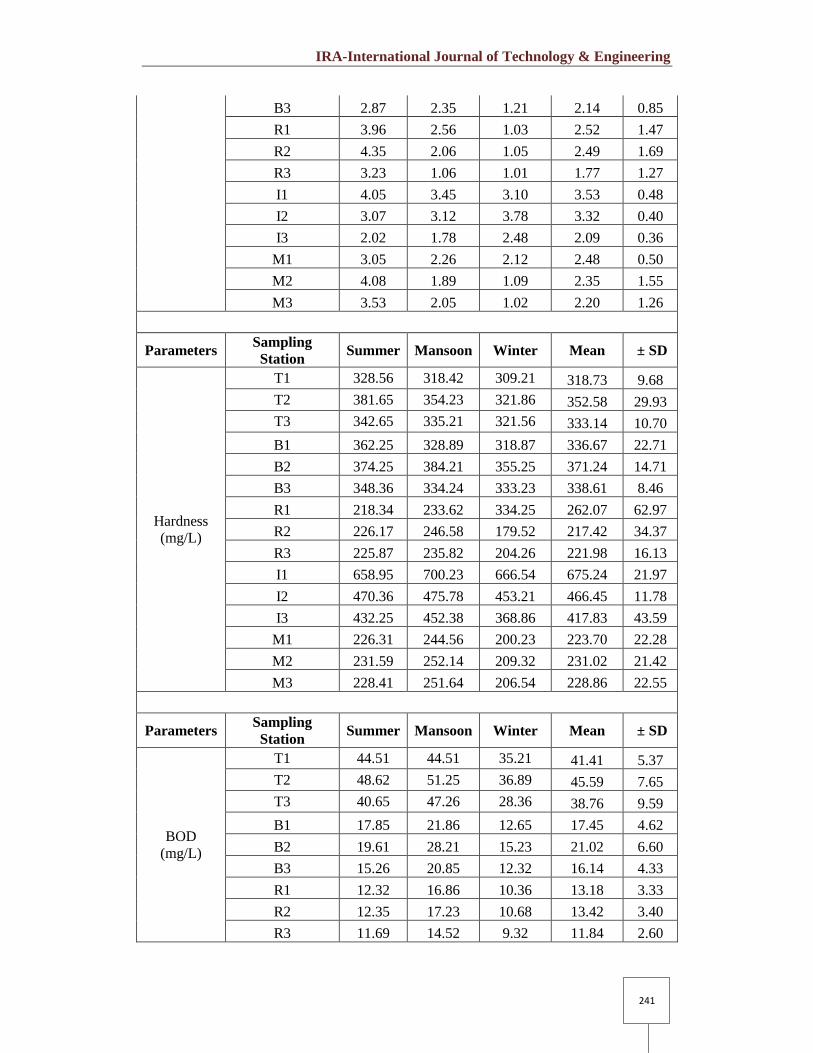
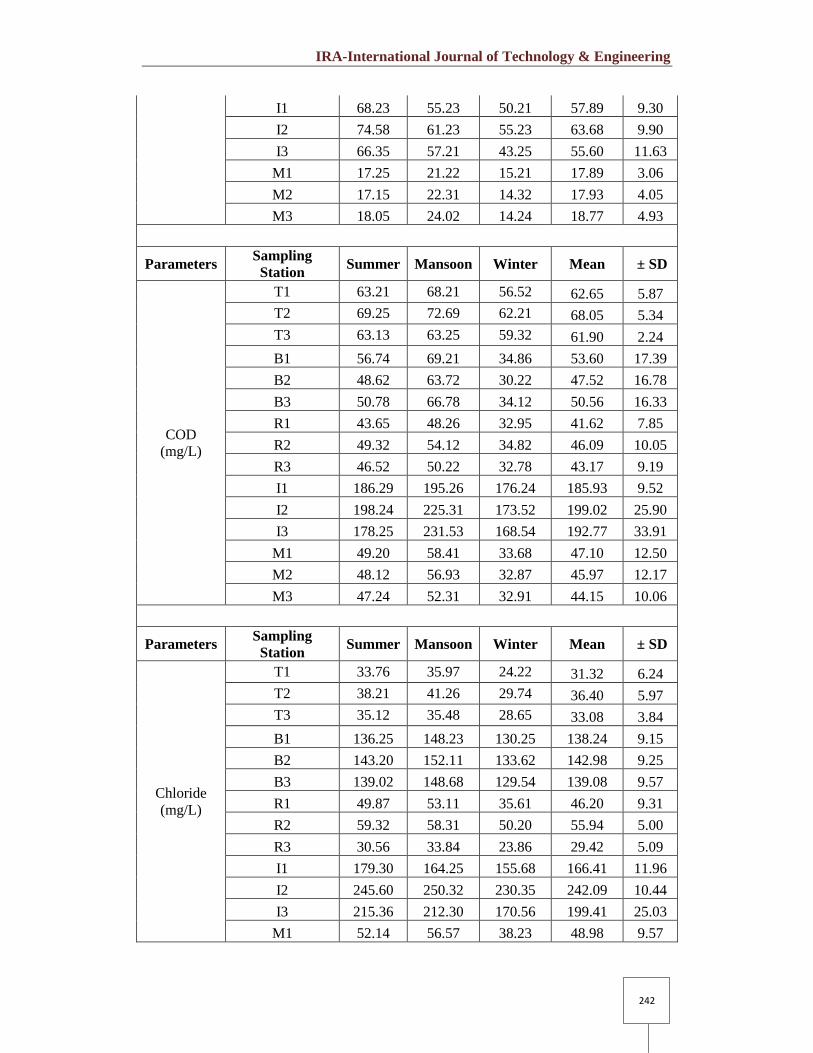
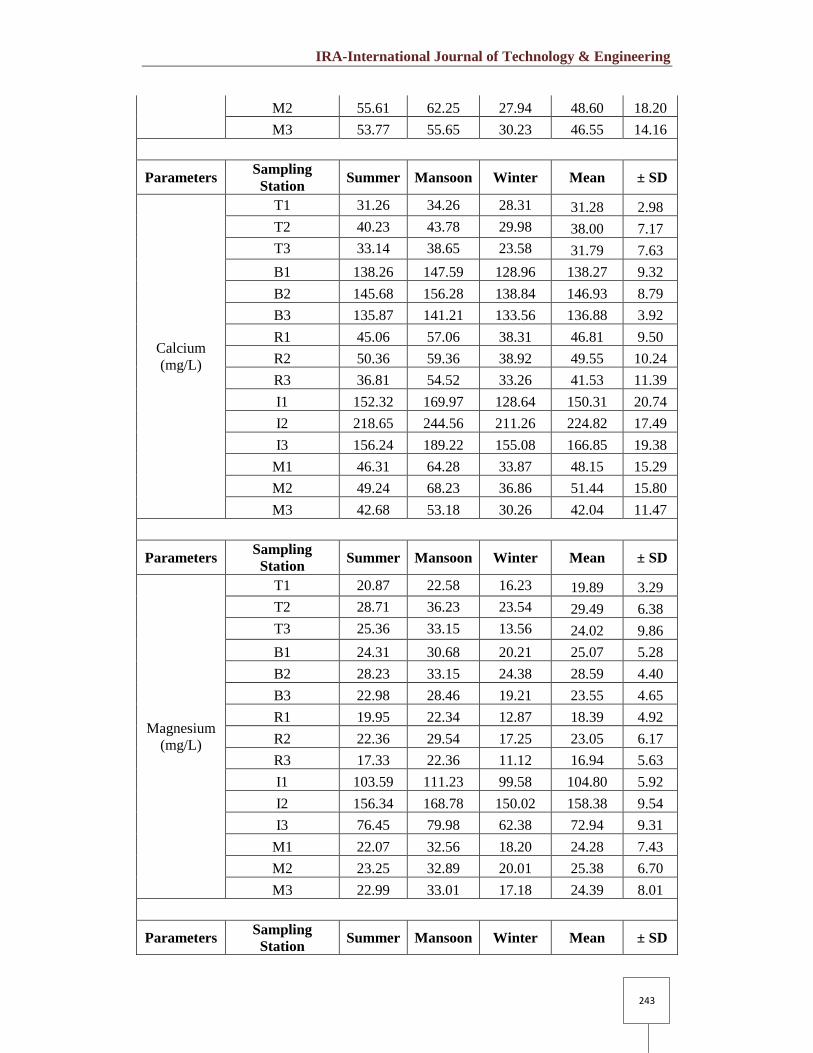
2.1 Results –
Table 1 Observations of all sampling stations with their mean and ± standard
deviations –
Parameters Sampling
Station Summer Mansoon Winter Mean ± SD
Temperature
°c
T1 40.60 26.30 15.50 27.47 12.59
T2 38.60 35.20 16.50 30.10 11.90
T3 44.50 25.30 10.50 26.77 17.05
B1 32.50 25.40 12.30 23.40 10.25
B2 38.70 23.40 10.50 24.20 14.12
B3 42.30 22.60 7.80 24.23 17.31
R1 34.20 26.50 12.30 24.33 11.11
R2 35.20 24.60 8.70 22.83 13.34
R3 33.21 25.30 11.50 23.34 10.99
I1 41.30 28.20 18.30 29.27 11.54
I2 42.60 28.90 17.60 29.70 12.52
I3 43.50 30.20 20.50 31.40 11.55
M1 33.90 26.40 12.30 24.20 10.97
M2 42.30 24.60 11.20 26.03 15.60
M3 40.30 25.40 10.10 25.27 15.10
IRA-International Journal of Technology & Engineering
239
Parameters Sampling
Station Summer Mansoon Winter Mean ± SD
pH
T1 7.80 7.60 7.50 7.63 0.15
T2 8.10 8.25 7.95 8.10 0.15
T3 7.85 8.23 7.86 7.98 0.22
B1 7.80 8.10 7.70 7.87 0.21
B2 8.60 8.40 7.80 8.27 0.42
B3 7.80 7.90 7.80 7.83 0.06
R1 7.90 8.60 7.40 7.97 0.60
R2 7.50 8.20 7.85 7.85 0.35
R3 7.60 7.80 7.42 7.61 0.19
I1 5..82 7.80 5.90 6.85 1.34
I2 5.91 7.20 5.50 6.20 0.89
I3 5.23 7.30 5.20 5.91 1.20
M1 7.80 8.78 7.56 8.05 0.65
M2 7.90 8.23 7.55 7.89 0.34
M3 7.40 8.45 7.21 7.69 0.67
Parameters Sampling
Station Summer Mansoon Winter Mean ± SD
Turbidity
NTU
T1 38.52 42.50 28.20 36.41 7.38
T2 73.30 79.50 48.30 67.03 16.52
T3 48.30 58.20 39.40 48.63 9.40
B1 44.80 52.30 41.20 46.10 5.66
B2 78.90 84.30 70.30 77.83 7.06
B3 70.50 75.20 59.00 68.23 8.33
R1 35.32 42.86 29.66 35.95 6.62
R2 54.20 63.75 38.22 52.06 12.90
R3 48.70 52.36 44.91 48.66 3.73
I1 158.30 168.50 134.90 153.90 17.23
I2 168.20 186.20 143.68 166.03 21.34
I3 133.60 143.20 128.65 135.15 7.40
M1 29.60 45.20 23.80 32.87 11.07
M2 24.80 41.90 19.78 28.83 11.60
M3 26.30 50.17 22.36 32.94 15.05
Parameters Sampling
Station Summer Mansoon Winter Mean ± SD
TDS (mg/L) T1 907.80 885.95 941.75 911.83 28.12
IRA-International Journal of Technology & Engineering
240
T2 1368.25 1380.25 1308.65 1352.38 38.35
T3 838.21 888.65 795.23 840.70 46.76
B1 762.10 523.60 541.30 609.00 132.88
B2 958.50 687.21 823.50 823.07 135.65
B3 660.20 500.26 387.20 515.89 137.17
R1 126.40 200.60 158.20 161.73 37.23
R2 173.50 210.45 162.80 182.25 25.00
R3 169.50 190.23 148.90 169.54 20.67
I1 1560.38 1385.20 1290.30 1411.96 137.01
I2 1495.65 1428.35 1228.50 1384.17 138.95
I3 1465.20 1298.31 1380.60 1381.37 83.45
M1 152.30 186.40 134.60 157.77 26.33
M2 176.20 198.50 141.20 171.97 28.88
M3 156.80 195.87 137.38 163.35 29.79
Parameters Sampling
Station Summer Mansoon Winter Mean ± SD
DO (mg/L)
T1 5.21 7.26 6.94 6.47 1.10
T2 5.62 7.98 6.48 6.69 1.19
T3 4.23 6.54 6.25 5.67 1.26
B1 4.89 5.87 5.00 5.25 0.54
B2 5.32 6.97 5.89 6.06 0.84
B3 6.32 6.78 5.65 6.25 0.57
R1 7.81 8.23 7.32 7.79 0.46
R2 7.09 8.21 7.65 7.65 0.56
R3 7.65 8.65 7.54 7.95 0.61
I1 4.96 5.98 3.45 4.80 1.27
I2 4.86 6.21 4.36 5.14 0.96
I3 4.76 6.54 4.68 5.33 1.05
M1 6.23 7.20 6.17 6.53 0.58
M2 6.21 7.50 6.47 6.73 0.68
M3 6.54 7.23 6.85 6.87 0.35
Parameters Sampling
Station Summer Mansoon Winter Mean ± SD
FREE CO2
(mg/L)
T1 2.02 1.01 1.08 1.37 0.56
T2 2.45 1.07 1.32 1.61 0.74
T3 1.86 1.03 1.01 1.30 0.49
B1 2.36 1.87 1.35 1.86 0.51
B2 3.05 2.56 1.62 2.41 0.73
IRA-International Journal of Technology & Engineering
241
B3 2.87 2.35 1.21 2.14 0.85
R1 3.96 2.56 1.03 2.52 1.47
R2 4.35 2.06 1.05 2.49 1.69
R3 3.23 1.06 1.01 1.77 1.27
I1 4.05 3.45 3.10 3.53 0.48
I2 3.07 3.12 3.78 3.32 0.40
I3 2.02 1.78 2.48 2.09 0.36
M1 3.05 2.26 2.12 2.48 0.50
M2 4.08 1.89 1.09 2.35 1.55
M3 3.53 2.05 1.02 2.20 1.26
Parameters Sampling
Station Summer Mansoon Winter Mean ± SD
Hardness
(mg/L)
T1 328.56 318.42 309.21 318.73 9.68
T2 381.65 354.23 321.86 352.58 29.93
T3 342.65 335.21 321.56 333.14 10.70
B1 362.25 328.89 318.87 336.67 22.71
B2 374.25 384.21 355.25 371.24 14.71
B3 348.36 334.24 333.23 338.61 8.46
R1 218.34 233.62 334.25 262.07 62.97
R2 226.17 246.58 179.52 217.42 34.37
R3 225.87 235.82 204.26 221.98 16.13
I1 658.95 700.23 666.54 675.24 21.97
I2 470.36 475.78 453.21 466.45 11.78
I3 432.25 452.38 368.86 417.83 43.59
M1 226.31 244.56 200.23 223.70 22.28
M2 231.59 252.14 209.32 231.02 21.42
M3 228.41 251.64 206.54 228.86 22.55
Parameters Sampling
Station Summer Mansoon Winter Mean ± SD
BOD
(mg/L)
T1 44.51 44.51 35.21 41.41 5.37
T2 48.62 51.25 36.89 45.59 7.65
T3 40.65 47.26 28.36 38.76 9.59
B1 17.85 21.86 12.65 17.45 4.62
B2 19.61 28.21 15.23 21.02 6.60
B3 15.26 20.85 12.32 16.14 4.33
R1 12.32 16.86 10.36 13.18 3.33
R2 12.35 17.23 10.68 13.42 3.40
R3 11.69 14.52 9.32 11.84 2.60
IRA-International Journal of Technology & Engineering
242
I1 68.23 55.23 50.21 57.89 9.30
I2 74.58 61.23 55.23 63.68 9.90
I3 66.35 57.21 43.25 55.60 11.63
M1 17.25 21.22 15.21 17.89 3.06
M2 17.15 22.31 14.32 17.93 4.05
M3 18.05 24.02 14.24 18.77 4.93
Parameters Sampling
Station Summer Mansoon Winter Mean ± SD
COD
(mg/L)
T1 63.21 68.21 56.52 62.65 5.87
T2 69.25 72.69 62.21 68.05 5.34
T3 63.13 63.25 59.32 61.90 2.24
B1 56.74 69.21 34.86 53.60 17.39
B2 48.62 63.72 30.22 47.52 16.78
B3 50.78 66.78 34.12 50.56 16.33
R1 43.65 48.26 32.95 41.62 7.85
R2 49.32 54.12 34.82 46.09 10.05
R3 46.52 50.22 32.78 43.17 9.19
I1 186.29 195.26 176.24 185.93 9.52
I2 198.24 225.31 173.52 199.02 25.90
I3 178.25 231.53 168.54 192.77 33.91
M1 49.20 58.41 33.68 47.10 12.50
M2 48.12 56.93 32.87 45.97 12.17
M3 47.24 52.31 32.91 44.15 10.06
Parameters Sampling
Station Summer Mansoon Winter Mean ± SD
Chloride
(mg/L)
T1 33.76 35.97 24.22 31.32 6.24
T2 38.21 41.26 29.74 36.40 5.97
T3 35.12 35.48 28.65 33.08 3.84
B1 136.25 148.23 130.25 138.24 9.15
B2 143.20 152.11 133.62 142.98 9.25
B3 139.02 148.68 129.54 139.08 9.57
R1 49.87 53.11 35.61 46.20 9.31
R2 59.32 58.31 50.20 55.94 5.00
R3 30.56 33.84 23.86 29.42 5.09
I1 179.30 164.25 155.68 166.41 11.96
I2 245.60 250.32 230.35 242.09 10.44
I3 215.36 212.30 170.56 199.41 25.03
M1 52.14 56.57 38.23 48.98 9.57
IRA-International Journal of Technology & Engineering
243
M2 55.61 62.25 27.94 48.60 18.20
M3 53.77 55.65 30.23 46.55 14.16
Parameters Sampling
Station Summer Mansoon Winter Mean ± SD
Calcium
(mg/L)
T1 31.26 34.26 28.31 31.28 2.98
T2 40.23 43.78 29.98 38.00 7.17
T3 33.14 38.65 23.58 31.79 7.63
B1 138.26 147.59 128.96 138.27 9.32
B2 145.68 156.28 138.84 146.93 8.79
B3 135.87 141.21 133.56 136.88 3.92
R1 45.06 57.06 38.31 46.81 9.50
R2 50.36 59.36 38.92 49.55 10.24
R3 36.81 54.52 33.26 41.53 11.39
I1 152.32 169.97 128.64 150.31 20.74
I2 218.65 244.56 211.26 224.82 17.49
I3 156.24 189.22 155.08 166.85 19.38
M1 46.31 64.28 33.87 48.15 15.29
M2 49.24 68.23 36.86 51.44 15.80
M3 42.68 53.18 30.26 42.04 11.47
Parameters Sampling
Station Summer Mansoon Winter Mean ± SD
Magnesium
(mg/L)
T1 20.87 22.58 16.23 19.89 3.29
T2 28.71 36.23 23.54 29.49 6.38
T3 25.36 33.15 13.56 24.02 9.86
B1 24.31 30.68 20.21 25.07 5.28
B2 28.23 33.15 24.38 28.59 4.40
B3 22.98 28.46 19.21 23.55 4.65
R1 19.95 22.34 12.87 18.39 4.92
R2 22.36 29.54 17.25 23.05 6.17
R3 17.33 22.36 11.12 16.94 5.63
I1 103.59 111.23 99.58 104.80 5.92
I2 156.34 168.78 150.02 158.38 9.54
I3 76.45 79.98 62.38 72.94 9.31
M1 22.07 32.56 18.20 24.28 7.43
M2 23.25 32.89 20.01 25.38 6.70
M3 22.99 33.01 17.18 24.39 8.01
Parameters Sampling
Station Summer Mansoon Winter Mean ± SD
IRA-International Journal of Technology & Engineering
244
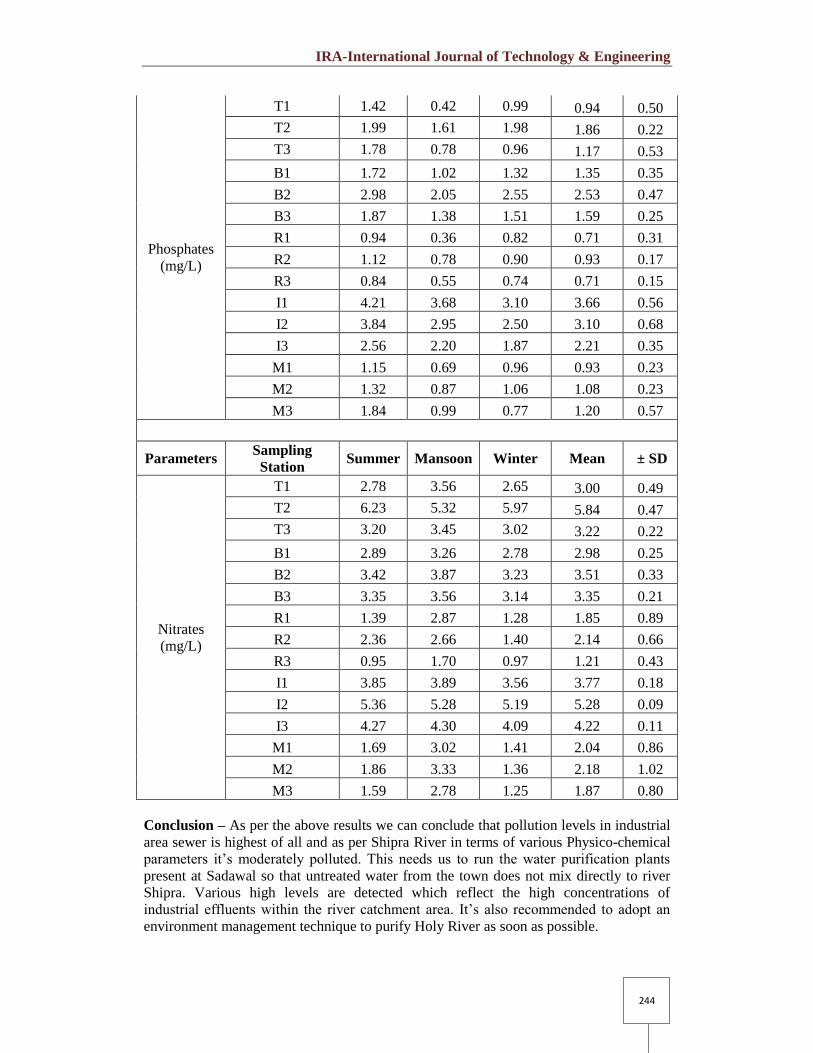
Phosphates
(mg/L)
T1 1.42 0.42 0.99 0.94 0.50
T2 1.99 1.61 1.98 1.86 0.22
T3 1.78 0.78 0.96 1.17 0.53
B1 1.72 1.02 1.32 1.35 0.35
B2 2.98 2.05 2.55 2.53 0.47
B3 1.87 1.38 1.51 1.59 0.25
R1 0.94 0.36 0.82 0.71 0.31
R2 1.12 0.78 0.90 0.93 0.17
R3 0.84 0.55 0.74 0.71 0.15
I1 4.21 3.68 3.10 3.66 0.56
I2 3.84 2.95 2.50 3.10 0.68
I3 2.56 2.20 1.87 2.21 0.35
M1 1.15 0.69 0.96 0.93 0.23
M2 1.32 0.87 1.06 1.08 0.23
M3 1.84 0.99 0.77 1.20 0.57
Parameters Sampling
Station Summer Mansoon Winter Mean ± SD
Nitrates
(mg/L)
T1 2.78 3.56 2.65 3.00 0.49
T2 6.23 5.32 5.97 5.84 0.47
T3 3.20 3.45 3.02 3.22 0.22
B1 2.89 3.26 2.78 2.98 0.25
B2 3.42 3.87 3.23 3.51 0.33
B3 3.35 3.56 3.14 3.35 0.21
R1 1.39 2.87 1.28 1.85 0.89
R2 2.36 2.66 1.40 2.14 0.66
R3 0.95 1.70 0.97 1.21 0.43
I1 3.85 3.89 3.56 3.77 0.18
I2 5.36 5.28 5.19 5.28 0.09
I3 4.27 4.30 4.09 4.22 0.11
M1 1.69 3.02 1.41 2.04 0.86
M2 1.86 3.33 1.36 2.18 1.02
M3 1.59 2.78 1.25 1.87 0.80
Conclusion – As per the above results we can conclude that pollution levels in industrial
area sewer is highest of all and as per Shipra River in terms of various Physico-chemical
parameters it‟s moderately polluted. This needs us to run the water purification plants
present at Sadawal so that untreated water from the town does not mix directly to river
Shipra. Various high levels are detected which reflect the high concentrations of
industrial effluents within the river catchment area. It‟s also recommended to adopt an
environment management technique to purify Holy River as soon as possible.
IRA-International Journal of Technology & Engineering
245
Reference: 1. Dalal P. 2015. Impact of Water Quality on Crop Production in Ujjain District. African
Journal of Agricultural Sciences and Technology. 3(9), 392-397
2. Dalal P. 2013. Watershed Modeling by Soil Erosion system. Novus International
Journal of Biotechnology and Bioscience. 2(2) 26-29
3. Dalal P. 2013. Summer Water Crises of Ujjain City, Journal of Chemical, Biological
and Physical Sciences 3(4) 2882-2884
4. Dalal P. 2013. Removal of Arsenic from Sand Filtration. International Journal of
Advance Research 1(5) 379-380
5. Dalal P. 2013. Physico-Chemical characteristics of ground water near holy river Shipra.
International Journal of Plant Animal and Environmental Sciences. 3(3) 14-19
6. Dalal P. 2013. Drinking Water Quality of Ujjain District. International Journal of Plant
Animal and Environmental Sciences 3(2) 14-19
7. Dalal P. 2010. Water Quality Index of Gambhir Dam, Our Earth 6(1), 8-13.
8. Dalal P. 2010 Studies on Physico-Chemical parameters and development of an
environment management module for purification of Holy river Shipra in Ujjain.
Journal on Indian Water Works Association 42 (3) 186-194
9. Dalal P. 2009. Shipra river conservation by sewage treatment. Pollution Research
Journal Enviromedia 28(4)
10. Dalal P. 2008. Development of an Environment Management module for purification
of holy river Shipra. Asian Journal of chemical and Environmental research 1(4): 59-64
11. APHA (1998): Standard methods for the examination of water and waste water 20th ed.
Washington D.C. APHA-AWWA-WPCF pp.1875.
12. Bermejo, M.F., Alvarez, D.A. and Sandino, De. C. (1981): Water quality of the Sar and
Sarela rivers (Spain). Acta. Quin. Anal. Fae. Quim. Compostelana, 5:16.
13. Bhadra, B., Chakroborty, R., Das, S. and Nanda, A.K. (2005): Investigation of some
basic water quality parameters of the North Bangal Terai river Shiprajani-a tributary of
river Torsa and comparison thereof with the main stream. J. Environ. Biol. 26(2): 277 –
286.
14. Bharti, Pawan K.; Tyagi, P. K. and Singh, V. (2014): Assessment of heavy metals in
the water of Sahastradhara hill stream at Dehradun, India. International Journal of
Environment. 3(3): 164-172.
15. Bhaskaran, T. R. Chakroaborty, R. N. and Trivedi, R. C. (1983): Studies on the river
pollution: Pollution on purification of Gomti River near Lucknow, Journal of the
Institution of Engineers. India, 45 (6): 39 – 50.
16. Bhutiani, R., and Khanna, D. R. (2007): Ecological study of river Suswa: Modeling DO
and BOD. Environmental Monitoring and Assessment, 125: 183-195
17. Canter, L.W. (1996): Environmental impact assessment, mathematical ecological
modeling. McGraw Hill Publishers. NewYork, pp-680.
18. Chandra, R., Bahadur, Y. and Sharma, B.K. (1996): Monitoring the quality of river
Ramgana water at Berely. Poll. Res., 15 (1): 33-35.
19. Chavan, T.P. and Wagh, S.B. (2005): Physico-chemical characteristics of industrial
effluent near Sukhna river at Mide area. Chikalthana, Aurangabad, J. of Industrial
Pollution Control, 21 (1): 23-26.
20. David, A. (1956): Studies on the pollution of Bhadra river fisheries al Bhadravathi,
Mysure state with industries effluents. Proceedings of the National Institute of Science
of India, 22 B (3), 132 – 160.
21. ECIL (2004): Methods Manual, Atomic Absorption Spectrophotometer, AAS 4129,
Electronic Corporation of India Limited, Hyderabad-500062, pp: 85.
22. Goltermann, H.L., Sly, R.G. and Thomas, R.C. (1983): Study of the relationship
between water quality and sediments. Pub. Unesco. 541
IRA-International Journal of Technology & Engineering
246
23. Guillard, R. R. L. (1963): Symp. Marine Micro Biol. (C.H. Oppenh Eimered.) Thomas,
spring field. I, II 87.
24. Hammer, M. J. (1977): Water and waste – water technology. John, Wiley and Sons,
Inc, Newyork. 503.
25. Khadse, G. K., Patni, P. M., Kelker, P. S. and Devetta, S., (2008): Qualitative
evaluation of Kanhan river and its tributaries flowing over central Indian Plateau,
Environmental Monitoring and Assessment, 147: 83-92.
26. Laiman and Dixit, A. M. (1989): Change in water quality by industrial water disposal,
Ind. J. Env. Health, 31:73.
27. Lakshminarayana and R. K. Someshekar (2001). Ecology of polluted water edited by
Arvind Kunar Vol. I, Chapter II,. APH Pub. Corp. New Delhi. 51-60.
28. Malik, D. S. and Bharti, P.K. (2005): Primary production efficiency of Sahastradhara
hill-stream, Dehradun, Env. Cons. J. 6 (3): 117-121.
29. Manivasakam, N. (1980): Physico-chemical examination of water, sewage and
industrial effluents, Pragati Prakashan, Meerut India. 245.
30. Mitchell, A. W., and Furnas, M. J. (2001): River logger-A new total to monitor riverine
suspended particle fluxes, Water Science and Technology, 43(9): 115-120.
31. Motwani, M.P., Banerjee, S. and Karam Chandani, S.J. (1956): Some observation on
the pollution of the river Sone by the factory effluents of the Rothas Industries at
Dalmya Nagar (Bihar). Ind. J. Fish. 3(2): 334-376.
32. Murthy, G.V.R., Mohan, S.V., Haris Chandra, P., and Karthikeyan, J. (1994): A
preliminary study on water quality of river Tunnyabhadra at Kurnool town. Indian J.
Prot., 14 (8): 604-607.
33. Nelson M. S., Roline R.A, Thullen J.S, Sartoris J.J., Boutwell J.E. (2000) Invertebrate
assemblage and trace element bioaccumulation associated with constructed wetland,
Wetlands 20:406-415.
34. Palharya, J.P., Siriah, V.K. and Malviya Shabha (1993): Environmental Impact of
sewage and effluent disposal on the river system. Ashish publishing House, 791.
35. Paythkin, K.D. and Yu. S. Krivoshein (1980): Microbiology (Trans: AK Senova and V.
Libovskaya). Mir Publishers, Moscow. 133-135.
36. Prasad, N.R., and Patil, J.M., (2008): A study of physico- chemical parameters of
Krisha river water particularly in western Maharastra. Rasayan. J. Chem. (4): 943-958.
37. Sastry, C. A., Khare, G. K. and Rao, A.V. (1972): Water Pollution problems in Madhya
Pradesh. Indian J. Env. Hlth. Vol. 4: 297-309.
38. Saxena, M.M. (1994): Environmental analysis: water, soil and air. Agro Botanical
Publishers, pp:180.
39. Sinha, A.K., Srivastava, R. K., Pandey, D.P. and Modak, D.P. (1989): Water quality
characteristics of Ganga river from Kare Manikpura to Phaphamau- A case study.
Indian J. Environ. Pro. 9: 845.
40. Syrett, P.S. (1962): In: Physiology and Biochemistry of Algae (R.A. Lewen ed.)
Acadamic Press. Newyork 320.
41. Tomar, P. (2011): Accumulation of heavy metals in water, sediment and biotic
community of river Shipra at Muzaffarnagar (U.P.), Thesis submitted to Gurukula
Kangri University, Haridwar, pp: 177.
42. Trivedi R.K and Goel P.K. (1984): Chemical and Biological methods for water
Pollution Studies, Karad, Environmental Publications, pp.1-251.
43. Verma, S. R., Sharma, P., Tyagi, A., Rani, S., Gupta, A. K. and Delela, R.C. (1984):
Pollution and Saprobic status of eastern Shipranadi, Limnologica (Barlin), 15 (1): 69 –
133.
44. Yeragi, S. G. and Shaikh, N. (2003) Studies on primary productivity of Tansa river. J.
Natcon 15(1): 125-130.


