
In Collaboration With
Pepe Lopez, Luis Girado, & Orlando Diaz Everglades Research and Education Center
Sediment and Particulate Control BMPs
September 29, 2016

Introduction
BMP Photos – Participant’s Thoughts Objectives
Implementation
Economics
Project Graphs Particulate Phosphorus
SFWMD EAA Basin Data

Dissolved
Sediment
100% Phosphorus
40 %
60 %
Soluble P:
Particulate P:
Fertilizer/Soil
Soil & Detritius
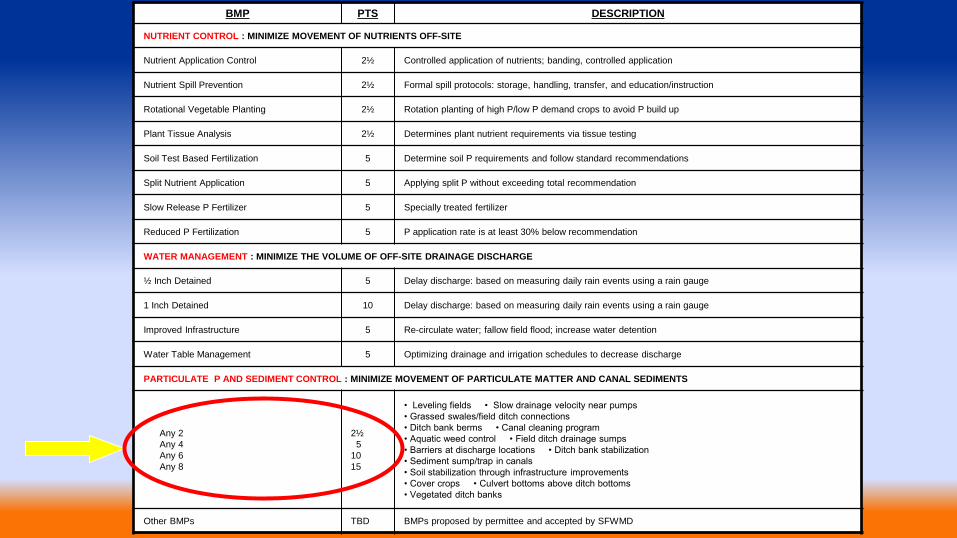
BMP PTS DESCRIPTION
NUTRIENT CONTROL : MINIMIZE MOVEMENT OF NUTRIENTS OFF-SITE
Nutrient Application Control 2½ Controlled application of nutrients; banding, controlled application
Nutrient Spill Prevention 2½ Formal spill protocols: storage, handling, transfer, and education/instruction
Rotational Vegetable Planting 2½ Rotation planting of high P/low P demand crops to avoid P build up
Plant Tissue Analysis 2½ Determines plant nutrient requirements via tissue testing
Soil Test Based Fertilization 5 Determine soil P requirements and follow standard recommendations
Split Nutrient Application 5 Applying split P without exceeding total recommendation
Slow Release P Fertilizer 5 Specially treated fertilizer
Reduced P Fertilization 5 P application rate is at least 30% below recommendation
WATER MANAGEMENT : MINIMIZE THE VOLUME OF OFF-SITE DRAINAGE DISCHARGE
½ Inch Detained 5 Delay discharge: based on measuring daily rain events using a rain gauge
1 Inch Detained 10 Delay discharge: based on measuring daily rain events using a rain gauge
Improved Infrastructure 5 Re-circulate water; fallow field flood; increase water detention
Water Table Management 5 Optimizing drainage and irrigation schedules to decrease discharge
PARTICULATE P AND SEDIMENT CONTROL : MINIMIZE MOVEMENT OF PARTICULATE MATTER AND CANAL SEDIMENTS
Any 2
Any 4
Any 6
Any 8
2½
5
10
15
• Leveling fields • Slow drainage velocity near pumps
• Grassed swales/field ditch connections
• Ditch bank berms • Canal cleaning program
• Aquatic weed control • Field ditch drainage sumps
• Barriers at discharge locations • Ditch bank stabilization
• Sediment sump/trap in canals
• Soil stabilization through infrastructure improvements
• Cover crops • Culvert bottoms above ditch bottoms
• Vegetated ditch banks
Other BMPs TBD BMPs proposed by permittee and accepted by SFWMD
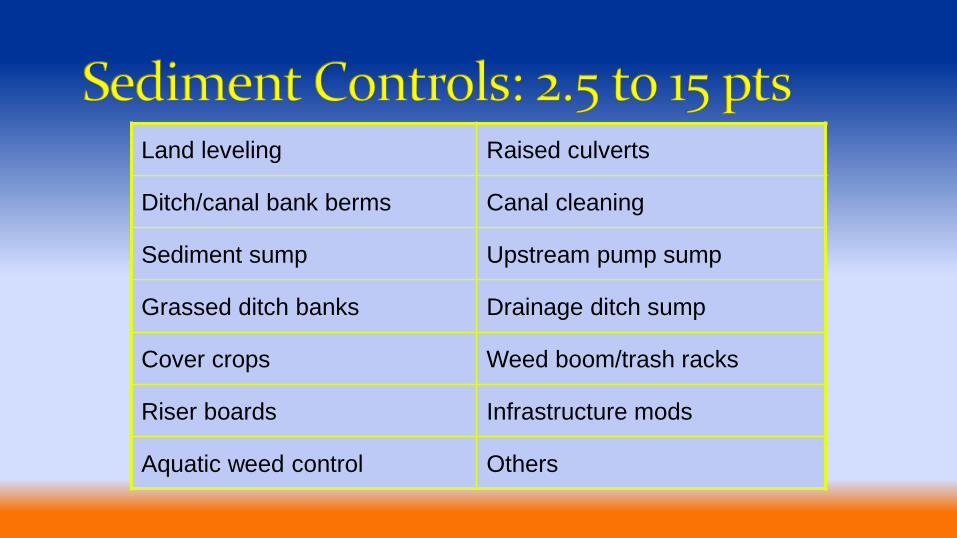
Land leveling Raised culverts
Ditch/canal bank berms Canal cleaning
Sediment sump Upstream pump sump
Grassed ditch banks Drainage ditch sump
Cover crops Weed boom/trash racks
Riser boards Infrastructure mods
Aquatic weed control Others

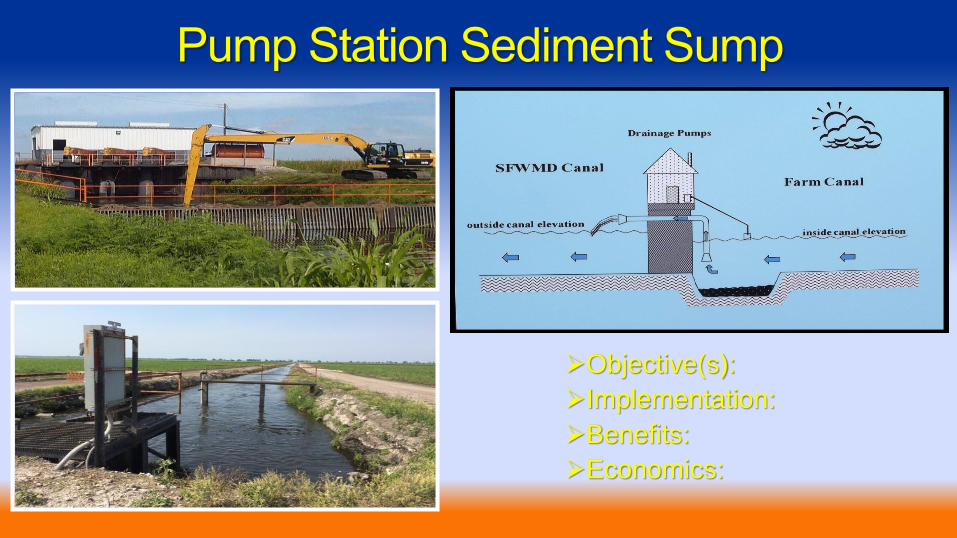
Objective(s):
Implementation:
Benefits:
Economics:

Objective(s):
Implementation:
Benefits:
Economics:
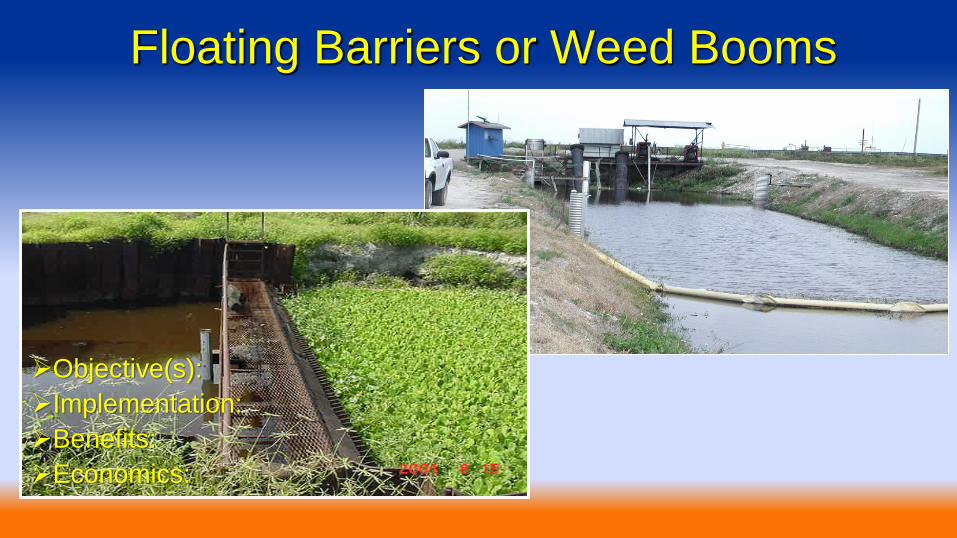
Floating Barriers or Weed Booms
Objective(s):
Implementation:
Benefits:
Economics:

Objective(s):
Implementation:
Benefits:
Economics:

Objective(s):
Implementation:
Benefits:
Economics:
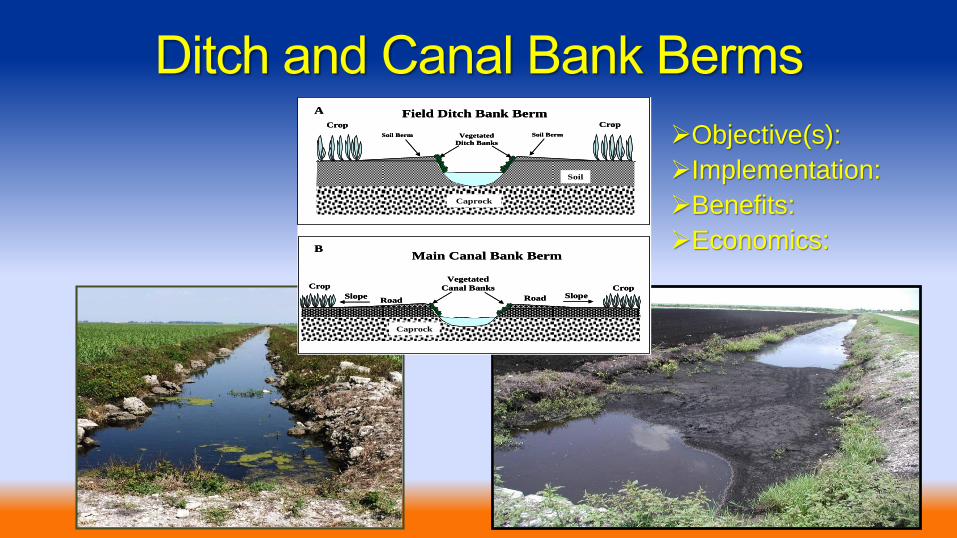
Main Canal Bank Berm
SlopeRoad Road
Crop Crop
Slope
Vegetated
Canal Banks
Caprock
BMain Canal Bank Berm
SlopeRoad Road
Crop Crop
Slope
Vegetated
Canal Banks
Caprock
B
Field Ditch Bank Berm
Vegetated
Ditch Banks
Caprock
Crop Crop
Soil
A
Soil Berm Soil Berm
Field Ditch Bank Berm
Vegetated
Ditch Banks
Caprock
Crop Crop
Soil
A
Soil Berm Soil Berm Objective(s):
Implementation:
Benefits:
Economics:
Objective(s):
Implementation:
Benefits:
Economics:

Objective(s):
Implementation:
Benefits:
Economics:
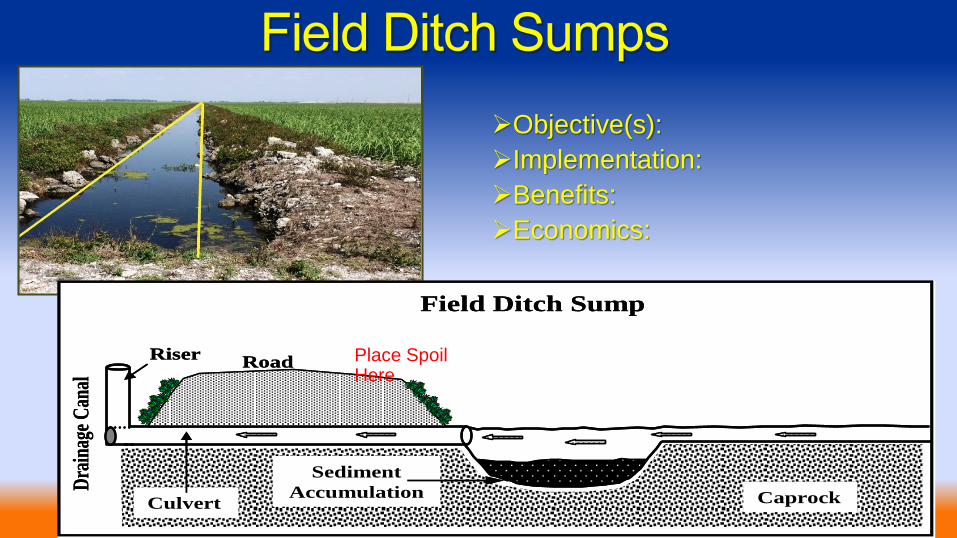
RoadRiser
Field Ditch Sump
Dra
inag
e C
anal
Culvert Caprock
Sediment
Accumulation
RoadRiser
Field Ditch Sump
Dra
inag
e C
anal
Culvert Caprock
Sediment
Accumulation
Place Spoil Here
Objective(s):
Implementation:
Benefits:
Economics:

Objective(s):
Implementation:
Benefits:
Economics:

Objective(s):
Implementation:
Benefits:
Economics:

Canal Cleaning Program:
Where to Place the Sediment?
Better
Bad
Best

Event UF9200A-276 Year 2000
Particulate Phosphorus and Velocity
0.0
0.1
0.2
0.3
0.4
0.5
0.6
0.7
0.8
0.9
1.0
276.0 277.0 278.0 279.0 280.0 281.0 282.0
Decimal Date
PP
Co
nce
ntr
atio
n (
mg
/l)
0.00
0.05
0.10
0.15
0.20
0.25
0.30
0.35
0.40
0.45
0.50
Vel
oci
ty (
m/s
)
PP
Velocity
Start-Up Flush
Pump
Cycling
Cumulative High
Velocity
Re-Start
Flush
Re-Start
Flush
Spike

Water Year % Reduction
WY2011 79%
WY2012 71%
WY2013 41%
WY2014 63%
WY2015 79%
WY2016 27%
0
20
40
60
80
100
120
140
160
May Jun Jul Aug Sep Oct Nov Dec Jan Feb Mar Apr
[P]
(pp
)
EAA Monthly FWM TP
WY2013 - 141 ppbWY2014 - 94 ppbWY2015 - 47 ppbWY2016 - 151 ppb
0
2
4
6
8
10
12
14
May Jun Jul Aug Sep Oct Nov Dec Jan Feb Mar Apr
Rai
n (
inch
es)
EAA Rainfall MonthlyWY2013 - 54 InchesWY2014 - 53 InchesWY2015 - 44 InchesWY2016 - 50 inches

Water Year % Reduction
WY2011 79%
WY2012 71%
WY2013 41%
WY2014 63%
WY2015 79%
WY2016 27%
-20,000
-10,000
0
10,000
20,000
30,000
40,000
50,000
60,000
70,000
May Jun Jul Aug Sep Oct Nov Dec Jan Feb Mar Apr
P L
oad
(K
gs)
EAA Monthly P LoadWY2013 - 154 MTWY2014 - 105 MTWY2015 - 39 MTWY2016 - 151 MT
THANK YOU!
Questions?


