1
Seismic Attributes Mapping and 3D Static Modeling of Reservoirs within
“OYA” Field, Offshore Depobelt, Niger Delta Sedimentary Basin, Nigeria.
Olugbenga A. Ehinola1 and Olayinka Y. Ayodeji
2
1Department of Geology, University of Ibadan, Ibadan, Nigeria.
Email: [email protected]
2 Department of Geology, University of Ibadan, Ibadan, Nigeria.
Email: [email protected]
Abstract
An integrated 3D seismic data, checkshot data and suite of well logs for nine wells in “OYA”
field, Offshore, Niger Delta were analyzed for reservoir characterization, 3D static modeling and
volumetric analysis. This study is majorly in two folds: the first focuses on the application of 3D
static model by incorporating all the geologic characteristics within subsurface volume that are
relatively stable over long periods of time for optimization and development of hydrocarbon
potentials in “OYA” field while the use of seismic attributes to map and identify new prospects
that can be possibly explored in the same field. Geological structural and property models (net to
gross, porosity, permeability, and water saturation) were distributed stochastically within the
constructed 3D grid using the method of Sequential Gaussian Simulation algorithms. Depth
structural maps and seismic attribute maps generated shows the trapping mechanisms to be a
fault assisted anticlinal closure and four way closures while new hydrocarbon prospects were
delineated respectively. The result (output) of the 3D static model was used to carry out
volumetric analysis which divided the three reservoirs (Sand 1, 2 and 3) into two zones; the first
zone [sand 1- sand 2(surface depths)] with a STOIIP of 4.93344*106 Stock tank barrel of
recoverable oil while the second zone [sand 2-sand 3 (surface depths)] have a STOIIP value of
500369*106 Stock tank barrel of recoverable oil. This research work has demonstrated how new
hydrocarbon prospects can be further explored in the field. 3D static geologic models and
volumetric analysis of evaluated reservoirs in the already drilled wells shows evidence of good
hydrocarbon yield in the field of study.

2
1. Introduction
In the exploration and production business, which is the petroleum exploration industry is cost
intensive and required detailed risk and economic evaluation of prospective areas to promote
adequate investment. Companies carry out a series of risk and economic analysis to determine
the viability of a prospect because geologic concepts are uncertain with respect to structure,
reservoir, seal, and hydrocarbons. In other words by far the largest component of geophysical
spending is driven by the need to characterize (potential) reservoirs. The simple reason is that
better reservoir characterization means higher success rates and fewer wells for reservoir
exploitation (Nancy et al., 2018).
Reservoir characterization includes determination of reservoir limits, structure, volume and
reservoir properties such as porosity, permeability, net pay thickness, and heterogeneity (Mavko
et al 1998). Reservoir characterization as defined by Chopra & Michelena (2011) is the entire
germane and valuable information requisite for the effective description of a reservoir.
Seismic attributes have come a long way since their introduction in the early 1970s and have
become an integral part of seismic interpretation projects, for example, amplitude, average
reflection strength and spectral decomposition are useful tools for locating reservoir quality,
outlining their geometry and possibly displaying lateral changes in thickness (Rotimi et
al.,2010).
Hydrocarbon resources remain very vital to the economy of many nations of the world. Niger
Delta province of Nigeria has large commercial accumulation of hydrocarbon. The production of
oil and gas is from the accumulation in the pore spaces of reservoir rocks usually sandstone,
limestone or dolomite (Adeoti et al., 2014). In Niger Delta, petroleum is majorly produced from
the sandstone reservoirs which are the unconsolidated sands of Agbada Formation.
Subsurface studies (integrated reservoir characterization) carried out during this research
typically incorporates all the available well data integrated with 3D seismic data so as to
establish a 3D static geological model and volumes of hydrocarbon in the reservoirs established.
Meanwhile seismic attributes were used extensively to identify new hydrocarbon prospects in the
seismic volume.
2. Geology of the Study Area

3
OYA field is located within the offshore area of Niger delta in Nigeria (Figure 1).The Tertiary
Niger Delta covers an area of approximately 75,000sq km and consists of a regressive clastic
succession, which attains a maximum thickness of 12,000m (Ariere, 2012). The Niger delta is
located in the Gulf of Guinea, Central West Africa, at the culmination of the Benue Trough and
is considered one of the most prolific hydrocarbon provinces in the world (Odumodu, 2011).
Lithostratigraphy (geologic Formations) of the Tertiary Niger Delta is sub-divided into three
major units namely: Akata, Agbada and Benin Formations, with depositional environments
ranging from marine, transitional and continental settings respectively. The Akata Formation is
the basal sedimentary unit of the delta, it consists of uniform dark grey over-pressured marine
shales with sandy turbidites and channel fills and age ranges from Late Eocene to Recent (Ariere,
2012). The Agbada Formation is characterized by paralic to marine-coastal and fluvial-marine
deposits mainly composed of sandstone and shale organized into coarsening upward off-lap
cycles (Odumodu, 2011).
Onshore and in some coastal regions, the Benin Formation overlies the Agbada Formation. The
Benin Formation consists of Late Eocene to Recent deposits of alluvial and upper coastal plain
deposits that are up to 2000m (6600ft) thick (Chinazo et al., 2017).

4
Figure 1 Location of the study area and the base map showing the seismic lines and wells
(Modified after Cohen and McClay, 1996)

5
3. Materials and Methods
Delineation of lithologies
Sonic & Neutron)
Synthetic
Seismogram (seismic
to well tie)
Data Availability, QC and Import (well logs,
check shot, 3D seismic data)
Well log interpretation 3-D Seismic Fault Interpretation
Well Log Correlation (GR, Res, Density
Sonic & Neutron) Horizon & Structural mapping
(depth structural maps, structural
framework)
Seismic Attribute Analysis
Root Mean Square, Maximum
Amplitude and Extract Value
Attributes were used to delineate
new prospects
Identification of HC and non- HC zones
Petrophysical Evaluation (GST, NST,
NTG,Vsh, K, ф, OWC, GOC, GDT)
Volumetric Analysis (reserve estimation)
3D static model (Structural and
Property models)

6
Figure 2: Workflow adopted to characterize ‘OYA’ Field, Niger Delta.
3.1. Data Acquisition: The data set used for this research were provided by Chevron Nigeria Ltd
through the Department of Petroleum Resources (DPR). The data provided include; 3D Post
stack seismic data and well log data. The logs provided are; Gamma ray, deep resistivity, sonic,
neutron porosity and density logs of selected wells. Ten wells were drilled in “OYA” field and
are labeled OYA-01, 02, 03, 04, 05, 06, 07, 08, 09 and 10. Figure 1 above shows the base map of
“OYA” Field.
3.2. Data Processing and Interpretation: well and seismic dataset were uploaded in Petrel
2014 software and used to generate curves. Gamma ray curve was in track 1, resistivity curve in
track 2, neutron curve in track 3 and density in track 4. The datasets were used for stratigraphic
correlation, seismic interpretation, geo-modeling and volumetric analysis. Interactive
Petrophysics software was used extensively for petrophysical interpretation of the well logs.
3.2.1. Petrophysical Interpretation and Evaluation: detailed petrophysical interpretation was
conducted for the OYA wells namely OYA 02, 03, 05, 08 and 09. The interpretation of the logs
in general was performed using a deterministic approach and generated output curves and values
for shale volume, net to gross, effective porosity, effective water saturation and permeability
amongst several other parameters being derived (Adeoti et al., 2014).
The following equations represent the methods adopted for evaluating the geological
Formation as related to petrophysics.
3.2.1.1 Gamma ray index (IGR)
IGR
………………………………………………………………………..……1
Where, IGR = the gamma ray index, GRlog = the gamma ray reading of formation from log,
GRmin = the minimum gamma ray (clean sand), GRmax = the maximum gamma ray (shale)
Well log correlation was carried with the aid of Petrel 2014 software by picking shale markers to
delineate between reservoir rocks and non-reservoir rocks with the aid gamma ray and resistivity

7
logs. Shale volume was determined from gamma ray log. Porosity and hydrocarbon type were
estimated using the available porosity logs (Density and Neutron). The effective porosity was
calculated from the total porosity corrected for shale fraction.
3.2.1.2 Formation Factor (f); this was achieved using the Achie’s equation
……………………………………………………………………………….2
Where, фD= density derived porosity, ℓma= matrix density (2.65gm/cm3 for sandstone), ℓb =
formation bulk density, ℓfl= fluid density (1.1gm/cm3 for water, 0.74 gm/cm
3 for gas and 0.9
gm/cm3 for oil).
3.2.1.3 Water saturation was estimated using Achie’s (1942) model:
………………………………………………………………………………3
Where, F=Formation factor, a = tortuosity factor = 0.62, Ø = porosity, m = cementation factor
……………………………………………………………………………..4
………………………………………………………………………………...5
……………………………………………………………………………....6
Where, = the water saturation = uninvaded zone, =resistivity of formation at 100% water
saturation, = true formation resistivity, F=formation factor
3.2.1.4 Irreducible water saturation: this is the water held in the pore spaces by capillary
forces. In this study, it was determined from the equation of Asquith and Gibson (1982).
………………………………………………………………………………7
Where = irreducible water saturation. F= formation factor
3.2.1.5 Permeability:
2
2

8
It is the ability of a rock to transmit fluid and is related to porosity but it is not always dependent
on it. It is controlled by the size of the connecting passages (pore throats or capillaries) between
pores. It is measured in Darcies or Millidarcies. The permeability of each reservoir was
determined from the equation by Asquith and Krygowski, 2004.
…………………………………………………………………………………………………………………..8
Where = irreducible water saturation.
Baker (1992) classified porosity values as follows (guide to porosity calculation): ф < 0.05 =
Negligible, 0.05< ф <0.1 = Poor, 0.1 ф< 0.15 = Fair, 0.15 < ф < 0.25 = Good, 0.25 < ф <0.30 =
Very good ф> 0.30 = Excellent. Baker, 1992 classified permeability based on the following
threshold: poor to fair =1.0 to 14 md, moderate = 15 to 49 md, good = 50 to 249 md, very good =
250 to 1000md, >1 darcy = excellent.
3.2.2 Seismic Interpretation
3.2.2.1 Fault Interpretation and Well Tie to Seismic: the structures identified during the cause
of fault mapping are majorly growth fault with rollover anticlines which is typical of the
structures found in the Niger delta basin. These growth faults mapped are found to have
associated synthetic and antithetic faults which are listric in nature. Major and minor faults were
identified and interpreted on the seismic sections (Figure 3). Well to seismic tie was carried out
using OYA-03 well data and checkshot survey data for OYA-03. The logs were corrected for
possible spikes (despiked) and subsequently convolved with butterworth wavelet to generate
synthetic seismogram, hence, tying the seismic to the wells was achieved. Synthetic match with
seismic was quite good in OYA-03 and enabled the seismic events to be picked for horizon
interpretation as represented in figure 4 and 5 below.

9
Figure 3. Fault mapped on Inline 10320 displayed on Relative acoustic impedance attribute
Figure 4. Calibration plate showing synthetic seismogram

10
Figure 5. Synthetic seismogram displayed on an interpretation window
3.2.2.2 Horizon Mapping: horizon interpretation was based on synthetic processes as shown in
the figure 5 above, with three horizon surfaces corresponding to the top and base of the
reservoirs being mapped as sand 1, sand 2 and sand 3 (reservoir tops) respectively. The horizon
surfaces were picked on both in-lines and cross-lines.
The key seismic amplitude reflections which corresponded to tops of main reservoir sands were
identified and interpreted on seismic volume as represented in the seismic interpretation section.
(Figure 6).
Sedimentary section can be subdivided into three distinct intervals based on general seismic
reflection character, regional studies and the uniformly blocky, low-value gamma-ray patterns,
some low to high amplitude, parallel and discontinuous reflection pattern, was observed (Adeoti
et al., 2014). Upper Agbada section with thick shale on the sandy sequence and lower Agbada
formation characterized by thick shale, parallel and high amplitude followed by sand shale
intercalation, (Adeoti et al., 2014). Although, a chaotic and low amplitude re-flections
interpreted as the Akata formation was also observed as defined by Adeoti et al., 2014.

11
3.2.2.3 Time-Depth Conversion: time-depth function (Figure 7) was used to convert time
structural maps into depth structural maps in order to know the geologic structures that houses
hydrocarbon in the subsurface.
3.2.2.4 Seismic Attribute: seismic attributes such as Root Mean Square, Maximum Amplitude
and Extract Value attributes were generated in the seismic volume across Sand 1, Sand 2 and
Sand 3 respectively with the aim of identifying sweet and bright spots as indicated with areas
with very high amplitude coinciding with structural closures.
3.2.3. Static Geological Model:
It was necessary to build a static geological model of the reservoirs established in the field so as
to understand the subsurface architecture better which will also optimize production performance
of the wells. A 3D static geologic model is achieved by integrating all the available subsurface
data sets as inputs towards managing the reservoirs delineated in the well.
The static geological model of Sand 1, 2 and 3 for the entire “OYA” Field in the Agbada
Formation of the Niger delta was built by integrating relevant sub-surface data; 3D seismic
structural interpretation, porosity, permeability and water saturation from petrophysical analyses.
Petrel (2014) software was used in building the static model. The structural model (interpreted
faults and horizon surfaces) and property model (porosity, permeability, net to gross and water
saturation and) were used for the static modeling.
3.2.3.1 Structural Model of Sand 1, 2 and 3: depth converted seismic interpretation surfaces
and faults were used to build the structural model in OYA field. The following data set were
inputted into the Petrel 2014 workflow for constructing a geologic structural model: Sands 1, 2
and 3 depth surfaces, polygons and interpreted fault surfaces.
Fault modeling was the first step adopted in building the structural model with Petrel workflow
tools which is done by first defining the faults through the process of generating key pillars. The
next step adopted was pillar gridding which is simply a way of making a grid based on the
defined faults in the studied area. Pillar gridding resulted to a skeleton grid which defined
extensively all the faults and pillars created. Layering was the final step adopted in creating the
structural model of the field by inserting the interpreted horizon surfaces into the 3D fault grid
which was attached to corresponding depth maps. The resultant output is a fault model which is

12
enhanced to make the final scale layering suitable for property models of the reservoirs in OYA
field.
3.2.3.2 Property Modeling: The property modeling entails filling the cells in the grid earlier
created with petrophysical properties. Property modeling in petrel is differentiated into separate
processes: geometrical, facies and petrophysical modeling. This research work used the
petrophysical modeling which involves simulation of porosity, permeability, net to gross and
water saturation in building the property models of the delineated reservoirs. Sequential
Guassian Simulation algorithm was used to build the model. The resultant static model was then
used for volumetric distribution of the field.
3.2.4. Reservoir Volumetric: it uses static geologic models to estimate the volume of
hydrocarbons in a reservoir.
………………………………………………………...9
Where, = net rock volume, = porosity, = oil saturation, = oil formation value
factor.
Figure 6 Faults (F36, F38 and F39) and Horizon surfaces on random seismic section
SAND 1
TOP SAND 2
12TOP SAND 3
F36
F38
F39

13
Figure 7 Time depth function
4. Results and Discussion
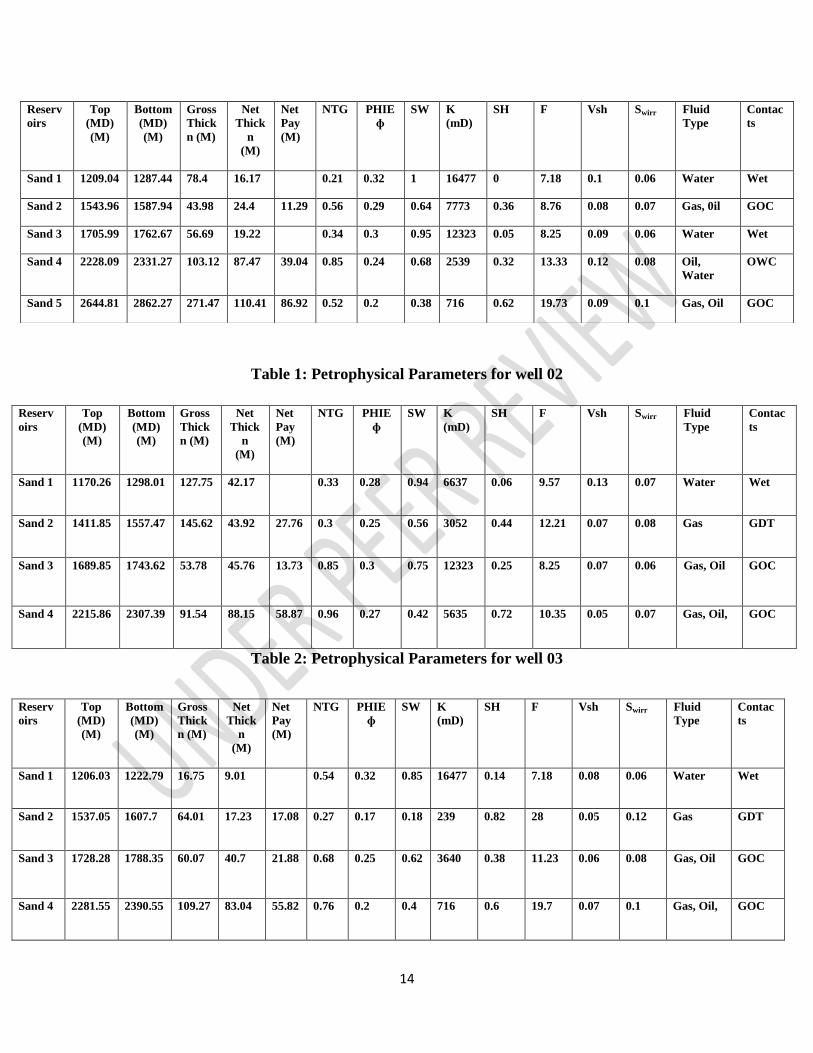
4.1. Results: Correlation of five well logs in OYA field is displayed in Figure 8. Petrophysical
evaluation of reservoirs in wells 02, 03, 05, 08 and 09 are represented in table 1, 2, 3, 4, and 5
respectively. The display of the top of sand 2 depth and time structural maps is shown in Figure
9. The RMS, Maximum amplitude and Extract value attribute maps for sand 2 is presented in
Figure 10. Figure 11 represent 3D fault interpretation of the field of study. Figure 12 shows the
3D component of the structural model of the reservoirs. The NTG (net to gross) and porosity
models are presented in Figure 13 while permeability and water saturation models are shown in
Figure 14. Results of volumetric obtained using the model based approach is shown in Table 6.
Figure 8; well correlations across the five evaluated wells
14
Table 1: Petrophysical Parameters for well 02
Reserv
oirs
Top
(MD)
(M)
Bottom
(MD)
(M)
Gross
Thick
n (M)
Net
Thick
n
(M)
Net
Pay
(M)
NTG PHIE
ɸ
SW K
(mD)
SH F Vsh Swirr Fluid
Type
Contac
ts
Sand 1 1170.26 1298.01 127.75 42.17 0.33 0.28 0.94 6637 0.06 9.57 0.13 0.07 Water Wet
Sand 2 1411.85 1557.47 145.62 43.92 27.76 0.3 0.25 0.56 3052 0.44 12.21 0.07 0.08 Gas GDT
Sand 3 1689.85 1743.62 53.78 45.76 13.73 0.85 0.3 0.75 12323 0.25 8.25 0.07 0.06 Gas, Oil GOC
Sand 4 2215.86 2307.39 91.54 88.15 58.87 0.96 0.27 0.42 5635 0.72 10.35 0.05 0.07 Gas, Oil, GOC
Table 2: Petrophysical Parameters for well 03
Reserv
oirs
Top
(MD)
(M)
Bottom
(MD)
(M)
Gross
Thick
n (M)
Net
Thick
n
(M)
Net
Pay
(M)
NTG PHIE
ɸ
SW K
(mD)
SH F Vsh Swirr Fluid
Type
Contac
ts
Sand 1 1206.03 1222.79 16.75 9.01 0.54 0.32 0.85 16477 0.14 7.18 0.08 0.06 Water Wet
Sand 2 1537.05 1607.7 64.01 17.23 17.08 0.27 0.17 0.18 239 0.82 28 0.05 0.12 Gas GDT
Sand 3 1728.28 1788.35 60.07 40.7 21.88 0.68 0.25 0.62 3640 0.38 11.23 0.06 0.08 Gas, Oil GOC
Sand 4 2281.55 2390.55 109.27 83.04 55.82 0.76 0.2 0.4 716 0.6 19.7 0.07 0.1 Gas, Oil, GOC
Reserv
oirs
Top
(MD)
(M)
Bottom
(MD)
(M)
Gross
Thick
n (M)
Net
Thick
n
(M)
Net
Pay
(M)
NTG PHIE
ɸ
SW K
(mD)
SH F Vsh Swirr Fluid
Type
Contac
ts
Sand 1 1209.04 1287.44 78.4 16.17 0.21 0.32 1 16477 0 7.18 0.1 0.06 Water Wet
Sand 2 1543.96 1587.94 43.98 24.4 11.29 0.56 0.29 0.64 7773 0.36 8.76 0.08 0.07 Gas, 0il GOC
Sand 3 1705.99 1762.67 56.69 19.22 0.34 0.3 0.95 12323 0.05 8.25 0.09 0.06 Water Wet
Sand 4 2228.09 2331.27 103.12 87.47 39.04 0.85 0.24 0.68 2539 0.32 13.33 0.12 0.08 Oil,
Water
OWC
Sand 5 2644.81 2862.27 271.47 110.41 86.92 0.52 0.2 0.38 716 0.62 19.73 0.09 0.1 Gas, Oil GOC
15
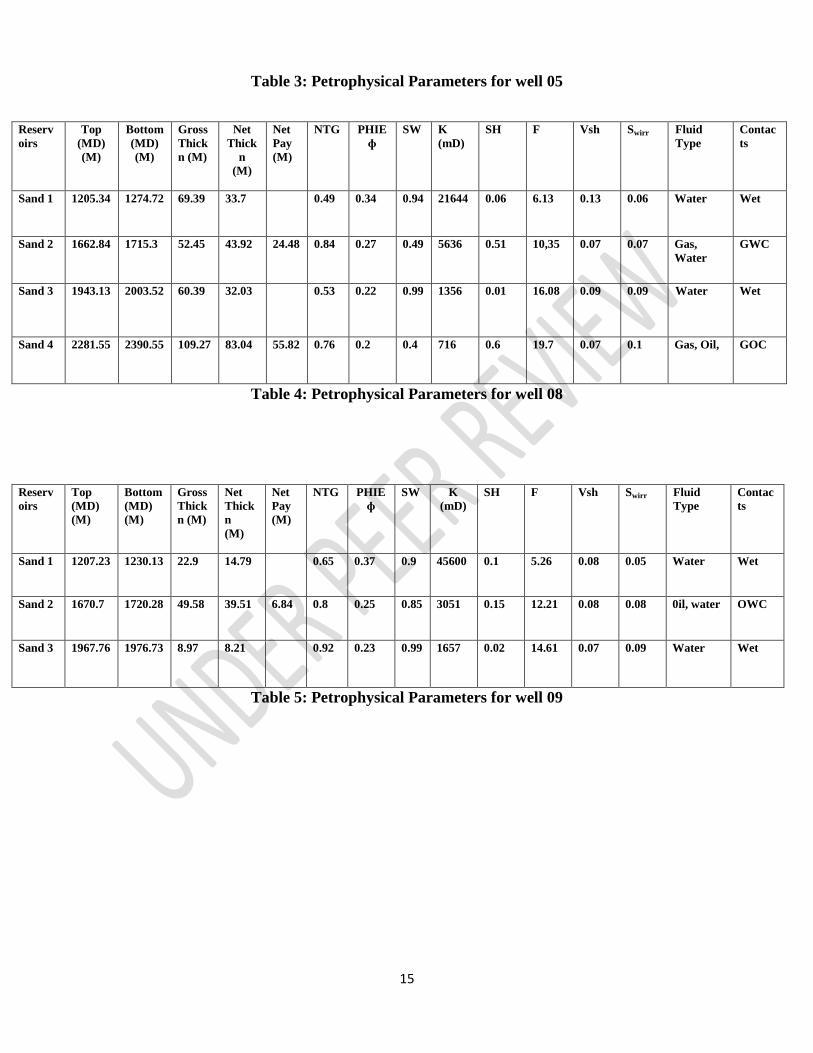
Table 3: Petrophysical Parameters for well 05
Reserv
oirs
Top
(MD)
(M)
Bottom
(MD)
(M)
Gross
Thick
n (M)
Net
Thick
n
(M)
Net
Pay
(M)
NTG PHIE
ɸ
SW K
(mD)
SH F Vsh Swirr Fluid
Type
Contac
ts
Sand 1 1205.34 1274.72 69.39 33.7 0.49 0.34 0.94 21644 0.06 6.13 0.13 0.06 Water Wet
Sand 2 1662.84 1715.3 52.45 43.92 24.48 0.84 0.27 0.49 5636 0.51 10,35 0.07 0.07 Gas,
Water
GWC
Sand 3 1943.13 2003.52 60.39 32.03 0.53 0.22 0.99 1356 0.01 16.08 0.09 0.09 Water Wet
Sand 4 2281.55 2390.55 109.27 83.04 55.82 0.76 0.2 0.4 716 0.6 19.7 0.07 0.1 Gas, Oil, GOC
Table 4: Petrophysical Parameters for well 08
Reserv
oirs
Top
(MD)
(M)
Bottom
(MD)
(M)
Gross
Thick
n (M)
Net
Thick
n
(M)
Net
Pay
(M)
NTG PHIE
ɸ
SW K
(mD)
SH F Vsh Swirr Fluid
Type
Contac
ts
Sand 1 1207.23 1230.13 22.9 14.79 0.65 0.37 0.9 45600 0.1 5.26 0.08 0.05 Water Wet
Sand 2 1670.7 1720.28 49.58 39.51 6.84 0.8 0.25 0.85 3051 0.15 12.21 0.08 0.08 0il, water OWC
Sand 3 1967.76 1976.73 8.97 8.21 0.92 0.23 0.99 1657 0.02 14.61 0.07 0.09 Water Wet
Table 5: Petrophysical Parameters for well 09

16
Figure 9. Top showing (a) time structural map, (b) depth structural map for Sand 2
A B
A
C
B

17
Figure 10. Top showing (a) RMS amplitude (b) Maximum amplitude and (c) Extract value
attribute maps for Sand 2 with wells in red point and yellow impact points as new
prospects
Figure 11 fault interpretation incorporated into the structural model.

18
Figure 12 top showing 3D view components of the structural model of the reservoirs
Figure 13 showing (a) NTG model and (b) Porosity model of the mapped surfaces
A B
19
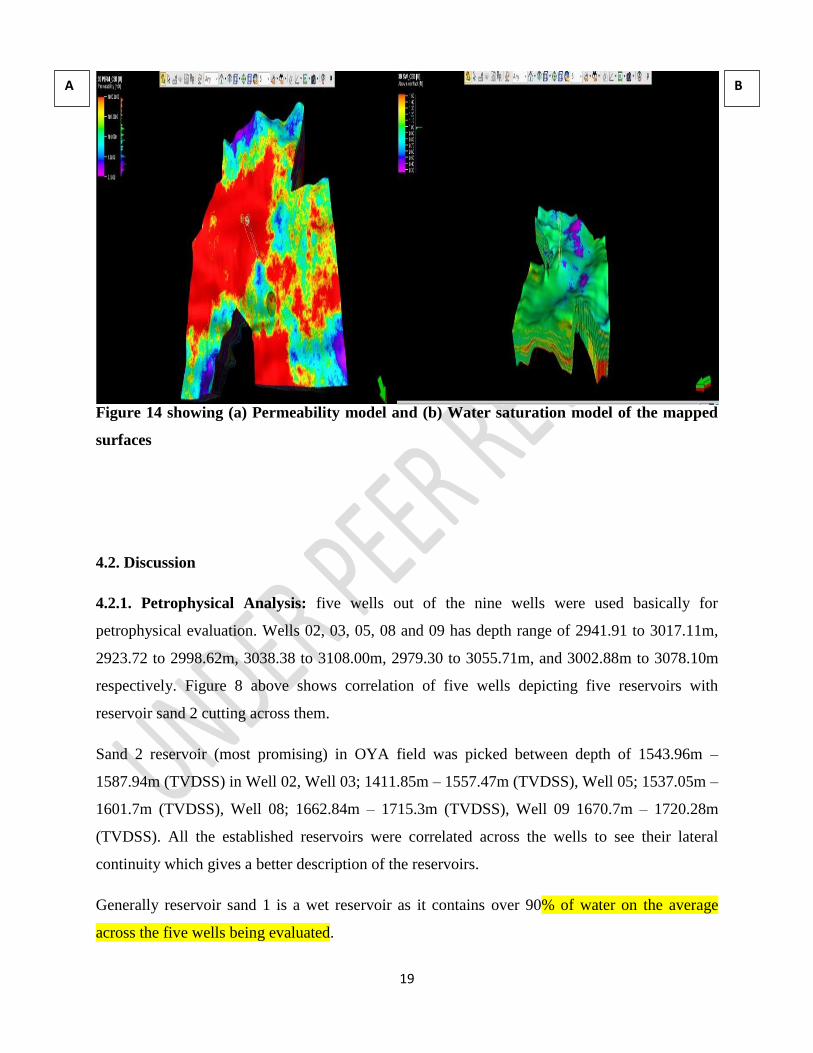
Figure 14 showing (a) Permeability model and (b) Water saturation model of the mapped
surfaces
4.2. Discussion
4.2.1. Petrophysical Analysis: five wells out of the nine wells were used basically for
petrophysical evaluation. Wells 02, 03, 05, 08 and 09 has depth range of 2941.91 to 3017.11m,
2923.72 to 2998.62m, 3038.38 to 3108.00m, 2979.30 to 3055.71m, and 3002.88m to 3078.10m
respectively. Figure 8 above shows correlation of five wells depicting five reservoirs with
reservoir sand 2 cutting across them.
Sand 2 reservoir (most promising) in OYA field was picked between depth of 1543.96m –
1587.94m (TVDSS) in Well 02, Well 03; 1411.85m – 1557.47m (TVDSS), Well 05; 1537.05m –
1601.7m (TVDSS), Well 08; 1662.84m – 1715.3m (TVDSS), Well 09 1670.7m – 1720.28m
(TVDSS). All the established reservoirs were correlated across the wells to see their lateral
continuity which gives a better description of the reservoirs.
Generally reservoir sand 1 is a wet reservoir as it contains over 90% of water on the average
across the five wells being evaluated.
A B

20
The reservoir sand 2 contain hydrocarbon saturation of 0.36, 0.44, 0.82, 0.51, 0.15, porosity
values; of 0.29, 0.25, 0.19, 0.27, and 0.25, water saturation of 0.64, 0.56, 0.18, 0.49, and 0.85 all
at wells; OYA-02, OYA-03, OYA-05, OYA-08 and OYA-09 respectively. In other words sand 2
have an average porosity of 0.25 across the five wells which are in accordance with Baker (1992)
classification of porosity; porosity value of 25% is represented as very good for a hydrocarbon
reservoir. The reservoir has an average hydrocarbon saturation of 45.6% and average water
saturation of 54.4% across the five wells. It is worthy to conclude that reservoir sand 2 is a very
good hydrocarbon reservoir.
Reservoir sand 3 has an average porosity of 0.26 across the five wells which are in accordance
with Baker (1992) classification of porosity; porosity value of 26% is represented as very good
for a hydrocarbon reservoir. The reservoir has an average hydrocarbon saturation of 14.2% and
average water saturation of 86% across the five wells.
4.2.2. Seismic Analysis: the structural framework (interpretations) were integrated to derive a
time structural map of reservoirs (sand 1, sand 2 and sand 3) in OYA field, after which time
depth function (Figure 7) was used to convert the time structural map to depth structural map.
The depth structural map (Figure 10) is the geologic subsurface interpretation of each horizon
surfaces which shows the various structural highs, lows and the binding faults. The structural
maps shows that the field is composed of rollover structures with multiple growth faults, fault
dependent hydrocarbon trapping mechanism and likewise some four way dip closures were
observed. The mapped growth faults serves as the structural trap that impede seepage of
hydrocarbon which is typical of the Niger delta petroleum system. These structures are proven to
contain hydrocarbon by using the depth structural maps to create polygon around the prospective
zone highlighted by the RMS amplitude, Maximum amplitude and Extract value attributes. The
attribute maps (Figure 10) were used to identify new prospective zones (figure 10) aside the
wells already drilled in the field. Petrel software was then used to calculate the area and
thickness was estimated from the well log, and porosity values also being calculated.
4.2.3. Static Modeling:
1) Structural model for the reservoirs: the structural model of the field shows the rollover
anticlinal growth fault; typical of the Niger delta which is responsible for hydrocarbon trapping

21
mechanism of the field. The three mapped horizon surfaces were seen to form anticlines. This
model further buttresses the information gathered from the depth structural maps.
2) Permeability Model: The model (figure 14) depicts good permeability values which ranges
from 100 mD to 1000 mD within zones in proximity to the wells in OYA field. The values are
reflective of good interconnectivity of pore spaces and transmisivity of the fluids in the reservoir
sands. In contrary, the region farther away from the well location in the southern part and some
parts in the south-west direction indicate poor to fair permeability which ranges from 1 mD to 20
mD. This support the methodology adopted by (Adeoti et al., 2014)
3) Porosity Model: The map shows evidence of excellent porosity distribution (0.30 - 0.50)
within locations around the wells in OYA field. This indicates the pore spaces having sufficient
space to accommodate fluid while the region farther away from the well locations in the northern
part and some parts in the south-west direction indicate porosity range from 0 – 0.1 which
indicate poor porosity.
3) Net to Gross Model: The Map shows good net to gross which falls between 0.6 and 1 within
the well locations of the OYA field while the region farther away from the well location is
indicative of low net to gross which is between 0 and 0.3.
4) Water Saturation Model: The map reveals that water saturation distribution within the well
locations of the OYA field varies from 0.6 to 1.00. This is indicative of more of water than
hydrocarbon. In general the reservoirs has higher fraction of water than hydrocarbon.
4.2.4. Reservoir Volumetric
Case Bulk Volume
[*10*6ft3]
Net Volume
[*10*6 RB]
Pore
Volume
[*10*6 RB]
HCPV oil
[*10*6 RB]
STOIIP (in
oil) [*10*6
STB]
STOIPP[*106
STB]
Recoverable oil[*10*6 STB]
Total 13348218 13348218 2464284 563713 563713 993713 9.937138*106
Sand1surface(depth1)-
Sand 2 surface (depth)
6924802 6924802 123360 493344 493344 493344 4.93344*106
Sand2surface(depth1)-
Sand3 surface (depth)
7023416 7023416 1250924 5000369 5000369 500369 5.00369*106

22
Table 6. Volumetric obtained after modeling.
Two zones of hydrocarbon accumulation have been identified from the volumetric analysis as
shown in the table 1 above. Total amount of recoverable oil from the two zones amount to
9.937138*105
STB
5.0 Conclusion
This research work help to understand the versatility of integrating 3D seismic reflection data
and well log data for reservoir characterization, attributes analysis and modeling. Static geologic
model generated aid in understanding the structural framework and property distribution of the
designated reservoirs in “OYA” field, Offshore Depobelt, Niger Delta Sedimentary Basin.
Results of petrophysical analysis shows that the reservoirs in the wells are of good porosity,
permeability and moderate net-to-gross. The accumulation and trapping of hydrocarbon in this
field is as a result of the rollover structures due to faulting. The trapping mechanisms include
fault assisted and four way closures. Seismic attributes maps also aid in identifying new
hydrocarbon prospects in the field, which can be subjected to further seismic analysis and
integrated with well logs in order to ascertain the volumes of hydrocarbons within these
prospects.
References
Adeoti lukumon, Njoku Onyekachi, Olawale Olatinsu, Julius Fatoba. Static Reservoir
Modeling Using Well Logs and 3-D Seismic Data in a KN Field, Offshore Niger Delta,
Nigeria. International Journal of Geosciences. 2014; Vol 5, pp 93-106.
Archie, G. E. The electrical resistivity log as an aid in determining some reservoir
Characteristics. Petroleum Technology. 1942; 5: 54-62.
Ariere Arodovwe Marvelous. Application of inorganic geochemical proxies to
provenance and paleo tectonic setting of fine grained sediments from well X, Niger delta
basin, Nigeria. Federal University of Petroleum Resources, Effurun. 2010.
Asquith and Gibson. Basic well log analysis for geologists, the American Association of
Petroleum Geologists. In: Adeoti lukumon, Njoku Onyekachi, Olawale Olatinsu, Julius
Fatoba. International Journal of Geosciences. 2014; Vol 5, pp 93-106.

23
Asquith, G. and Krygowski, D. Basic Well Log Analysis: AAPG Methods in Exploration
Series. 2004. In: Godwin O. E. International Journal of geosciences. 2016; Vol.7 No3.
Baker, H.I. Advanced Wireline and MWD Procedures Manual: B.H.I Technical
publications Group. 1992.
Chinazo F. Ejeke, Emmanuel E. Anakwuba, Indutimi T. Preye, Omagbemi G. Kakayor,
Ime E. Uyouko. Evaluation of reservoir compartmentalization and property trends using
static modeling and sequence stratigraphy. J. Petrol explor Prod Technol. 2017; 7:361-
377.
Chopra S, Michelena. R. J. Reservoir characterization. Society of Exploration
Geophysics. 2011; 30(1), 35 – 37.
Cohen HA, McClay K. Sedimentation and Shale tectonics of the north-western Niger
Delta front. Mar Pet Geol. 1996; 13:313–328.
Mavko G, Mukerji T, Dvorkin, J. The rock physics handbook, Cambridge University
Press. 1998; 329p.
Nancy O. Anene, Olugbenga A. Ehinola, Dorcas Eyinla. Subsurface mapping and
reservoir evaluation of Enena Field, Offshore, Niger Delta, IOSR Journal of Applied
Geology and Geophysics. 2018; (IOSR-JAGG) e-ISSN: 2321–0990, p-ISSN: 2321–
0982.Volume 6, Issue 1 Ver. II), PP 65-73.
Odumodu Chukwuemeka. Geothermal gradients and burial history modelling in parts of
the Eastern Niger delta, Nigeria. Published by the University of Nigeria. 2011.
Rotimi, O.J, Ameloko A.A, Adeoye, O.T. Applications of 3-D Structural Interpretation
and Seismic Attribute Analysis to Hydrocarbon Prospecting Over X – Field, Niger Delta.
International Journal of Basic & Applied Sciences IJBAS-IJENS. 2010; Vol: 10 No: 04,
pp28-40.


